FY2020 Results Presentation - listed company
20
FY2020 Results Presentation 23 February 2021
Transcript of FY2020 Results Presentation - listed company

FY2020 Results Presentation23 February 2021

DisclaimerThis presentation may contain forward-looking statements that involve assumptions, risks and uncertainties. Actual future performance, outcomes and results maydiffer materially from those expressed in forward-looking statements as a result of a number of risks, uncertainties and assumptions. Representative examples ofthese factors include (without limitation) general industry and economic conditions, interest rate trends, cost of capital and capital availability, competition from otherdevelopments or companies, shifts in expected levels of occupancy rate, property rental income, charge out collections, changes in operating expenses (includingemployee wages, benefits and training costs), governmental and public policy changes and the continued availability of financing in the amounts and the termsnecessary to support future business. You are cautioned not to place undue reliance on these forward-looking statements, which are based on the current view ofmanagement on future events.
The information contained in this presentation has not been independently verified. No representation or warranty expressed or implied is made as to, and noreliance should be placed on, the fairness, accuracy, completeness or correctness of the information or opinions contained in this presentation. Neither EC WorldAsset Management Pte. Ltd. (the “Manager”) nor any of its affiliates, advisers or representatives shall have any liability whatsoever (in negligence or otherwise) forany loss howsoever arising, whether directly or indirectly, from any use, reliance or distribution of this presentation or its contents or otherwise arising in connectionwith this presentation.
The forecast performance of EC World Real Estate Investment Trust (“EC World REIT”) is not indicative of the future or likely performance of EC World REIT. Theforecast financial performance of EC World REIT is not guaranteed.
The value of units in EC World REIT (“Units”) and the income derived from them may fall as well as rise. Units are not obligations of, deposits in, or guaranteed by,the Manager or any of its affiliates. An investment in Units is subject to investment risks, including the possible loss of the principal amount invested.
Investors should note that they will have no right to request the Manager to redeem or purchase their Units for so long as the Units are listed on the SingaporeExchange Securities Trading Limited (the “SGX-ST”). It is intended that unitholders of EC World REIT may only deal in their Units through trading on the SGX-ST.Listing of the Units on the SGX-ST does not guarantee a liquid market for the Units.
This presentation is for information only and does not constitute an invitation or offer to acquire, purchase or subscribe for Units.
1

Agenda
Section A FY2020 Key Highlights
Section B Financial Review
Section C Portfolio Update
2

2/18/2021 3
Section A: FY2020 Key Highlights

FY2020 Key Highlights
Prudence in Management
Stable Capital and Debt Structure All-in running interest rate for FY2020 of 4.3% Weighted Average Term of Debt Expiry of 1.6 years No major refinancing requirement in the short term
FY2020 Financials and Distributions 10.7% increase in gross revenue to S$109.7 million mainly due to contribution from Fuzhou E-
commerce which was acquired in August 2019 and organic rental escalations and appreciation of RMB vs SGD offset by one-off rental rebates provided to tenants in 1QFY20 in view of the COVID-19 situation
Continue on quarterly distribution. 4QDPU of 1.427 cents translate to trading yield of 7.5%¹
4
Proactive asset management Provided rental rebates to tenants within ECW’s portfolio to mitigate impact of COVID-19 situation
in April 2020 Secured renewal of major lease of 159,752 sqm at Hengde Logistics at competitive rate in
October 2020 Healthy Portfolio occupancy of 99.3% as at 31 December 2020 Weighted average lease to expiry of 3.4 years (by gross rental income) providing predictability in
returns
(1) Based on DPU of 5.359 Singapore cents and closing price of S$0.715 per unit as at 31 December 2020.
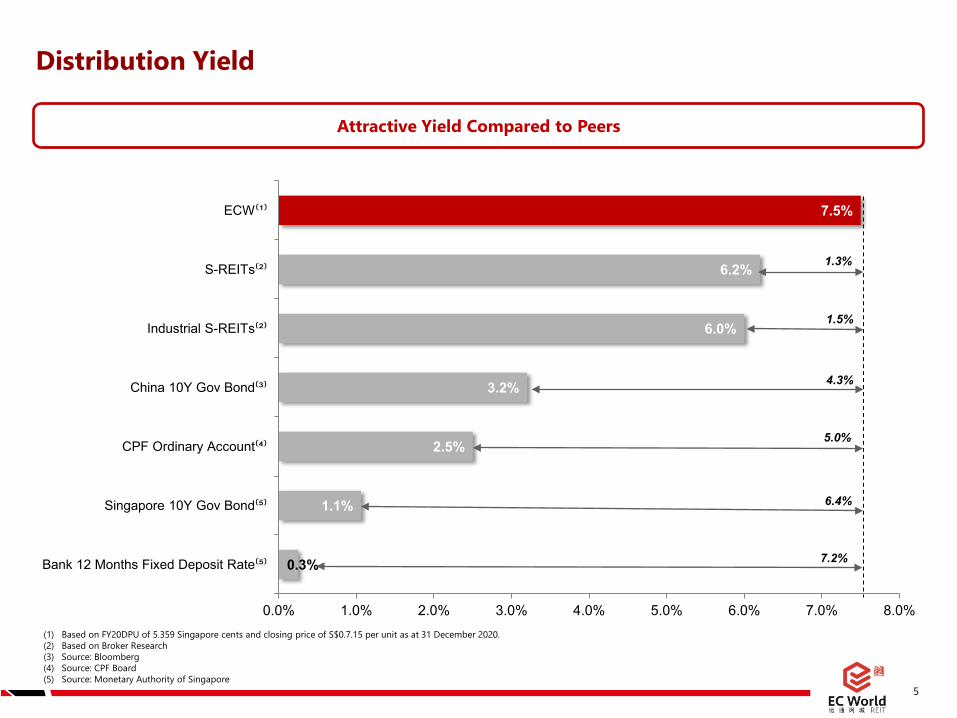
0.3%
1.1%
2.5%
3.2%
6.0%
6.2%
7.5%
0.0% 1.0% 2.0% 3.0% 4.0% 5.0% 6.0% 7.0% 8.0%
Bank 12 Months Fixed Deposit Rate⁽⁵⁾
Singapore 10Y Gov Bond⁽⁵⁾
CPF Ordinary Account⁽⁴⁾
China 10Y Gov Bond⁽³⁾
Industrial S-REITs⁽²⁾
S-REITs⁽²⁾
ECW⁽¹⁾
Distribution Yield
5
Attractive Yield Compared to Peers
(1) Based on FY20DPU of 5.359 Singapore cents and closing price of S$0.7.15 per unit as at 31 December 2020.(2) Based on Broker Research(3) Source: Bloomberg(4) Source: CPF Board(5) Source: Monetary Authority of Singapore
1.3%
1.5%
4.3%
5.0%
6.4%
7.2%
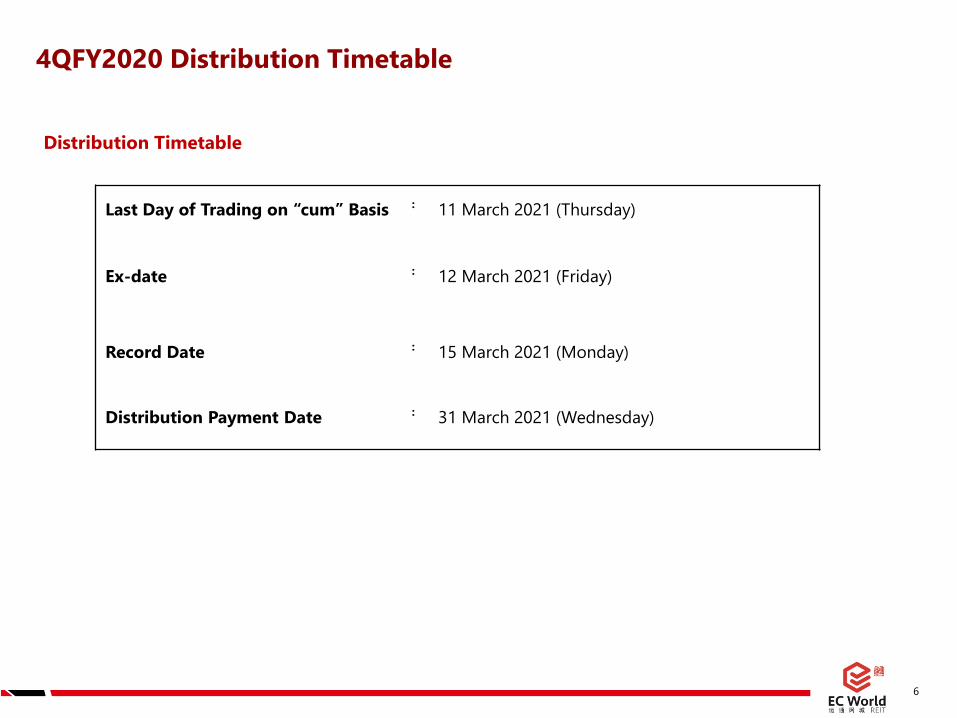
4QFY2020 Distribution Timetable
6
Last Day of Trading on “cum” Basis : 11 March 2021 (Thursday)
Ex-date : 12 March 2021 (Friday)
Record Date : 15 March 2021 (Monday)
Distribution Payment Date : 31 March 2021 (Wednesday)
Distribution Timetable
2/18/2021 7
Section B: Financial Review

4QFY2020 Summary Results Year on Year Comparison 4QFY2020 4QFY2019 Variance (%)
Gross revenue (S$’000) 29,532 25,862 14.2
Net property income (S$’000) 27,203 24,475 11.1
Finance Cost (S$’000) (9,851) (9,723) 1.3
Total amount available for distribution (S$’000) 12,783 12,741 0.3
Amount retained (S$’000)¹ 1,284 643 n.m.
Distribution to Unitholders (S$’000) 11,499 12,098 (5.0)
Applicable number of units for computation of DPU (million)
805.8 801.2 0.6
Distribution Amount Available per Unit ²(Singapore cents)
1.586 1.590 -0.1
Distribution per unit after retention(Singapore cents)
1.427 1.510 -5.5
8
• Gross revenue was S$3.7 million higher than4Q2019. NPI was S$2.7 million highercompared to 4Q2019.
• In RMB terms, the gross revenue and NPIwere 8.7% and 5.8% higher respectivelycompared to 4Q2019.
• After straight-line, security deposit accretionand other relevant distribution adjustments,the gross revenue and NPI in RMB termswere 7.8% and 3.1% higher respectivelycompared to 4Q2019, mainly due tocontribution from organic rental escalationsand appreciation of RMB against SGD.
• Distribution to Unitholders declined 5.0%mainly due to 10% retention of distributableincome in 4Q2020 as compared to 5% in4Q2019.
• On a like-for-like basis (without retention),total amount available for distribution wouldhave increased 0.3% year-on-year. DPUwould have declined marginally by 0.1%due to higher unit base.
(1) Retention of total amount available for distribution in in view of in view of uncertainties arising from prolonged coronavirus disease (“COVID-19”) pandemic globally and for general working capital purpose.
(2) On 100% distribution basis
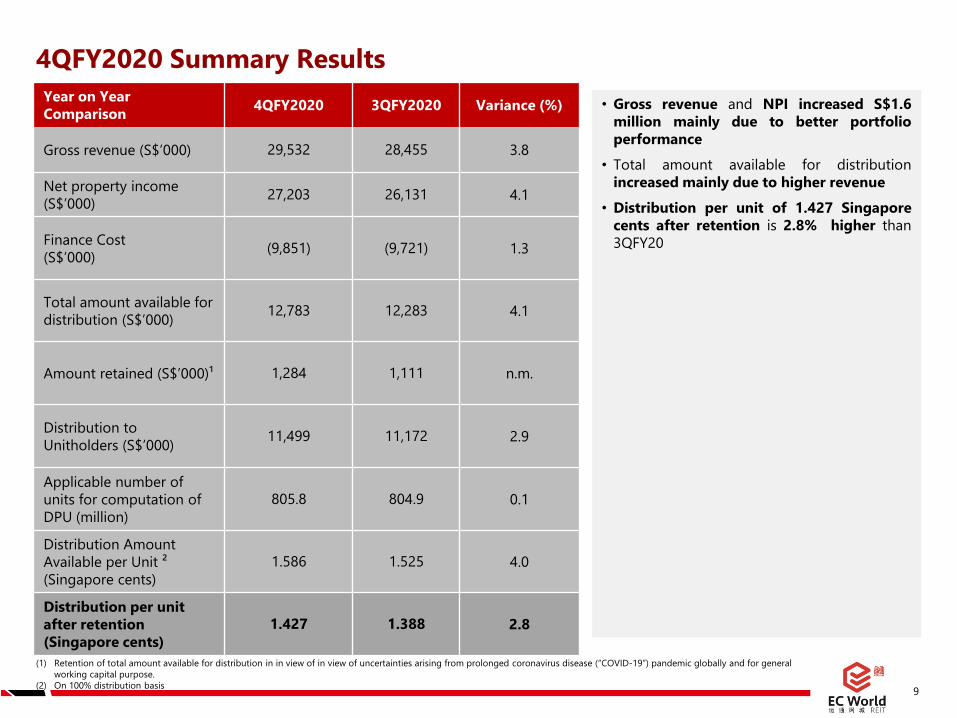
4QFY2020 Summary Results Year on Year Comparison 4QFY2020 3QFY2020 Variance (%)
Gross revenue (S$’000) 29,532 28,455 3.8
Net property income (S$’000) 27,203 26,131 4.1
Finance Cost (S$’000) (9,851) (9,721) 1.3
Total amount available for distribution (S$’000) 12,783 12,283 4.1
Amount retained (S$’000)¹ 1,284 1,111 n.m.
Distribution to Unitholders (S$’000) 11,499 11,172 2.9
Applicable number of units for computation of DPU (million)
805.8 804.9 0.1
Distribution Amount Available per Unit ²(Singapore cents)
1.586 1.525 4.0
Distribution per unit after retention(Singapore cents)
1.427 1.388 2.8
9
• Gross revenue and NPI increased S$1.6million mainly due to better portfolioperformance
• Total amount available for distributionincreased mainly due to higher revenue
• Distribution per unit of 1.427 Singaporecents after retention is 2.8% higher than3QFY20
(1) Retention of total amount available for distribution in in view of in view of uncertainties arising from prolonged coronavirus disease (“COVID-19”) pandemic globally and for general working capital purpose.
(2) On 100% distribution basis
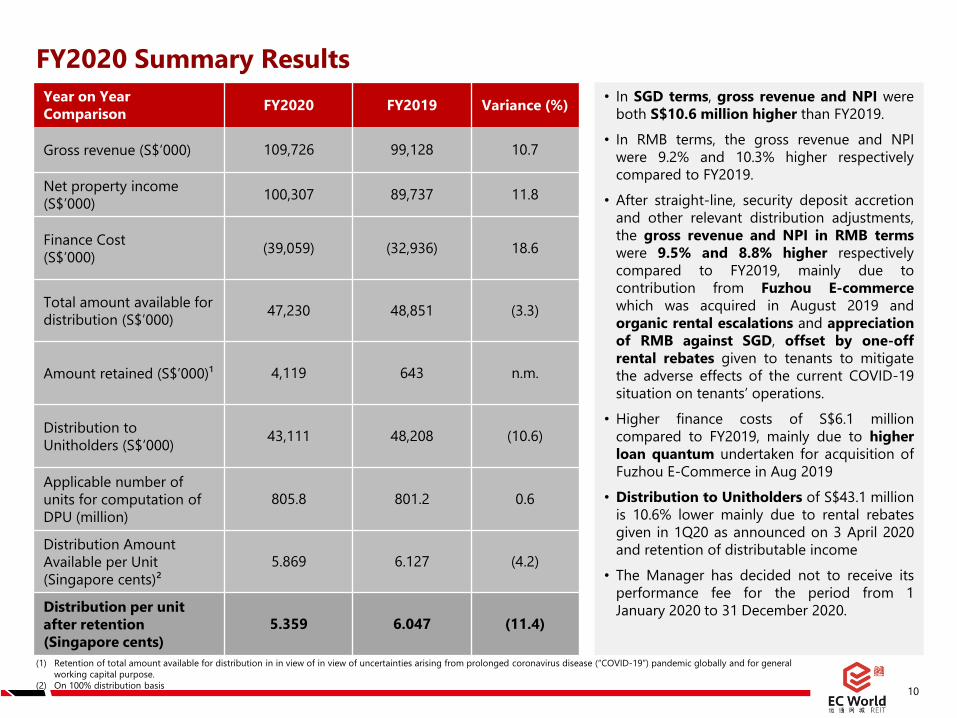
FY2020 Summary Results Year on Year Comparison FY2020 FY2019 Variance (%)
Gross revenue (S$’000) 109,726 99,128 10.7
Net property income (S$’000) 100,307 89,737 11.8
Finance Cost (S$’000) (39,059) (32,936) 18.6
Total amount available for distribution (S$’000) 47,230 48,851 (3.3)
Amount retained (S$’000)¹ 4,119 643 n.m.
Distribution to Unitholders (S$’000) 43,111 48,208 (10.6)
Applicable number of units for computation of DPU (million)
805.8 801.2 0.6
Distribution Amount Available per Unit(Singapore cents)²
5.869 6.127 (4.2)
Distribution per unit after retention(Singapore cents)
5.359 6.047 (11.4)
10
• In SGD terms, gross revenue and NPI wereboth S$10.6 million higher than FY2019.
• In RMB terms, the gross revenue and NPIwere 9.2% and 10.3% higher respectivelycompared to FY2019.
• After straight-line, security deposit accretionand other relevant distribution adjustments,the gross revenue and NPI in RMB termswere 9.5% and 8.8% higher respectivelycompared to FY2019, mainly due tocontribution from Fuzhou E-commercewhich was acquired in August 2019 andorganic rental escalations and appreciationof RMB against SGD, offset by one-offrental rebates given to tenants to mitigatethe adverse effects of the current COVID-19situation on tenants’ operations.
• Higher finance costs of S$6.1 millioncompared to FY2019, mainly due to higherloan quantum undertaken for acquisition ofFuzhou E-Commerce in Aug 2019
• Distribution to Unitholders of S$43.1 millionis 10.6% lower mainly due to rental rebatesgiven in 1Q20 as announced on 3 April 2020and retention of distributable income
• The Manager has decided not to receive itsperformance fee for the period from 1January 2020 to 31 December 2020.
(1) Retention of total amount available for distribution in in view of in view of uncertainties arising from prolonged coronavirus disease (“COVID-19”) pandemic globally and for general working capital purpose.
(2) On 100% distribution basis

Stable Balance Sheet
S$’000 As at 31 December 2020
As at 31 December 2019
Cash and cash equivalents(1) 151,692 119,469
Investment Properties 1,623,653 1,567,586
Total Assets 1,815,654 1,724,041
Borrowings 683,831 654,514
Total Liabilities 1,100,144 1,040,116
Net Assets attributable to Unitholders 715,510 683,925
NAV per unit (S$) 0.89 0.85
(1) Includes RMB194.7 million (S$39.4 million) cash security deposits received from the master leases and cash deposits of RMB484.4 million (S$98.0million) placed as collateral for standby letter of credit (“SBLC”) issuance.
11
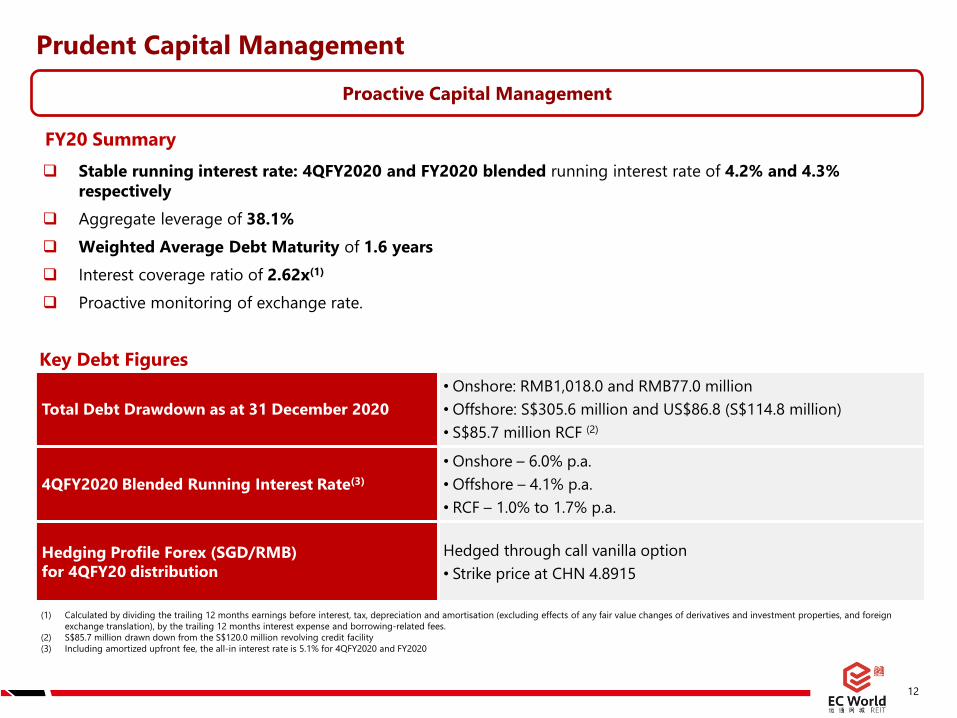
Prudent Capital Management
Total Debt Drawdown as at 31 December 2020• Onshore: RMB1,018.0 and RMB77.0 million• Offshore: S$305.6 million and US$86.8 (S$114.8 million)• S$85.7 million RCF (2)
4QFY2020 Blended Running Interest Rate(3)• Onshore – 6.0% p.a. • Offshore – 4.1% p.a.• RCF – 1.0% to 1.7% p.a.
Hedging Profile Forex (SGD/RMB) for 4QFY20 distribution
Hedged through call vanilla option• Strike price at CHN 4.8915
(1) Calculated by dividing the trailing 12 months earnings before interest, tax, depreciation and amortisation (excluding effects of any fair value changes of derivatives and investment properties, and foreign exchange translation), by the trailing 12 months interest expense and borrowing-related fees.
(2) S$85.7 million drawn down from the S$120.0 million revolving credit facility(3) Including amortized upfront fee, the all-in interest rate is 5.1% for 4QFY2020 and FY2020
Stable running interest rate: 4QFY2020 and FY2020 blended running interest rate of 4.2% and 4.3% respectively
Aggregate leverage of 38.1% Weighted Average Debt Maturity of 1.6 years Interest coverage ratio of 2.62x(1)
Proactive monitoring of exchange rate.
Key Debt Figures
FY20 Summary
Proactive Capital Management
12
1.54
11.
540
1.44
01.
504
1.46
91.
570
1.57
01.
570
1.50
11.
547
1.48
91.
510
1.15
8 1.38
61.
388
1.42
7
1Q17
2Q17
3Q17
4Q17
1Q18
2Q18
3Q18
4Q18
1Q19
2Q19
3Q19
4Q19
¹1Q
20¹
2Q20
¹3Q
20¹
4Q20
¹
12,0
2412
,010
11,2
8111
,802
11,5
6212
,384
12,4
1412
,441
11,9
2312
,314
11,8
7312
,098
9,29
8 11,1
4311
,051
11,4
99
1Q17
2Q17
3Q17
4Q17
1Q18
2Q18
3Q18
4Q18
1Q19
2Q19
3Q19
4Q19
1Q20
2Q20
3Q20
4Q20
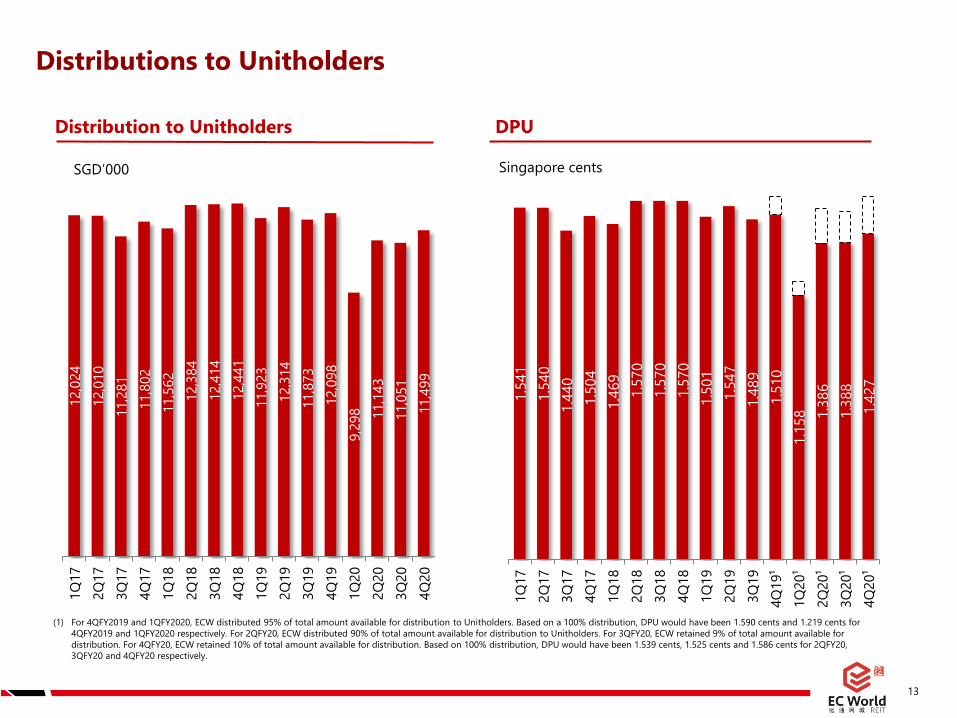
Distribution to Unitholders
Distributions to Unitholders
13
SGD’000
(1) For 4QFY2019 and 1QFY2020, ECW distributed 95% of total amount available for distribution to Unitholders. Based on a 100% distribution, DPU would have been 1.590 cents and 1.219 cents for 4QFY2019 and 1QFY2020 respectively. For 2QFY20, ECW distributed 90% of total amount available for distribution to Unitholders. For 3QFY20, ECW retained 9% of total amount available for distribution. For 4QFY20, ECW retained 10% of total amount available for distribution. Based on 100% distribution, DPU would have been 1.539 cents, 1.525 cents and 1.586 cents for 2QFY20, 3QFY20 and 4QFY20 respectively.
DPU
Singapore cents

2/18/2021 14
Section C: Portfolio Update

Asset Lease Structure Occupancy Key Highlight
Chongxian Port Investment
Master lease: 1 Jan 2016 to 31 Dec 2024Rental escalation of 3.0% on 1st Jan 2020 and 2.0% annually from 1st Jan 2021
100% Leading river port with 60% market share for steel products in Hangzhou
Chongxian Port Logistics Multi Tenanted 100% Integrated operations, storage processing and
logistics distribution for steel products
Fu Zhuo IndustrialTwo main tenancies: (1) Apr 2015 to Apr 2020: 10% annually in first 3 years, 15% from Year 4 from and (2) 7.5% every 3 years from Oct 2014 to Oct 2029
100% Adjacent to port; for cement related products
Stable Portfolio with Embedded Organic Growth
Healthy Occupancy
E-Commerce Logistics Assets
Asset Lease Structure Occupancy Key Highlight
Fu HengMaster Lease: 1 Jan 2016 to 31 Dec 2024Rental escalation of 3.0% on 1st Jan 2020, 2.0% annually from 1st
Jan 2021.100% Coveted property; entire suite of facilities
supporting e-commerce fulfilment
Fuzhou E-Commerce Master Lease: 8 Aug 2019 to 7 Aug 2024 Rental escalation of 2.25% per annum 100% Situated next to Fu Heng. A sizable integrated e-
commerce logistics asset
Stage 1 Properties of Bei Gang
Master lease: 1 Nov 2015 to 31 Oct 2024Annual rental escalation of 1% from Nov 2020 to Oct 2024 100% One of the largest e-commerce developments
in the region
Wuhan Meiluote Multi Tenanted 86.5% First acquisition in 2018. Houses mainly e-commerce players
Specialized Logistics Asset
Port Logistics Assets
Asset Lease Structure Occupancy Key Highlight
Hengde Logistics Multi Tenanted. 100% Customised environment control warehouse space for major SOE tenant China Tobacco
15
109.
010
8.3
108.
910
9.2
112.
411
4.8
115.
411
4.6
118.
511
8.9
131.
013
4.5
119.
6 142.
414
3.9
144.
4
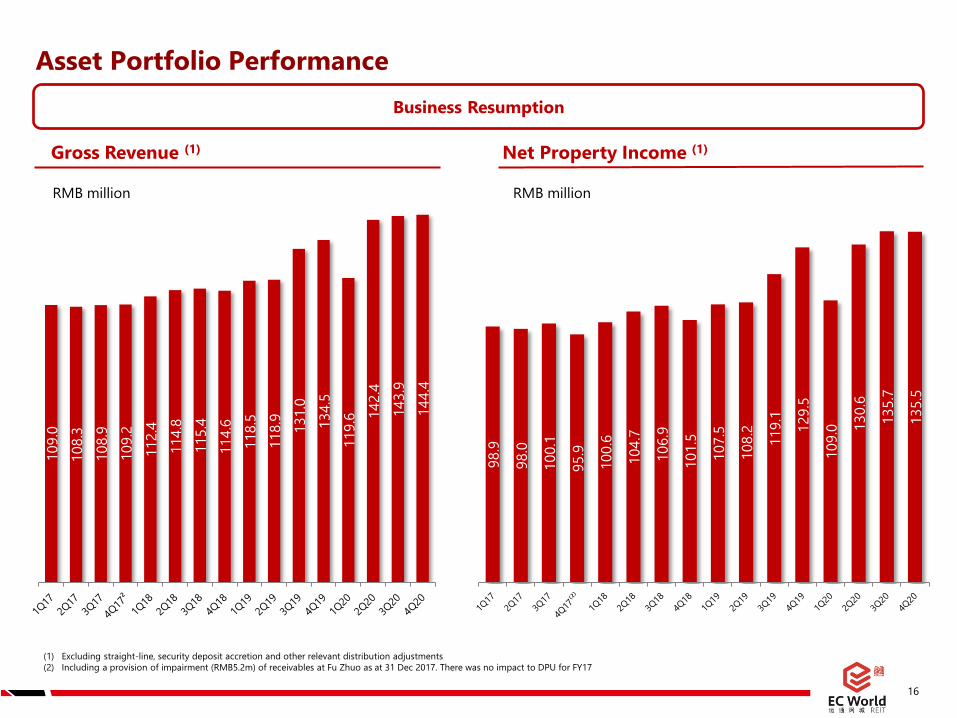
Asset Portfolio Performance
16
Gross Revenue (1) Net Property Income (1)
RMB million RMB million
(1) Excluding straight-line, security deposit accretion and other relevant distribution adjustments(2) Including a provision of impairment (RMB5.2m) of receivables at Fu Zhuo as at 31 Dec 2017. There was no impact to DPU for FY17
98.9
98.0
100.
1
95.9
100.
6
104.
7
106.
9
101.
5
107.
5
108.
2
119.
1
129.
5
109.
0 130.
6
135.
7
135.
5
Business Resumption
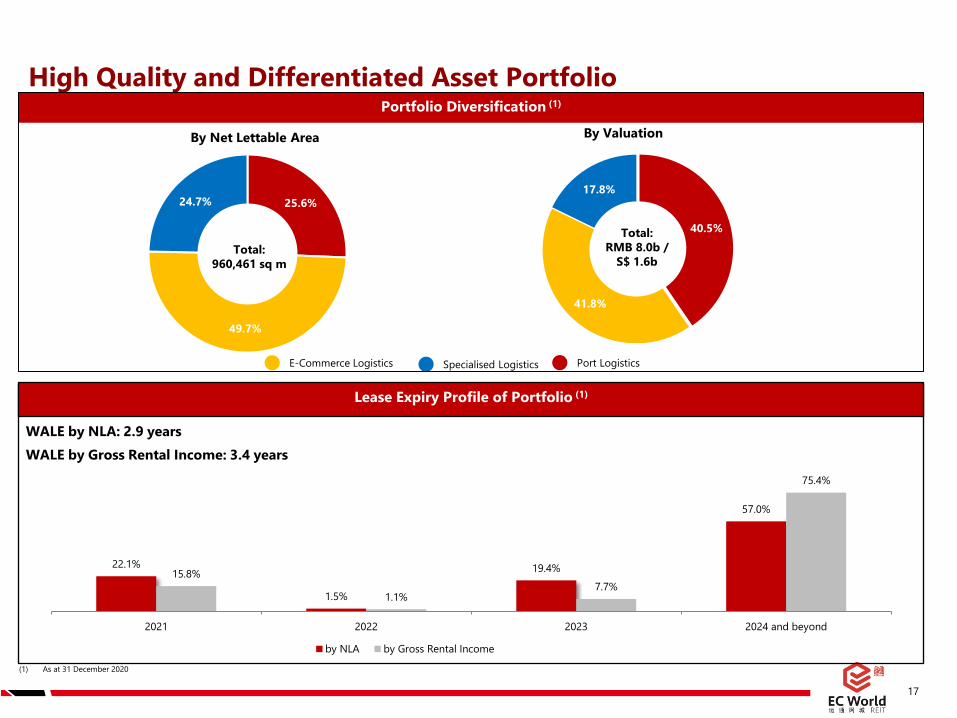
40.5%
41.8%
17.8%
Total: RMB 8.0b /
S$ 1.6b
22.1%
1.5%
19.4%
57.0%
15.8%
1.1%7.7%
75.4%
2021 2022 2023 2024 and beyond
by NLA by Gross Rental Income
High Quality and Differentiated Asset Portfolio
Port LogisticsE-Commerce Logistics Specialised Logistics
(1) As at 31 December 2020
WALE by NLA: 2.9 yearsWALE by Gross Rental Income: 3.4 years
Lease Expiry Profile of Portfolio (1)
Portfolio Diversification (1)
25.6%
49.7%
24.7%
Total: 960,461 sq m
By Net Lettable Area By Valuation
17
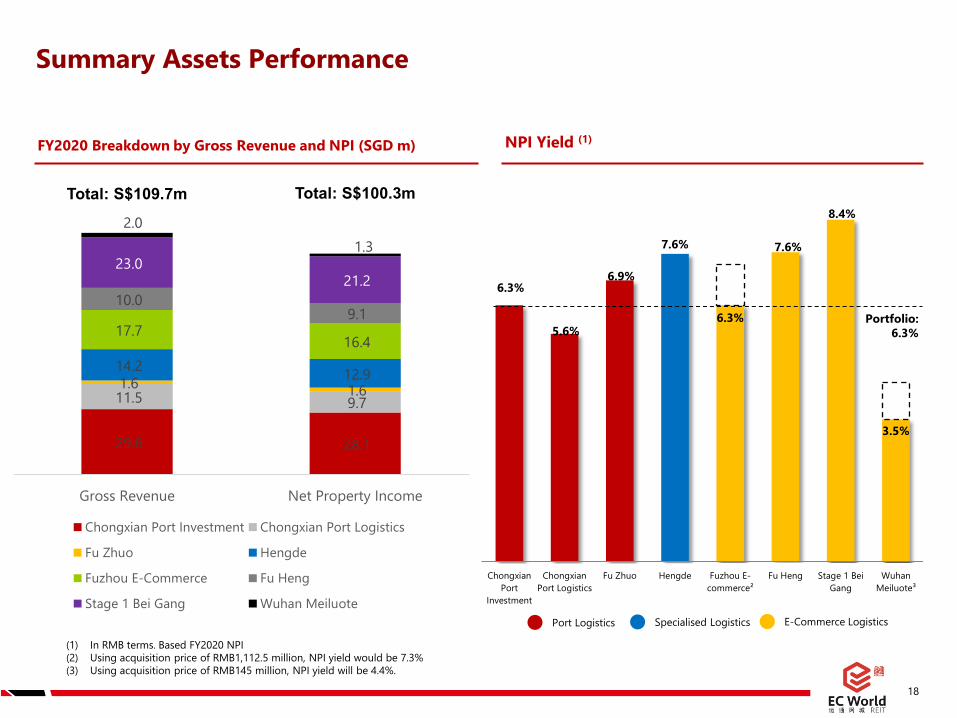
6.3%
5.6%
6.9%
7.6%
6.3%
7.6%
8.4%
3.5%
ChongxianPort
Investment
ChongxianPort Logistics
Fu Zhuo Hengde Fuzhou E-commerce²
Fu Heng Stage 1 BeiGang
WuhanMeiluote³
Summary Assets Performance
18
FY2020 Breakdown by Gross Revenue and NPI (SGD m) NPI Yield (1)
Total: S$109.7m
Portfolio: 6.3%
(1) In RMB terms. Based FY2020 NPI(2) Using acquisition price of RMB1,112.5 million, NPI yield would be 7.3%(3) Using acquisition price of RMB145 million, NPI yield will be 4.4%.
Total: S$100.3m
Port Logistics E-Commerce LogisticsSpecialised Logistics
29.6 28.1
11.5 9.7 1.6 1.6 14.2 12.9
17.7 16.4
10.0 9.1
23.0 21.2
2.0 1.3
Gross Revenue Net Property Income
Chongxian Port Investment Chongxian Port Logistics
Fu Zhuo Hengde
Fuzhou E-Commerce Fu Heng
Stage 1 Bei Gang Wuhan Meiluote

2/18/2021 19
Thank You
For queries, please contact:
Sabrina TaySenior Manager, Investor Relations Tel: +65 6221 [email protected] www.ecwreit.com