FY2018Consolidated Financial Results - Sony Global...FY2018Consolidated Financial Results (Fiscal...
33
FY2018 Consolidated Financial Results (Fiscal year ended March 31, 2019) Sony Corporation April 26, 2019 Please be aware that, in the following remarks, statements made with respect to Sony‘s current plans, estimates, strategies and beliefs and other statements that are not historical facts are forward-looking statements about the future performance of Sony. These statements are based on management’s assumptions in light of the information currently available to it, and, therefore, you should not place undue reliance on them. Sony cautions you that a number of important factors could cause actual results to differ materially from those discussed in the forward-looking statements. For additional information as to risks and uncertainties, as well as other factors that could cause actual results to differ, please refer to today's press release, which can be accessed by visiting www.sony.net/IR.
Transcript of FY2018Consolidated Financial Results - Sony Global...FY2018Consolidated Financial Results (Fiscal...

FY2018 Consolidated Financial Results
(Fiscal year ended March 31, 2019)
Sony Corporation
April 26, 2019
Please be aware that, in the following remarks, statements made with respect to Sony‘s current plans, estimates, strategies and beliefs and other statements that are not historical facts are forward-looking statements about the future performance of Sony. These statements are based on management’s assumptions in light of the information currently available to it, and, therefore, you should not place undue reliance on them.
Sony cautions you that a number of important factors could cause actual results to differ materially from those discussed in the forward-looking statements. For additional information as to risks and uncertainties, as well as other factors that could cause actual results to differ, please refer to today's press release, which can be accessed by visiting www.sony.net/IR.

FY2018 Consolidated Financial Results and FY2019 Consolidated Results Forecast
Segments Outlook
• I am CFO Hiroki Totoki. Thank you for your time today.
• Today I would like to explain two topics.
1

FY2018 Consolidated Results
FY17 FY18 ChangeFY18
USD Amount*1
Sales & operating revenue 8,544.0 8,665.7 +121.7 bln yen
(+1%)$ 78,140
Operating income 734.9 894.2 +159.4 bln yen
(+22%)
8,063
Income before income taxes 699.0 1,011.6 +312.6 bln yen
(+45%)
9,122
Net income attributable toSony Corporation’s stockholders
490.8 916.3 +425.5 bln yen
(+87%)
8,262
Net income attributable to Sony Corporation’s stockholders per share of common stock (diluted) 379.75 yen 707.74 yen +327.99 yen 6.38 USD
Sony without Financial Services*2
Operating Cash Flow +770.6 +753.4 -17.2 bln yen +6,794
Investing Cash Flow -164.0 -520.4 -356.4 bln yen -4,693
Total Cash Flow (Operating CF + Investing CF) +606.7 +233.1 -373.6 bln yen +2,102
Average rate
1 US dollar 110.9 yen 110.9 yen
1 Euro 129.7 yen 128.5 yen
(Bln Yen, Mln US dollar)
*1 US dollar amounts have been translated from yen, for convenience only, using the average rate listed on this slide..*2 Please refer to F-12 in “ FY18 Financial Statements” for Condensed Statements of Cash Flows for Sony without Financial Services (applies to all following pages).
Consolidated cash flow(Sony without Financial Services) is not a measure in accordance with U.S. GAAP. However, Sony believes that this disclosure may be useful information to investors.
Dividend per Share
Interim 15 yen
Year-end 20 yen
Full year 35 yen
• FY18 consolidated sales increased 1% compared to the previous fiscal year (“year-on-year”) to 8 trillion 665.7 billion yen and operating income increased 159.4 billion yen to 894.2 billion yen.
2

Adjusted Operating Income
OperatingIncome
Adjusted Operating Income
Adjusted Operating Income excludes the following items*
FY17 734.9 bln yen 709.6 bln yen
Impairment charge against long-lived assets in the MC segment (-31.3 bln yen)
Gain resulting from the sale of the entire equity interest in a manufacturing subsidiary in the camera module business (+28.3 bln yen)
Gain resulting from the sale of real estate held by a subsidiary in the Music segment (+10.5 bln yen)
Insurance recoveries relating to the Kumamoto Earthquakes (+9.3 bln yen) Gain resulting from the sale of manufacturing equipment in the
Semiconductors segment (+8.6 bln yen)
FY18 894.2 bln yen 809.3 bln yen
Impairment charge against long-lived assets in the MC segment(-19.2 bln yen)
Impairment charge against long-lived assets and goodwill in the All Other segment (-12.9 bln yen)
Remeasurement gain recorded in the Music segment as a result of the consolidation of EMI (+116.9 bln yen)
Change fromFY17 +159.4 bln yen +99.7 bln yen
(+14%)
* These monetary amounts have been disclosed in the Financial Statements, the Presentation slides and the Quarterly Securities Reports for the relevant quarters.
Adjusted operating income is not a measure in accordance with U.S. GAAP. However, Sony believes that this disclosure may be useful information to investors.
• As is shown in this slide, adjusted operating income excluding extraordinary items increased 99.7 billion yen year-on-year to 809.3 billion yen.
3

FY2018 Consolidated Results
FY17 FY18 ChangeFY18
USD Amount*
Sales & operating revenue 8,544.0 8,665.7 +121.7 bln yen
(+1%)$ 78,140
Operating income 734.9 894.2 +159.4 bln yen
(+22%)
8,063
Income before income taxes 699.0 1,011.6 +312.6 bln yen
(+45%)
9,122
Net income attributable toSony Corporation’s stockholders
490.8 916.3 +425.5 bln yen
(+87%)
8,262
Net income attributable to Sony Corporation’s stockholders per share of common stock (diluted) 379.75 yen 707.74 yen +327.99 yen 6.38 USD
Sony without Financial Services*2
Operating Cash Flow +770.6 +753.4 -17.2 bln yen +6,794
Investing Cash Flow -164.0 -520.4 -356.4 bln yen -4,693
Total Cash Flow (Operating CF + Investing CF) +606.7 +233.1 -373.6 bln yen +2,102
Average rate
1 US dollar 110.9 yen 110.9 yen
1 Euro 129.7 yen 128.5 yen
(Bln Yen, Mln US dollar)
*1 US dollar amounts have been translated from yen, for convenience only, using the average rate listed on this slide..*2 Please refer to F-12 in “ FY18 Financial Statements” for Condensed Statements of Cash Flows for Sony without Financial Services (applies to all following pages).
Consolidated cash flow(Sony without Financial Services) is not a measure in accordance with U.S. GAAP. However, Sony believes that this disclosure may be useful information to investors.
Dividend per Share
Interim 15 yen
Year-end 20 yen
Full year 35 yen
• Income before income taxes exceeded 1 trillion yen for the first time in our history, reaching 1 trillion 11.6 billion yen.
• Net income attributable to Sony Corporation’s stockholders increased 425.5 billion yen year-on-year to 916.3 billion yen.
• Consolidated operating cash flow excluding the Financial Services segment for the fiscal year was 753.4 billion yen.
4

FY2018 Cash Flow (CF) by Segment (Sony without Financial Services)FY18
Game & Network Services (G&NS)
Operating CF +334.5Investing CF -37.0Total +297.5
MusicOperating CF +58.8Investing CF -234.1Total -175.3
PicturesOperating CF +50.1Investing CF -18.8Total +31.3
Combined total of HE&S・IP&S・MC
Operating CF +153.8Investing CF -64.3Total +89.5
SemiconductorsOperating CF +196.1Investing CF -132.5Total +63.7
All Other, Corporate and eliminationand Adjustment*
Operating CF -39.8Investing CF -33.7Total -73.5
Consolidated total without Financial Services
Operating CF +753.4Investing CF -520.4Total +233.1
(Bln Yen)
The calculation of Investing CF for each segment differs from the calculation of the Statement of Cash Flows for Sony without Financial Services (please refer to P.13 of "FY18 Financial Statement”) as follows: - Increases and decreases in fixed-term deposits held by each segment are excluded from Investing CF, and- Expenditures for capital leases are included in Investing CF (instead of Financial CF).
These result in the following amount being adjusted in each of the Investing CF figures shown above:G&NS: -0.5 bln yen, Music: 1.4 bln yen, Pictures: -2.4 bln yen, HE&S/IP&S/MC Total: - 8 bln yen, Semiconductors: -0.4 bln yen, All Other and Corporate and elimination: -0.6 bln yen
* “Adjustment” is the total offset to the above adjustments made to the Investing CF for each segment (10.7 bln yen).
Cash Flow by segment are not a measure in accordance with U.S. GAAP. However, Sony believes that this disclosure may be useful information to investors.
• We have begun to disclose cash flow by segment from this earnings announcement.
• Excluding the Music segment in which we acquired EMI Music Publishing (“EMI”) in FY18, all of the business segments generated positive net cash flow (the difference between operating cash flow and investing cash flow).
• The Game & Network Services segment and the total of the three segments included in the Electronics Products & Solutions segment, which was created on April 1, made significant contributions.
5

FY2018 Results by Segment
FY17 FY18 Change FX Impact
Game & Network Services (G&NS)Sales 1,943.8 2,310.9 +367.1 -9.4
Operating income 177.5 311.1 +133.6 -4.8
MusicSales 800.0 807.5 +7.5 +0.6
Operating income 127.8 232.5 +104.7
PicturesSales 1,011.1 986.9 -24.2 +3.7
Operating income 41.1 54.6 +13.5
Home Entertainment &Sound (HE&S)
Sales 1,222.7 1,155.4 -67.3 -24.6
Operating income 85.8 89.7 +3.8 -21.6
Imaging Products &Solutions (IP&S)
Sales 655.9 670.5 +14.6 -3.7
Operating income 74.9 84.0 +9.1 -3.2
Mobile Communications(MC)
Sales 723.7 498.0 -225.7 -4.9
Operating loss -27.6 -97.1 -69.5 +2.0
SemiconductorsSales 850.0 879.3 +29.3 +0.1
Operating income 164.0 143.9 -20.1 -0.5
Financial ServicesRevenue 1,228.4 1,282.5 +54.2
Operating income 178.9 161.5 -17.5
All OtherSales 407.2 345.7 -61.4
Operating income -23.5 -11.1 +12.4
Corporate and eliminationSales -298.8 -271.0 +27.8
Operating income -64.1 -74.7 -10.6
Consolidated totalSales 8,544.0 8,665.7 +121.7
Operating income 734.9 894.2 +159.4
(Bln Yen)
・Sales and Revenue in each business segment represents sales and revenue recorded before intersegment transactions are eliminated. Operating income in each business segment represents operating income reported before intersegmenttransactions are eliminated and excludes unallocated corporate expenses (applies to all following pages).
・Both Sales and Revenue include operating revenue and intersegment sales (applies to all following pages).・For further details about the impact of foreign exchange rate fluctuations on sales and operating income (loss), see Note on page 29 (applies to all following pages).
• This slide shows the results by segment for FY18.
6

FY2019 Consolidated Results Forecast
FY17 FY18 FY19Change
from FY18
Sales & operating revenue 8,544.0 8,665.7 8,800 +134.3 bln yen(+2%)
Operating income 734.9 894.2 810 -84.2 bln yen(-9%)
Income before income taxes 699.0 1,011.6 770 -241.6 bln yen
(-24%)
Net income attributable to Sony Corporation’s stockholders
490.8 916.3 500 -416.3 bln yen
(-45%)
Operating Cash Flow(Sony without Financial Services) 770.6 753.4 760 -
Average rate Actual Actual Assumption
1 US dollar 110.9 yen 110.9 yen Approx. 110 yen
1 Euro 129.7 yen 128.5 yen Approx. 125 yen
(Bln Yen)
Operating cash flow(Sony without Financial Services) is not a measure in accordance with U.S. GAAP. However, Sony believes that this disclosure may be useful information to investors.
• Next is the consolidated results forecast for FY19.
• Consolidated sales are expected to increase slightly year-on-year to 8 trillion 800 billion yen.
7

Adjusted Operating Income Forecast
OperatingIncome
Adjusted Operating Income
Adjusted Operating Income excludes the following items*
FY18 894.2 bln yen 809.3 bln yen
Impairment charge against long-lived assets in the MC segment(-19.2 bln yen)
Impairment charge against long-lived assets and goodwill in the All Other segment (-12.9 bln yen)
Remeasurement gain recorded in the Music segment as a result of the consolidation of EMI (+116.9 bln yen)
FY19 810.0 bln yen 810.0 bln yen -
Change fromFY18 -84.2 bln yen +0.7 bln yen
(+0%)
* These monetary amounts have been disclosed in the Financial Statements, the Presentation slides and the Quarterly Securities Reports for the relevant quarters.
Adjusted operating income is not a measure in accordance with U.S. GAAP. However, Sony believes that this disclosure may be useful information to investors.
• Operating income is expected to decrease 84.2 billion yen to 810 billion yen, but adjusted operating income in the previous fiscal year was 809.3 billion yen and, assuming no extraordinary items this fiscal year, adjusted operating income is expected to be essentially flat year-on-year.
8

FY2019 Consolidated Results Forecast
FY17 FY18 FY19Change
from FY18
Sales & operating revenue 8,544.0 8,665.7 8,800 +134.3 bln yen(+2%)
Operating income 734.9 894.2 810 -84.2 bln yen(-9%)
Income before income taxes 699.0 1,011.6 770 -241.6 bln yen
(-24%)
Net income attributable to Sony Corporation’s stockholders
490.8 916.3 500 -416.3 bln yen
(-45%)
Operating Cash Flow(Sony without Financial Services) 770.6 753.4 760 -
Average rate Actual Actual Assumption
1 US dollar 110.9 yen 110.9 yen Approx. 110 yen
1 Euro 129.7 yen 128.5 yen Approx. 125 yen
(Bln Yen)
Operating cash flow(Sony without Financial Services) is not a measure in accordance with U.S. GAAP. However, Sony believes that this disclosure may be useful information to investors.
• Net income attributable to Sony Corporation’s stockholders is expected to decrease 416.3 billion yen to 500 billion yen.
• Consolidated operating cash flow excluding the Financial Services segment is expected to be 760 billion yen.
9
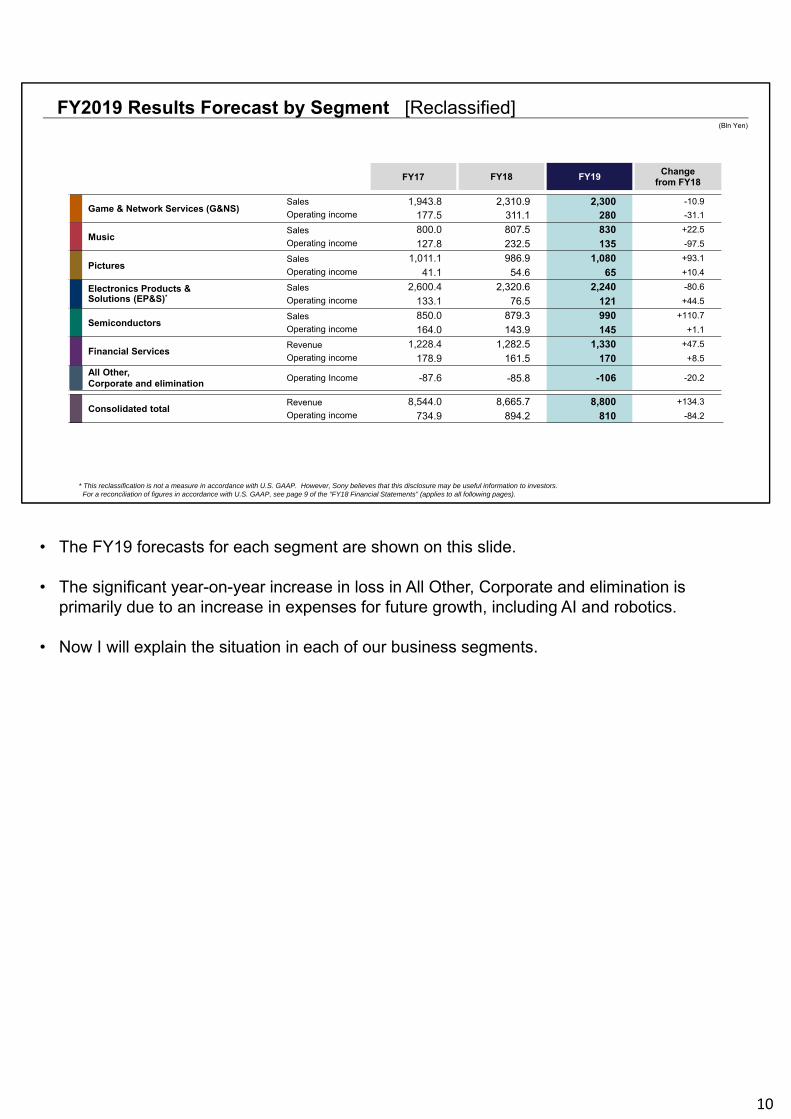
FY2019 Results Forecast by Segment [Reclassified]
FY17 FY18 FY19Change
from FY18
Game & Network Services (G&NS)Sales 1,943.8 2,310.9 2,300 -10.9
Operating income 177.5 311.1 280 -31.1
MusicSales 800.0 807.5 830 +22.5
Operating income 127.8 232.5 135 -97.5
PicturesSales 1,011.1 986.9 1,080 +93.1
Operating income 41.1 54.6 65 +10.4
Electronics Products &Solutions (EP&S)*
Sales 2,600.4 2,320.6 2,240 -80.6
Operating income 133.1 76.5 121 +44.5
SemiconductorsSales 850.0 879.3 990 +110.7
Operating income 164.0 143.9 145 +1.1
Financial ServicesRevenue 1,228.4 1,282.5 1,330 +47.5
Operating income 178.9 161.5 170 +8.5
All Other, Corporate and elimination
Operating Income -87.6 -85.8 -106 -20.2
Consolidated totalRevenue 8,544.0 8,665.7 8,800 +134.3
Operating income 734.9 894.2 810 -84.2
(Bln Yen)
* This reclassification is not a measure in accordance with U.S. GAAP. However, Sony believes that this disclosure may be useful information to investors. For a reconciliation of figures in accordance with U.S. GAAP, see page 9 of the “FY18 Financial Statements” (applies to all following pages).
• The FY19 forecasts for each segment are shown on this slide.
• The significant year-on-year increase in loss in All Other, Corporate and elimination is primarily due to an increase in expenses for future growth, including AI and robotics.
• Now I will explain the situation in each of our business segments.
10

Game & Network Services Segment
FY2018 (year-on-year)
Sales: 367.1 bln yen (19%) significant increase (FX Impact: -9.4 bln yen)ꞏ(+) Increase in game software sales ꞏ(+) Increase in the number of subscribers for PlayStation®Plus,
a paid membership serviceꞏ(--) Decrease in PlayStation®4 (PS4™) hardware sales
OI: 133.6 bln yen significant increase (FX Impact: -4.8 bln yen)
ꞏ(+) Increase in game software salesꞏ(+) Increase in the income from PlayStation®Plusꞏ(--) Decrease in PS4 hardware sales
FY2019 Forecast (year-on-year)
Sales: Essentially flat year-on-yearꞏ(--) Decrease in PS4 hardware unit salesꞏ(--) Impact of foreign exchange rates ꞏ(+) Increase in game software sales
OI: 31.1 bln yen decreaseꞏ(--) Increase in development expenses for the next generation
consoleꞏ(--) Decrease in contribution from highly-profitable first-party
software titlesꞏ(--) Negative impact of foreign exchange rates ꞏ(+) PS4 hardware cost reduction
Sales and Operating Income
Sales
Operating Income
(Mln Units) FY17 FY18 FY19 FCT
PS4™ 19 17.8 16
1,943.8
2,310.9 2,300
177.5
311.1280
(Bln Yen)
• First I will talk about the Game & Network Services segment.
• Sales were 2 trillion 310.9 billion yen. • Although PlayStation®4 (“PS4”) hardware sales decreased, overall sales increased 19% year-
on-year mainly due to an increase in game software and network services revenue.
• Operating income increased 133.6 billion yen year-on-year to 311.1 billion yen due to the impact of the increase in sales.
• Sales in FY19 are expected to be 2 trillion 300 billion yen. • Despite a decrease in unit sales of PS4 hardware and the impact of foreign exchange rates,
sales are expected to be essentially flat year-on-year primarily due to an expected increase in game software sales.
• Operating income is expected to decrease 31.1 billion yen to 280 billion yen. • Despite PS4 hardware cost reductions, we expect operating income to decrease primarily due
to an increase in development expenses for the next generation console and a lower contribution from first-party game software titles compared to the previous fiscal year which included God of War and other titles.
11

• Now I would like to introduce the initiatives that Sony Interactive Entertainment (“SIE”) is implementing in the game streaming space, which has recently gained much attention.
• SIE currently operates PlayStation Now (“PS Now”) in this area.
• Today, I will explain the current status of this service. • At the Corporate Strategy Meeting and IR Day next month, we will discuss our vision and
strategy in this space.
• SIE is committed to the vision of making PlayStation the “Best Place to Play” by delivering to users the best content in the best manner possible.
• Game streaming is one important way to achieve that.
12

Acquired in 2012 Launched in 2014
• SIE made a deliberate strategic move back in 2012 when it purchased Gaikai because SIE anticipated that the future would involve game streaming.
• At the time, Gaikai was a potential competitor because it was operating a game streaming service, and SIE decided to acquire it in order to capture its technology and intellectual property.
• Five years have passed since 2014 when PS Now was launched in the U.S. • The service is based on a subscription model and charges $19.99 per month.
13

• This year we added 9 more countries in northern and southern Europe, bringing the total number of major markets covered today to 19 countries.
• The average annual increase in paid subscribers has exceeded 40% since the service was launched and the number of users has increased around the same amount every year, reaching approximately 700,000 today.
• We have leveraged our strong relationships with publishers to provide over 750 PlayStation®3 and PS4 titles to our subscribers, although this number varies by region. This number is more than 3 times as many as the second largest game subscription service provider by number of titles.
14

• PS Now is also an all-you-can-play subscription service. For users who want to enjoy gameplay without worrying about their network connection, SIE released a download feature in September 2018 for PS4 titles.
• Since the launch of this download service, gameplay time per user has grown significantly to the point where gameplay time on downloaded PS4 titles is double that of streamed titles, a trend which has contributed to higher user engagement with, and retention on, the PS Now service.
• In this way, SIE has accumulated a wealth of expertise in the game streaming space and plans to leverage that expertise to continue providing the ultimate game user experience on console and in the game streaming space.
15

Music Segment
FY2018 (year-on-year)
Sales: Essentially flat year-on-year (FX Impact: +0.6 bln yen)
ꞏ(+) Higher streaming revenuesꞏ(+) Higher sales for Music Publishing resulting from the consolidation
of EMIꞏ(−) Lower physical sales in Recorded Music
ꞏ(−) Impact of the new accounting standard
OI: 104.7 bln yen significant increase
ꞏ(+) Recording of a remeasurement gain resulting from the consolidationof EMI (116.9 bln yen)
・(−) Recording of a deterioration of equity in net income (loss) in connection with Sony’s acquisition of the remaining approximately 60% interest in EMI (11.6 bln yen)
FY2019 Forecast (year-on-year)
Sales: 22.5 bln yen (3%) increaseꞏ(+) Higher sales for Music Publishing resulting from the full-year
consolidation of EMIꞏ(+) Higher streaming revenues for Recorded Music and Music Publishingꞏ(--) Decrease in sales for game applications for mobile devices ꞏ(--) Decline in physical and digital download sales in Recorded Music
OI: 97.5 bln yen significant decreaseꞏ(--) Absence of the remeasurement gain (116.9 bln yen) resulting from
the consolidation of EMI in FY18ꞏ(+) Increase in operating income resulting from the consolidation of EMI
Sales and Operating Income(Bln Yen)
Sales
Operating Income
FY17 FY18 FY19 FCT
Recorded Music CategoryRevenue
447.0 426.9-
Streaming* Revenue(included above)
197.4 227.5 -
800.0 807.5 830
127.8
232.5
135
* Streaming includes digital audio, digital video and digital radio, and includes revenue from both subscription and ad-supported services.
• Next is the Music segment.
• FY18 sales increased 1% to 807.5 billion yen. • This increase was primarily due to an increase in streaming revenues and the impact of
consolidating EMI, substantially offset by a decrease in physical sales in Recorded Music, mainly due to the impact of a new accounting standard.
• Operating income increased 104.7 billion yen year-on-year to 232.5 billion yen. • Operating income this fiscal year included 105.3 billion yen of net extraordinary items related
to the acquisition of EMI and last fiscal year also included a gain on the sale of real estate.
• Operating income generated from mobile game applications accounted for a little less than 20% of the operating income of the segment and was essentially flat year-on-year.
• Sales in FY19 are expected to increase 3% year-on-year to 830 billion yen. • We expect sales to increase primarily due to the impact of the full-year consolidation of EMI
and an increase in streaming revenues, partially offset by a decrease in sales from mobile game applications and physical and digital download sales in Recorded Music.
• Operating income is expected to decrease 97.5 billion yen to 135 billion yen. • This decrease is primarily due to the absence of the gain from the acquisition of EMI recorded
in the previous fiscal year.
16

Pictures SegmentFY2018 (year-on-year)
The following analysis is on a U.S. dollar basis Sales: 24.2 bln yen (2%) decrease (U.S. dollar basis: −263 mil USD / −3%)
ꞏ(--) Lower sales in Motion Picturesꞏ(--) Lower worldwide theatrical revenues
ꞏ(--) Lower sales in Media Networksꞏ(--) Lower advertising and subscription revenues at various international
channelsꞏ(--) Lower sales in Television Production
ꞏ(--) Lower licensing revenues for various U.S. television series and catalog product
ꞏ(+) Impact of the new accounting standard
OI: 13.5 bln yen significant increaseꞏ(+) Improvement in the profitability of Motion Picturesꞏ(+) Impact of the new accounting standard (+3.8 bln yen)ꞏ(--) Recording of programming write-offs and severance expenses related to
a review of the channel portfolio within Media Networks undertaken to streamline the business (-12.8 bln yen)
ꞏ(--) Lower sales for Media Networks and Television Productions
FY2019 Forecast (year-on-year)
Sales: 93.1 bln yen (9%) increaseꞏ(+) Increase in sales for Motion Picturesꞏ(+) Increase in sales for Television Productions
OI: 10.4 bln yen increaseꞏ(+) Absence of the programming write-offs and severance expenses recorded
within Media Networks in FY18 and the benefit on operating results in FY19resulting from the channel portfolio review
ꞏ(+) Increase in sales
ꞏ(--) Increase in marketing costs in support of upcoming major theatrical releases
Sales and Operating Income(Bln Yen)
Sales
Operating Income
FY17 FY18 FY19 FCT
1,011.1 986.9
1,080
41.154.6
65
• Next is the Pictures segment.
• FY18 sales decreased 2% year-on-year to 986.9 billion yen. • Despite the strong performance of Venom and Hotel Transylvania in FY18, theatrical
revenues decreased compared to the previous fiscal year which included Jumanji and Spider-Man, as well as due to a decrease in Media Network sales.
• Operating income increased 13.5 billion yen year-on-year to 54.6 billion yen. • This significant increase was primarily due to an improvement in the profitability of Motion
Pictures, partially offset by the recording of 12.8 billion yen in expenses related to a portfolio review in Media Networks.
• Sales in FY19 are expected to increase 9% year-on-year to 1 trillion 80 billion yen. • This increase is primarily due to an expected increase in sales for Motion Pictures, driven by
sequels to major releases, and Television Productions.
• Operating income is expected to increase 10.4 billion yen year-on-year to 65 billion yen. • This increase is primarily due to the absence of the 12.8 billion yen in expenses recorded in
FY18 for the portfolio review in Media Networks and the expected benefit of that review on FY19 results.
17

Home Entertainment & Sound Segment
FY2018 (year-on-year)
Sales: 67.3 bln yen (6%) decrease (FX impact: -24.6 bln yen)ꞏ(--) Decrease in television unit sales resulting from a strategic decision
not to pursue scale in order to focus on profitabilityꞏ(--) Impact of foreign exchange ratesꞏ(+) Improvement in the product mix reflecting a shift to high value-added
models
OI: 3.8 bln yen increase (FX Impact: -21.6 bln yen)ꞏ(+) Improvement in the product mix reflecting a shift to high value-added
modelsꞏ(--) Negative impact of foreign exchange rates ꞏ(--) Decrease in sales
Sales and Operating Income
Sales
Operating Income
(Bln Yen)
(Mln Units) FY17 FY18
TVs 12.4 11.3
1,222.71,155.4
85.8 89.7
• Next is the Home Entertainment & Sound segment.
• FY18 sales decreased 6% year-on-year to 1 trillion 155.4 billion yen. • This decrease was primarily due to a decrease in unit sales of televisions resulting from a
strategic decision to focus on profitability and the negative impact of foreign exchange rates.
• Operating income increased 3.8 billion yen to 89.7 billion yen. • Despite the negative impact of foreign exchange rates and the decrease in sales, we were
able to increase profit primarily due to a shift to high value-added models.
18

Imaging Products & Solutions Segment
FY2018 (year-on-year)
Sales: 14.6 bln yen (2%) increase (FX Impact: -3.7 bln yen)
ꞏ(+) Improvement in the product mix reflecting a shift to high value-addedmodels such as mirrorless single-lens cameras and the interchangeable lens lineup
ꞏ(--) Decrease in compact digital camera unit sales reflecting the impact of the contraction of the market
OI: 9.1 bln yen increase (FX Impact: -3.2 bln yen)ꞏ(+) Improvement in the product mix reflecting a shift to high value-added
modelsꞏ(+) Reductions in operating costs
Sales and Operating Income(Bln Yen)
Sales
Operating Income
(Mln Units) FY17 FY18
Digital Cameras* 4.4 3.6
* Includes compact digital cameras and interchangeable single-lens cameras / excludes interchangeable lenses.
655.9 670.5
74.9 84.0
• Next is the Imaging Products & Solutions segment.
• FY18 sales increased 2% year-on-year to 670.5 billion yen, primarily due to an increase in sales of high value-added products including mirrorless single-lens cameras and interchangeable lenses.
• Operating income increased 9.1 billion yen year-on-year to 84.0 billion yen. • This increase was primarily due to the increase in sales of high value-added products and a
reduction in operating costs.
19

Mobile Communications Segment
FY2018 (year-on-year)
Sales: 225.7 bln yen (31%) significant decrease (FX Impact: -4.9 bln yen)ꞏ(--) Significant decrease in smartphone unit sales
OI: 69.5 bln yen deterioration (FX Impact: +2.0 bln yen)
ꞏ(--) Decrease in smartphone unit salesꞏ(--) Recording of expense primarily for the write-down of excess
components in inventoryꞏ(--) Increase in restructuring chargesꞏ(+) Reductions in operating costsꞏ(+) Year-on-year decrease in the impairment charge recorded
against long-lived assets
Sales and Operating Income(Bln Yen)
Sales
Operating Income
(Mln Units) FY17 FY18
Smartphones 13.5 6.5
723.7
498.0
-27.6
3.7
-31.3
-19.2-97.1
Impairment Charge of Long-Lived Assets
Impairment Charge of Long-Lived Assets
• Next is the Mobile Communications segment.
• FY18 sales decreased 31% year-on-year to 498.0 billion yen due to a decrease in unit sales of smartphones.
• Operating loss increased 69.5 billion yen year-on-year to 97.1 billion yen. • Despite a reduction in operating expenses and a decrease in impairment charges against
long-lived assets, loss increased primarily due to the aforementioned decrease in sales.
• Our plan to reduce operating expenses by approximately 50% compared with the fiscal year ended March 31, 2018 in an effort to turn a profit in the fiscal year ending March 31, 2021 (“FY20”) is progressing according to plan.
• We have accelerated our plan to cease production at our Beijing factory and we have exited several regions such as the Middle East and Central and South America.
• We believe we can turn a profit in FY20.
20

• In addition, by launching products like the Xperia 1, which we announced previously, that are differentiated by Sony’s technology, we are steadily improving our product appeal.
21

Electronics Products & Solutions [Reclassified]
FY2019 Forecast (year-on-year)
Sales: 80.6 bln yen (3%) decreaseꞏ(--) Decrease in smartphone unit sales
OI: 44.5 bln yen significant increaseꞏ(+) Reductions in operating costs for the smartphone business,
including cost reductions resulting from restructuring initiatives undertaken in FY18
Sales and Operating Income(Bln Yen)
Sales
Operating Income
FY17 FY18 FY19 FCT
Mobile Communications Business*(included above)
Sales to External Customers 713.9 487.3 410
Operating Income -27.6 -97.1 -47
* Mobile Communication Business includes smartphone business and the fixed line communications business.
2,600.4
2,320.6 2,240
133.176.5
121
• I will now explain the FY19 forecast for the Electronics Products & Solutions segment which we formed in April to create new value and improve management efficiency in the three electronics business segments.
• We expect sales to decrease 3% year-on-year to 2 trillion 240 billion yen and operating income to increase 44.5 billion yen to 121 billion yen.
• Sales to outside customers of the Mobile Communications business within the segment are expected to decrease 16% year-on-year to 410 billion yen and operating loss is expected to shrink 50.1 billion yen to 47 billion yen.
• We will continue to disclose the financial results of the Mobile Communications business for the time being.
22

Semiconductors Segment
FY2018 (year-on-year)
Sales: 29.3 bln yen (3%) increase (FX Impact: +0.1 bln yen)
ꞏ(+) Significant increase in sales of image sensors for mobile productsꞏ(--) Significant decrease in sales of camera modules
OI: 20.1 bln yen decrease (FX Impact: -0.5 bln yen)
ꞏ(--) Increase in research and development expenses as well as in depreciation and amortization expenses
ꞏ(--) Absence of the gain resulting from the sale of the entire equity interestin a manufacturing subsidiary in the camera module business in FY17 (28.3 bln yen)
ꞏ(--) Absence of the gain resulting from the sale of manufacturing equipment in FY17 (8.6 bln yen)
ꞏ(--) Absence of insurance recoveries related to the Kumamoto Earthquakes recorded in FY17 (6.7 bln yen)
ꞏ(+) Increase in sales
FY2019 Forecast (year-on-year)
Sales: 110.7 bln yen (13%) significant increase
ꞏ(+) Significant increase in sales of image sensors for mobile productsꞏ(+) Significant increase in unit salesꞏ(+) Improvement in the product mix
ꞏ(--) Impact of foreign exchange rates
OI: Essentially flat year-on-year
ꞏ(+) Increase in salesꞏ(--) Increase in depreciation and amortization expenses as well as in
research and development expensesꞏ(--) Negative impact of foreign exchange rates
Sales and Operating Income(Bln Yen)Sales
Operating Income
FY17 FY18 FY19 FCT
Image Sensors Sales 649.4 711.4 840
Additions to long-lived assetsfor Semiconductors Segment 128.1 146.3 300
for Image Sensors (included above) 106.6 128.9 280
850.0 879.3
990
164.0143.9 145
• Next is the Semiconductors segment.
• FY18 sales increased 3% year-on-year to 879.3 billion yen. • Image sensor sales increased 10% year-on-year primarily due to an increase in demand from
mobile devices.
• Operating income decreased 20.1 billion yen year-on-year to 143.9 billion yen.
23

Semiconductors Segment Adjusted Operating Income
OperatingIncome
Adjusted Operating
Income
Adjusted Operating Income excludes the following items*
FY17 164.0 bln yen 120.4 bln yen
Gain resulting from the sale of the entire equity interest in a manufacturing subsidiary in the camera module business (+28.3 bln yen)
Gain resulting from the sale of manufacturing equipment in the Semiconductors segment (+8.6 bln yen)
Insurance recoveries related to the Kumamoto Earthquakes (+6.7 bln yen)
FY18 143.9 bln yen 143.9 bln yen ー
Change fromFY17 -20.1 bln yen
+23.5 bln yen
(+20%)
* These monetary amounts are disclosed in the Quarterly Financial Statements, the Presentation Slides and the Quarterly Securities Reports for the relevant quarters.
Adjusted operating income is not a measure in accordance with U.S. GAAP. However, Sony believes that this disclosure may be useful information to investors.
• As is shown in this slide, the operating income of the previous fiscal year included certain extraordinary items, and adjusted operating income increased 23.5 billion yen.
• The increase in adjusted operating income was primarily due to an increase in sales of image sensors, partially offset by an increase in research and development and depreciation expenses.
24

Semiconductors Segment
FY2018 (year-on-year)
Sales: 29.3 bln yen (3%) increase (FX Impact: +0.1 bln yen)
ꞏ(+) Significant increase in sales of image sensors for mobile productsꞏ(--) Significant decrease in sales of camera modules
OI: 20.1 bln yen decrease (FX Impact: -0.5 bln yen)
ꞏ(--) Increase in research and development expenses as well as in depreciation and amortization expenses
ꞏ(--) Absence of the gain resulting from the sale of the entire equity interestin a manufacturing subsidiary in the camera module business in FY17 (28.3 bln yen)
ꞏ(--) Absence of the gain resulting from the sale of manufacturing equipment in FY17 (8.6 bln yen)
ꞏ(--) Absence of insurance recoveries related to the Kumamoto Earthquakes recorded in FY17 (6.7 bln yen)
ꞏ(+) Increase in sales
FY2019 Forecast (year-on-year)
Sales: 110.7 bln yen (13%) significant increase
ꞏ(+) Significant increase in sales of image sensors for mobile productsꞏ(+) Significant increase in unit salesꞏ(+) Improvement in the product mix
ꞏ(--) Impact of foreign exchange rates
OI: Essentially flat year-on-year
ꞏ(+) Increase in salesꞏ(--) Increase in depreciation and amortization expenses as well as in
research and development expensesꞏ(--) Negative impact of foreign exchange rates
Sales and Operating Income(Bln Yen)Sales
Operating Income
FY17 FY18 FY19 FCT
Image Sensors Sales 649.4 711.4 840
Additions to long-lived assetsfor Semiconductors Segment 128.1 146.3 300
for Image Sensors (included above) 106.6 128.9 280
850.0 879.3
990
164.0143.9 145
• Sales in FY19 are expected to increase 13% year-on-year to 990 billion yen. • This increase is due to an expected increase in image sensor sales for mobile devices.
• On the other hand, operating income is expected to be 145 billion yen, essentially flat year-on-year.
• This is due to a continued increase in depreciation expenses and research and development expenses.
25

Semiconductors Segment Production Capacity Increase
CMOS Image Sensors:Wafer Production Capacity Trends
CMOS Image Sensor Manufacturing Centers
Nagasaki Technology CenterKumamoto Technology Center
Yamagata Technology Center Oita Technology Center
40
60
68
85
100
0
20
40
60
80
100
120
Mar.2012
Nov.2014
Aug.2015
Jul.2016
Mar.2018
Mar.2020
~Mar.2021
Unit: thousands of slices per month※300mm wafer basis/Including Foundry
Input Base Shipment Base
• In October of last year, I explained our plan to invest approximately 600 billion yen in the three years through FY20, and to increase our image sensor production capacity to about 130,000 wafers per month on a 300 mm wafer basis.
• As of today, there is no major change to this investment plan, but we will pay close attention to trends in demand and make decisions regarding the execution of the investment in stages.
• Already, as we look out to the fiscal year ending March 31, 2022 and beyond, we expect demand for smartphones to continue to increase due to the trend toward larger sensors and multi-lens cameras.
• We are currently considering whether to construct a new building to meet this increased demand and, if we decide in FY19 to construct a new building, capital expenditures through FY20 might increase by approximately 100 billion yen.
• Demand for image sensors is expected to increase at a relatively slower pace from the fiscal year ending March 31, 2023, and we expect the amount of our capital expenditures to decrease.
• As we consider investments going forward, we are continuing to prioritize capital efficiency and are working to increase ROIC.
• We will provide more details on this point at the IR Day next month.
26

Financial Services Segment
FY2018 (year-on-year)
Revenue: 54.2 bln yen (4%) increase
ꞏ (+) Increase in revenue at Sony Life(49.5 bln yen increase, revenue: 1,143.1 bln yen)
ꞏ (+) Higher insurance premium revenue reflecting an increase in the policy amount in force
OI: 17.5bln yen decrease
ꞏ (--) Decrease at Sony Life (13.5 bln yen decrease, OI: 145.6 bln yen)ꞏ (--) Decrease in gains on investments in the general account
ꞏ Absence of a gain on the sale of real estate held forinvestment purposes recorded in FY17
ꞏ Recording of a loss on the valuation of investment securities
ꞏ (+) Higher insurance premium revenue reflecting an increase in the policy amount in force
ꞏ (--) Recording of a loss on the valuation of securities at Sony Bank
FY2019 Forecast (year-on-year)
Revenue: 47.5 bln yen (4%) increaseꞏ(+) Increase in insurance premium revenue reflecting an increase in
policy amount in force at Sony Life
OI: 8.5 bln yen increaseꞏ(+) Higher insurance premium revenue reflecting an increase in the
policy amount in force
Financial Services Revenue and Operating Income
FY17 FY18 FY19 FCT
(Bln Yen)Financial Services Revenue
Operating Income
1,228.41,282.5
1,330
178.9161.5 170
• Next, I will explain the Financial Services segment.
• In FY18, Financial Services revenue increased 4% year-on-year to 1 trillion 282.5 billion yen. This increase was primarily due to higher insurance premium revenue at Sony Life.
• Operating income decreased 17.5 billion yen year-on-year to 161.5 billion yen. This decrease was primarily due to the absence of a gain on the sale of real estate held for investment purposes recorded in the previous fiscal year, as well as a loss on the valuation of investment securities recorded in the current fiscal year.
• Financial services revenue in FY19 is expected to increase 4% year-on-year to 1 trillion 330 billion yen and operating income is expected to increase 8.5 billion yen year-on-year to 170 billion yen.
• These increases are primarily due to an increase in insurance premium revenue at Sony Life.
• Today Sony Financial Holdings (“SFH”) announced a new management team and new candidates for its Board of Directors.
• The changes are meant to strengthen SFH’s governance function as a holding company and to further grow each business under SFH’s umbrella. Sony fully supports these changes.
• By increasing the number of outside directors and directors from Sony, we aim to strengthen management of the company from the perspective of a shareholder and contribute to an increase in the corporate value of SFH as a listed company.
27

FY2018 Consolidated Results
FY17 FY18 ChangeFY18
USD Amount*
Sales & operating revenue 8,544.0 8,665.7 +121.7 bln yen
(+1%)$ 78,140
Operating income 734.9 894.2 +159.4 bln yen
(+22%)
8,063
Income before income taxes 699.0 1,011.6 +312.6 bln yen
(+45%)
9,122
Net income attributable toSony Corporation’s stockholders
490.8 916.3 +425.5 bln yen
(+87%)
8,262
Net income attributable to Sony Corporation’s stockholders per share of common stock (diluted) 379.75 yen 707.74 yen +327.99 yen 2.96 USD
Sony without Financial Services*
Operating Cash Flow +770.6 +753.4 -17.2 6,794
Investing Cash Flow -164.0 -520.4 -356.4 4,693
Total Cash Flow (Operating CF + Investing CF) +606.7 +233.1 -373.6 2,102
Average rate
1 US dollar 110.9 yen 110.9 yen
1 Euro 129.7 yen 128.5 yen
(Bln Yen, Mln US dollar)
* Please refer to F-12 in “ FY18 Financial Statements” for Condensed Statements of Cash Flows for Sony without Financial Services (applies to all following pages).
Consolidated cash flow(Sony without Financial Services) is not a measure in accordance with U.S. GAAP. However, Sony believes that this disclosure may be useful information to investors.
Dividend per Share
Interim 15 yen
Year-end 20 yen
Full year 35 yen
• In FY18, we recorded a second year of historically-high operating income, income before income taxes and net income attributable to Sony Corporation’s stockholders.
• We expect to maintain a high level of profit in FY19.
• Moreover, we were able to record a third year of profit in the fourth fiscal quarter.
• I think that our ability to generate stable profit is the result of our efforts to increase the proportion of recurring revenue and strengthen our profit foundation.
28

Progress of Mid-Range Plan
• This concludes my explanation of our financial performance. I would now like to explain our decision to cease providing mid-range operating income guidance by segment going forward and our decision to withdraw the FY20 operating income targets for each segment that we announced in May of last year.
• We are managing the Sony Group from a long-term perspective and have established cumulative three-year consolidated operating cash flow excluding the Financial Services segment and ROE as our key performance indicators for the period of the mid-range plan which lasts through FY20. We also announced operating income targets for each business segment in FY20, the final year of our mid-range plan, because we thought these targets would enhance investor understanding of the direction of our businesses.
• However, because the operating income targets by segment are only an estimate as of a single point in the future, we are also concerned that they cannot accurately reflect the long-term trends and direction of our businesses. Moreover, despite only one year having passed since we announced the targets last year, the operating environment for each of our businesses has significantly changed and a gap has arisen between the actual state of certain segments and the targets we announced for those segments.
• Consequently, we are withdrawing the targets and will cease providing guidance for operating income by segment for the final year of our mid-range plan. We will continue to update you on the status of cumulative three-year consolidated operating cash flow excluding the Financial Services segment, which is one of our mid-range targets. We will also continue to disclose our operating income forecast by segment for each fiscal year.
• We ask for your kind understanding as we focus on managing Sony for the long-term and re-orient our conversation with the capital markets toward the long-term.
29

Three Year Total Capital Allocation (excluding Financial Services)
2.2 Trillion yen
or more
1.1 Trillionyen
approx.
Primarily in Image Sensors Increase dividends in a stable and long-term manner
DividendCapital
ExpenditureOperatingCash Flow
StrategicInvestment, etc.
Achievements in FY18
Consolidation of EMI: 392.8 bln yen(Includes assumption of
interest-bearing debt)
Share Buy-back: 100 bln yen
Key focus areas
・ Content IP
・ Technology acquisition
• In conclusion, I would like to explain the current status of our consolidated operating cash flow excluding the Financial Services segment and our capital allocation policy.
• At this point in time, we expect three-year cumulative operating cash flow to exceed 2 trillion 200 billion yen (our target was for 2 trillion yen).
• As for the use of the cash that is generated, we plan to continue to prioritize growth investments that contribute to increased corporate value.
• More specifically, we plan to spend approximately 1 trillion 100 billion yen on capital expenditures primarily for image sensors and, if we decide to construct the new building in the Semiconductors segment that I mentioned earlier, this amount might increase to 1 trillion 200 billion yen.
• Strengthening our content IP and supplementing technology not found in the Sony Group will continue to be the focus of our strategic investments.
• In this way, we will prioritize investments in growth, but stock repurchases might also be an option depending on the status of our free cash flow and the stock price.
• We plan to continue to increase the amount of our dividends in a steady manner over the long-term.
• Last year we mentioned strengthening our balance sheet as one of the goals of our capital allocation strategy but, due to our improved financial results, we now think that we have recovered to the point where we have sufficient financial strength.
• Going forward, we will aim to increase our corporate value through growth investments while maintaining our healthy balance sheet.
• This concludes my remarks.
30
NotesSales on a Constant Currency Basis and Impact of Foreign Exchange Rate FluctuationsThe descriptions of sales on a constant currency basis reflect sales calculated by applying the yen’s monthly average exchange rates from the same period of the previous fiscal year to local currency-denominated monthly sales in the relevant period of the current fiscal year. For Sony Music Entertainment (“SME”), Sony/ATV Music Publishing (“Sony/ATV”) and EMI Music Publishing (“EMI”) in the Music segment, the constant currency amounts are calculated by applying the monthly average U.S. dollar / yen exchange rates after aggregation on a U.S. dollar basis. Results for the Pictures segment are described on a U.S. dollar basis as the Pictures segment reflects the operations of Sony Pictures Entertainment inc. (“SPE”), a U.S.-based operation that aggregates the results of its worldwide subsidiaries in U.S. dollars.
The impact of foreign exchange rate fluctuations on sales is calculated by applying the change in the yen’s periodic weighted average exchange rate for the same period of the previous fiscal year from the relevant period of the current fiscal year to the major transactional currencies in which the sales are denominated. The impact of foreign exchange ratefluctuations on operating income (loss) is calculated by subtracting from the impact on sales the impact on cost of sales and selling, general and administrative expenses calculated by applying the same major transactional currencies calculation process to cost of sales and selling, general and administrative expenses as for the impact on sales.Additionally, the MC segment enters into its own foreign exchange hedging transactions. The impact of those transactions is included in the impact of foreign exchange rate fluctuations on operating income (loss) for that segment.
This information is not a substitute for Sony’s consolidated financial statements measured in accordance with U.S. GAAP. However, Sony believes that these disclosures provide additional useful analytical information to investors regarding the operating performance of Sony.
Notes about Financial Performance of the Music, Pictures and Financial Services segments
On November 14, 2018, Sony acquired the entirety of the approximately 60% equity interest held by the investor consortium led by Mubadala Investment Company in EMI, resulting inEMI becoming a wholly-owned subsidiary of Sony. Financial results of EMI included in the Music segment include Sony’s equity earnings (loss) in EMI from April 1 through November13, 2018 and sales and operating income (loss) of EMI from November 14, 2018 through March 31, 2019, as well as a non-cash gain recorded as a result of the remeasurement to fairvalue of the approximately 40% equity interest in EMI that Sony owned prior to the acquisition.
The Music segment results include the yen-translated results of SME, Sony/ATV and the above-mentioned EMI, all U.S.-based operations which aggregate the results of their worldwide subsidiaries on a U.S. dollar basis, and the results of Sony Music Entertainment (Japan) Inc., a Japan-based music company which aggregates its results in yen.
The results presented in Pictures are a yen-translation of the results of SPE, a U.S.-based operation that aggregates the results of its worldwide subsidiaries on a U.S. dollar basis. Management analyzes the results of SPE in U.S. dollars, so discussion of certain portions of its results is specified as being on “a U.S. dollar basis.
The Financial Services segment results include Sony Financial Holdings Inc. (“SFH”) and SFH’s consolidated subsidiaries such as Sony Life Insurance Co., Ltd., Sony Assurance Inc. and Sony Bank Inc. The results of Sony Life discussed in the Financial Services segment differ from the results that SFH and Sony Life disclose separately on a Japanese statutory basis.
31

Cautionary StatementStatements made in this presentation with respect to Sony’s current plans, estimates, strategies and beliefs and other statements that are not historical facts are forward-looking
statements about the future performance of Sony. Forward-looking statements include, but are not limited to, those statements using words such as “believe,” “expect,” “plans,” “strategy,” “prospects,” “forecast,” “estimate,” “project,” “anticipate,” “aim,” “intend,” “seek,” “may,” “might,” “could” or “should,” and words of similar meaning in connection with a discussion of future operations, financial performance, events or conditions. From time to time, oral or written forward-looking statements may also be included in other materials released to the public. These statements are based on management’s assumptions, judgments and beliefs in light of the information currently available to it. Sony cautions investors that a number of important risks and uncertainties could cause actual results to differ materially from those discussed in the forward-looking statements, and therefore investors should not place undue reliance on them. Investors also should not rely on any obligation of Sony to update or revise any forward-looking statements, whether as a result of new information, future events or otherwise. Sony disclaims any such obligation. Risks and uncertainties that might affect Sony include, but are not limited to:
(i) Sony’s ability to maintain product quality and customer satisfaction with its products and services; (ii) Sony’s ability to continue to design and develop and win acceptance of, as well as achieve sufficient cost reductions for, its products and services, including image sensors,
game and network platforms, smartphones and televisions, which are offered in highly competitive markets characterized by severe price competition and continual new product and service introductions, rapid development in technology and subjective and changing customer preferences;
(iii) Sony’s ability to implement successful hardware, software, and content integration strategies, and to develop and implement successful sales and distribution strategies in light of new technologies and distribution platforms;
(iv) the effectiveness of Sony’s strategies and their execution, including but not limited to the success of Sony’s acquisitions, joint ventures, investments, capital expenditures, restructurings and other strategic initiatives;
(v) changes in laws, regulations and government policies in the markets in which Sony and its third-party suppliers, service providers and business partners operate, including those related to taxation, as well as growing consumer focus on corporate social responsibility;
(vi) Sony’s continued ability to identify the products, services and market trends with significant growth potential, to devote sufficient resources to research and development, to prioritize investments and capital expenditures correctly and to recoup its investments and capital expenditures, including those required for technology development and product capacity;
(vii) Sony’s reliance on external business partners, including for the procurement of parts, components, software and network services for its products or services, the manufacturing, marketing and distribution of its products, and its other business operations;
(viii) the global economic and political environment in which Sony operates and the economic and political conditions in Sony’s markets, particularly levels of consumer spending;(ix) Sony’s ability to meet operational and liquidity needs as a result of significant volatility and disruption in the global financial markets or a ratings downgrade;(x) Sony’s ability to forecast demands, manage timely procurement and control inventories; (xi) foreign exchange rates, particularly between the yen and the U.S. dollar, the euro and other currencies in which Sony makes significant sales and incurs production costs, or
in which Sony’s assets, liabilities and operating results are denominated; (xii) Sony’s ability to recruit, retain and maintain productive relations with highly skilled personnel;(xiii) Sony’s ability to prevent unauthorized use or theft of intellectual property rights, to obtain or renew licenses relating to intellectual property rights and to defend itself against
claims that its products or services infringe the intellectual property rights owned by others;(xiv) the impact of changes in interest rates and unfavorable conditions or developments (including market fluctuations or volatility) in the Japanese equity markets on the revenue
and operating income of the Financial Services segment;(xv) shifts in customer demand for financial services such as life insurance and Sony’s ability to conduct successful asset liability management in the Financial Services segment;(xvi) risks related to catastrophic disasters or similar events;(xvii) the ability of Sony, its third-party service providers or business partners to anticipate and manage cybersecurity risk, including the risk of unauthorized access to Sony’s
business information and the personally identifiable information of its employees and customers, potential business disruptions or financial losses; and(xviii) the outcome of pending and/or future legal and/or regulatory proceedings.
Risks and uncertainties also include the impact of any future events with material adverse impact. Important information regarding risks and uncertainties is also set forth in Sony’s most recent Form 20-F, which is on file with the U.S. Securities and Exchange Commission.
32