FY2017/2018 Results Announcement First Quarter … Results Announcement First Quarter ended 30...
38
FY2017/2018 Results Announcement First Quarter ended 30 September 2017 16 November 2017
Transcript of FY2017/2018 Results Announcement First Quarter … Results Announcement First Quarter ended 30...

FY2017/2018 Results AnnouncementFirst Quarter ended 30 September 2017
16 November 2017

2
SIME DARBY PURE PLAY EXERCISE
3
Transaction Overview
Source: Shareholding Structure as at 15 Oct’17 based on Bloomberg
Sime Darby
Plantation PropertyTrading,
Logistics & Others
SD Plantation
SD Property
100% 100%
Other UTFs (PNB)
PNB OthersEPF KWAP
Conglomerate group structure involved in distinct businesses, i.e. plantation, property, trading, logistics &
others
Listed company
Existing Corporate Structure
11.12% 5.61%6.15% 5.45%
SD Plantation
SD Property
Trading, Logistics &
Others
Plantation Business
Property Business
Sime Darby
Listed company
Listed company
Listed company
Same set of shareholders will continue to hold the same
shareholding in each entity
Corporate Structure Post Proposals
30.88%
ASB
40.79%
Other UTFs (PNB)
PNB OthersEPF KWAP
11.12% 5.61%6.15% 5.45% 30.88%
ASB
40.79%
4
Milestones Following Actual Listing Submission
Assuming Listing by End November (EGM on 20 November 2017)
26 OctThu
• Securities Commission (SC)’s and SC Equity Compliance Unit’s approvals obtained
20 NovMon
EGM
Target End Nov
4 NovSat
Submission of confirmation of registration of Prospectus to the SC
• Listing
• Issuance of Prospectus
• Despatch of Circular to Sime Darby Berhad’sshareholders
24 AugThu
• The approval from the Board of Sime Darby Berhad on the Proposals including the capitalisation, share split, distribution and listing of the Identified Entities obtained
3 NovFri
• Announcement of notice of Extraordinary General Meeting (“EGM”)

5
The Listing Reference Price
Share price of RM9.05 and market cap of RM61.55bn
Share price of RM9.20 and market cap of RM62.57bn
Companies Percentage allocation range
Reference price
(RM/share)
Market Cap (RM’bn)
Reference Price
(RM/share)
Market Cap(RM’bn)
Sime Darby Plantation
60% to 68% Min: 5.43Max: 6.15
36.93 - 41.82Min: 5.52Max: 6.26
37.54 - 42.55
Sime Darby Property
16% to 19% Min: 1.45Max: 1.72
9.85 - 11.70Min: 1.47Max: 1.75
10.01 - 11.89
Adjusted Share Price:
Sime Darby Berhad
13% to 24% 1.18 – 2.17 8.00 - 14.78 1.20 – 2.21 8.13 - 15.02
Adjustment to Sime Darby Berhad’s share price
Share price will be adjusted by subtracting the listing reference price of the Identified Entities from the last closing price ofSime Darby Berhad’s shares
This is to ensure that the total net worth position of our shareholders will be the same before and after the ProposedDistribution.
The listing reference price of the Identified Entities shall fall within the percentage allocation range stated below, which represents the percentage to be applied to the closing price of Sime Darby’s shares on the last day of cum entitlement trading.

6
SIME DARBY BERHAD

7
Sime Darby Berhad Financial HighlightsFirst Quarter of FY2018
RM’mn 1Q FY2018 1Q FY2017 % YoY Change
C o n t i n u i n g O p e r a t i o n s
Revenue 8,144 6,934 +18%
PBIT 356 263 +35%
PBT 376 312 +21%
PATAMI 248 216 +15%
Basic EPS (RM sen) 3.6 3.4 +6%
D i s c o n t i n u i n g O p e r a t i o n s
PBIT 1,249 517 +142%
PATAMI 1,068 306 +249%
Basic EPS (RM sen) 15.7 4.8 +227%
T O T A L
PBIT 1,605 780 +106%
PATAMI 1,316 522 +152%
Basic EPS (RM sen) 19.3 8.2 +135%

8
Snapshot of Borrowings Position Sime Darby Berhad as at 30 September 2017
18%Debt/Equity Ratio
RM1.9bnBank balances,
deposits and cash
Long term borrowings
20%
Short term borrowings80%
RM15.5bnTotal Equity¹
RM2.8bn
Total BorrowingsAs at 30 Sep’17
¹ Proforma for continuing operations

9
Industrial DivisionImproving Business Conditions and Disposal Gains
1Q FY2018
External Revenue
RM2,948mn (36% YoY)1QFY17: RM2,164mn
PBIT RM247mn (384% YoY)1QFY17: RM51mn
MalaysiaRM21mn, 40% YoY (1QFY17: RM15mn)
• Gain on land disposal of RM9mn
Singapore
RM-6mn, <-100% YoY (1QFY17: RM-2mn)
• Due to the deferment by shipyard customers for engine and share of losses from APAC of RM15mn in Singapore (1QFY17: RM2mn)
China/HK
RM25mn, +47% YoY (1QFY17: RM17mn)
• Higher equipment deliveries and lower operating costs in the mining and construction sectors
Australasia
RM207mn, >+100% YoY (1QFY17: RM21mn)
• Gain on disposal of three Australian properties of RM156mn• Improved contribution from new equipment sales to the construction and mining
sectors• Better margin realisation from the product support sales
10
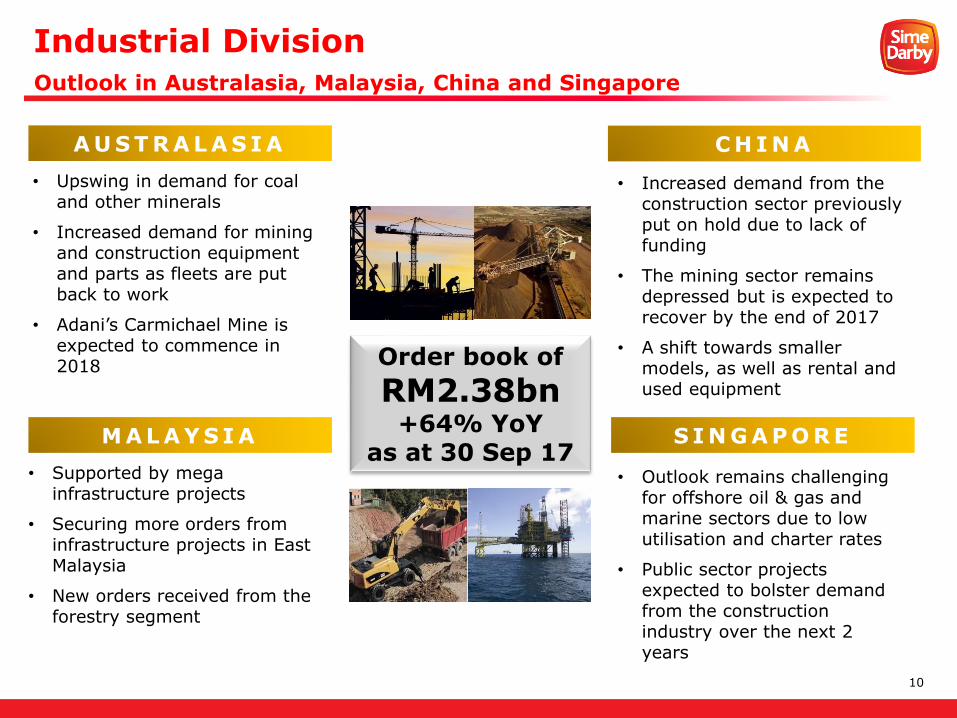
Industrial DivisionOutlook in Australasia, Malaysia, China and Singapore
M A L A Y S I A
C H I N A
S I N G A P O R E
• Supported by mega infrastructure projects
• Securing more orders from infrastructure projects in East Malaysia
• New orders received from the forestry segment
• Increased demand from the construction sector previously put on hold due to lack of funding
• The mining sector remains depressed but is expected to recover by the end of 2017
• A shift towards smaller models, as well as rental and used equipment
Order book of
RM2.38bn+64% YoY
as at 30 Sep 17
A U S T R A L A S I A
• Upswing in demand for coal and other minerals
• Increased demand for mining and construction equipment and parts as fleets are put back to work
• Adani’s Carmichael Mine is expected to commence in 2018
• Outlook remains challenging for offshore oil & gas and marine sectors due to low utilisation and charter rates
• Public sector projects expected to bolster demand from the construction industry over the next 2 years

11
1Q FY2018
External Revenue
RM5,106mn (+9% YoY)1QFY17: RM4,689mn
PBIT RM112mn (-14% YoY)1QFY17: RM130mn
MalaysiaRM37mn, +85% YoY (1QFY17: RM20mn)
• Improved profit from vehicle sales and assembly business
South East Asiaex. M’sia
RM-42mn, <-100% YoY (1QFY17: RM32mn)
• An impairment on the distribution rights in Vietnam of RM61mn• Singapore’s PBIT of RM30mn, +15% YoY driven by the luxury market segment
China/HK/Macau/Taiwan
RM87mn, +55% YoY (1QFY17: RM56mn)
• Improvement in sales of luxury and the super luxury segment• Land compensation for a property in Shanghai of RM41mn
Australia/NZ
RM30mn, +36% YoY (1QFY17: RM22mn)
• Strong performance by the Trucks segment in NZ • Improved contribution as a result of cessation of Peugeot and Citroen operations
in Australia and NZ
Motors DivisionImprovements in Malaysia, China/HK and NZ

12
Motors DivisionKey Highlights in 1QFY18 and Outlook
20,308+0.5% YoY
Units Sold in 1QFY18 Upcoming New Launches in 2QFY18
Driven by higher number of units sold in Singapore,
Thailand, Malaysia, Hong Kong and Taiwan
Outlook In Key Markets
BMW X3
Improved consumer sentiments coupled with higher loan approval rates
Lower certificate of entitlements quota in 2H17 due to lower vehicle deregistration volume is expected to reverse the positive growth witnessed in 1H17
Modest growth in new vehicle sales given lower interest rates, announcement of tax cuts and sales promotions
Steady demand for luxury cars is expected on the back of upcoming new model launches
Modest recovery underpinned by low inflation and stable interest rates
BMW M5
Land Rover DiscoveryHyundai Tucson Premium 4WD

13
Logistics Division & Other BusinessesDriven By Increased Port Throughput and Higher Profit from Healthcare
¹ Restated, 1QFY17 included a gain on disposal of 10% stake and convertible warrants in Eastern & Oriental Berhad of RM35mn
1Q FY2018 LOGISTICS OTHER BUSINESSES
External Revenue
RM83mn (+19% YoY)1QFY17: RM70mn
External Revenue
RM7mn (-36% YoY)1QFY17: RM11mn1
PBIT RM18mn (+50% YoY)1QFY17: RM12mn
PBIT RM12mn (-70% YoY)1QFY17: RM40mn1
Weifang and Jining Ports
RM11mn, +83% YoY(1QFY17: RM6mn)
• Higher total port throughput of 19% from 5.7mn MT to 6.8mn MT at Weifang Port
• Lower throughput and average realised tariff rate at JiningPorts as a result of tighter environmental controls
Tesco M’siaSdn Bhd
RM0mn, <-100% YoY(1QFY17: RM-1mn)
• No further share of losses as the Group’s cost of investment in Tesco has been zerorised
Insurance Broking
RM0mn, <-100% YoY (1QFY17: RM2mn)
• Lower external renewals at SD Lockton Insurance Brokers
Weifang Water
Management
RM7mn, +17% YoY(1QFY17: RM6mn)
• Higher water sales volume at10.7mn m³ as compared to10.4mn m³ in 1QFY17
Ramsay Sime Darby Health Care
RM12mn, +33% YoY(1QFY17: RM9mn)
• Higher revenue due to higher outpatient visits in all 3 hospitals in Malaysia
14
SIME DARBY PLANTATION

15
Sime Darby Plantation Financial HighlightsStellar Performance in 1Q FY2018
in RM’mn 1Q FY2018 1Q FY2017 YoY %
Revenue 3,541 2,819 +26%
Operating Profit 1,281 344 +272%
One-offs1: RM771mn
PBIT 1,284 329 +290%
PBT 1,239 227 +446%
PATAMI 1,019 151 +575%
Basic EPS (RM sen) 169.8 25.2 +574%
Proforma Basic EPS2
(RM sen)15.0 2.2 +582%
2 Pursuant to Share Split and Distribution, assume 6,800,839,377 number of shares
1 One-offs refer to the gain on sale of land to Sime Darby Property of RM676mn and reversal of accrual for donation of RM95mn
16
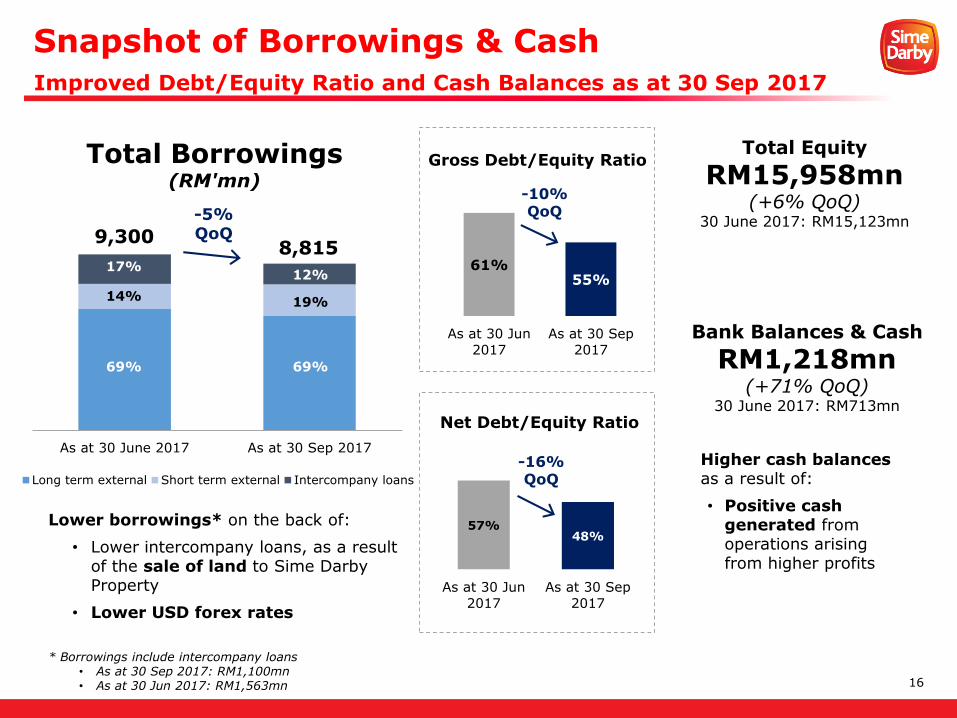
As at 30 June 2017 As at 30 Sep 2017
Total Borrowings (RM'mn)
Long term external Short term external Intercompany loans
Lower borrowings* on the back of:
• Lower intercompany loans, as a result of the sale of land to Sime Darby Property
• Lower USD forex rates
Snapshot of Borrowings & CashImproved Debt/Equity Ratio and Cash Balances as at 30 Sep 2017
-5%QoQ
61%55%
As at 30 Jun
2017
As at 30 Sep
2017
-10%QoQ
Gross Debt/Equity Ratio
Bank Balances & Cash
RM1,218mn(+71% QoQ)
30 June 2017: RM713mn
Higher cash balances as a result of:
• Positive cash generated from operations arising from higher profits
57%48%
As at 30 Jun
2017
As at 30 Sep
2017
-16%QoQ
Net Debt/Equity Ratio
Total Equity
RM15,958mn(+6% QoQ)
30 June 2017: RM15,123mn
* Borrowings include intercompany loans• As at 30 Sep 2017: RM1,100mn• As at 30 Jun 2017: RM1,563mn
69% 69%
19%
12%
14%
17%
8,8159,300

17
Financial PerformanceStrong Contribution from Upstream Operations in 1QFY2018
1Q FY2018
External Revenue
RM3,541mn (+26% YoY)1QFY17: RM2,819mn
PBIT RM1,284mn (+290% YoY)1QFY17: RM329mn
Upstream
RM1,208mn+359% YoY
(1QFY17:RM263mn)
• PBIT excluding one-offs:RM437mn, +66% YoY
Downstream & Others
RM76mn+15% YoY
(1QFY17: RM66mn)
• Downstream: Declined 5% from RM74mn to RM70mn due to lower profit generated by refineries in Malaysia & Europe
Lower sales volume and lower margin on the back of higher feedstock costs
o Partially mitigated by favourable performance of Indonesiaoperations due to higher sales volume and margin
• Others: Registered a profit of RM6mn from a loss of RM8mn in 1QFY17, due to the turnaround reported by Emery Group arising from initiatives implemented to improve its operations
FFB production
2.70mn MT, +25% YoY (1QFY17: 2.15mn MT)
Average CPO price realised
RM2,693/MT, +4% YoY (1QFY17: RM2,592/MT)

18
UpstreamHigh Profit Contributions from Malaysia, Indonesia and PNG
* The Liberia operation registered higher losses mainly due to the increase in mature area which led to higher depreciation
305 1QFY2017 1QFY2018
Malaysia
43
1QFY2017 1QFY2018
Indonesia
117
12
38
1QFY2017 1QFY2018
PNG
-12 -23
1QFY2017 1QFY2018
Liberia*
263 437
1QFY2017 1QFY2018
Group
Rise in core Upstream PBIT by +66% YoY due to higher FFB production and CPO price realised
39%
220
1.26 0.57 0.32 0.003 2.151.55 0.72 0.400.014
2.70
Malaysia Indonesia PNG Liberia Group
FFB Production (mn MT)
+23%
+27% +322%
+25%
+26%
4.88 3.35 4.25 0.83 4.246.12 4.47 5.29 1.46 5.38
Malaysia Indonesia PNG Liberia Group
FFB Yield (MT/ha)
+25%
+33%
+24%
+77%
+27%
2,618 2,582 2,503 1,924 2,592
2,730 2,635 2,690 2,220 2,693
Malaysia Indonesia PNG Liberia Group
+4%+2%
+8%
+15%
+4%
Avg. CPO Price Realised(RM/MT)
FFB production and yield improvements due to focused efforts on the ground to improve operational performance
1QFY2017 1QFY2018
172%217%
66%92%
305

19
Strategic InitiativesFocused Execution Remains Paramount
WATER MANAGEMENT
Mitigating El Nino and La Nina: Efficient water
management system
Micro Sprinkler
Water Reservoirs
DamiSuper Family Seeds
Potential Oil Yield 9 MT/Ha
ACCELERATED REPLANTING WITH SUPERIOR HIGH YIELDING MATERIAL
ENHANCING OER AND MILL EFFICIENCY
Genome Select
Material Potential Oil Yield
11 MT/Ha
• 100 ha planted
• By Apr’18: 500 ha
New progenies
Water Pump
Addressing human capital challenges:• In the near and long term• Improving productivity
Ensuring competitive yields:Accelerated replanting at 5-7%
• Oil loss reduction via increased efficiency
• Ensuring highfood safety standards
MECHANISATION DOWNSTREAM
Continuous efforts to manage cost and improve margins:
• Increase Differentiated:Commodityproduct ratio
• Higher lean six sigma (LSS) savings
• Better capacity utilisation rate

20
SIME DARBY PROPERTY

21
Lagong
Kota Elmina
Saujana Impian
Pulau Tikus
Georgetown
Melaka
Johor Bahru
Kuala Lumpur
Seremban
MALAYSIA
SINGAPORE
Hamilton Labuan Buleh
City of Elmina Denai Alam Bukit Jelutong
Ara Damansara Taman Melawati KL East
Putra Heights
ALYA Kuala Lumpur Subang Jaya City Centre (SJCC)
SJ 7
Nilai Impian Nilai Impian 2 Bandar Ainsdale Nilai Utama
Bandar Universiti Pagoh
Bandar Bukit Raja Bandar Bukit Raja 2 & 3
Serenia City
TownshipsIntegrated development
Landbank HSR Hubs
20,763 acresRemaining Developable Land Bank
1,880 acreslocated within the MVV region post-completion of the land transfer from SD Plantation
12,026 acreslocated within our existing 23 active townships, integrated and niche developments
RM100.4bnTotal Estimated Gross Development Value (GDV) for the Remaining Developable Land Bank
8,737 acresfor future development
20,599 acresAdditional Land via MVV and Land Option Agreements (5+3 years)
Sime Darby PropertyAn Established Property Developer with the Largest Land Bank in M’sia

22
Forest Reserve
Damansara-Shah Alam Elevated Expressway (DASH)
KL-Kuala Selangor Expressway
(LATAR)
ElminaEast
Bukit Subang
DenaiAlam
RRI
B. BukitRaja 1 Subang Jaya
AraDamansara
BukitJelutong
Setia ECO Park
Setia Alam
MRT
ElminaWest
Kota Elmina
LagongGamuda Garden
Sime Darby PropertyStrategic Land Bank in Key Growth Areas and Economic Corridors
SDP’s land bank
Guthrie Corridor Expressway
Legend
DASH Highway
Our current and upcoming developments along Guthrie Corridor Expressway and West Coast Expressway have access to great connectivity
C U R R E N T A D D I T I O N
Phase 1
Additional 8,793 acres
SDP’s exposure in Malaysia Vision Valley3,196 acres – identified for Phase 1 Development(An additional 8,793 acres via the MVV Option Agreement)
To Johor
Bahru

23¹ Excludes corporate expenses
RM’mn 1Q FY2018 1Q FY2017 % YoY Change
C o n t i n u i n g O p e r a t i o n s
Revenue 464 444 +4%
PBIT 420 184 +129%
PBT 419 173 +142%
PATAMI 421 136 +209%
Basic EPS (RM sen) 42 14 +209%
D i s c o n t i n u i n g O p e r a t i o n s
PBIT1 2 0 >+100%
PATAMI 1 13 -93%
Basic EPS (RM sen) 0 1 -93%
T O T A L
PBIT 422 184 +129%
PATAMI 422 149 +183%
Basic EPS (RM sen) 42 15 +183%
Sime Darby Property Financial HighlightsFirst Quarter Ended 30 September 2017
• 1QFY18 PBIT included the gain on disposal of Malaysia Land Development Company Bhd of RM41mn and the gain on disposal of 40% equity stake in Seriemas Development Sdn Bhd of RM278mn
• 1QFY17 PBIT included the gain on disposal of Sime Darby Property (Alexandra) Pte Ltd of RM130mn• Excluding the exceptional items, the PBIT of the continuing operations for 1Q FY2018 was RM101mn against
RM54mn in 1Q FY2017, representing an increase of 87%

24
RM’mn 1Q FY2018
C o n t i n u i n g O p e r a t i o n s
External Revenue
RM464mn (+4% YoY)1QFY17: RM444mn
Segment Results
RM101mn (+87% YoY)1QFY17: RM54mn
Property Development
RM115mn+191% YoY
(1QFY17: RM40mn)
• Share of profit of RM87mn from Battersea Power Station project (1QFY17: Loss of RM1mn)
• Higher contribution from Elmina West, Elmina East and Serenity Cove, a project in Gold Coast, Australia
Property Investment
RM-7mn<-100% YoY
(1QFY17: RM8mn)
• Share of loss of RM5mn from Sime Darby CapitaLand (Melawati Mall) Sdn Bhd• Melawati Mall was opened in Jul’17 and is still in its
early stage of operation with occupancy of about 60%
Leisure and Hospitality
RM-7mn<-100% YoY
(1QFY17: RM6mn)
• 1QFY17 included the reversal of an impairment of property, plant and equipment of RM10mn
Sime Darby Property Financial HighlightsHigher Battersea Contribution & Better Earnings From Key Townships

25
* Includes Cash held under Housing Development Accounts
Long-term Borrowings
79%
Short-term Borrowings
21%
Total Borrowings
RM1,100mnTotal Borrowings
RM7,150mn
RM1,100mn RM1,048mn
Equity Debt Bank balances,deposits and
cash*
Capital Structure
15%Debt/Equity Ratio
Financial Position as at 30 September 2017Committed Towards Maintaining Optimal Capital Structure
Note: Debt excluded liabilities associated with assets held for sale
26
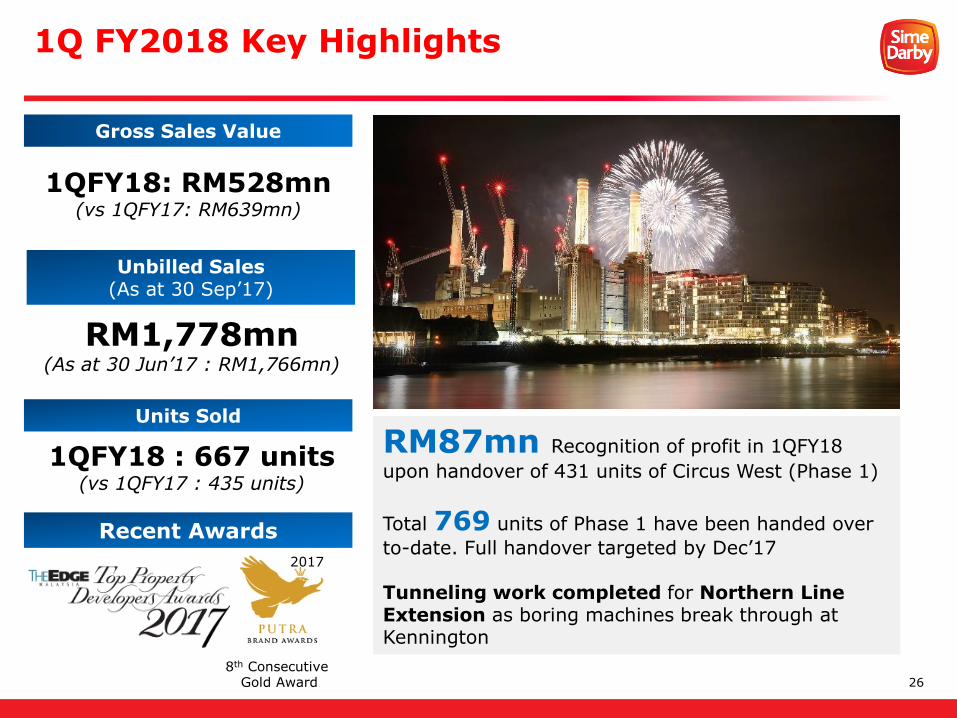
Gross Sales Value
Unbilled Sales (As at 30 Sep’17)
Units Sold
1QFY18 : 667 units(vs 1QFY17 : 435 units)
Recent Awards
8th ConsecutiveGold Award
2017
1Q FY2018 Key Highlights
RM1,778mn(As at 30 Jun’17 : RM1,766mn)
1QFY18: RM528mn(vs 1QFY17: RM639mn)
RM87mn Recognition of profit in 1QFY18
upon handover of 431 units of Circus West (Phase 1)
Total 769 units of Phase 1 have been handed over
to-date. Full handover targeted by Dec’17
Tunneling work completed for Northern Line Extension as boring machines break through at Kennington

27
Casira 2, Bandar Bukit RajaDouble Storey Link House
Launched Date : July 2017Total Units Launched : 111Total Units Sold : 24Take-up Rate : 22%Estimated GDV : RM88mnAverage Price : RM769K/unit
Castilla 2, Chemara HillsNegeri Sembilan 3-Storey Semi Detached House
Launched Date : Oct 2017Total Units Launched : 34Total Units Sold : 8Take-up Rate : 24%Estimated GDV : RM50mnAverage Price : RM1.57mn/unit
Data as at 31 Oct 2017
Projects Launched in July - October 2017
Elmina Green 1, Elmina WestDouble Storey Link House
Launched Date : Oct 2017Total Units Launched :187Total Units Sold : 136Take-up Rate : 73%Estimated GDV : RM123mnAverage Price : RM778K/unit
Tara, Bukit Jelutong2 & 3 Storey Semi Detached House
Launched Date : Oct 2017Total Units Launched :14Total Units Sold : 8Take-up Rate : 57%Estimated GDV : RM29mnAverage Price : RM2.16mn/unit
T o w n s h i p D e v e l o p m e n t
N i c h e / I n t e g r a t e d D e v e l o p m e n t

28
Liana, Elmina Gardens Double Storey 30’ x 70’ Superlink House
Target Launch : 18 & 19 Nov 2017 @ Elmina PavilionNo of units : 72 Estimated GDV : RM94mnTenure : Freehold
Upcoming Major Launches in FY2018
T o w n s h i p D e v e l o p m e n t
N i c h e / I n t e g r a t e d D e v e l o p m e n t
Lot 15, Subang Jaya City Centre (SJCC) Serviced Apartment
Target Launch : 18 & 19 Nov 2017 @ SJCC GalleryNo of units : 361 Estimated GDV : RM250mnTenure : Freehold
Ferrea, Denai AlamDouble Storey Link House
Target Launch : 1HCY18No of units : 228 Estimated GDV : RM177mnTenure : Freehold
A2, Serenia CityDouble Storey Link House
Target Launch : CY18No of units : 302 Estimated GDV : RM166mnTenure : Freehold
29
Disclaimer
This presentation may contain forward-looking statements by Sime Darby Berhad that reflect management’s
current expectations, beliefs, intentions or strategies regarding the future and assumptions in light of currently
available information. These statements are based on various assumptions and made subject to a number of
risks, uncertainties and contingencies. Actual results, performance or achievements may differ materially and
significantly from those discussed in the forward-looking statements. Such statements are not and should not
be construed as a representation, warranty or undertaking as to the future performance or achievements of
Sime Darby Berhad and Sime Darby Berhad assumes no obligation or responsibility to update any such
statements.
No representation or warranty (either express or implied) is given by or on behalf of Sime Darby Berhad or its
related corporations (including without limitation, their respective shareholders, directors, officers, employees,
agents, partners, associates and advisers) (collectively, the "Parties") as to the quality, accuracy, reliability or
completeness of the information contained in this presentation (collectively, the "Information"), or that
reasonable care has been taken in compiling or preparing the Information.
None of the Parties shall be liable or responsible for any budget, forecast or forward-looking statements or
other projections of any nature or any opinion which may have been expressed in the Information.
The Information is and shall remain the exclusive property of Sime Darby Berhad and nothing herein shall
give, or shall be construed as giving, to any recipient(s) or party any right, title, ownership, interest, license or
any other right whatsoever in or to the Information herein. The recipient(s) acknowledges and agrees that this
presentation and the Information are confidential and shall be held in complete confidence by the recipient(s).
No part of this presentation is intended to or construed as an offer, recommendation or invitation to subscribe
for or purchase any securities in Sime Darby Berhad.

30
THANK YOU
SIME DARBY INVESTOR RELATIONS
+(603) 2691 4122
http://www.simedarby.com/Overview.aspx

31
APPENDICES

32
Sime Darby BerhadBreakdown of External Revenue By Regions
In RM’mn 1QFY2018 1QFY2017 YoY %
Industrial
Malaysia 285 322 -11%SE Asia ex Malaysia 156 129 21%China/HK 775 486 59%Australasia 1,732 1,227 41%
2,948 2,164 36%Motors
Malaysia 882 725 22%SE Asia ex Malaysia 1,357 1,219 11%China/HK/Macau 2,090 1,924 9%Australia / NZ 777 821 -5%
5,106 4,689 9%Logistics
Ports 66 55 20%Water 17 15 13%
83 70 19%Others 7 11 -36%
TOTAL 8,144 6,934 17%
33
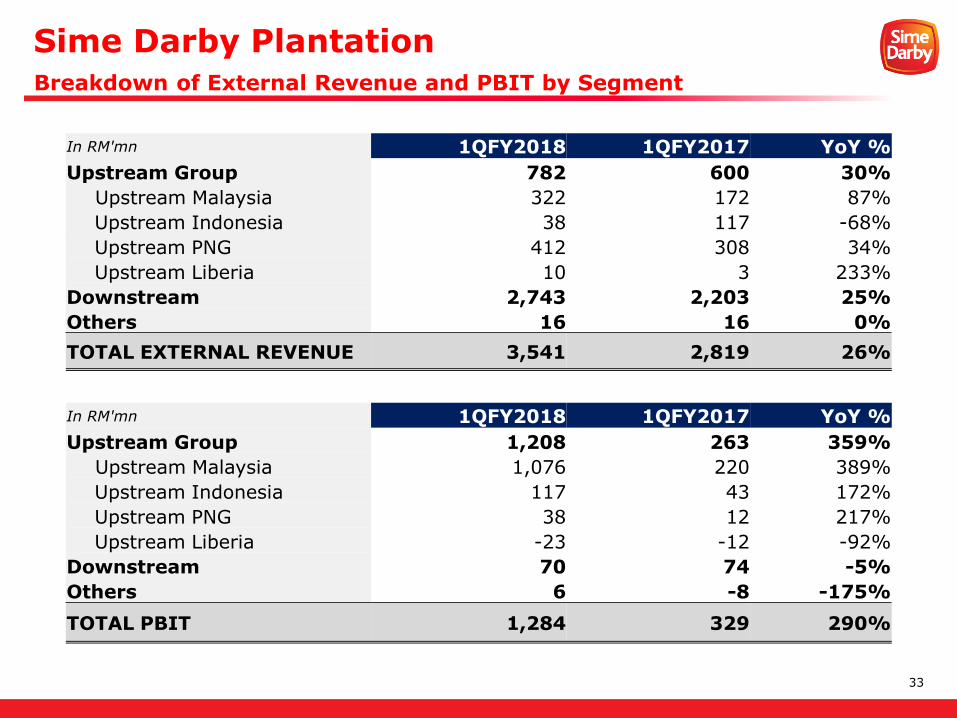
Sime Darby PlantationBreakdown of External Revenue and PBIT by Segment
In RM'mn 1QFY2018 1QFY2017 YoY %
Upstream Group 782 600 30%
Upstream Malaysia 322 172 87%
Upstream Indonesia 38 117 -68%
Upstream PNG 412 308 34%
Upstream Liberia 10 3 233%
Downstream 2,743 2,203 25%
Others 16 16 0%
TOTAL EXTERNAL REVENUE 3,541 2,819 26%
In RM'mn 1QFY2018 1QFY2017 YoY %
Upstream Group 1,208 263 359%
Upstream Malaysia 1,076 220 389%
Upstream Indonesia 117 43 172%
Upstream PNG 38 12 217%
Upstream Liberia -23 -12 -92%
Downstream 70 74 -5%
Others 6 -8 -175%
TOTAL PBIT 1,284 329 290%

34
Malaysia
YoY %
Indonesia
YoY %
PNG
YoY %
Liberia
YoY %
Group
YoY %30
Sep’17
30 Sep’16
30 Sep’17
30 Sep’16
30 Sep’17
30 Sep’16
30 Sep’17
30 Sep’16
30 Sep’17
30 Sep’16
FFB Production (mn MT)
1.55 1.26 +23% 0.72 0.57 +26% 0.40 0.32 +27% 0.014 0.003 +322% 2.70 2.15 +25%
FFB Yield per mature ha (MT/Ha)
6.12 4.88 +25% 4.47 3.35 +33% 5.29 4.25 +24% 1.46 0.83 +77% 5.38 4.24 +27%
CPO Production (mn MT)
0.37 0.28 +30% 0.19 0.15 +27% 0.12 0.09 +31% 0.003 0.0007 +390% 0.69 0.53 +30%
PK Production (mn MT)
0.09 0.07 +39% 0.04 0.03 +35% 0.03 0.02 +34% 0.0005 - - 0.17 0.12 +37%
CPO Extraction Rate (%)
20.2 21.0 -4% 21.3 21.3 +0% 22.7 22.4 +1% 20.6 20.2 +2% 20.9 21.3 -2%
PK Extraction Rate(%)
5.1 4.9 +3% 4.8 4.5 +7% 5.9 5.7 +3% 2.9 - - 5.1 4.9 +4%
Average CPO Selling Price (RM/MT)
2,730 2,618 +4% 2,635 2,582 +2% 2,690 2,503 +8% 2,220 1,924 +15% 2,693 2,592 +4%
Average PK Selling Price (RM/MT)
2,162 2,555 -15% 1,901 1,940 -2% - - - - - - 2,111 2,442 -14%
Sime Darby PlantationSummary of Operational Statistics as at 30 September 2017

35
KalimantanPlanted : 129,229 haLandbank : 175,133 ha
SarawakPlanted : 38,894 haLandbank : 47,280 ha
SulawesiPlanted : 3,952 haLandbank : 4,712 ha
SabahPlanted : 46,375 haLandbank : 53,796 ha
Peninsular MalaysiaPlanted : 229,758 haLandbank : 242,883 ha
SumateraPlanted : 70,778 haLandbank : 99,846 ha
LiberiaPlanted : 10,508 haLandbank : 220,000 ha
Papua New Guinea(PNG) & Solomon Islands (SI)Planted : 101,062 haLandbank : 139,903 ha
As at 30 Sep’17 Malaysia Indonesia Liberia PNGSolomon Islands
Group
Land bank (ha) 343,959 279,691 220,000 131,588 8,315 983,553
Oil Palm Planted Area (ha) 303,367 202,191 10,401 79,729 6,764 602,452
Rubber Planted Area (ha) 11,660 1,768 107 - - 13,535
Sugarcane Planted Area (ha) - - - 5,613 - 5,613
Grazing Pastures Area (ha) - - - 8,956 - 8,956
Sime Darby PlantationUpstream Geographical Coverage as at 30 September 2017

36
17%
20%
37%
18%
8%
10%
90%
17%
18%
34%
24%
7%
GROUP
12%
24%
47%
12%
5%
20%
9%
25%
39%
7%
MALAYSIA INDONESIA
LIBERIA PNG
Immature 4 – 8 Years 9 – 18 Years 19 – 22 Years Above 22 Years
Sime Darby has 602,452 ha of oil palm planted area of which 83% is mature and
17% is immature
12.6 yrsAverage Palm
Tree Age
14.3 yrsAverage Palm
Tree Age
4.7 yrsAverage Palm
Tree Age
11.9 yrsAverage Palm
Tree Age
12.9 yrsAverage Palm
Tree Age
Sime Darby PlantationOil Palm Age Profile as at 30 September 2017

37
EXTERNAL REVENUE
In RM'mn 1QFY2018 1QFY2017 YoY %
Continuing Operations
Property Development 424 398 7%
Property Investment 12 17 -29%
Leisure and Hospitality 28 29 -3%
Sub-total 464 444 4%
Discontinuing Operation 9 13 -33%
Total External Revenue 473 457 3%
PBIT
In RM'mn 1QFY2018 1QFY2017 YoY %
Continuing Operations
Property Development 393 40 893%
Property Investment (7) 139 -105%
Leisure and Hospitality 34 6 509%
Sub-total 420 184 128%
Discontinuing Operation 2 - >+100%
Total PBIT 422 184 129%
Sime Darby PropertyBreakdown of External Revenue and PBIT By Segment
38
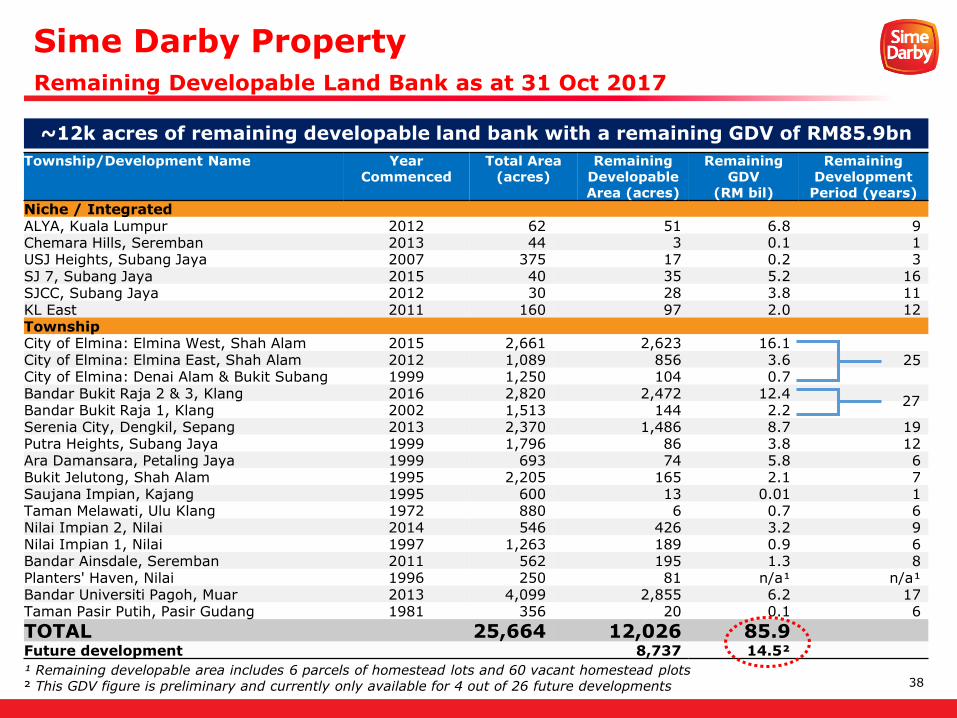
~12k acres of remaining developable land bank with a remaining GDV of RM85.9bn
¹ Remaining developable area includes 6 parcels of homestead lots and 60 vacant homestead plots² This GDV figure is preliminary and currently only available for 4 out of 26 future developments
Township/Development Name YearCommenced
Total Area (acres)
Remaining Developable Area (acres)
RemainingGDV
(RM bil)
Remaining Development
Period (years)
Niche / IntegratedALYA, Kuala Lumpur 2012 62 51 6.8 9Chemara Hills, Seremban 2013 44 3 0.1 1USJ Heights, Subang Jaya 2007 375 17 0.2 3SJ 7, Subang Jaya 2015 40 35 5.2 16SJCC, Subang Jaya 2012 30 28 3.8 11KL East 2011 160 97 2.0 12TownshipCity of Elmina: Elmina West, Shah Alam 2015 2,661 2,623 16.1City of Elmina: Elmina East, Shah Alam 2012 1,089 856 3.6 25City of Elmina: Denai Alam & Bukit Subang 1999 1,250 104 0.7Bandar Bukit Raja 2 & 3, Klang 2016 2,820 2,472 12.4Bandar Bukit Raja 1, Klang 2002 1,513 144 2.2Serenia City, Dengkil, Sepang 2013 2,370 1,486 8.7 19Putra Heights, Subang Jaya 1999 1,796 86 3.8 12Ara Damansara, Petaling Jaya 1999 693 74 5.8 6Bukit Jelutong, Shah Alam 1995 2,205 165 2.1 7Saujana Impian, Kajang 1995 600 13 0.01 1Taman Melawati, Ulu Klang 1972 880 6 0.7 6Nilai Impian 2, Nilai 2014 546 426 3.2 9Nilai Impian 1, Nilai 1997 1,263 189 0.9 6Bandar Ainsdale, Seremban 2011 562 195 1.3 8Planters' Haven, Nilai 1996 250 81 n/a¹ n/a¹Bandar Universiti Pagoh, Muar 2013 4,099 2,855 6.2 17Taman Pasir Putih, Pasir Gudang 1981 356 20 0.1 6
TOTAL 25,664 12,026 85.9Future development 8,737 14.5²
27
Sime Darby PropertyRemaining Developable Land Bank as at 31 Oct 2017