FY2016 (6/15-5/16) Results Explanatory Meeting July 14… Results... · 1 FY2016 (6/15-5/16)...
26
1 FY2016 (6/15-5/16) Results Explanatory Meeting July 14, 2016 The earnings forecasts appearing in this material are based on the business environment at the present time, and there is the possibility that actual earnings may differ from forecasts for various reasons. Furthermore, only inquiries in Japanese are handled. Inquiries should be direct to Mr. Kasai or Mr. Tamura (045-914-8241) in the Corporate Planning office.
Transcript of FY2016 (6/15-5/16) Results Explanatory Meeting July 14… Results... · 1 FY2016 (6/15-5/16)...

1
FY2016 (6/15-5/16) Results Explanatory Meeting July 14, 2016
The earnings forecasts appearing in this material are based on the business environment at the present time, and there is the possibility that actual earnings may differ from forecasts for various reasons.Furthermore, only inquiries in Japanese are handled.Inquiries should be direct to Mr. Kasai or Mr. Tamura (045-914-8241) in the Corporate Planning office.

2
■■FY2016 Consolidated Results FY2016 Consolidated Results 1.1. Profit and Loss Statement Profit and Loss Statement 2.2. Balance Sheet Balance Sheet 3.3. Statement of Cash Flows 4. Changes in ROEStatement of Cash Flows 4. Changes in ROE5. Changes in Dividend5. Changes in Dividend
■■Results of a main business companyResults of a main business company1.1. Profit and Loss Statement Profit and Loss Statement 2.2. New Store Openings New Store Openings 3. Renovation of existing stores 43. Renovation of existing stores 4.. Sales 5. Prescription Section Sales 5. Prescription Section 6. Gross profit margin 76. Gross profit margin 7.. Expense rate
■■Growth StrategyGrowth Strategy11.. New Store Openings 2. Renovation of existing stores New Store Openings 2. Renovation of existing stores 33. Efforts to improve productivity. Efforts to improve productivity 4. Pharmacy efforts 4. Pharmacy efforts 5. Care Business 65. Care Business 6.. FY2017 Forecasts (Consolidated)FY2017 Forecasts (Consolidated)7. Medium7. Medium--term vision term vision
FY2016 (6/15FY2016 (6/15--5/16) Results Explanatory Meeting 5/16) Results Explanatory Meeting

3
FY2016 FY2016 Consolidated ResultsConsolidated Results
(06/2015 (06/2015 –– 05/2016)05/2016)
4
FY2016 (consolidated)
FY2015 (consolidated)
% of adjustment in
projection
(%)
YoYchange
(%)
Share (%) (million yen)Share
(%)(million yen)
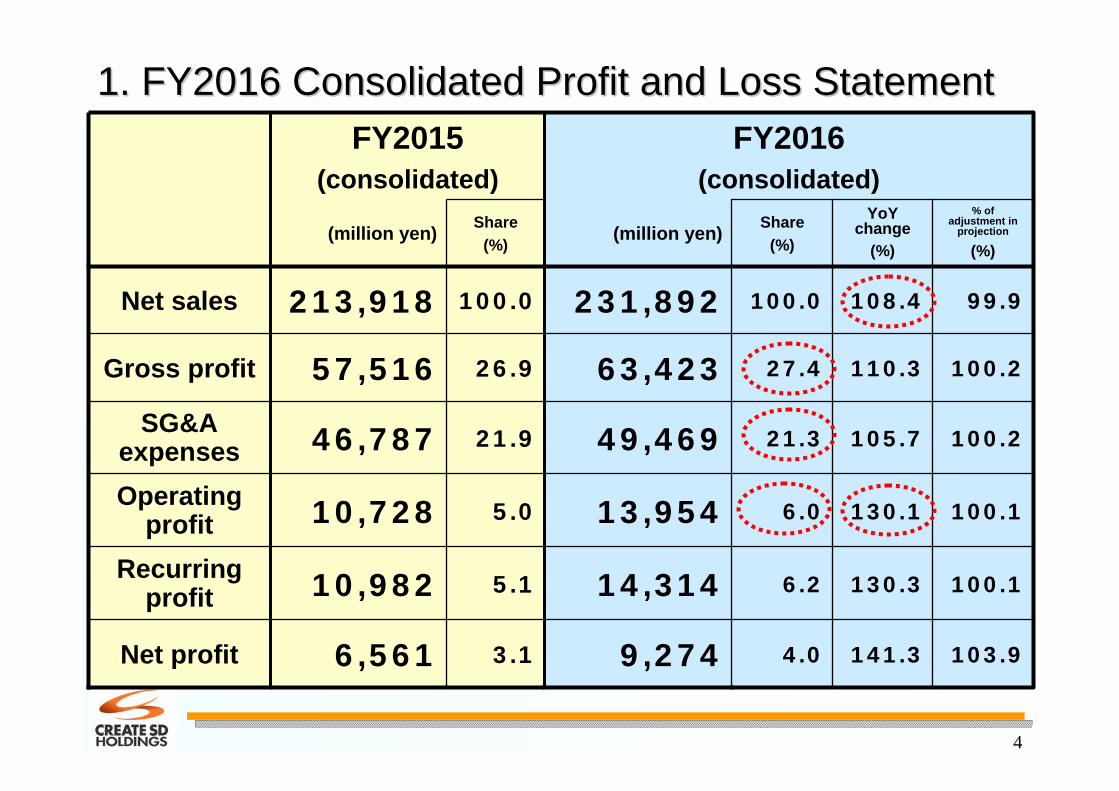
100.2105.721.349,46921.946,787SG&A expenses
103.9
100.1
100.1
100.2
99.9
141.3
130.3
130.1
110.3
108.4
4.0
6.2
6.0
27.4
100.0
3.1
5.1
5.0
26.9
100.0
6,561
10,982
10,728
57,516
213,918
9,274
14,314
13,954
63,423
231,892
Operating profit
Gross profit
Net profit
Recurring profit
Net sales
1. FY2016 Consolidated Profit and Loss Statement 1. FY2016 Consolidated Profit and Loss Statement

5
+7,62453,58545,960Total net assets
+2,37541,76039,384Current liabilities
+2,94245,74942,807Total liabilities
+9,36660,87951,512Current assets
+10,56799,33488,767Total assets
+10,56799,33488,767Total
liabilities and net assets
+5663,9893,422Fixed liabilities
+1,20038,45537,254Fixed assets
Change May 31, 2016 (consolidated)
May 31, 2015 (consolidated)
Total liabilities ・ Accounts payable +1,873 million yen ・ Income taxes payable
+335 million yen
2. FY2016 Consolidated Balance Sheet 2. FY2016 Consolidated Balance Sheet Main causes of changes(million yen)
Total assets ・ Cash equivalent and accounts
receivable +6,643 million yen・ Merchandise +2,305 million yen・ Opening new stores, etc.
Fixed assets +1,200 million yen
Total net assets ・ Decline due to 1,475 million yen
in dividends・ Net profit +9,274 million yen

6
Major breakdown(million yen)
3. FY2016 Consolidated Statement of Cash Flows 3. FY2016 Consolidated Statement of Cash Flows
+93320,26819,335Opening balance of cash and cash equipments
+5,1526,085933Change in cash and cash equivalents
+693-4,282-4,975Cash flow from investing activities
+3211,84311,811Cash flow from operating activities
+6,08526,35420,268Closing balance of cash and cash equipments
+4,426-1,475-5,901Cash flow from financing activities
Change FY2016 (consolidated)
FY2015 (consolidated)
・ Acquisition of fixed tangible assets due to store openings and renovation
-3,518 million yen ・ Joint loans for constraction
-582 million yen ・ Construction in progress
-756 million yen
・ Net profit before taxes 13,906 million yen ・ Depreciation 2,942 million yen ・ Corporate taxes paid -5,029 million yen
・ Dividend payment -1,475 million yen
7
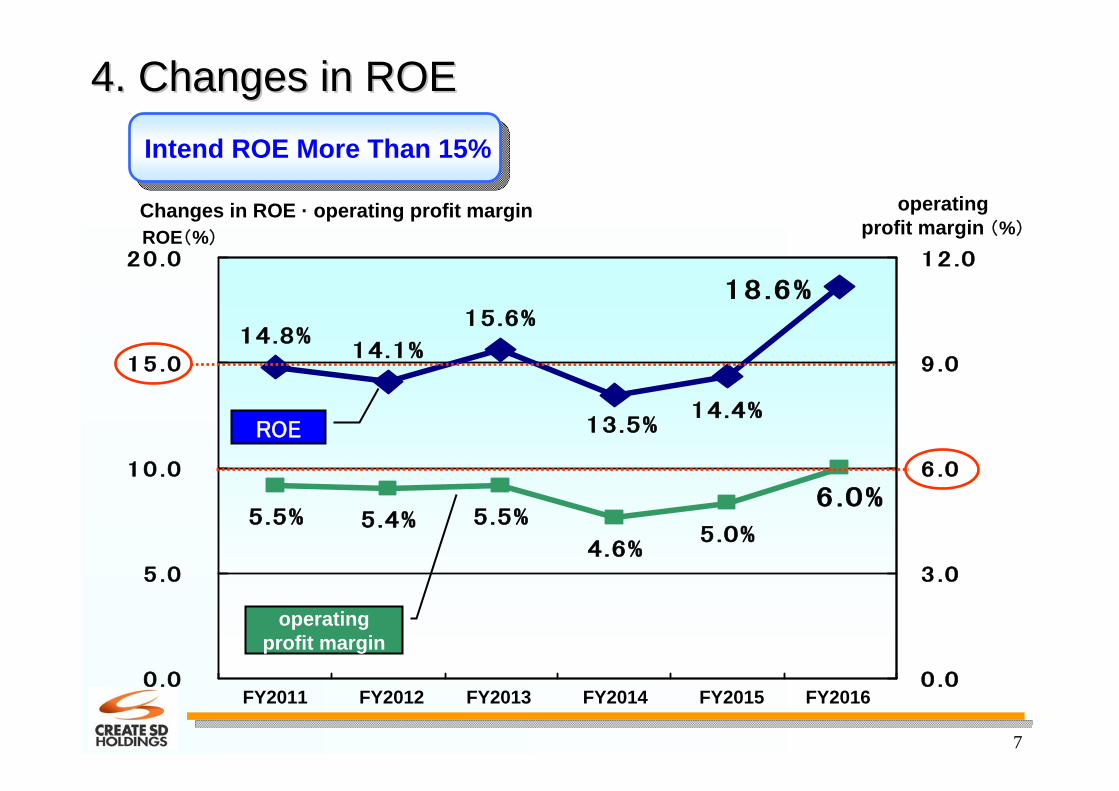
4. Changes in ROE4. Changes in ROE
Changes in ROE · operating profit margin
15.6%18.6%
14.4%13.5%
14.1%14.8%
6.0%
5.0%4.6%
5.5%5.4%5.5%
0.0
5.0
10.0
15.0
20.0
0 .0
3 .0
6 .0
9 .0
12.0ROE(%)
operating profit margin (%)
operating profit margin
ROE
Intend ROE More Than 15% Intend ROE More Than 15%
FY2011 FY2012 FY2013 FY2014 FY2015 FY2016

8
0
10
20
30
40
50
60
70
80
90
5. Changes in Dividend5. Changes in Dividend
(yen)・Conducted a stock split in 2015 December・FY2016 performance is stock split before conversion
FY2016 performanceDividend payout ratio 18.2%Dividend on Equity 3.4%
FY2016 performanceDividend payout ratio 18.2%Dividend on Equity 3.4%
50yeninitial
projection70yen
45yen54yen 58yen
65yen
80yen
Stable and Sustainable Increase in Dividend
Stable and Sustainable Increase in Dividend
Change in dividend per stock
FY2011 FY2012 FY2013 FY2014 FY2015 FY2016

9
Results of a main business Results of a main business companycompany

10
FY2016 FY2015% of
adjustment in projection
(%)
YoYchange
(%)
Share(%)(million yen)Share
(%)(million yen)
100.3105.921.850,13622.347,358SG&A expenses
104.8
100.0
100.0
100.2
99.9
143.3
131.9
131.7
110.4
108.4
3.9
5.9
5.8
27.6
100.0
2.9
4.9
4.8
27.1
100.0
6,256
10,366
10,118
57,476
212,274
8,966
13,672
13,321
63,458
230,145
Operating profit
Gross profit
Net profit
Recurring profit
Net sales
1. FY2016 Profit and Loss Statement (Create SD) 1. FY2016 Profit and Loss Statement (Create SD)

11
2. New Store Openings2. New Store Openings28 new OTC stores and 6 ethical pharmacies were opened
(of which 2 were dedicated prescription pharmacies) 28 new OTC stores and 6 ethical pharmacies were opened
(of which 2 were dedicated prescription pharmacies)
412001in-store
pharmacies
28222418OTC
Dedicated prescription pharmacies 0
Other
2
Kanagawa
2000
New stores opened in
FY2016
TotalChibaShizuokaTokyoNew store openings by area
・Drug Stores closing: 2 were S&B , 1 was contract expiration ・Dedicated prescription pharmacies closing: 1 was contract expiration ・In-store pharmacies closing : 2 were management efficiency enhancement
23.6%27.0%12.0%18.2%23.8%25.5%Rate of pharmacy
establishment in OTC stores
dedicated prescription pharmacies
in-store pharmacies
O T C 47137256680263
111103121967
2
Other
19
Kanagawa
31307
Total number of stores as of
the end of FY2016
TotalChibaShizuokaTokyo

12
3. Renovation of existing stores3. Renovation of existing stores
・Introduction and expansion of new merchandize including food and miscellaneous products・Improvement of floor space allocation per section to meet sales composition and regional characteristics
・Introduction and expansion of new merchandize including food and miscellaneous products・Improvement of floor space allocation per section to meet sales composition and regional characteristics
Expansion of merchandize and renovation of 21 stores to improve floor space allocation
Expansion of merchandize and renovation of 21 stores to improve floor space allocation
Pharmacy remodeling 5 stores Pharmacy remodeling 5 stores
Expansion of floor space and renovation of the waiting area in profitable in-store pharmacies
Expansion of floor space and renovation of the waiting area in profitable in-store pharmacies
Small-scale renovation of 13 stores to introduce new categoriesSmall-scale renovation of 13 stores to introduce new categories
Renovation of the food section to facilitate the introduction of meat, boxed lunches and prepared meals
Renovation of the food section to facilitate the introduction of meat, boxed lunches and prepared meals

13
96%
98%
100%
102%
104%
106%
108%
110%
44. Sales . Sales
・The main factors: +1.0% increase in the number of customers, an increase of +1.4% per customer, dispensing department +17.2%
・Number of customers increased due to the expansion of merchandize and the EDLP measures
・Average sales per customer rose thanks to the revision of selling prices and the deployment of high-added-value and large-sized products
The top-line ended at +8.4%, boosted by existing stores that posted +3.5%The top-line ended at +8.4%, boosted by existing stores that posted +3.5%
Reaction from the exceptional demand
brought about by dengue fever in the previous year
Epidemic delay of influenza and the common cold
・Leap year・Epidemic of flu・Early dispersal of pollen
Suppression of point promotional
Flyer promotional suppression
Salesthe number of
customers
customer unit price
Jun. Jul. Aug. Sep. Oct. Nov. Dec. Jan. Feb. Mar. Apr. May
Monthly changes in the existing store sales, the number of customers, customer unit price year-on-year

14
* “Other” includes items such as stationery, baby products, clothing, pet products, gardening products, and film development services.
(Prescription) 121.27.316,708131.86.513,787
105.516.237,487104.016.735,522(O T C)
108.4
105.8
105.1
111.8
102.2
110.5
YoYchange
(%)
100.0
6.0
17.7
38.1
15.0
23.2
Share(%)
212,274
12,793
37,505
80,886
31,780
49,309
Sales(million yen)
FY2015 FY2016YoY
change(%)
Share(%)
Sales(million yen)
108.4100.0230,145Total
106.117.339,810Daily products
105.914.633,669Cosmetics
107.4
109.7
109.9
6.0
38.6
23.5
13,742Other
88,727Food products
54,195Medical and health products
44. Sales . Sales Traction expertise of the pharmacy business and the convenience of groceryTraction expertise of the pharmacy business and the convenience of grocery

15
5568
82
104
137
167
8092
106
125
184
158
40
60
80
100
120
140
160
180
200
40
60
80
100
120
140
160
180
200
5. 5. Pharmacy departmentPharmacy departmentExisting tore sales rose +17.2%・Expanded remarkably as recognition rose against the background of a large number of in-store pharmacies handling mainly prescriptions issued by multiple medical institutions
・Boosted by renovation and unifying store names
FY2016YoY
change(%)
Share(%)(million yen)
116.7
121.2
39.2
100.0
6,542
16,708
Gross profit
Net salesSales in prescription operations and the number of prescriptions issued
Bar graph: Sales(unit : hundred million yen)
Line graph:Number of prescriptions issued
(unit: 10,000)
FY2011 FY2012 FY2013 FY2014 FY2015 FY2016
・Promotion of generic product usage Usage rate is 65.4% (quantity basis)
・More capital investments were made in dispensing equipment in order to raise the efficiency of operations
・Focus on the development of human resourcesA pharmacist training center equipped with advanced dispensingequipment and enough space for anumber of people to attend classwas established

16
・Gross profit of each product was controlled by EDLP while restraining special prices.・Pricing that matches the market price
・Gross profit of each product was controlled by EDLP while restraining special prices.・Pricing that matches the market price
6. Gross profit margin6. Gross profit marginGross profit margin 27.6% Previous year difference + 0.5ptGross profit margin 27.6% Previous year difference + 0.5pt
Selling price measures
Gross profit margin was improved by the higher sales share of the pharmacy department after promoting new openings of in-store pharmacies in the past three years
Gross profit margin was improved by the higher sales share of the pharmacy department after promoting new openings of in-store pharmacies in the past three years
Deployment of high-value-added products
Extension of the pharmacy department
By deploying high-value-added products, improved by the mix of gross profit
By deploying high-value-added products, improved by the mix of gross profit

17
Expense rate 21.8% Previous year difference - 0.5ptExpense rate 21.8% Previous year difference - 0.5pt
The distance between stores and logistics centers was optimized by establishing a new logistics center
The distance between stores and logistics centers was optimized by establishing a new logistics center
Logistics cost ⇒ - 0.1ptLogistics cost ⇒ - 0.1pt
Cost of utilities ⇒ - 0.2ptCost of utilities ⇒ - 0.2pt
Depreciation ⇒ - 0.2pt Rent ⇒ - 0.1ptDepreciation ⇒ - 0.2pt Rent ⇒ - 0.1pt
・A decline in the cost for opening new stores due to a delay in actual openings and continued restraint in building costs
・Additional investments were made in large-scale renovation and introduction of store fixtures and dispensing equipment in the second half
・A decline in the cost for opening new stores due to a delay in actual openings and continued restraint in building costs
・Additional investments were made in large-scale renovation and introduction of store fixtures and dispensing equipment in the second half
7. Expense rate 7. Expense rate
・Curbing electricity consumption by shifting store lighting to LEDand taking power-saving measures in stores
・ A reduction in fuel adjustment cost unit price due to falling oil prices
・Curbing electricity consumption by shifting store lighting to LEDand taking power-saving measures in stores
・ A reduction in fuel adjustment cost unit price due to falling oil prices

18
Growth StrategyGrowth Strategy

19
New drugstores 40 stores ⇒ Previous year difference +12 stores New drugstores 40 stores ⇒ Previous year difference +12 stores
・Opening of stores in Kanto (mainly in Kanagawa prefecture )and Tokai regions
・Improve convenience and enhance the food and daily necessities assortment
・Opening of stores in Kanto (mainly in Kanagawa prefecture )and Tokai regions
・Improve convenience and enhance the food and daily necessities assortment
Dispensing pharmacy 23 stores ⇒ Previous year difference +17 storesIn-store pharmacies 20 stores (+16stores)Dedicated prescription pharmacies 3 stores(+1 store)
Dispensing pharmacy 23 stores ⇒ Previous year difference +17 storesIn-store pharmacies 20 stores (+16stores)Dedicated prescription pharmacies 3 stores(+1 store)
・Opening of in-store pharmacies has been sped up again・Profitable pharmacies have been opened in coordination with medical institutions so as to meet the allocation of medical institutions in the vicinity and cope with the exit of in-hospital pharmacies from hospitals
・Opening of in-store pharmacies has been sped up again・Profitable pharmacies have been opened in coordination with medical institutions so as to meet the allocation of medical institutions in the vicinity and cope with the exit of in-hospital pharmacies from hospitals
11. New Store Openings. New Store Openings

20
Existing stores renovated to increase the convenience 30 storesExisting stores renovated to increase the convenience 30 stores
Expansion of the store that can provide more conveniencein a small trade area・Expanding assortment of groceries・The introduction of miscellaneous products
Expansion of the store that can provide more conveniencein a small trade area・Expanding assortment of groceries・The introduction of miscellaneous products
Improve profitability by renovating pharmacies that handle high numbers of prescriptions・Expansion of the preparation space and waiting room・Improve the visibility from the drugstore
Improve profitability by renovating pharmacies that handle high numbers of prescriptions・Expansion of the preparation space and waiting room・Improve the visibility from the drugstore
2. Renovation of existing stores2. Renovation of existing stores
Pharmacy remodeling 5 stores Pharmacy remodeling 5 stores

21
33. Efforts to improve productivity. Efforts to improve productivity
Not only shorten the time for placing orders but also improve the accuracy of sales forecasts, on which ordering is based, by expanding the stores and sections that have introduced a computer-assisted ordering system
Not only shorten the time for placing orders but also improve the accuracy of sales forecasts, on which ordering is based, by expanding the stores and sections that have introduced a computer-assisted ordering system
Raise efficiency by expanding a computer-assisted ordering systemRaise efficiency by expanding a computer-assisted ordering system
・Establish a logistics system to handle a new selection of merchandize and improve efficiency in the delivery
・Improve work processes by upgrading material handling equipment
・Establish a logistics system to handle a new selection of merchandize and improve efficiency in the delivery
・Improve work processes by upgrading material handling equipment
Development of logistics systemDevelopment of logistics system

22
4. Pharmacy efforts 4. Pharmacy efforts
The development of human resourcesThe development of human resources
Utilize the Pharmacist Training Center, opened in April 2016,and the completely renewed development curriculums
Utilize the Pharmacist Training Center, opened in April 2016,and the completely renewed development curriculums
Expansion of prescription number of pharmacies dealing with prescription issued by a number of medical institutions
Expansion of prescription number of pharmacies dealing with prescription issued by a number of medical institutions
・Shorten waiting times by improving operations through the utilization of equipment
・Make announcements by taking advantage of drug stores’ ability to attract customers as well as improve convenience by introducing a prescription drug app
・Shorten waiting times by improving operations through the utilization of equipment
・Make announcements by taking advantage of drug stores’ ability to attract customers as well as improve convenience by introducing a prescription drug app

23
Corresponding to the medical fee revisionCorresponding to the medical fee revision
・Raise the rate of generic product usage ⇒ 70%( 4.3% increase from the end of the previous year)
・Acquire extra basic dispensing fees ⇒ 20 stores・Strengthening of "primary care" function
⇒ Expansion of individual home support pharmacy⇒ Promotion of implementation health consultations
・Raise the rate of generic product usage ⇒ 70%( 4.3% increase from the end of the previous year)
・Acquire extra basic dispensing fees ⇒ 20 stores・Strengthening of "primary care" function
⇒ Expansion of individual home support pharmacy⇒ Promotion of implementation health consultations
Control of stockControl of stock
Utilize the logistics center to optimize inventories in each storeUtilize the logistics center to optimize inventories in each store
4. Pharmacy efforts 4. Pharmacy efforts

24
Fee-charging Nursing Home businessFee-charging Nursing Home business
Improvement of the occupancy rate by strengthening sales capabilities
⇒ occupancy rate 80%
Improvement of the occupancy rate by strengthening sales capabilities
⇒ occupancy rate 80%
Preventive Nursing business Preventive Nursing business
Focus on improving the profitability of existing facilities・Switch from a 10-person system to a 16-person system 3 facilities・Enhance the operational rate of existing facilities
with a capacity of 16 people ⇒ to 80% at the end of the year.・Promote the introduction of a hybrid system of machine
training and massage・Introduce training programs for preventing dementia
5. Care Business5. Care Business

25
FY2017(consolidated projection)
FY2016 (consolidated results)
YoY Change (%)
Share (%)(million yen)Share
(%)(million yen)
4.0
6.2
6.0
21.3
27.4
100.0
9,274
14,314
13,954
49,469
63,423
231,892
104.63.99,700Net profit
105.35.914,700Operating profit
106.827.367,730Gross profit
104.8
107.2
106.8
6.1
21.4
100.0
15,000Recurring profit
53,030SG&A expenses
247,700Net sales
66.. FY2017 Forecasts (Consolidated)FY2017 Forecasts (Consolidated)

26
379419
446 471
7001 , 819
1 , 9742 , 139
3,500
2 , 318
300
400
500
600
700
800
1,000
1,500
2,000
2,500
3,000
3,500
4,000
7. Medium7. Medium--term visionterm visionLine graph: Sales
(unit : hundred million yen)
Medium-term targetNumber of stores
700 storesAmount of sales3,500
hundred million yenOperating margin
6.0% or more
ROE15.0% or more
FY2013 FY2014 FY2015 FY2016 FY2021
Bar chart: the number of stores