FY2015 SINGLE AUDIT OVERVIEW Purpose · FY2015 SINGLE AUDIT OVERVIEW 1 ... This is the auditor’s...
15
FY2015 SINGLE AUDIT OVERVIEW 1 Purpose The following overview is intended to provide the GOAC with a general understanding of the different auditor’s reports, management letters, financial statements and other information included in the FY2015 State of South Dakota Single Audit Report. Single Audit A single audit is an audit which includes both the entity’s financial statements and its federal awards. The State’s single audit includes an examination of the financial records, internal controls and compliance with laws and regulations for both the federal programs and the State as a whole. The audit of the State’s financial statements is designed to determine whether the statements are fairly presented in all material respects; and whether the presentation is in accordance with generally accepted accounting principles (GAAP). Comprehensive Annual Financial Report The Comprehensive Annual Financial Report (CAFR) is a thorough, detailed presentation of the State’s financial position and activities for the fiscal year. The CAFR is presented in three main sections. The Introductory Section (pages 1-12) includes a financial overview, discussion of the State’s economy and major initiatives, and the organizational structure for State government. The Financial Section (pages 13-167) includes the independent auditor’s report, management's discussion and analysis that provides an introduction, overview, and analysis of the basic financial statements, the basic financial statements, notes to the basic financial statements, and, combining and individual fund financial statements. The Statistical Section (pages 169-188) displays selected unaudited economic, financial trend and demographic information for the state. Independent Auditor’s Report The Independent Auditor’s Report issued by the Department of Legislative Audit (pages 13-15) provides unmodified opinions on the financial statements of the governmental activities, the business- type activities, the aggregate discretely presented component units, each major fund and the aggregate remaining fund information. An unmodified opinion means, in general, that the audit concluded that the financial statements were presented fairly and accurately. Government-Wide Financial Statements The first two financial statements in the CAFR are the government-wide financial statements consisting of a Statement of Net Position (pages 38-39) and a Statement of Activities (pages 40-41). The government-wide statements provide comprehensive information about the entire government, including all of the governmental funds, proprietary funds, component units, long-term debt, and capital assets. The government-wide statements do not include the fiduciary funds, which account for resources the government manages on behalf of others. This is because fiduciary fund resources are not available to support the State’s programs. The Statement of Net Position contains information about what the State owns (assets), what the State owes (liabilities), and what is left after assets are used to satisfy liabilities (net position). The Statement of Activities contains information about the costs of providing public services (expenses) and resources obtained to finance services (revenues) during the current fiscal year. The statement demonstrates the degree to which the direct expenses of a given function or segment are offset by program revenues. Direct expenses are those that are clearly identifiable with a specific function. Program revenues include: 1) charges to customers or applicants who purchase, use, or directly benefit from goods, services or privileges provided by a given function; and, 2) grants and contributions that are restricted to meeting the operational or capital requirements of a particular
Transcript of FY2015 SINGLE AUDIT OVERVIEW Purpose · FY2015 SINGLE AUDIT OVERVIEW 1 ... This is the auditor’s...

FY2015 SINGLE AUDIT OVERVIEW
1
Purpose The following overview is intended to provide the GOAC with a general understanding of the different auditor’s reports, management letters, financial statements and other information included in the FY2015 State of South Dakota Single Audit Report. Single Audit A single audit is an audit which includes both the entity’s financial statements and its federal awards. The State’s single audit includes an examination of the financial records, internal controls and compliance with laws and regulations for both the federal programs and the State as a whole. The audit of the State’s financial statements is designed to determine whether the statements are fairly presented in all material respects; and whether the presentation is in accordance with generally accepted accounting principles (GAAP). Comprehensive Annual Financial Report The Comprehensive Annual Financial Report (CAFR) is a thorough, detailed presentation of the State’s financial position and activities for the fiscal year. The CAFR is presented in three main sections.
The Introductory Section (pages 1-12) includes a financial overview, discussion of the State’s economy and major initiatives, and the organizational structure for State government.
The Financial Section (pages 13-167) includes the independent auditor’s report, management's discussion and analysis that provides an introduction, overview, and analysis of the basic financial statements, the basic financial statements, notes to the basic financial statements, and, combining and individual fund financial statements.
The Statistical Section (pages 169-188) displays selected unaudited economic, financial trend and demographic information for the state.
Independent Auditor’s Report The Independent Auditor’s Report issued by the Department of Legislative Audit (pages 13-15) provides unmodified opinions on the financial statements of the governmental activities, the business-type activities, the aggregate discretely presented component units, each major fund and the aggregate remaining fund information. An unmodified opinion means, in general, that the audit concluded that the financial statements were presented fairly and accurately. Government-Wide Financial Statements The first two financial statements in the CAFR are the government-wide financial statements consisting of a Statement of Net Position (pages 38-39) and a Statement of Activities (pages 40-41). The government-wide statements provide comprehensive information about the entire government, including all of the governmental funds, proprietary funds, component units, long-term debt, and capital assets. The government-wide statements do not include the fiduciary funds, which account for resources the government manages on behalf of others. This is because fiduciary fund resources are not available to support the State’s programs. The Statement of Net Position contains information about what the State owns (assets), what the State owes (liabilities), and what is left after assets are used to satisfy liabilities (net position). The Statement of Activities contains information about the costs of providing public services (expenses) and resources obtained to finance services (revenues) during the current fiscal year. The statement demonstrates the degree to which the direct expenses of a given function or segment are offset by program revenues. Direct expenses are those that are clearly identifiable with a specific function. Program revenues include: 1) charges to customers or applicants who purchase, use, or directly benefit from goods, services or privileges provided by a given function; and, 2) grants and contributions that are restricted to meeting the operational or capital requirements of a particular

FY2015 SINGLE AUDIT OVERVIEW
2
function. Taxes and other items not properly included as program revenues are reported as general revenues. These statements provide comprehensive information about the entire State, excluding fiduciary funds, separated between:
Governmental Activities encompass most of the State’s basic services including; general government, education, health, human and social services, transportation, economic resources, and agriculture and natural resources. Revenues from fees, taxes and federal grants finance most of these activities.
Business-Type Activities are financed in whole or in part by fees charged to external parties for goods or services.
Discretely Presented Component Units are entities legally separate from but financially accountable to the State, or their relationship with the State is such that exclusion would cause the State’s financial statements to be misleading or incomplete. The discretely presented component units include the South Dakota Finance Authority, South Dakota Housing Authority, South Dakota Value Added Finance Authority, Science and Technology Authority, South Dakota Ellsworth Development Authority, and, Higher Education.
Fund Financial Statements Separate financial statements are provided for governmental funds (pages 42-45), proprietary funds (pages 46-49), and fiduciary funds (pages 50-51). Governmental funds include the general fund, special revenue, capital project, debt service and permanent funds. Proprietary funds include enterprise and internal service funds. Fiduciary funds include pension, private purpose trust and agency funds. A further description of the purpose and uses for these fund types is included on pages 57-59 in the notes to the financial statements. Major governmental and enterprise funds are reported as separate columns in the fund financial statements, with nonmajor funds being combined into single columns. Additional combining statements for nonmajor funds and for component units can be found on pages 132-167. The Governmental Accounting Standards Board (GASB) established the criteria to be used in determining the major funds to be reported. The General Fund is always displayed as a major fund. The major governmental funds are:
General Fund Transportation Fund Social Services Federal Fund Dakota Cement Trust Fund Education Enhancement Trust Fund
The major enterprise funds are:
Lottery Fund Clean Water State Revolving Fund Drinking Water State Revolving Fund
Measurement Focus and Basis of Accounting The government-wide Statement of Net Position and Statement of Activities along with the proprietary fund, fiduciary fund and component unit statements are reported using the economic resources measurement focus and the accrual basis of accounting. The economic resources measurement focus is similar to private enterprise reporting and attempts to answer the question of whether the fund’s total economic resources have increased or decreased. Under the accrual basis of accounting, revenues are recorded when earned and expenses are recorded when a liability is incurred, regardless of the timing of related cash flows.

FY2015 SINGLE AUDIT OVERVIEW
3
The governmental fund financial statements are reported using the current financial resources measurement focus and the modified accrual basis of accounting. The current financial resources measurement focus attempts to answer the question of whether there are enough current resources available for spending in the near future. Revenues are recognized as soon as they are both measurable and available. Expenditures are recognized in the period in which the fund liability is incurred except for the long-term portion of certain liabilities such as bonds payable, compensated absences and capital lease obligations. Selected Financial Statements Pages 9-12 of this handout provide selected financial statements from the Single Audit Report. I’ve included explanatory information about what is being presented in the statements and where to find additional note disclosures for certain account balances. Schedule of Expenditures of Federal Awards Pages 189-247 provide the Schedule of Expenditures of Federal Awards and the Auditor’s Report on the schedule. The schedule lists the state’s cash basis expenditures incurred on federal grants and federal loan program balances. Internal Control and Compliance Reports Pages 249-253 provide two auditor’s reports regarding internal control and compliance.
Report on Internal Control over Financial Reporting and on Compliance and Other Matters Based on an Audit of Financial Statements Performed in Accordance with Government Auditing Standards This is the auditor’s report on internal controls tested as part of the financial statement audit. The report does not offer an auditor’s opinion on the overall design and operation of the government’s internal control but provides the material reportable conditions and noncompliance that were identified during testing.
Report on Compliance with Requirements Applicable to Each Major Program and on Internal Control over Compliance in Accordance with OMB Circular A-133 This is the auditor’s report on the results of tests of internal controls over compliance for major federal award programs. The auditor gave an unqualified opinion on the State’s compliance with the requirements of major federal programs except for the Dept. of Education’s Gaining Early Awareness and Readiness for Undergraduate Programs grant which had a qualified opinion. The report identified the findings associated with instances of noncompliance and deficiencies in internal controls over compliance.
Findings, Questioned Costs and Corrective Action Plans Pages 255-295 provides:
1. A summary of the results of the audit of the financial statements and federal awards. 2. Listings of the major federal grant programs tested, the audit reports issued separately and the
other significant areas tested. 3. A listing of the prior and current year audit findings and questioned costs by agency of state
government.
FY2015 SINGLE AUDIT OVERVIEW
4
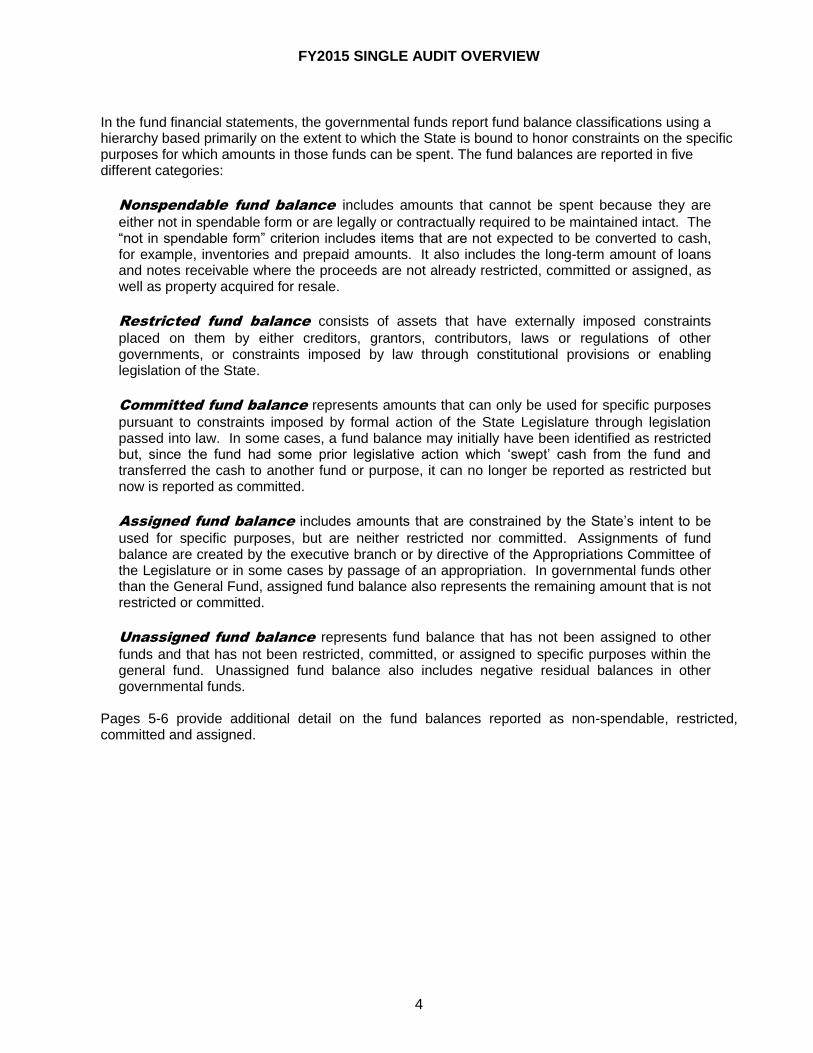
In the fund financial statements, the governmental funds report fund balance classifications using a hierarchy based primarily on the extent to which the State is bound to honor constraints on the specific purposes for which amounts in those funds can be spent. The fund balances are reported in five different categories:
Nonspendable fund balance includes amounts that cannot be spent because they are
either not in spendable form or are legally or contractually required to be maintained intact. The “not in spendable form” criterion includes items that are not expected to be converted to cash, for example, inventories and prepaid amounts. It also includes the long-term amount of loans and notes receivable where the proceeds are not already restricted, committed or assigned, as well as property acquired for resale.
Restricted fund balance consists of assets that have externally imposed constraints
placed on them by either creditors, grantors, contributors, laws or regulations of other governments, or constraints imposed by law through constitutional provisions or enabling legislation of the State.
Committed fund balance represents amounts that can only be used for specific purposes
pursuant to constraints imposed by formal action of the State Legislature through legislation passed into law. In some cases, a fund balance may initially have been identified as restricted but, since the fund had some prior legislative action which ‘swept’ cash from the fund and transferred the cash to another fund or purpose, it can no longer be reported as restricted but now is reported as committed.
Assigned fund balance includes amounts that are constrained by the State’s intent to be
used for specific purposes, but are neither restricted nor committed. Assignments of fund balance are created by the executive branch or by directive of the Appropriations Committee of the Legislature or in some cases by passage of an appropriation. In governmental funds other than the General Fund, assigned fund balance also represents the remaining amount that is not restricted or committed.
Unassigned fund balance represents fund balance that has not been assigned to other
funds and that has not been restricted, committed, or assigned to specific purposes within the general fund. Unassigned fund balance also includes negative residual balances in other governmental funds.
Pages 5-6 provide additional detail on the fund balances reported as non-spendable, restricted, committed and assigned.

FY2015 SINGLE AUDIT OVERVIEW
5
Note: The balance in the budget reserve account at June 30, 2015 was $126,737,000 and is reported as unassigned fund balance within the General Fund. This account was not allowed to be shown as anything but unassigned by GASB Statement 54 because the conditions allowing for its usage were not specific enough.
General Fund
Fourteen statutorily created accounts did not qualify as Special Revenue Funds and were required to be combined with the State’s General Fund. Some of the primary reasons that funds do not qualify as special revenue funds are the lack of enabling legislation regarding a dedicated revenue source or dedicated use of the fund or the resources of the fund is predominately transfers from other funds rather than from a dedicated revenue source. As of June 30, 2015 the following equity balances were included within the State’s General Fund (expressed in thousands):

FY2015 SINGLE AUDIT OVERVIEW
6
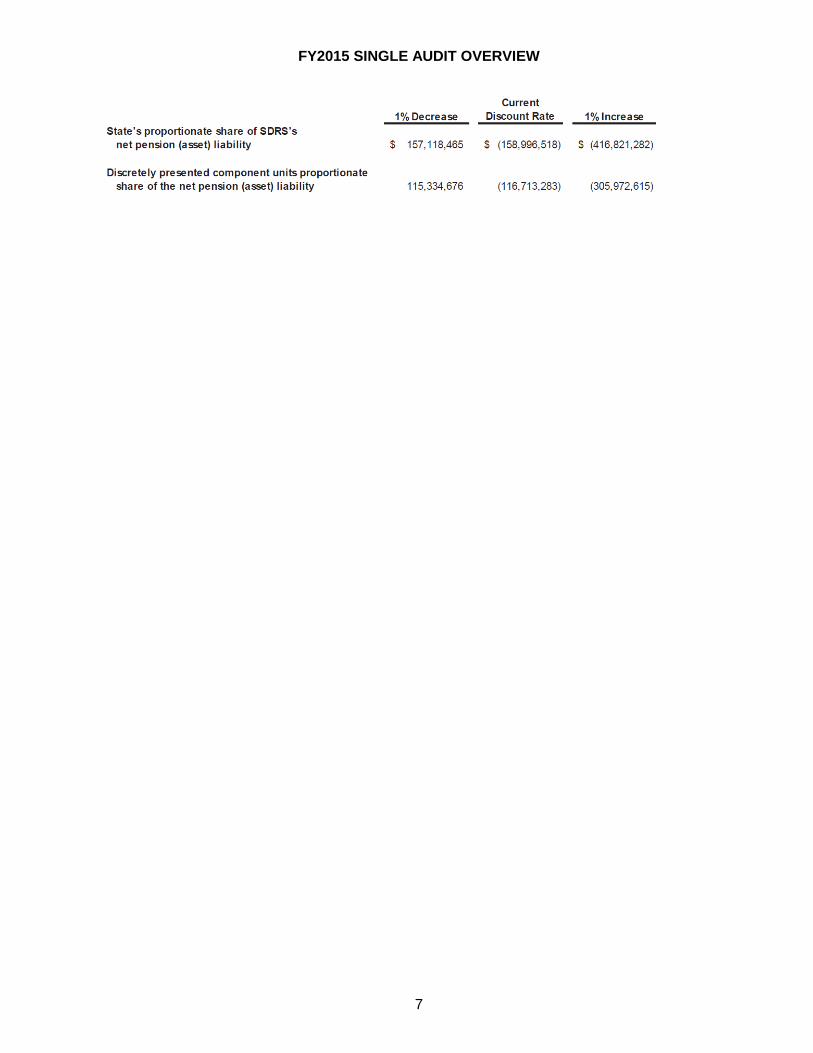
New Pension Reporting For FY2015, the State implemented GASB Statements 68 and 71 which established standards for measuring and recognizing pension related liabilities, assets, deferred outflows of resources, deferred inflows of resources, expense/expenditures and revenues for pensions provided to its employees and requires the State to record its proportionate share of the net pension asset. The Notes to the Financial Statements beginning on page 83 provides information on the SDRS pension plan. Using a measurement date of June 30, 2014, the pension plan was 107% funded. The GASB required the State’s proportionate share of the plan be recognized in the financial statements. The State’s share of the assets is shown in the table below.
The SDRS’s collective pension asset was calculated using a discount rate of 7.25% through FY2017 and 7.50% thereafter. The following table was provided to show the effect if the discount rate was 1% higher or lower than the rate used.
FY2015 SINGLE AUDIT OVERVIEW
7
FY2015 SINGLE AUDIT OVERVIEW
8
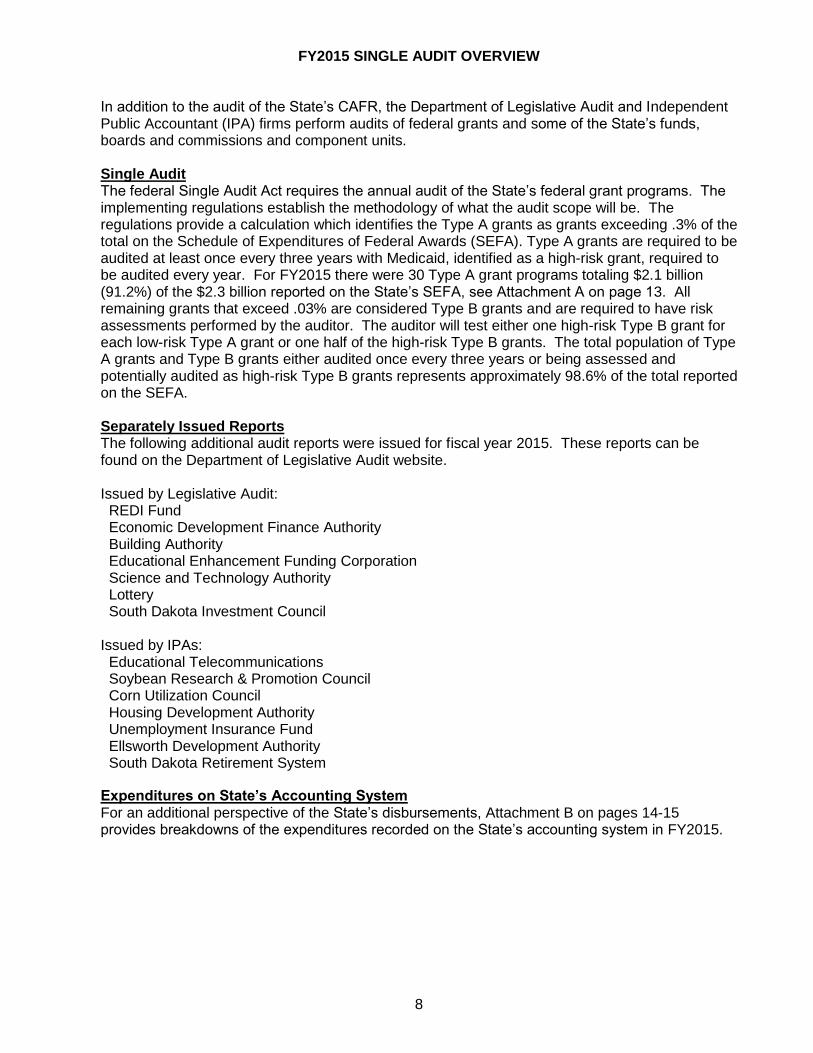
In addition to the audit of the State’s CAFR, the Department of Legislative Audit and Independent Public Accountant (IPA) firms perform audits of federal grants and some of the State’s funds, boards and commissions and component units. Single Audit The federal Single Audit Act requires the annual audit of the State’s federal grant programs. The implementing regulations establish the methodology of what the audit scope will be. The regulations provide a calculation which identifies the Type A grants as grants exceeding .3% of the total on the Schedule of Expenditures of Federal Awards (SEFA). Type A grants are required to be audited at least once every three years with Medicaid, identified as a high-risk grant, required to be audited every year. For FY2015 there were 30 Type A grant programs totaling $2.1 billion (91.2%) of the $2.3 billion reported on the State’s SEFA, see Attachment A on page 13. All remaining grants that exceed .03% are considered Type B grants and are required to have risk assessments performed by the auditor. The auditor will test either one high-risk Type B grant for each low-risk Type A grant or one half of the high-risk Type B grants. The total population of Type A grants and Type B grants either audited once every three years or being assessed and potentially audited as high-risk Type B grants represents approximately 98.6% of the total reported on the SEFA. Separately Issued Reports The following additional audit reports were issued for fiscal year 2015. These reports can be found on the Department of Legislative Audit website. Issued by Legislative Audit: REDI Fund Economic Development Finance Authority Building Authority Educational Enhancement Funding Corporation Science and Technology Authority Lottery South Dakota Investment Council Issued by IPAs: Educational Telecommunications Soybean Research & Promotion Council Corn Utilization Council Housing Development Authority Unemployment Insurance Fund Ellsworth Development Authority South Dakota Retirement System
Expenditures on State’s Accounting System For an additional perspective of the State’s disbursements, Attachment B on pages 14-15 provides breakdowns of the expenditures recorded on the State’s accounting system in FY2015.
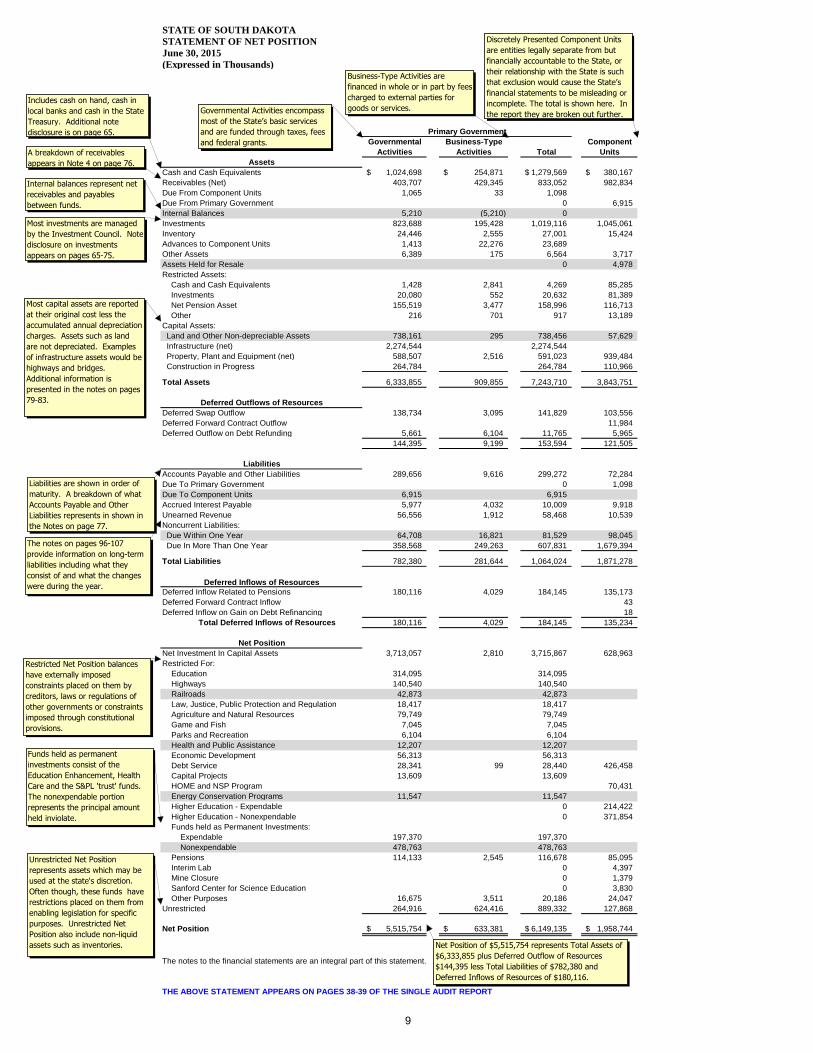
STATE OF SOUTH DAKOTA
STATEMENT OF NET POSITION
June 30, 2015
(Expressed in Thousands)
Primary Government
Governmental Business-Type Component
Activities Activities Total Units
Assets
Cash and Cash Equivalents 1,024,698$ 254,871$ 1,279,569$ 380,167$
Receivables (Net) 403,707 429,345 833,052 982,834
Due From Component Units 1,065 33 1,098
Due From Primary Government 0 6,915
Internal Balances 5,210 (5,210) 0
Investments 823,688 195,428 1,019,116 1,045,061
Inventory 24,446 2,555 27,001 15,424
Advances to Component Units 1,413 22,276 23,689
Other Assets 6,389 175 6,564 3,717
Assets Held for Resale 0 4,978
Restricted Assets:
Cash and Cash Equivalents 1,428 2,841 4,269 85,285
Investments 20,080 552 20,632 81,389
Net Pension Asset 155,519 3,477 158,996 116,713
Other 216 701 917 13,189
Capital Assets:
Land and Other Non-depreciable Assets 738,161 295 738,456 57,629
Infrastructure (net) 2,274,544 2,274,544
Property, Plant and Equipment (net) 588,507 2,516 591,023 939,484
Construction in Progress 264,784 264,784 110,966
Total Assets 6,333,855 909,855 7,243,710 3,843,751
Deferred Outflows of Resources
Deferred Swap Outflow 138,734 3,095 141,829 103,556
Deferred Forward Contract Outflow 11,984
Deferred Outflow on Debt Refunding 5,661 6,104 11,765 5,965
144,395 9,199 153,594 121,505
Liabilities
Accounts Payable and Other Liabilities 289,656 9,616 299,272 72,284
Due To Primary Government 0 1,098
Due To Component Units 6,915 6,915
Accrued Interest Payable 5,977 4,032 10,009 9,918
Unearned Revenue 56,556 1,912 58,468 10,539
Noncurrent Liabilities:
Due Within One Year 64,708 16,821 81,529 98,045
Due In More Than One Year 358,568 249,263 607,831 1,679,394
Total Liabilities 782,380 281,644 1,064,024 1,871,278
Deferred Inflows of Resources
Deferred Inflow Related to Pensions 180,116 4,029 184,145 135,173
Deferred Forward Contract Inflow 43
Deferred Inflow on Gain on Debt Refinancing 18
Total Deferred Inflows of Resources 180,116 4,029 184,145 135,234
Net Position
Net Investment In Capital Assets 3,713,057 2,810 3,715,867 628,963
Restricted For:
Education 314,095 314,095
Highways 140,540 140,540
Railroads 42,873 42,873
Law, Justice, Public Protection and Regulation 18,417 18,417
Agriculture and Natural Resources 79,749 79,749
Game and Fish 7,045 7,045
Parks and Recreation 6,104 6,104
Health and Public Assistance 12,207 12,207
Economic Development 56,313 56,313
Debt Service 28,341 99 28,440 426,458
Capital Projects 13,609 13,609
HOME and NSP Program 70,431
Energy Conservation Programs 11,547 11,547
Higher Education - Expendable 0 214,422
Higher Education - Nonexpendable 0 371,854
Funds held as Permanent Investments:
Expendable 197,370 197,370
Nonexpendable 478,763 478,763
Pensions 114,133 2,545 116,678 85,095
Interim Lab 0 4,397
Mine Closure 0 1,379
Sanford Center for Science Education 0 3,830
Other Purposes 16,675 3,511 20,186 24,047
Unrestricted 264,916 624,416 889,332 127,868
Net Position 5,515,754$ 633,381$ 6,149,135$ 1,958,744$
The notes to the financial statements are an integral part of this statement.
THE ABOVE STATEMENT APPEARS ON PAGES 38-39 OF THE SINGLE AUDIT REPORT
Discretely Presented Component Units
are entities legally separate from but
financially accountable to the State, or
their relationship with the State is such
that exclusion would cause the State’s
financial statements to be misleading or
incomplete. The total is shown here. In
the report they are broken out further.
Includes cash on hand, cash in
local banks and cash in the State
Treasury. Additional note
disclosure is on page 65.
A breakdown of receivables
appears in Note 4 on page 76.
Internal balances represent net
receivables and payables
between funds.
Most investments are managed
by the Investment Council. Note
disclosure on investments
appears on pages 65-75.
Most capital assets are reported
at their original cost less the
accumulated annual depreciation
charges. Assets such as land
are not depreciated. Examples
of infrastructure assets would be
highways and bridges.
Additional information is
presented in the notes on pages
79-83.
Liabilities are shown in order of
maturity. A breakdown of what
Accounts Payable and Other
Liabilities represents in shown in
the Notes on page 77.
The notes on pages 96-107
provide information on long-term
liabilities including what they
consist of and what the changes
were during the year.
Restricted Net Position balances
have externally imposed
constraints placed on them by
creditors, laws or regulations of
other governments or constraints
imposed through constitutional
provisions.
Unrestricted Net Position
represents assets which may be
used at the state's discretion.
Often though, these funds have
restrictions placed on them from
enabling legislation for specific
purposes. Unrestricted Net
Position also include non-liquid
assets such as inventories.
Governmental Activities encompass
most of the State’s basic services
and are funded through taxes, fees
and federal grants.
Business-Type Activities are
financed in whole or in part by fees
charged to external parties for
goods or services.
Net Position of $5,515,754 represents Total Assets of
$6,333,855 plus Deferred Outflow of Resources
$144,395 less Total Liabilities of $782,380 and
Deferred Inflows of Resources of $180,116.
Funds held as permanent
investments consist of the
Education Enhancement, Health
Care and the S&PL 'trust' funds.
The nonexpendable portion
represents the principal amount
held inviolate.
9

STATE OF SOUTH DAKOTA
STATEMENT OF ACTIVITIES
For the Fiscal Year Ended June 30, 2015
(Expressed in Thousands)Net (Expenses) Revenue and Changes in Net Assets
Operating Capital Primary Government
Charges for Grants and Grants and Governmental Business-Type Component
Expenses Services Contributions Contributions Activities Activities Total Units
Functions/Programs
Primary Government:
Governmental Activities:
General Government 185,273$ 244,728$ 10,381$ $ 69,836$ $ 69,836$
Education - Elementary, Secondary and
Vocational Schools 210,271 8,489 173,353 (28,429) (28,429)
Education - State Support to Higher Education 192,950 (192,950) (192,950)
Health, Human and Social Services 1,406,586 39,058 853,746 19,106 (494,676) (494,676)
Law, Justice, Public Protection and Regulation 279,097 85,252 63,296 (130,549) (130,549)
Agriculture and Natural Resources 140,921 76,994 40,767 (23,160) (23,160)
Economic Resources 74,004 1,611 7,670 (64,723) (64,723)
Transportation 507,300 9,007 344,329 2,840 (151,124) (151,124)
Intergovernmental - Payments to School Districts 404,909 (404,909) (404,909)
Intergovernmental - Revenue Sharing 169,514 (169,514) (169,514)
Unallocated Interest Expense 6,712 (6,712) (6,712)
Unallocated Depreciation 53 (53) (53)
Total Governmental Activities 3,577,590 465,139 1,493,542 21,946 (1,596,963) 0 (1,596,963)
Business-Type Activities:
Lottery 41,053 152,362 138 111,447 111,447
Clean Water State Revolving 9,673 6,856 11,379 8,562 8,562
Drinking Water State Revolving 8,651 4,197 14,305 9,851 9,851
Revolving Economic Development and Initiative 450 1,013 708 1,271 1,271
Unemployment Insurance 26,534 41,543 2,457 17,466 17,466
Second Injury 1,891 8 20 (1,863) (1,863)
State Fair 3,264 2,867 29 2,810 2,442 2,442
Federal Surplus Property 4,388 4,263 7 (118) (118)
Rural Rehabilitation 421 315 165 59 59 1
Prison Industries 2,410 2,751 23 364 364 0
Health Insurance Risk Pool 2,282 2,009 553 280 280
Professional and Licensing 7,558 8,140 151 733 733
Banking and Insurance 3,973 4,481 58 566 566
Other 2,910 3,853 12 955 955
Total Business-Type Activities 115,458 234,658 30,005 2,810 0 152,015 152,015
Total Primary Government 3,693,048$ 699,797$ 1,523,547$ 24,756$ (1,596,963) 152,015 (1,444,948)
Component Units:
Housing Authority 76,989$ 65,258$ 27,906$ $ 16,175$
Science and Technology Authority 21,045 463 19,374 7,194 5,986
Higher Education 711,148 429,628 139,567 5,812 (136,141)
Nonmajor 6,658 3,469 582 1,333 (1,274)
Total Component Units 815,840$ 498,818$ 187,429$ 14,339$ (115,254)
General Revenues:
Taxes:
Sales Taxes 871,402 871,402
Motor Fuel Taxes 151,901 151,901
Contractors Excise Taxes 101,678 101,678
Bank Card and Franchise Taxes 20,669 20,669
Other Taxes 331,649 331,649
Investment Earnings 47,130 47,130 12,814
State Support to Higher Education 192,950
Gain on Sale of Capital Assets 1,198 1,198
Miscellaneous 81,275 81,275
Additions to Endowments 15,680
Transfers 113,558 (113,558)
Total General Revenues, Additions to Endowments and Transfers 1,720,460 (113,558) 1,606,902 221,444
Changes in Net Position 123,497 38,457 161,954 106,190
Net Position - Beginning, as restated 5,392,257 594,924 5,987,181 1,852,554
Net Position - Ending 5,515,754$ 633,381$ 6,149,135$ 1,958,744$
THE ABOVE STATEMENT APPEARS ON PAGES 40-41 OF THE SINGLE AUDIT REPORT.
A list of what state agencies comprise the different functional classifications can be found on page 11.
Revenue sharing expense represents the distribution of state imposed taxes or fees to other units of government. An example would be motor vehicle licenses where the county retains a portion of the amount collected.
This respresents the total cost of the function or program.
Program revenues include: 1) charges to customers or applicants who purchase, use, or directly benefit from goods, services or privileges provided by a given function; and, 2) grants and contributions that are restricted to meeting the operational or capital requirements of a particular function. Taxes and other items not properly included as program revenues are reported as general revenues.
The totals being reported under in these rows represent the result of subtracting revenue from expenses. A (negative) amount identifies a function or program where program revenue did not cover the costs of operations. For Governmental Activites, a negiative would often be funded from general revenues such as sales taxes. For Business-Type Activities, negative amounts are seldom funded from general revenue or from subsidies from governmental actvities, although the State Fair would be an exception. Positive amounts, such as that reported for the Lottery, indicate revenues exceeding expenses. In the example of the Lottery, this excess was used to subsidize the General Fund. The subsidy was included in the Transfers amount reported in the bottom part of the statement.
General Revenues include those taxes and other sources of income used to fund the net costs of the functions. These revenues are not included as Program Revenue because they are not directly associated with receiving a benefit from the program or activity.
Miscellaneous General Revenues would include the tobacco settlement revenue received from participating tobacco companies and unclaimed property receipts.
The Change in Net Position identify whether the State's financial position improved or (declined) during the year.
Additional note disclosure on transfers can be found on page 78.

STATE OF SOUTH DAKOTA
BALANCE SHEET
GOVERNMENTAL FUNDS
June 30, 2015
(Expressed in Thousands)
Social Dakota Education
General Services Cement Enhancement
Fund Transportation Federal Trust Trust Nonmajor Total
Assets
Cash and Cash Equivalents 275,909$ 112,792$ 8$ 57,362$ 108,740$ 380,540$ 935,351$
Restricted Cash 1,421 7 1,428
Investments 11,282 247,366 404,373 160,667 823,688
Restricted Investments 20,080 20,080
Receivables From:
Taxes, net 114,403 17,227 3,254 134,884
Interest and Dividends 1,214 236 2 772 1,515 1,627 5,366
Other Funds 43,785 1,319 5 5,631 50,740
Component Units 9 8 205 222
Other Governments 875 55,972 35,726 76,922 169,495
Loans and Notes, net 369 49,944 50,313
Other, net 12,182 165 11,643 17,945 41,935
Inventory 2,291 18,416 18 2,142 22,867
Advances to Component Units 1,413 1,413
Other Assets 1,620 288 146 1,361 3,415
Restricted Other Assets 216 216
Total Assets 465,207$ 206,792$ 47,548$ 305,500$ 514,628$ 721,738$ 2,261,413$
Liabilities, Deferred Inflows of
1
Resources, and Fund Balances1
Liabilities:
Accounts Payable and Other Liabilities 95,437$ 48,003$ 40,558$ 105$ 462$ 34,465$ 219,030$
Payable To:
Other Funds 4,599 1,230 5,325 17,037 24,124 52,315
Component Units 5,204 98 90 1,490 6,882
Other Governments 12,954 4,104 131 61,477 78,666
Claims, Judgments and Compensated Absences 154 19 20 81 274
Deferred Revenue 28,330 2,046 45 14,100 44,521
Total Liabilities 146,678 55,500 46,169 105 17,499 135,737 401,688
Deferred Inflows of Resources:
Unavailable Revenue 389 13 15,249 15,651
Total Deferred Inflows of Resources 389 13 0 0 0 15,249 15,651
Fund Balances:
Nonspendable 3,911 18,704 163 347,252 134,974 505,004
Restricted 10,479 132,575 305,395 149,877 361,866 960,192
Committed 51,119 51,119
Assigned 120,180 1,216 26,417 147,813
Unassigned 183,570 (3,624) 179,946
Total Fund Balances 318,140 151,279 1,379 305,395 497,129 570,752 1,844,074
Total Liabilities, Deferred Inflows of
Resources, and Fund Balances 465,207$ 206,792$ 47,548$ 305,500$ 514,628$ 721,738$ 2,261,413$
THE ABOVE STATEMENT APPEARS ON PAGE 42 OF THE SINGLE AUDIT REPORT.
The governmental fund financial statements are reported using the current financial resources measurement focus and the modified accrual basis of accounting. The current financial resources measurement focus attempts to answer the question of whether there are enough current resources available for spending in the near future. Revenues are recognized as soon as they are both measurable and available. Expenditures are recognized in the period in which the fund liability is incurred except for the long-term portion of certain liabilities such as bonds payable, compensated absences and capital lease obligations.
The cash reported in the General Fund includes $126.7 million in the Budget Reserve Fund.
To find additional detail on the Nonmajor funds, see the combining statements on pages 132-167.
Fund balances are classified based upon the extent that the State is bound to honor constraints on the specific purpose the amounts in the funds can be spent. Additional discussion is provided on pages 61-62 and 89-91.

STATE OF SOUTH DAKOTA
RECONCILIATION OF THE GOVERNMENTAL FUNDS BALANCE SHEET
TO THE STATEMENT OF NET POSITION
June 30, 2015
(Expressed in Thousands)
Total Fund Balances - Governmental Funds 1,844,074$
Amounts reported for governmental activities in the Statement of Net Position
are different because:
Capital assets used in governmental activities are not financial resources and are
therefore not reported in the funds. These assets consist of:
Land and Construction in Progress 1,001,392
Infrastructure 3,761,358
Other Capital Assets 971,171
Accumulated Depreciation (1,901,804)
Total Capital Assets 3,832,117
Net Pension Asset used in governmental activities is not a financial resource
and is therefore not reported in the governmental funds. 144,677
Deferred outflows of resources are not reported in the governmental funds:
Related to Pension 129,039
Related to Debt Refunding 5,661
134,700
Internal service funds are used by management to charge costs of certain activities to
individual funds. The assets and liabilities of the internal service funds are included in
governmental activities in the Statement of Net Position. 61,742
Some liabilities are not due and payable in the current period and therefore are not
reported in the funds. Those liabilities are:
Bonds and Notes (175,334)
Accrued Interest on Bonds (5,977)
Capital Leases (100,941)
Compensated Absences (52,411)
Pollution Remediation (14,986)
Total Long-Term Liabilities (349,649)
Deferred outflows of resources are not reported in the governmental funds:
Revenues not available soon enough after year-end to pay for the
current period's expenditures 15,651
Related to Pensions (167,558)
(151,907)
Net Position of Governmental Activities 5,515,754$
THE ABOVE RECONCILIATION APPEARS ON PAGE 43 OF THE SINGLE AUDIT REPORT.
This reconciliation provides the entries needed to convert the governmental funds into the Governmental Activities reported in Government-Wide Statement of Net Position.
This is the fund equity reported for governmental funds on page 42.
Governmental funds do not report capital assets because their focus is on available spendable resources. This represents the value of capital assets used in governmental activities and associated depreciation on those assets reported in the government-wide statements.
Governmental funds do not report long-term liabilities but they are reported for Governmental Activities in the government-
12

Federal Grant Programs Attachment A
Expenditures/
Disbursements/ Last
Issuances Audited
Dept. of Education
Child and Adult Care Food Program 9,140,553$ FY2014
Child Nutrition Cluster 41,205,470 FY2014
Special Education Cluster 33,331,183 FY2014
Title I Grants to Local Educational Agencies 42,874,069 FY2014
Improving Teacher Quality State Grants 10,775,232 FY2014
Dept. of Environment & Natural Resources
Capitalization Grants for Clean Water State Revolving Funds 256,642,429 FY2015
Capitalization Grants for Drinking Water State Revolving Funds 143,774,203 FY2014
Dept. of Game, Fish & Parks
Fish and Wildlife Cluster 12,632,252 FY2013
Dept. of Health
Special Supplemental Nutrition Program for Women, Infants, and Children 17,710,212 FY2014
Immunization Cooperative Agreements 11,566,645 FY2013
Dept. of Human Services
Rehabilitation Services -Vocational Rehabilitation Grants to States 8,652,863 FY2013
Dept. of Labor and Regulation
Unemployment Insurance 33,551,308 FY2015
Dept. of Military
National Guard Military Operations and Maintenance (O&M) Projects 15,668,705 FY2013
Dept. of Public Safety
Disaster Grants - Public Assistance (Presidentially Declared Disasters) 13,059,289 FY2013
Hazard Mitigation Grant 7,299,099 FY2015
Dept. of Social Services
TANF Cluster 20,099,064 FY2014
Low-Income Home Energy Assistance 18,157,693 FY2015
Child Care Development Cluster 11,914,969 FY2015
Supplemental Nutrition Assistance Program Cluster 156,050,400 FY2015
Children's Health Insurance Program 16,021,623 FY2014
Medicaid Cluster 497,966,106 FY2015
Dept. of Transportation
Airport Improvement Program 27,089,133 FY2013
Highway Planning and Construction Cluster 291,115,162 FY2015
Dept. of Veterans Affairs
Grants to States for Construction of State Home Facilities 14,985,964 FY2015
Governor's Office of Economic Development, Housing Development Authority
Community Development Block Grant Cluster 27,694,464 FY2013
Housing Development Authority
Home Investment Partnerships Program 60,119,766 FY2015
Section 8 New Construction and Substantial Rehabilitation 24,099,736 FY2013
Science & Technology Authority
Lawrence Berkley National Lab contract 14,345,923 FY2015
Board of Regents
Research and Development Cluster 44,734,429 FY2014
Student Financial Aid Cluster 244,909,852 FY2014
Type A Grant Programs 2,127,187,796 91.2%
Type B Grant Programs 204,536,361 8.8%
Total 2,331,724,157$
Type A programs are required to be audited once every three years with the exception of Medicaid
which is required to be audited every year.
13
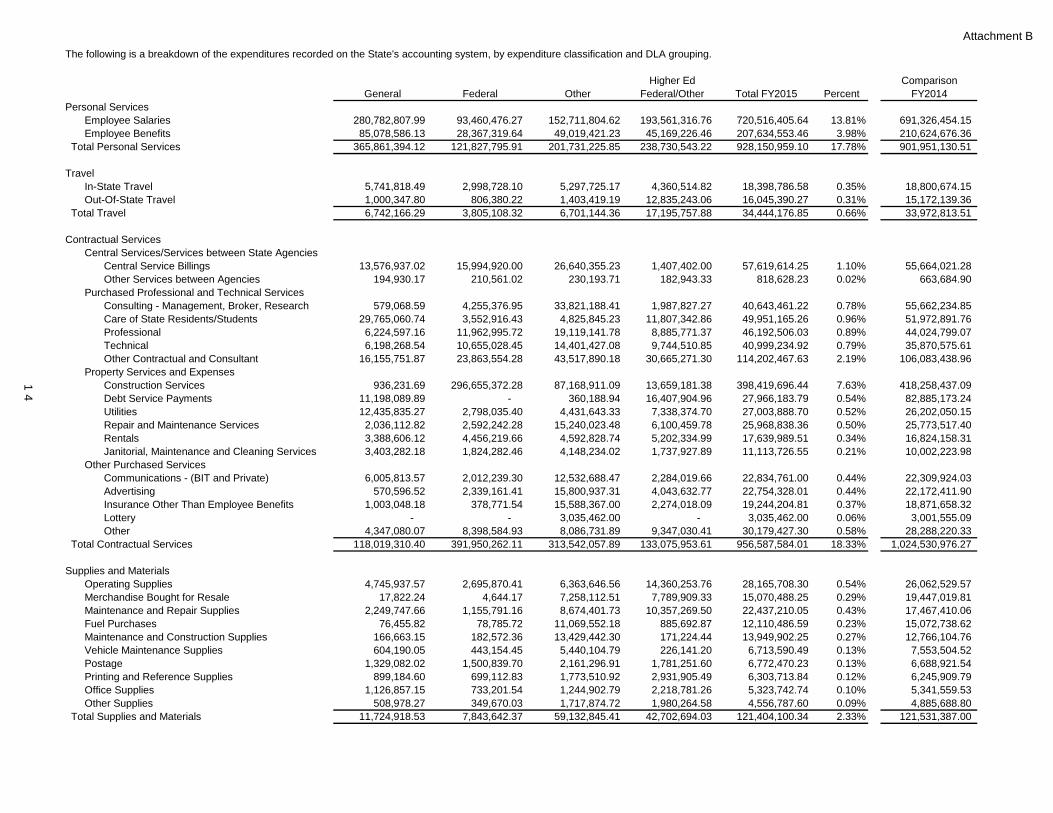
Attachment B
The following is a breakdown of the expenditures recorded on the State's accounting system, by expenditure classification and DLA grouping.
Higher Ed Comparison
General Federal Other Federal/Other Total FY2015 Percent FY2014
Personal Services
Employee Salaries 280,782,807.99 93,460,476.27 152,711,804.62 193,561,316.76 720,516,405.64 13.81% 691,326,454.15
Employee Benefits 85,078,586.13 28,367,319.64 49,019,421.23 45,169,226.46 207,634,553.46 3.98% 210,624,676.36
Total Personal Services 365,861,394.12 121,827,795.91 201,731,225.85 238,730,543.22 928,150,959.10 17.78% 901,951,130.51
Travel
In-State Travel 5,741,818.49 2,998,728.10 5,297,725.17 4,360,514.82 18,398,786.58 0.35% 18,800,674.15
Out-Of-State Travel 1,000,347.80 806,380.22 1,403,419.19 12,835,243.06 16,045,390.27 0.31% 15,172,139.36
Total Travel 6,742,166.29 3,805,108.32 6,701,144.36 17,195,757.88 34,444,176.85 0.66% 33,972,813.51
Contractual Services
Central Services/Services between State Agencies
Central Service Billings 13,576,937.02 15,994,920.00 26,640,355.23 1,407,402.00 57,619,614.25 1.10% 55,664,021.28
Other Services between Agencies 194,930.17 210,561.02 230,193.71 182,943.33 818,628.23 0.02% 663,684.90
Purchased Professional and Technical Services
Consulting - Management, Broker, Research 579,068.59 4,255,376.95 33,821,188.41 1,987,827.27 40,643,461.22 0.78% 55,662,234.85
Care of State Residents/Students 29,765,060.74 3,552,916.43 4,825,845.23 11,807,342.86 49,951,165.26 0.96% 51,972,891.76
Professional 6,224,597.16 11,962,995.72 19,119,141.78 8,885,771.37 46,192,506.03 0.89% 44,024,799.07
Technical 6,198,268.54 10,655,028.45 14,401,427.08 9,744,510.85 40,999,234.92 0.79% 35,870,575.61
Other Contractual and Consultant 16,155,751.87 23,863,554.28 43,517,890.18 30,665,271.30 114,202,467.63 2.19% 106,083,438.96
Property Services and Expenses
1 Construction Services 936,231.69 296,655,372.28 87,168,911.09 13,659,181.38 398,419,696.44 7.63% 418,258,437.09
4
Debt Service Payments 11,198,089.89 - 360,188.94 16,407,904.96 27,966,183.79 0.54% 82,885,173.24
Utilities 12,435,835.27 2,798,035.40 4,431,643.33 7,338,374.70 27,003,888.70 0.52% 26,202,050.15
Repair and Maintenance Services 2,036,112.82 2,592,242.28 15,240,023.48 6,100,459.78 25,968,838.36 0.50% 25,773,517.40
Rentals 3,388,606.12 4,456,219.66 4,592,828.74 5,202,334.99 17,639,989.51 0.34% 16,824,158.31
Janitorial, Maintenance and Cleaning Services 3,403,282.18 1,824,282.46 4,148,234.02 1,737,927.89 11,113,726.55 0.21% 10,002,223.98
Other Purchased Services
Communications - (BIT and Private) 6,005,813.57 2,012,239.30 12,532,688.47 2,284,019.66 22,834,761.00 0.44% 22,309,924.03
Advertising 570,596.52 2,339,161.41 15,800,937.31 4,043,632.77 22,754,328.01 0.44% 22,172,411.90
Insurance Other Than Employee Benefits 1,003,048.18 378,771.54 15,588,367.00 2,274,018.09 19,244,204.81 0.37% 18,871,658.32
Lottery - - 3,035,462.00 - 3,035,462.00 0.06% 3,001,555.09
Other 4,347,080.07 8,398,584.93 8,086,731.89 9,347,030.41 30,179,427.30 0.58% 28,288,220.33
Total Contractual Services 118,019,310.40 391,950,262.11 313,542,057.89 133,075,953.61 956,587,584.01 18.33% 1,024,530,976.27
Supplies and Materials
Operating Supplies 4,745,937.57 2,695,870.41 6,363,646.56 14,360,253.76 28,165,708.30 0.54% 26,062,529.57
Merchandise Bought for Resale 17,822.24 4,644.17 7,258,112.51 7,789,909.33 15,070,488.25 0.29% 19,447,019.81
Maintenance and Repair Supplies 2,249,747.66 1,155,791.16 8,674,401.73 10,357,269.50 22,437,210.05 0.43% 17,467,410.06
Fuel Purchases 76,455.82 78,785.72 11,069,552.18 885,692.87 12,110,486.59 0.23% 15,072,738.62
Maintenance and Construction Supplies 166,663.15 182,572.36 13,429,442.30 171,224.44 13,949,902.25 0.27% 12,766,104.76
Vehicle Maintenance Supplies 604,190.05 443,154.45 5,440,104.79 226,141.20 6,713,590.49 0.13% 7,553,504.52
Postage 1,329,082.02 1,500,839.70 2,161,296.91 1,781,251.60 6,772,470.23 0.13% 6,688,921.54
Printing and Reference Supplies 899,184.60 699,112.83 1,773,510.92 2,931,905.49 6,303,713.84 0.12% 6,245,909.79
Office Supplies 1,126,857.15 733,201.54 1,244,902.79 2,218,781.26 5,323,742.74 0.10% 5,341,559.53
Other Supplies 508,978.27 349,670.03 1,717,874.72 1,980,264.58 4,556,787.60 0.09% 4,885,688.80
Total Supplies and Materials 11,724,918.53 7,843,642.37 59,132,845.41 42,702,694.03 121,404,100.34 2.33% 121,531,387.00

Attachment B
Higher Ed Comparison
General Federal Other Federal/Other Total FY2015 Percent FY2014
Grants and Subsidies
Grants for Health Care or Insurance 343,938,803.19 441,808,163.88 14,095,610.69 1,192,468.85 801,035,046.61 15.35% 766,371,165.69
Grants to Other Governments 415,097,320.78 176,634,327.40 107,471,889.06 20,800.77 699,224,338.01 13.40% 672,024,437.77
Grants to Vendors and Non-Profits 43,652,948.34 82,604,634.82 53,611,214.11 12,922,680.00 192,791,477.27 3.69% 203,353,374.47
Grants to Individuals 28,581,515.17 39,338,047.45 10,283,902.39 4,710,638.65 82,914,103.66 1.59% 81,266,637.13
Grants - Other 17,768,088.87 21,553,639.27 1,230,612.57 2,357,889.66 42,910,230.37 0.82% 41,945,433.54
Grants to State Agencies 3,896,566.54 12,995,644.84 834,980.75 2,465,509.49 20,192,701.62 0.39% 14,439,099.30
Grants for Foster Care 1,755,099.56 1,468,412.46 151,013.28 - 3,374,525.30 0.06% 3,666,882.98
Total Grants and Subsidies 854,690,342.45 776,402,870.12 187,679,222.85 23,669,987.42 1,842,442,422.84 35.30% 1,783,067,030.88
Capital Outlay
Buildings and Improvements 20,042,492.86 18,169,064.63 59,094,906.50 40,606,830.34 137,913,294.33 2.64% 104,597,052.37
Machinery and Equipment 3,341,124.67 2,755,726.73 18,964,989.43 18,237,135.68 43,298,976.51 0.83% 42,744,835.88
Computer Hardware 1,708,647.33 1,397,296.85 3,429,208.48 9,864,748.08 16,399,900.74 0.31% 16,637,568.26
Computer Software 414,396.27 1,147,141.18 3,230,033.37 2,827,158.16 7,618,728.98 0.15% 9,224,640.99
Vehicles - 493,116.02 6,053,833.02 301,110.07 6,848,059.11 0.13% 7,473,172.85
Land and Improvements 22,774.00 544,285.36 322,202.18 2,407,986.10 3,297,247.64 0.06% 1,675,230.17
Improvements Other Than Land and Buildings 756,499.17 - 170,353.85 2,101,684.12 3,028,537.14 0.06% 1,680,741.73
Total Capital Outlay 26,285,934.30 24,506,630.77 91,265,526.83 76,346,652.55 218,404,744.45 4.18% 184,033,242.25
Other Expenditures
Retirement Payments - - 482,156,772.28 - 482,156,772.28 9.24% 450,408,980.24
Higher Education - not classified - - - 206,062,169.84 206,062,169.84 3.95% 193,455,654.80
1 Loss on Investment Principal - - 230,017,072.30 - 230,017,072.30 4.41% 146,555,064.67
5
Insurance, Worker's Compensation and Claims - 472,651.41 123,952,792.47 - 124,425,443.88 2.38% 125,001,120.22
Lottery Prizes - - 29,398,286.20 - 29,398,286.20 0.56% 32,034,878.09
Interest Expense 197,506.07 5,725.62 13,015,344.93 13,987,895.44 27,206,472.06 0.52% 24,657,214.74
Unclaimed Property Payments - - 15,706,992.26 4,003.73 15,710,995.99 0.30% 10,106,026.47
Other Expenditures 45,643.15 95,966.38 1,428,892.17 1,098,711.25 2,669,212.95 0.05% 3,061,245.85
Total Other Expenditures 243,149.22 574,343.41 895,676,152.61 221,152,780.26 1,117,646,425.50 21.41% 985,280,185.08
Total Expenditures on State's Accounting System 1,383,567,215.31 1,326,910,653.01 1,755,728,175.80 752,874,368.97 5,219,080,413.09 100.00% 5,034,366,765.50
The following is a breakdown of the expenditures recorded on the State's accounting system by type of document processed..
Document Type General Federal Other Higher Ed Total
Central Payroll 204,212,027.46 114,555,200.26 216,321,783.76 535,089,011.48
Central Service Document 22,541,419.48 19,897,125.35 35,528,355.55 5,263,584.98 83,230,485.36
DSS Warrant 370,199,699.26 505,671,540.86 5,358,001.17 881,229,241.29
DSS Drug Rebate Document (15,838,740.50) (17,904,970.64) (33,743,711.14)
Higher Ed Document 185,534,361.81 284,500,704.34 - 438,375,727.42 908,410,793.57
Interagency Document 40,870,622.30 15,873,173.05 33,947,838.11 25,040,856.55 115,732,490.01
Purchase Card 1,193,268.54 1,032,387.58 3,928,210.97 1,496,050.28 7,649,917.37
SDIC Document 250,363,450.08 250,363,450.08
SDRS Document 482,515,764.29 482,515,764.29
Vender Payments 538,113,338.98 381,953,945.97 742,303,945.73 50.00 1,662,371,280.68
WIC Rebate Document 10,468,591.00 3,492,044.06 13,960,635.06
Wire Transfer 35,962,837.36 16,382,170.25 229,789,297.52 20,404,003.21 302,538,308.34
SPL School Apportionment 9,969,231.31 9,969,231.31
Other 778,380.62 (5,519,215.01) 4,693,281.99 (188,932.21) (236,484.61)
1,383,567,215.31 1,326,910,653.01 2,018,211,204.54 490,391,340.23 5,219,080,413.09