FY2015 Results Presentation - AWI · up:sales under: ordinary ... about concurrent global...
27
FY2015 Results Presentation 2016.05.16 New medium-term management plan(FY2016~18) NEXT-2020 Ver.3
Transcript of FY2015 Results Presentation - AWI · up:sales under: ordinary ... about concurrent global...

FY2015 Results Presentation
2016.05.16
New medium-term management plan(FY2016~18)
NEXT-2020 Ver.3

Contents
FY2015 Results1
FY2013~2015Review of mid-term business plan “NEXT-2020 Ver.2”2
FY2016~2018New medium-term management plan
NEXT-2020 Ver.33
FY2016 Earnings Forecast5
2
Investment plan / Shareholder return4

3
① FY2015 Results
② FY2015 Business results by segment
1 FY2015 Results
FY2013~2015Review of mid-term business plan “NEXT-2020 Ver.2”2
FY2016~2018New medium-term management plan
NEXT-2020 Ver.33
FY2016 Earnings Forecast5
Investment plan / Shareholder return4

4
①FY2015 Results
Recurring margin 5.8% 5.3%ROE 9.6% 8.7%
EPS(JPY) 105.75円 102.73円Equity capital ratio 41.3% 40.8%
Net D/E ratio 0.58 0.57
FY2014 FY2015 Difference(Growth Rate)
Net sales 6,605 6,606 + 1 (100.0%)Operating income 361 395 + 34 (109.4%)Ordinary income 382 351 ▲ 31 ( 91.9%)
Net income 207 201 ▲ 6 ( 97.3%)
Interest-bearing debt 1,549 1,578 + 29 (101.9%)Equity capital 2,264 2,347 + 84 (103.7%)Total assets 5,476 5,758 + 282 (105.1%)
(Unit: hundred million yen)
Despite ordinary income decline affected by equity in net losses, operating income rose significantly
5
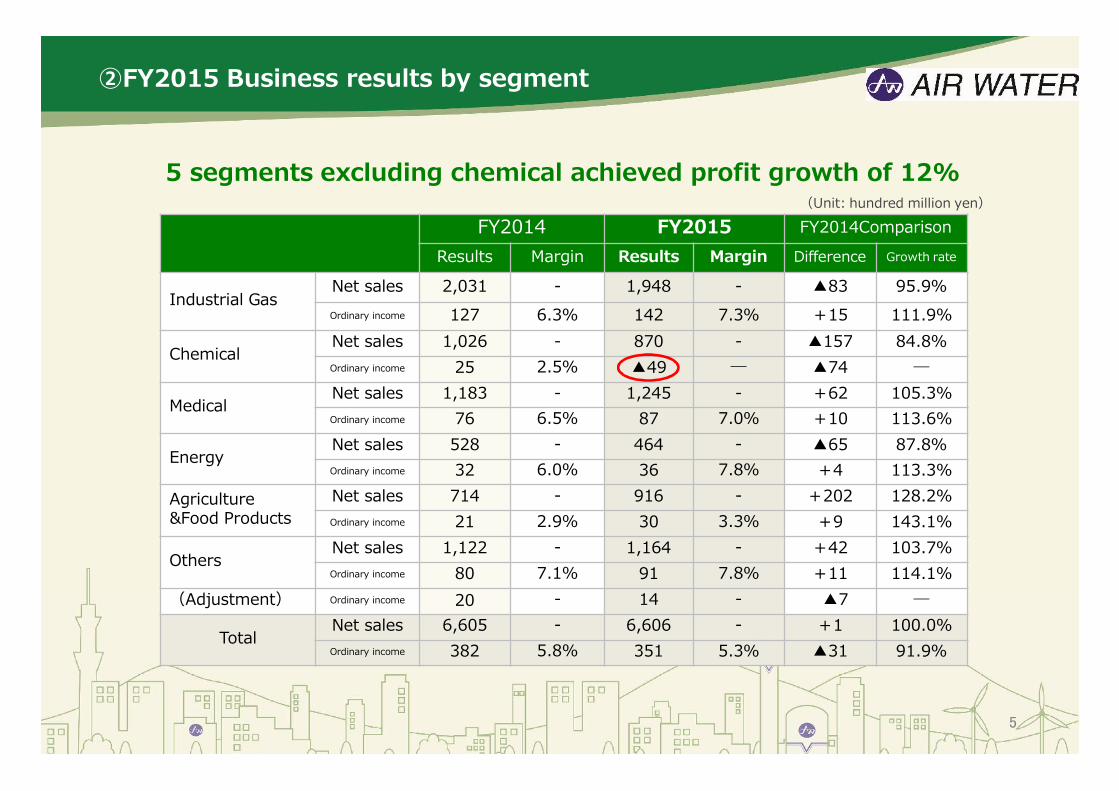
②FY2015 Business results by segment
FY2014 FY2015 FY2014Comparison
Results Margin Results Margin Difference Growth rate
Industrial GasNet sales 2,031 - 1,948 - ▲83 95.9%Ordinary income 127 6.3% 142 7.3% +15 111.9%
ChemicalNet sales 1,026 - 870 - ▲157 84.8%Ordinary income 25 2.5% ▲49 ― ▲74 ―
MedicalNet sales 1,183 - 1,245 - +62 105.3%Ordinary income 76 6.5% 87 7.0% +10 113.6%
EnergyNet sales 528 - 464 - ▲65 87.8%Ordinary income 32 6.0% 36 7.8% +4 113.3%
Agriculture &Food Products
Net sales 714 - 916 - +202 128.2%Ordinary income 21 2.9% 30 3.3% +9 143.1%
OthersNet sales 1,122 - 1,164 - +42 103.7%Ordinary income 80 7.1% 91 7.8% +11 114.1%
(Adjustment) Ordinary income 20 - 14 - ▲7 ―
TotalNet sales 6,605 - 6,606 - +1 100.0%Ordinary income 382 5.8% 351 5.3% ▲31 91.9%
5 segments excluding chemical achieved profit growth of 12%(Unit: hundred million yen)

6
① Look Back of “NEXT-2020 Ver.1”② Management issues of NEXT-2020 Ver.2 and
progress summary for each business③ Major achievements based on 3 basic policies④ NEXT-2020 Ver.2 Trend in consolidated results
1 FY2015 Results
FY2013~2015Review of mid-term business plan “NEXT-2020 Ver.2”2
FY2016~2018New medium-term management plan
NEXT-2020 Ver.33
FY2016 Earnings Forecast5
Investment plan / Shareholder return4

7
① Look Back of “NEXT-2020 Ver.1”
Final year of previous mid-
term plan
Medium-term management plan“NEXT-2020 Ver.2”
Growth over 3-year period(Compared to FY2009)
FY2012 FY2015Plan
FY2015 Result Dfference Growth rate
Net Sales 5,400 7,000 6,606 +1,206 122.3%
Operating income 279 400 395 +116 141.7%
Ordinary income 352 420 351 ▲ 1 99.7%
Net income 184 230 201 +18 109.7%
Recurring margin 6.5% 6.0% 5.3%
ROE 10.3% 10.2% 8.7%
EPS(JPY) 94.04円 117.68円 102.73円
Equity capital ratio 38.3% 39.4% 40.8%
Net D/Eratio 0.65 0.74 0.57
Despite chemical business’s significant profitability deterioration due to impairment of C-Chem, other 5 segments performed well, secured annual growth of 8%
*Ordinary income excluding chemical was ¥32.1 billion for FY2012 and ¥40.0 billion for FY2015. Growth for the 3-year period was 24.6%.
(Unit: hundred million yen)

8
Segment Result
up:sales
under:
ordinary income
②Management issues of NEXT-2020 Ver.2 and progress summary for each business
Basic Policy
Business Challenge
【Industrial-related businesses】
Rebuilding profitability
[Person-related businesses]
Driving high growth by focusing on M&A
Demonstration of collective strengths through pursuing synergies
(Driving force for growth and evolution)
Expansion of person-related businesses
( Challenges to growing fields )
Acceleration of structural reform
(Rebuilding core businesses)
20121,734
136
Industrial GasEnhancement of local businesses progressed due to promotion of industrial gas infrastructure development
20151,948
142
2012934
31
2015870▲49
2012789
64
20151,245
87
2012461
13
2015916
30
2012541
31
2015464
36
2012942
57
OthresWe built a foundation for sea water industry based on one-of-a-kind technology and products. We will make a strategic move for further growth.
20151,164
91
Growth rate
12%
4%
Growth rate
58%
35%
Growth rate
▲14%
15%
Growth rate
23%
59%
Growth rate
98%
137%
Growth rate
▲7%
ー
ChemicalDespite rebuilding of growth strategies for coal chemicals by adding Kawasaki Kasei Chemicals into our group, deterioration of companies under equity method had large adverse effects.
MedicalConstructing the pillars of 5 businesses, a system dedicated to growing fields is in place.
Agriculture&FoodStrengthening businesses from upstream to downstream by promoting M&A, we built a foundation for further growth.
EnergyWe built a business structure that can tolerate changes in business environment by strengthening measures to increase customers and volume.

9
③Major achievements based on 3 basic policies
Business growth was driven by promoting M&A
●MedicalUsing M&A, home-care and medical services were enhanced and a foundation for general programs for hospitals was strengthened.
●AgricultureM&A from upstream to downstream was accelerated with an eye to building our own supply chain
●EnergyEnvironmental impact was compensated by acquisition of trade rights and complete sales expansion measures.
●ChemicalAttempted to enhance businesses by adding Kawasaki Kasei Chemicals into our group
●M&A ResultsNumber of companies: 14
New consolidation total net sales:689 Million yen
●Industrial GasPromotion of proper gas pricing associated with rise in electricity prices
Local supply system improved by actively promoting VSU, establishing new filling stations and replacing plants. Cost improved
●ChemicalFine chemicals promoted shifting production in China
Despite promotion of structural reform, affiliates accounted for by the equity method faced with deteriorating performances, affected by a sharp fall in crude oil prices
●OverseasStart-up of Vietnam plant using VSU technology
Acquired Ellenbarrie and entered Indian market
Monetized metal surface processing business overseas. The R&D outcomes
●Electric generation businessNihonkaisui Wood-based biomass electricity generator started
Azumino Started construction of energy center utilizing wood-based biomass
Yamaguchi biomass and coal mixed firing electricity generation Environmental assessment started
Strengthening corporate structure by structural reform Development of growth drivers

④NEXT-2020 Ver.2 Trend in consolidated results
Despite significant negative growth in chemical business, operating income surpassed previous year
10
0
2,000
4,000
6,000
8,000
10,000
2009年度 2010年度 2011年度 2012年度 2013年度 2014年度 2015年度
Net salesOperating income
Ordinary income
Net income
NEXT-2020 Ver.1 NEXT-2020 Ver.2
139
117
172184
192 201207
6,6066,413
4,7184,264
282 290 313 330 350 363395
351
4,9275,400
6,605
317 336279
352 361382
200
400
600
800
1000(Unit: hundred million yen)

11
① Recognition of business environment② Goals of Air Water group③ Management issues of Air Water group ④ Ver.3 Performance objectives⑤ Ver.3 Portfolio to be achieved⑥ Ver.3 Growth analysis
1 FY2015 Results
FY2013~2015Review of mid-term business plan “NEXT-2020 Ver.2”2
FY2016~2018New medium-term management plan
NEXT-2020 Ver.33
FY2016 Earnings Forecast5
Investment plan / Shareholder return4
12
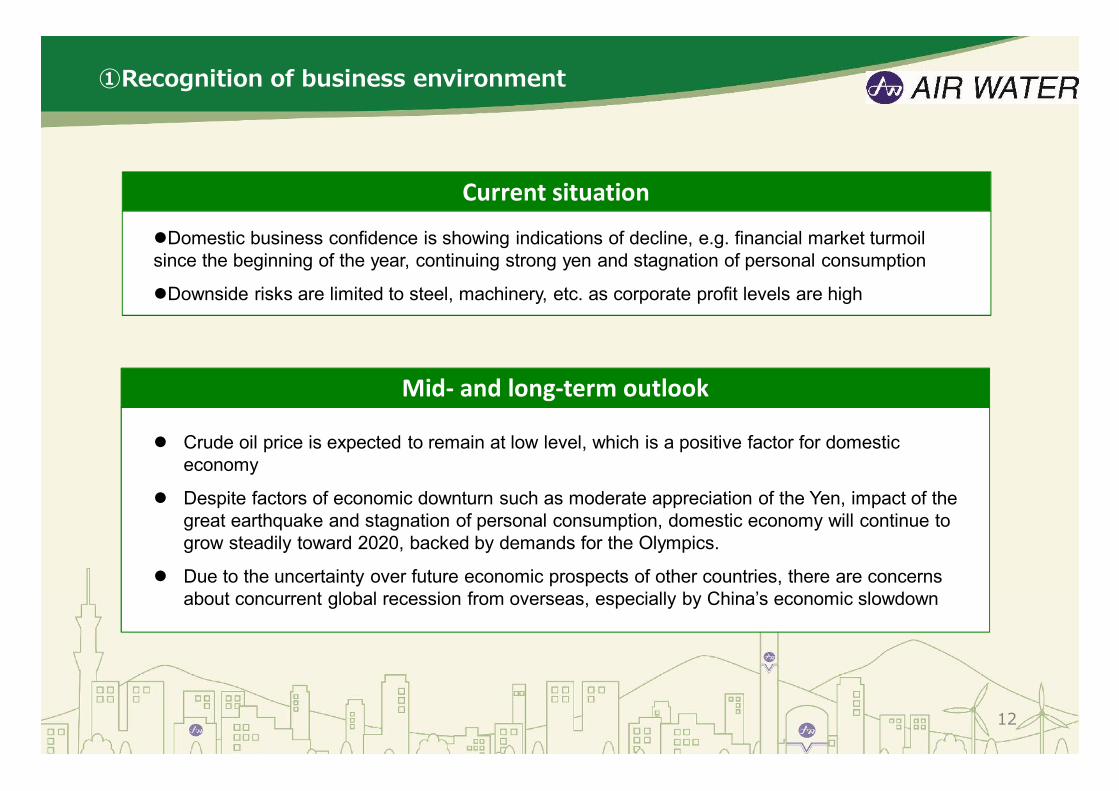
①Recognition of business environment
Current situation
Domestic business confidence is showing indications of decline, e.g. financial market turmoil since the beginning of the year, continuing strong yen and stagnation of personal consumption
Downside risks are limited to steel, machinery, etc. as corporate profit levels are high
Mid- and long-term outlook
Crude oil price is expected to remain at low level, which is a positive factor for domestic economy
Despite factors of economic downturn such as moderate appreciation of the Yen, impact of the great earthquake and stagnation of personal consumption, domestic economy will continue to grow steadily toward 2020, backed by demands for the Olympics.
Due to the uncertainty over future economic prospects of other countries, there are concerns about concurrent global recession from overseas, especially by China’s economic slowdown

13
Actively challenge to various issues with the entrepreneurial spirit in mind
①Recognition of business environment
● Sluggish growth in emerging countries● Economic slowdown in Chinese economy● Fluctuation of exchange rates● Sharp fall in crude oil prices● TPP● Competition to secure resources, food and water● Increase in geopolitical risks● Frequent abnormal weather affected by climate change● Changes in population structure
Restoration of manufacturing business
Stable supply of industrial materials Efficient management using outsourcing Manufacturing products with high added value
Daily life and medical care
Decreasing birthrate and aging of the population Needs for advanced medical care Shortage of medical care providers Extension of healthy life expectancy
Safety and security of food
Traceability Domestic raw materials/food self-sufficiency Sustainable agriculture
Energy/Resources Liberalization of energy Rise in electricity costs Fall in crude oil prices Recycling society
Environmental measures
Water resource management Effective utilization of unused resources Efforts to prevent global warming
Social challenges that we should addressTrends surrounding management

14
② Goals of Air Water group
We dedicate ourselves and our resources backed by the entrepreneurial spirits and pride in creation and development of
business linking air, water, the earth, and human
Management Philosophy
Know YourselfUnderstanding of management environment
Analysis of business structureDevelopment of growth strategies
Implementation of action
guidelines
Cross-Over DiscussionNew business creation through synergies among businessesBusiness model creation using group’s collective strengths
All businesses make efforts with the mainstay business spirit
Realizing the Vision for 1-trillion Company by maximizing group synergies
All Wetaher SystemConsistent implementation of
Air Water style management
Order Rodentia StyleOrder Rodentia Style of Business that pursues All Weather Management System by focusing on next generation's needs and balancing industrial-related businesses and person-related businesses and that realizes sustainable growth by all group businesses collaborating quickly and flexibly and creating synergies.

③ Management issues of Air Water group
Challenges for structural reform and sustainable growthNurture “earning power” and create a highly profitable business structure to achieve sustainable growth and development
中期経営計画Ver3 基本コンセプト
15
Pursuit of ultimate solution services and realization of innovation● Pursuit of best products and services that meet customers’ needs
● Realization of business innovation by mobilizing group’s collective strengths● Enhancement of business structure centering on local businesses
Strengthening of corporate structure by implementing business structural reform● Strategic investment to strengthen a business foundation
● Establishment of support system for each department
● Thorough efficiency and rationalization in all department
● Full compliance
Challenges towards issues for post 2020● Overseas ● Strategic technology
3 implementation measures
Basic concept for the mid-term management plan “NEXT-2020 Ver.3”
“Establishing a structure for achieving the Vision for 1-trillion Company”“Building a foundation for post 2020”
16
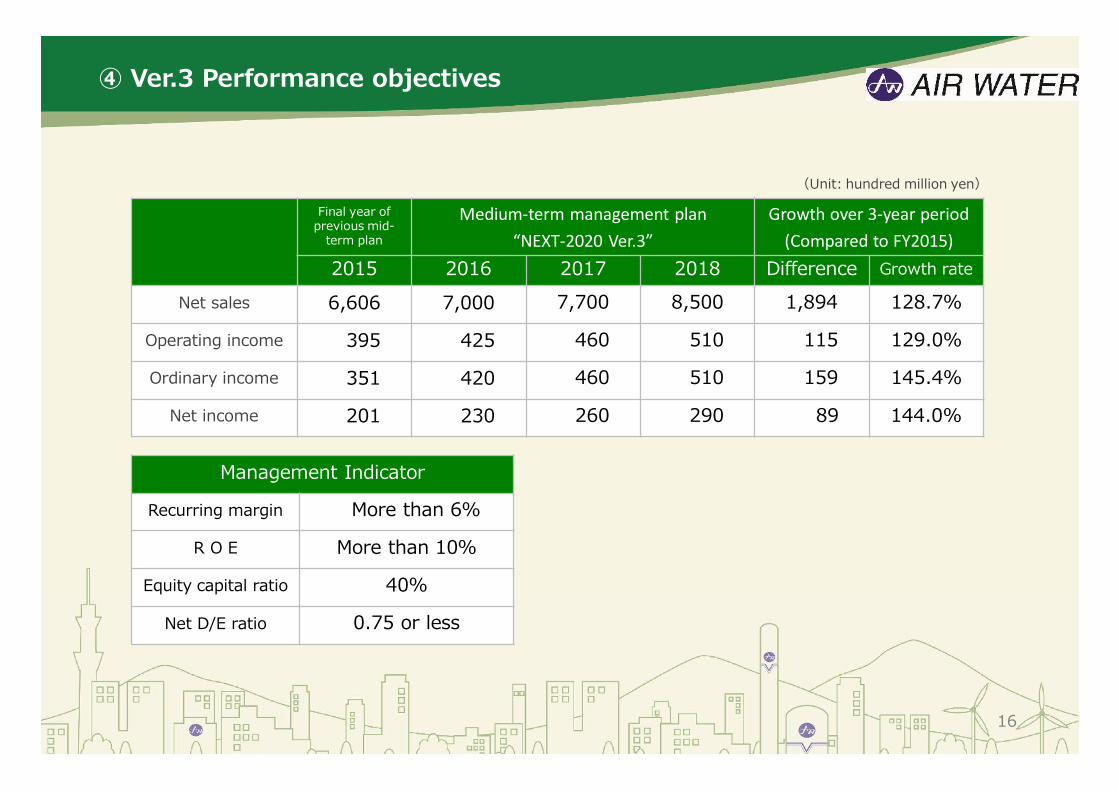
④ Ver.3 Performance objectives
Final year of previous mid-
term plan
Medium-term management plan“NEXT-2020 Ver.3”
Growth over 3-year period(Compared to FY2015)
2015 2016 2017 2018 Difference Growth rate
Net sales 6,606 7,000 7,700 8,500 1,894 128.7%
Operating income 395 425 460 510 115 129.0%
Ordinary income 351 420 460 510 159 145.4%
Net income 201 230 260 290 89 144.0%
Management Indicator
Recurring margin More than 6%
R O E More than 10%
Equity capital ratio 40%
Net D/E ratio 0.75 or less
(Unit: hundred million yen)

0
1,000
2,000
3,000
4,000
5,000
6,000
7,000
8,000
9,000
10,000
2010 2011 2012 2013 2014 2015 2016 2017 2018 2019 20200
2,500
5,000
7,500
10,000
2015年度 2018年度
⑤ Ver.3 Portfolio to be achieved
[Businesses that support profit base by steady growth]
Industrial gas, Energy, Chemical
Ratio of industrial-related businesses and person-related businesses (Net sales)
[Businesses that drive overall company results by high growth potential]
Medical/agriculture/food products, Independent businesses (Order Rodentia Style)
[Businesses for next-generation growth]
Overseas, Electric power business, R&D
2,818
(43%)
3,789
(57%)
5,300
(62%)
3,200
(38%)
Portfolio for growth (Net sales) Portfolio to be achived(Net Sales)
【 Industrial-related businesses 】
【 Person-related businesses 】(Medical・Energy・Agriculture & Food ・other)
(Industrial gas・Chemical)
17
Industrial gas and energy grew consistently and contributed to earningsMedical care and agriculture/food products drove overall company results by high growthWe will back on the growth path by maximizing collective strengths of various businesses
億円
(Unit: hundred million yen)

⑥Ver.3 Growth analysis
Accelerate growth by active M&A and new synergistic effects
(composition)
Growth of existing businesses Synergy growth
M&A
【sales】
【Ordinary income】
Ordinary income growth
+16 billion yen
Sales growth +190 billion yen
※Extension amount in three years of the company that carried out the M & A in Ver.1 ~ 2
50%
12%
38%
44%
19%
38%
18
<3-year growth analysis diagram of Ver.3>

19
① Investment plan ② Cash flow and financial measures③ Pay out ratio
1 FY2015 Results
FY2013~2015Review of mid-term business plan “NEXT-2020 Ver.2”2
FY2016~2018New medium-term management plan
NEXT-2020 Ver.33
Investment plan / Shareholder return4
FY2016 Earnings Forecast5

0
1,000
2,000
3,000
Ver.1 Ver.2 Ver.3
20
① Investment plan
Ver.1 Ver.2 Ver.3 plan
Capital investment 908 1,051 1,400
(Depreciation cost) (619) (762) (905)
M&A investment 307 283 600
Strategy investment(Electric power) ―― 15 400
Total 1,215 1,349 2,400
M&Ainvest,emt
Capital investment
Strategy Investumt
Segment Ver.2 Ver.3Plan
◆ Industrial gas 413 520
◆ Chemical 58 80
Industrial-related businesses 471 600
◆ Medical 57 120
◆ Energy 84 70
◆ Agriculture&Food 95 140
◆ Other 344 470
Person-related businesses 580 800
Total 1,051 1,400
Conduct investment to create sustainable corporate value(Unit: hundred million yen)

21
② Cash flow and financial measures
Free cash flows
▲ 720億円Free CF(Total)
Investment cash flows
Operating cash flows
■ Net income■ Depreciation cost■ Other
780980
▲ 80
Operating CF(total) 1,680
■ Capital investment■ M&A investment■ strategy investment
1,400600400
Investment CF(total) 2,400
Improved ability to generate cash flows
Consolidated operating CF for FY201560 billion yen or higher
Maintenance and improvment of efficiency in asset utilization and efficiency in capital utilization
ROA:7% ROE:10% or higer
Maintenance of financial stability
Equity ratio :40%Net D/E ratio:0.75 or less
3-year free cash flow Managing both Prior investment and financial balance
(Unit: hundred million yen)

22
③ Pay out ratio
Air Water has the basic policy of paying stable dividends appropriate to business results long into the future, aiming for 30% of consolidated net income for a reporting period.
Basic policy regarding dividend payments
Changes in consolidated net income per share for the reporting periods
FY2015 FY2016 FY2017 FY2018
Consolidated net income per share(EPS) 102.73 117.3 132.6 147.9
(Unit: hundred million yen)

23
① FY2016 full-year consolidated business forecasts② FY2016 earning forecast according to the segment consolidated business forecasts③Summary of FY2016 management objectives
1 FY2015 Results
FY2013~2015Review of mid-term business plan “NEXT-2020 Ver.2”2
FY2016~2018New medium-term management plan
NEXT-2020 Ver.33
Investment plan / Shareholder return4
FY2016 Earnings Forecast5
24
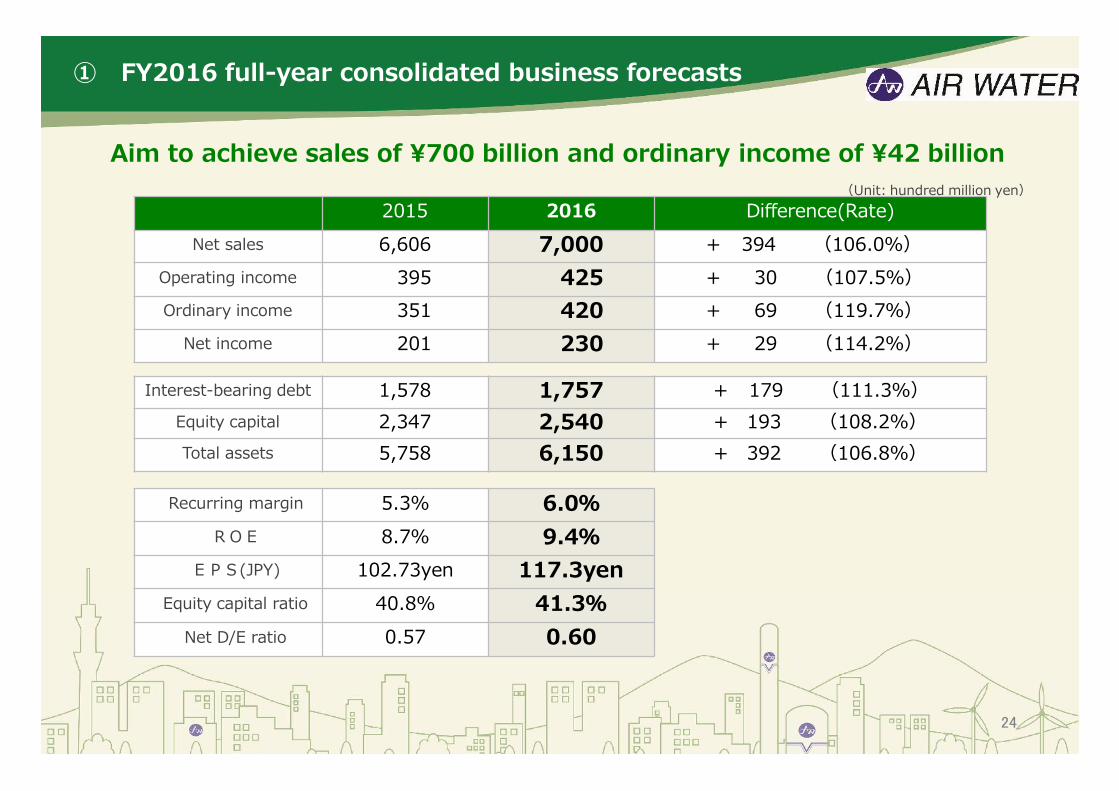
Recurring margin 5.3% 6.0%ROE 8.7% 9.4%
EPS(JPY) 102.73yen 117.3yenEquity capital ratio 40.8% 41.3%
Net D/E ratio 0.57 0.60
2015 2016 Difference(Rate)Net sales 6,606 7,000 + 394 (106.0%)
Operating income 395 425 + 30 (107.5%)Ordinary income 351 420 + 69 (119.7%)
Net income 201 230 + 29 (114.2%)
Interest-bearing debt 1,578 1,757 + 179 (111.3%)Equity capital 2,347 2,540 + 193 (108.2%)Total assets 5,758 6,150 + 392 (106.8%)
① FY2016 full-year consolidated business forecasts
Aim to achieve sales of ¥700 billion and ordinary income of ¥42 billion(Unit: hundred million yen)

25
② FY2016 earning forecast according to the segment consolidated business forecasts
FY2015 FY2016 FY2015Comparison
Results Margin Results Margin Difference Growth rate
Industrial GasNet sales 1,948 - 2,050 - +102 105.2%Ordinary income 142 7.3% 152 7.4% +10 106.9%
ChemicalNet sales 870 - 830 - ▲40 95.4%Ordinary income ▲49 ― 4 0.5% +53 ―
MedicalNet sales 1,245 - 1,350 - +105 108.4%Ordinary income 87 7.0% 100 7.4% +13 115.4%
EnergyNet sales 464 - 510 - +46 110.0%Ordinary income 36 7.8% 37 7.3% +1 102.9%
Agriculture &Food Products
Net sales 916 - 1,010 - +94 110.3%Ordinary income 30 3.3% 32 3.2% +2 106.1%
OthersNet sales 1,164 - 1,250 - +86 107.4%Ordinary income 91 7.5% 86 6.9% ▲5 94.6%
(Adjustment) Ordinary income 14 - 9 - ▲5 -
TotalNet sales 6,606 - 7,000 - +394 106.0%Ordinary income 351 5.3% 420 6.0% +69 119.7%
(Unit: hundred million yen)

0
2,000
4,000
6,000
8,000
10,000
2009年度 2010年度 2011年度 2012年度 2013年度 2014年度 2015年度 2016年度 2017年度 2018年度 2019年度 2020年度
26
③ Summary of FY2016 management objectives
NEXT-2020 Ver.1 NEXT-2020 Ver.2 NEXT-2020 Ver.3
Constantly move one-step forward with pride and confidence of Air Water
8,5007,700
7,000
510460
6,606
10,000
4,264
351282
395
290
425420
(億円)
200
400
600
800
1000
Net salesOperating income
Ordinary income
Net salesOperating income
Ordinary income
Net income

The numerical targets and forecasts contained in this document arebased on currently available information and are subject to hiddenrisks and uncertainties.
Please note, therefore, that the actual results of Air Water coulddiffer materially from these projections, due to changes in variousfactors.