
FY2011 Annual Report on Food, Agriculture and Rural Areas ...
39
FY2011 Annual Report on Food, Agriculture and Rural Areas in Japan Summary Ministry of Agriculture, Forestry and Fisheries Japan, 2012
Transcript of FY2011 Annual Report on Food, Agriculture and Rural Areas ...

FY2011 Annual Report
on Food, Agriculture and Rural Areas in Japan
Summary
Ministry of Agriculture, Forestry and Fisheries
Japan, 2012

The FY2011 Annual Report on food, agriculture and rural areas in Japan is based on Items 1 and 2 of Article 14 of the Food, Agriculture and Rural Areas Basic Act (Law no. 106 for 1999).

Contents
FY2011 Annual Report on Food, Agriculture and Rural Areas in Japan
Foreword ········································································································ 1
Special Topic: A year of reconstruction from the Great East Japan
Earthquake -- Towards reconstruction steps -- ······························· 2
Chapter 1: Improving Japan's food self-sufficiency ratio ······························· 7
Chapter 2: Securing stable food supply ······················································· 10
Chapter 3: Sustainable development of agriculture ····································· 15
Chapter 4: Promoting and revitalization of rural areas ································ 25
Summary of FY2012 Measures for Food, Agriculture and Rural Areas ······ 28
Definitions ··································································································· 29

Acronyms and abbreviations
ASEAN Association of Southeast Asian Nations APTER ASEAN Plus Three Emergency Rice Reserve DI Diffusion Index GAP Good Agricultural Practice HACCP Hazard Analysis and Critical Control Point JAS Japan Agricultural Standards JFC Japan Finance Corporation MAFF Ministry of Agriculture, Forestry and Fisheries TEPCO Tokyo Electric Power Company
Symbols ha Hectare kl Kilolitre a Are kg Kilogram t tons
Foreword
The Annual Report on Food, Agriculture and Rural Areas in Japan is submitted to the Diet every year under the Food, Agriculture and Rural Areas Basic Act.
At present, the restoration and reconstruction from the Great East Japan Earthquake are the top priorities for the government. Most of the disaster-damaged areas are rural. It is important for Japan to restore and reconstruct the disaster-damaged areas, including the Tohoku region, one of Japan’s leading food supply bases, as soon as possible. In addition to earthquake and tsunami damage, the disaster triggered a nuclear power plant accident that brought the unprecedented havoc of massive radioactive contamination. Particularly, Fukushima Prefecture was seriously damaged. Prompt and thorough responses are required for the damage.
Given such a situation, this report begins with a special topic titled “A year of reconstruction from the Great East Japan Earthquake -- Towards reconstruction steps,” describing a wide range of problems from the impacts of the earthquake-tsunami disaster and the nuclear plant accident on agriculture to changes in consumer sentiment, food industry trends and the disaster-damaged areas’ agriculture restoration and reconstruction efforts.
Through interviews with disaster-affected farmers and persons engaged in food industry, we have tried to grasp and convey the real conditions of the disaster-damaged areas.
FY2011 was the second year for the Basic Plan for Food, Agriculture and Rural Areas, which was reformed in March 2010. The basic plan positioned the food, agriculture and rural area policy as one of Japan’s national strategies to make a major policy shift and create the “society where agriculture and rural areas are supported by every citizen,” based on the following background:
(1) The food supply-demand balance has grown tighter due to increasing resource and food consumption accompanying the population and economic growth in developing countries and due to the diversification of the uses of farm products as indicated by expanding biofuel production. Even in the face of these changes, Japan’s agriculture has failed to fully meet consumer and food industry needs, and the food self-sufficiency ratio has worsened.
(2) As Japan’s economic society has matured and citizens’ values and lifestyles have diversified, rural area agriculture’s multifunctional roles, including water recharging and contribution to national land conservation, have become important.
(3) On the other hand, agriculture and rural areas face tough conditions including a substantial decline in agricultural income and serious shortages of motivated farmers.
The basic plan puts forward three agriculture policy principles – backing farmers by introducing the Income Support Direct Payment Program for Farmers, switching to a production system to meet consumer needs including “high quality,” and “safety and consumer confidence,” and reviving vigorous rural areas through collaboration between primary, secondary and tertiary industries. Based on these principles, it calls for implementing various measures integrally and steadily. It aims to increase Japan’s food self-sufficiency ratio to 50% on a calorie supply basis (70% on a production value basis) in FY2020 on the precondition of stakeholders’ maximum efforts to overcome challenges.
Given that two years have passed since the Basic Plan for Food, Agriculture and Rural Areas was reformed, this report verifies degrees of achievement for major policy measures provided by the basic plan. Based on the verification, this report describes efforts and their achievements over the past two years as specifically as possible.
The great earthquake-tsunami disaster has prompted citizens to once again recognize the food-supplying agriculture-forestry-fisheries sector as being very significant to their lives. We hope that this report will help citizens deepen their interest in and understanding of food, agriculture and rural areas.
1

(1) Earthquake-tsunami disaster’s damage to agriculture-forestry-fisheries sector and impact on the food industry, etc.
① The Great East Japan Earthquake caused a staggering 2,426.8 billion yen in damage to the agriculture-forestry-fisheries sector (including 947.6 billion yen for agriculture sector), some 18 times as large as the 133 billion yen for the Niigata Chuetsu Earthquake and about 27 times as large as the 90 billion yen for the Great Hanshin/Awaji Earthquake.
[Special Topic] A year of reconstruction from the Great East Japan Earthquake -- Towards reconstruction steps --
(Damage to Agriculture sector (as of March 5, 2012))
Main damageTotal number of
damage
Amount ofdamage (100million yen)
Main disaster area (Prefecture)
Damaged agricultural land 18,174 areas 4,006
Damaged agriculture facility,etc. 17,502 points 4,835
Subtotal 35,676 points 8,841
Section
Agriculturalland,facilities,etc.
Aomori, Iwate, Miyagi, Akita, Yamagata, Fukushima,Ibaraki, Tochigi, Gunma, Saitama, Chiba, Kanagawa,Nagano, Shizuoka, and Niigata
Source: MAFF
A drainage pumping station crippled by tsunami waves (Natori City, Miyagi Prefecture)
Agricultural crops ,livestock, etc. 142
Agricultural livestockproduction facilities, etc. 493
Subtotal 635
9,476Total
Agriculturalcrops, etc.
Aomori, Iwate, Miyagi, Akita, Yamagata, Fukushima,Ibaraki, Tochigi, Gunma, Chiba, Yamanashi, Nagano,and Niigata
(ha)
Paddy fields Upland fields
Aomori 156,800 79 0.1 76 3
PrefectureEstimated area of farmlands washed
away or flooded by tsunami
Breakdown by categoryShare for damaged area
Cultivated area (2010)
(Estimated area of farmlands washed away or flooded by tsunami (March 2011))
② Farmlands that were washed away or flooded by the tsunami are estimated to include 20,200 hectares in paddy fields and 3,400 hectares in upland fields. The three Tohoku prefectures of Iwate, Miyagi and Fukushima account for most of the damaged farmlands.
,Iwate 153,900 1,838 1.2 1,172 666Miyagi 136,300 15,002 11.0 12,685 2,317
Fukushima 149,900 5,923 4.0 5,588 335Ibaraki 175,200 531 0.3 525 6Chiba 128,800 227 0.2 105 122Total 900,900 23,600 2.6 20,151 3,449
Sources: MAFF
Farmland flooded by the tsunami and buried in rubble (Natori City, Miyagi Prefecture)
(Earthquake-tsunami disaster’s effects on food industry (January 2012))
③ The food industry was seriously affected by production drops, business suspensions, distribution ruptures, etc. due to damaged plants, rolling blackouts, packaging material production shortages, gasoline shortfalls, etc.
35.2 35.8 22.5 6.5 Japan
Still affected at present Unaffected a t present
Unaffected
Unknown
Affected
32.2
42.0
56.0
34.1
63.9
47.9
35.2
38.5
40.3
28.6
39.9
28.6
34.6
34.0
23.4
15.9
10.1
18.8
7.6
13.6
24.7
5.9
1.7
5.4
7.2
3.9
Koshinetsu/Hokuriku
Southern Kanto
Northern Kanto
Tohoku (excluding Iwate, Miyagi, Fukushima)
Tohoku (Iwate, Miyagi, Fukushima)
Tohoku (entire)
Hokkaido 6.2
Sources: JFC “Survey on Movement of the Food Industry in the Second Half of FY 2011” (March 2012)
29.0
27.3
21.2
32.9
30.6
30.0
34.7
36.7
35.2
41.7
32.9
29.8
31.8
24.1
19.1
8.1
8.3
10.2
7.8
8.5
Kyushu
Shikoku
Chugoku
Kinki
Tokai
0 10 20 30 40 50 60 70 80 90 100
%
2
(2) Emergency responses to the earthquake-tsunami disaster, and restoration/reconstruction efforts
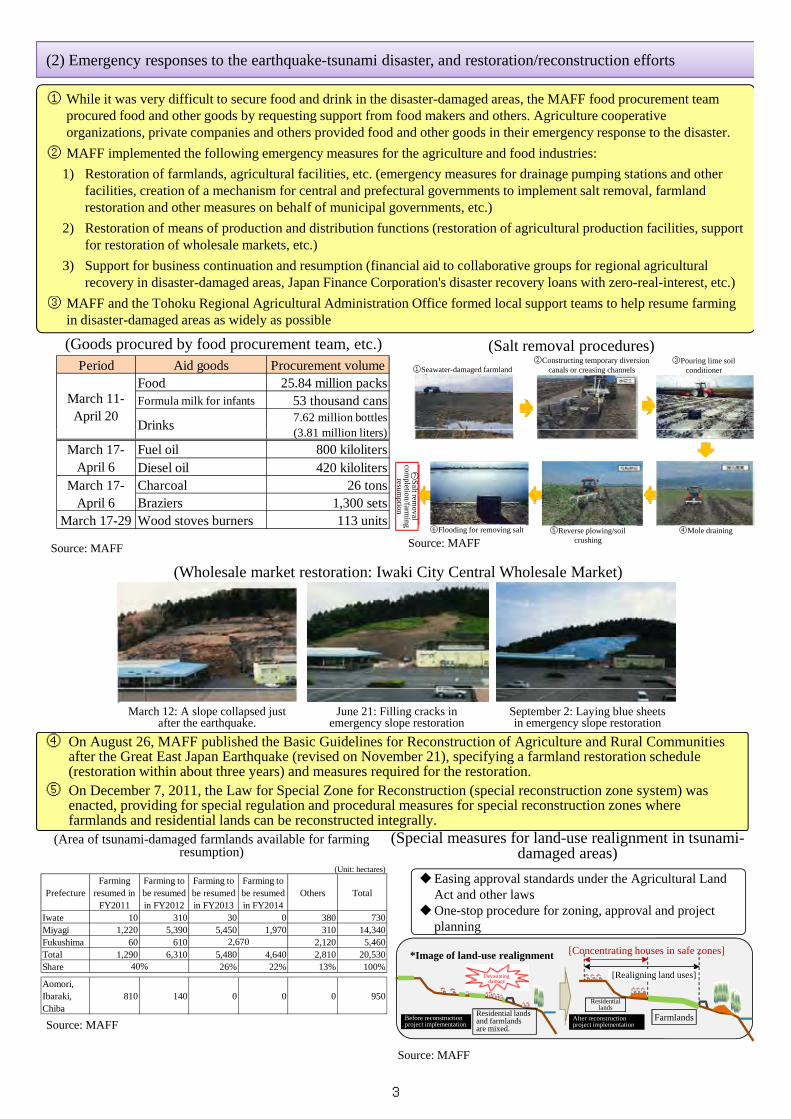
① While it was very difficult to secure food and drink in the disaster-damaged areas, the MAFF food procurement team procured food and other goods by requesting support from food makers and others. Agriculture cooperative organizations, private companies and others provided food and other goods in their emergency response to the disaster.
② MAFF implemented the following emergency measures for the agriculture and food industries:
1) R i f f l d i l l f ili i ( f d i i i d h1) Restoration of farmlands, agricultural facilities, etc. (emergency measures for drainage pumping stations and other facilities, creation of a mechanism for central and prefectural governments to implement salt removal, farmland restoration and other measures on behalf of municipal governments, etc.)
2) Restoration of means of production and distribution functions (restoration of agricultural production facilities, support for restoration of wholesale markets, etc.)
3) Support for business continuation and resumption (financial aid to collaborative groups for regional agricultural recovery in disaster-damaged areas, Japan Finance Corporation's disaster recovery loans with zero-real-interest, etc.)
③ MAFF d th T h k R i l A i lt l Ad i i t ti Offi f d l l t t t h l f i
Period Aid goods Procurement volumeFood 25.84 million packsFormula milk for infants 53 thousand cans
Drinks7.62 million bottles(3 81 illi li )
March 11-April 20
(Goods procured by food procurement team, etc.)
③ MAFF and the Tohoku Regional Agricultural Administration Office formed local support teams to help resume farming in disaster-damaged areas as widely as possible
(Salt removal procedures)①Seawater-damaged farmland
②Constructing temporary diversion canals or creasing channels
③Pouring lime soil conditioner
Drinks(3.81 million liters)
Fuel oil 800 kilolitersDiesel oil 420 kilolitersCharcoal 26 tonsBraziers 1,300 sets
March 17-29 Wood stoves burners 113 units
March 17-April 6
March 17-April 6
Source: MAFF Source: MAFF④Mole draining⑤Reverse plowing/soil
crushing⑥Flooding for removing salt
⑦Salt rem
oval com
pletion/farming
resumption
(Wholesale market restoration: Iwaki City Central Wholesale Market)
④ On August 26, MAFF published the Basic Guidelines for Reconstruction of Agriculture and Rural Communities after the Great East Japan Earthquake (revised on November 21), specifying a farmland restoration schedule (restoration within about three years) and measures required for the restoration.
⑤ On December 7, 2011, the Law for Special Zone for Reconstruction (special reconstruction zone system) was enacted, providing for special regulation and procedural measures for special reconstruction zones where farmlands and residential lands can be reconstructed integrally
3月12日震災直後の法面崩壊
6月21日法面復旧応急工事による亀裂等の整形
9月2日法面復旧応急工事によるブルーシート敷設
March 12: A slope collapsed just after the earthquake.
June 21: Filling cracks in emergency slope restoration
September 2: Laying blue sheets in emergency slope restoration
farmlands and residential lands can be reconstructed integrally.(Area of tsunami-damaged farmlands available for farming
resumption)(Special measures for land-use realignment in tsunami-
damaged areas)
Easing approval standards under the Agricultural Land Act and other laws
One-stop procedure for zoning, approval and project planning
[C t ti h i f ]
(Unit: hectares)
PrefectureFarming
resumed inFY2011
Farming tobe resumedin FY2012
Farming tobe resumedin FY2013
Farming tobe resumedin FY2014
Others Total
Iwate 10 310 30 0 380 730Miyagi 1,220 5,390 5,450 1,970 310 14,340Fukushima 60 610 2,120 5,4602,670
Source: MAFF
Source: MAFF
*Image of land-use realignment [Concentrating houses in safe zones]
Residential lands
Farmlands
[Realigning land uses]
Residential lands and farmlands are mixed.
After reconstruction project implementation
Before reconstruction project implementation
Devastating damage
Total 1,290 6,310 5,480 4,640 2,810 20,530Share 26% 22% 13% 100%
Aomori,Ibaraki,Chiba
810 140 0 0 0 950
40%
3

(3) FY 2011 agriculture conditions in disaster-damaged areas
① Salt removal has been completed or launched for 39% (8,310 hectares) of tsunami-damaged farmlands (at the end of March 2012).
② Of tsunami-damaged farms, 40% (about 4,090 farms) have resumed farming (as of March 11, 2012).③ Farming resumption has been supported by various parties including local governments, agricultural cooperatives, private
companies and volunteers.
Item Damage Notes
Farmlands
Tsunami-damaged farmlands in six prefectures (Aomori, Iwate, Miyagi, Fukushima, Ibaraki and Chiba): 21,480 hectares
*As for tsunami-damaged farmlands, the Basic Guidelines for Reconstruction of Agriculture and Rural Communities after the Great East Japan Earthquake target complete restoration in about three years and resumption of farming by FY2014.
0 20 40 60 80(%)100
Progress in restoration
Salt removal has been completed or launched for 39% (8,310 hectares) of tsunami-damaged farmlands (at the end of March 2012).
(Agriculture restoration conditions after the Great East Japan Earthquake)
39%
Farms
Tsunami-damage farms (in six prefectures: Aomori, Iwate, Miyagi, Fukushima, Ibaraki and Chiba): about 10,200 farms
Major drainage pumping
Major drainage pumping stations available for provisional restoration in three Tohoku prefectures: 72 points
About 4,090 farms that have resumed farming include those that have resumed part of agricultural production operations or started preparations for them (as of March 11, 2012).
40%(About 4,090 farms have resumed farming.)
100% (Emergency response measures taken for 72 points)
stationsprefectures: 72 points
Coastal farmlands
Priority restoration zones with considerations given to importance of hinterlands: 7.3 kilometers
Rural community sewerage
Number of disaster-affected districts in 11 disaster-damaged prefectures from A i t N 402di t i t
100% (Emergency response measures taken for 7.3 kilometers)
92%(Restoration has been completed or launched for 370 districts (at the end of March 2012)
Aomori to Nagano:402districts
(4) The Great East Japan Earthquake’s impact on citizens’ consciousness①The earthquake-tsunami disaster prompted consumers to strongly recognize the importance of stable food supply
arrangements.②Of consumers, 70% recognize the need for food storage. The disaster prompted 30% of consumers to recognize this need.
Source: MAFF
45.1
55.8
62.2
77.5
44.3
63.7
61.8
75.2
44.6
60.6
62.0
76.1
The food processers should build arrangements to expand production in emergencies
Food wholesalers and retailers should secure emergency transportation routes.
Infrastructure including roads, waterworks, electric grids and gas tubes should be enhanced
The agriculture-forestry-fisheries sector should be promoted to enhance food production capacity
34.3 34.5 11.7 18.7 Nationwide
I have become conscious of need
I have remained conscious with need
I have not been conscious with need
I have become unconscious with need
I don't know (neither)
(Changes in consciousness about need for food storage after earthquake-tsunami disaster)
(Measures considered to be required for stable food supply)
1.4
5.3
10.8
12.0
34.1
5.
1.1
8.3
12.1
16.3
40.4
1.3
7.1
11.6
14.6
37.9
Nothing
Others
The food service enterprises should secure sufficient food materials for emergency
Japan should secure food inventories through imports
Food wholesalers and retailers should secure sufficient inventories
%
NationwideEastern Japan
Western Japan
29.4
37.3
32.6
35.6
13.8
10.4
23.1
15.9
Western Japan
Eastern Japan
0 20 40 60 80 100%
I have become unconscious with need
0 20 40 60 80
%
Source:MAFF, “Survey on Consciousness and Intentions about Food, Agriculture and Rural Areas, and Fisheries and Fishery Products” (Conducted in January-February 2012)
Source:JFC, “1st Consumer Trend Survey in FY2011” (July 2011)
4

(5) The Effect of the accident at the Fukushima Daiichi Nuclear Power Plant of the Tokyo Electric Power Company (TEPCO) on agriculture and action taken by government responses
① Since just after the accident, MAFF has implemented the following measures to stably provide citizens with safe food.
1) Providing advice on creation of food inspection plans and supporting inspection equipment installations in relevant prefectures (since just after the accident)
2) Implementing technical guidance regarding feeding and management of livestock (March 19, 2011)
3) Setting provisional tolerable levels for forage for producing milk and beef below the provisional regulation value for3) Setting provisional tolerable levels for forage for producing milk and beef below the provisional regulation value for food (April 14, 2011)
4) Implementing demonstration tests regarding radioactive decontamination of farmlands. Conducting radioactive decontamination of farmlands with new technologies to work out a practical operation manual (Since May 28, 2011)
5) Implementing measures to reduce radiation levels through cultivation technology improvements and prevent crops from absorbing radioactive materials (since June 29, 2011)
6) Implementing measures to ensure consumers’ confidence in safety of beef, including purchases of distribution beef inventories suspected of being from cattle given radiation-contaminated rice straw (July 26 and August 5, 2011)
7) Setting provisional tolerable levels for fertilizers and feed for preventing radioactive contamination of farmland soil from expanding and for producing agricultural and animal products below the provisional regulation value for food (August 1,2011)
8) Releasing a farmland soil radiation level map (August 30, 2011). Updating the map to cover a wider scope and more details (March 23, 2012)
9) Supporting emergency radiation inspections for rice in Fukushima Prefecture and conducting an analysis of factors behind radioactive contamination, after detection of rice over the regulation level (November 2011). Implementing restrictions on rice planting for 2012 based on the analysis (releasing a relevant policy on February 28 2012)restrictions on rice planting for 2012 based on the analysis (releasing a relevant policy on February 28, 2012).
10) Revising provisional tolerable levels for producing animal and fishery products below the standards limits for radionuclides in foods (February 3 and March 23, 2012)
② On August 5, 2011, the government released interim guidelines for determining nuclear losses. On September 12, it established the Nuclear Damage Liability Facilitation Fund to support nuclear damages payments. By March 2012, agricultural damages payments regarding the nuclear disaster totaled about 106.2 billion yen.
(Farmland soil radiation level map (as of March 23 2012))
(Radioactive decontamination technologies according to radioactive cesium density levels in soil)
10,000~25,000
Radioactive cesiumdensity levels in soil
Technologies for application
Inventing plowing, radiation transferreduction cultivation, topsoil removal
(unplowed land)
~5,000Bq/kg
5,000~10,000Bq/kg
Top soil removal, inverting plowing, paddingwith water
March 23, 2012))
Farmlands
25000<
10000-25000
5000-10000
1000- 5000
Legend
Radioactive cesium levels of farmland soil at observation points (Bq/kg)*.
10,000 25,000Bq/kg
Topsoil removal
25,000Bq/kg
Using soil hardner for topsoil removal
<1000*Considering churning of soil through plowing and depths of crop plant roots, we collected soil at the depth of about 15 centimeters from the surface for paddy fields and at the depth of up to 30 centimeters for upland fields and measured radioactive cesium density levels in the soil samples.
Evacuation advisory and other designated zones
Inverting plowing Padding with water
Source: MAFF
Using soil hardener for topsoil removal
Basic topsoil removal
Source: MAFF
5

Radioactive cesium reduction in tea leaves• Pruning (deep skiffing and medium level cutting)
covering leave layers• At non-pruned tea fields, branches are pruned to
increase leaves for cutting.
(Technologies to reduce radioactive materials in farm crops)Orchard decontamination methods
・Removal of rough bark The measure is applied for apple, pear and other fruit trees with rough bark. Older bark is removed.
Underground part Near root cutting of tea trees
Medium level cutting
Deep skiffing
Harvest
③
Source: MAFF
・High pressure washingThe measure is applied for peach and other fruit trees having no rough bark. Radioactive cesium on the tree surface is washed away.
③ Consumers tended to refrain from buying farm, livestock and other food products produced in areas where the effect of the accident at the Fukushima Daiichi nuclear power plant of TEPCO was feared.
④ Due to foreign countries’ import controls, the value of Japan’s farm and livestock product exports declined substantially, including those to China and other Asian countries. (Exports in the April-December 2011 period plunged by 40.9 billion yen or 11.0% from the year before.) The Minister of Agriculture, Forestry and Fisheries and other government officials made direct appeals to ministers and government officials of foreign countries and regions in a bid to recover confidence in Japanese farm, forestry and fisheries products and food. Such efforts brought about some achievements including Hong Kong’s response that it would ease import restrictions based on
39.0
23.3
Extra costs emerged for radiation tests and various certificates as
Fukushima
Tohoku (excluding Fukushima Pref.)
Entire Japan
41 1
20.3
11.6
Extra costs emerged for radiation tests and various certificates as
t d b t di t
Entire Japan
Tohoku (excluding Fukushima Pref.)
Fukushima
(Effects of TEPCO nuclear plant accident (multiple answers))
(Farmers) (Food industry personnel)
brought about some achievements including Hong Kong s response that it would ease import restrictions based on scientific grounds.
56 3
28.3
81.0
52.4
43.9
37.8
Sales slackened because consumers tended to refrain from
buying food products
requested by trading partners. Fukushima Pref.
Kanto/Tosan
51 9
17.4
78.6
41.1
41.0
34.1
Sales slackened because consumers tended to refrain from
buying food products
requested by trading partners. Fukushima Pref.
Kanto/Tosan
40.8
56.3
57.1
30.5
30.9 We switched from agriculture, forestry and fisheries products in
areas with radioactive contamination fears to those in other areas (in Japan) for our
purchasing.
%3.7
51.9
8.9
4.1
3.0 Income declined due to the
abandonment of farm products and the relinquishment of
manufacturing and production due to foreign countries' import
controls and trading partners' refusal to import Japanese
products%
0 20 40 60 80 100 0 20 40 60 80
%
Source: MAFF, “Survey on Consciousness and Intentions about Food, Agriculture and Rural Areas and Fisheries and Fishery Products” (Conducted inJanuary-February 2012)
While one year passed after the Great East Japan Earthquake, various parties made restoration and reconstruction efforts. Nevertheless, restoration and reconstruction efforts for food, agriculture and rural areas for the earthquake-tsunami disaster and the nuclear plant accident are a top priority.In this respect, we must give consideration particularly to the feelings of people who have been forced by the accident at the Fukushima Daiichi nuclear power plant of TEPCO to give up using their farmlands that they had cultivated over a long period ofFukushima Daiichi nuclear power plant of TEPCO to give up using their farmlands that they had cultivated over a long period of time. At the same time, we must communicate information based on scientific basis in order to protect food safety from the effect of the accident at the Fukushima Daiichi nuclear power plant of TEPCO.Regarding communications, it is important to make sure that agriculture-forestry-fisheries sector people and other stakeholders are fully aware of relevant policy measures. Officials at regional agricultural administration and forest offices and relevant independent administrative organizations as well as MAFF must visit disaster-damaged areas frequently for this purpose.We should accurately address immediate challenges for food, agriculture and rural areas and proceed with systematic efforts while considering future prospects.
6

(1) Food self-sufficiency ratio trends
[Direction of policy measures as indicated by the Basic Plan for Food, Agriculture and Rural Areas (hereinafter, “the basic plan”)]- Raising the FY2020 food self-sufficiency ratio to 50% on a calorie supply basis (70% on a production value basis)
Chapter 1: Improving Japan’s food self-sufficiency ratio
① The food self-sufficiency ratio on a calorie supply basis declined by 2 percentage points from 41% in FY2008 to 39% in FY2010.
② The food self-sufficiency ratio on a production value basis rose by 4 percentage points from 65% in FY2008 to 69% in FY2010.
③ The decline in the ratio on a calorie supply basis is attributable to a drop in production of wheat sugar
on the precondition of stakeholders’ maximum efforts to overcome challenges- Setting challenges and quantitative production targets for major products
FY2008 FY2009 FY2010
Calorie supply basis 41 40 39
③ The decline in the ratio on a calorie supply basis is attributable to a drop in production of wheat, sugar plants (sugar beet and sugarcane) and tubers (potato and sweet potatoes) under abnormal weather conditions.
(Japan’s food self-sufficiency ratio trends)(Unit: %)
Rice Wheat Soybean Vegetables FruitsLivestockproducts
Fishproducts
Sugar plants Fasts Tubers, etc.Total
0.4
0 0
1.0
Production value basis 65 70 69
(Product-by-product contributions to food self-sufficiency ratio changes on a calorie supply basis (FY2008-2010))
Source: MAFF, “Food Balance Sheet”
FY2009 -1.2 -0.2 -0.6 -0.1 0.0 0.0 0.0 0.0 -0.4 0.3 -0.1
FY2010 -1.2 0.6 -0.3 0.0 -0.1 -0.1 -0.1 -0.1 -0.6 -0.1 -0.3
-2.4
-1.0
-0.1 -0.1 -0.1 -0.2 -0.2
-0.9
0.1 -0.4
-3.0
-2.0
-1.0
0.0 Contributions to food self-sufficiency ratio changes (points)
Source: MAFF
(2) Food self-sufficiency ratio improvement efforts[Direction of policy measures as indicated by the basic plan]- A quantitative production target is set at 500,000 tons for rice for flour and 700,000 tons for rice for feed. To achieve
these targets, such challenges as ①building a stable supply system and ②diffusing high-yielding cultivars to improve yields must be solved.
① In response to the introduction of the Income Support Direct Payment Program for Farmers, production in FY2011 expanded 40-fold from FY2008 for rice for flour and 20-fold for rice for feed.
(Changes in production of rice for flour and feed)(Rice for flour) (Rice for feed)
18.3 20 10,000 tons4.0 4
5 10,000 tons
Source: MAFF, “Certification of Plans for New-use Rice”
0.8 2.3
8.1
0
5
10
15
2008 2009 2010 2011
0.1
1.3
2.8
0
1
2
3
FY2008 FY2009 FY2010 FY2011
7

② “Mizuhochikara,” a high-yielding rice cultivar suitable for rice-based bread, has been developed along with “Momiroman” and “Hokuriku 193,” high-yielding rice cultivars suitable for feed rice and WCS (Whole Crop Silage) rice. Expectations are high for their future diffusion.
(Baking property of “Mizuhochikara” rice cultivar for rice flour) (Unit yields of high-yield rice cultivars for feed)
823 780663 654800
1000kg/10a
(Reference)
“Mizuhochikara” “Akimasari” as a staple rice cultivar
Volume ratio: 4.2 Volume ratio: 3.7
Source: MAFF
0200400600
Mom
iroman
Hokuriku 1 9
Nipponbare
Koshihikari
Note:The volume ratio is the ratio of bread volume to dough volume. A larger ratio indicates a lighter texture. Source: MAFF
[Direction of policy measures as indicated by the basic plan]- The wheat production volume target is set at 1.8 million tons. To achieve the target, such challenges as ①the
expansion of wheat production for bread/Chinese noodles and ②the diffusion of double cropping for paddy fields through the cultivation of good-quality late maturing paddy rice varieties will have to be solved.
① While the wheat-planted area increased slightly from 2008, production volume declined under bad weather conditions. The crop acreage for wheat for bread and Chinese noodles has increased gradually thanks to the
93
2008 2009 2010 20112020
(target)
Productionvolume
(10,000tons)
88.1 67.4 57.1 74.6 180
(Trends of crop acreage for wheat for bread/Chinese noodles)
(Wheat production volume trends)
p g g ydevelopment of new varieties.
16,882 17,726 20,210
21,550
15,000
20,000
25,000 ha
volume tons)
Crop acreage(10,000
hectares)20.9 20.8 20.7 21.2
Source: MAFF, “Crop Statistics”
Sources: MAFF
0
5,000
10,000
,
2008 2009 2010 2011
[Direction of policy measures as indicated by the basic plan]- The soybean production volume target is set at 600,000 tons. To achieve the target, such challenges as ①
organized aggregative farming of paddy fields and ②the diffusion of cultivation technologies contributing to improving and stabilizing unit yields will have to be solved.① The soybean-planted area declined in Miyagi Prefecture (by 1,380 hectares) and Fukushima Prefecture (by 780 hectares) due to the Great
East Japan Earthquake.② The area expanded for the introduction of “the soybean 300A technology” and similar soybean technologies contributing to improving unit
yields and stabilizing quality
20
25
30
35
401000 ha
Tohoku
Kanto
Hokkaido27
21
32
yields and stabilizing quality.
(Soybean production volume trends)(Area for introduction of Soybean
300A Technology, etc.)
2008 2009 2010 20112020
(target)
Production volume (10,000
26.2 23.0 22.3 22.0 60
0
5
10
15
20
2008 2009 2010
Hokuriku
Tokai
KinkiChugokuShikoku KyushuSource: MAFF, “Crop Statistics”
Sources: MAFF
oduct o vo u etons)
6. 3.0 .3 .0 60
Crop acreage(10,000
hectares)14.7 14.5 13.8 13.7
8

[Direction of policy measures as indicated by the basic plan]- Targets are set to increase production volume for buckwheat, rapeseeds, feed crops, etc.- For sugar beets, such challenges as the establishment of efficient production systems including direct seeding will have to
be solved.- For sugar cane, such challenges as the development of work contractor and joint production organizations will have to be
solved.- For feed crops, such challenges as the development of feed production organizations will have to be solved.- For fruits, such challenges as the acceleration of switching to higher-quality species or varieties will have to be solved.
① Buckwheat production volume increased from 2008 thanks to the introduction of the Income Support Direct Payment Program for Farmers. Rapeseed production volume also expanded.
② Among feed crops, the crop acreage for rice for feed increased. However, production volume fell on unseasonable weather conditions including heat waves.
③ Efforts to solve challenges are promoted for major crops:
1) Share for direct seeding for sugar beet production: 8% (2008 crop) → 12% (2010 crop)
2) Share for work contractors among sugar cane producers: 40% (2008 crop) →88% (2010 crop)
3) Number of work contractor farms for feed crops: 1,657 (2005) → 3,128 (2010)
4) Area for switching to higher-quality fruit species or varieties: 965 ha (FY2008) → 2,110 ha (FY2010)
(Production volume trends for other major crops)
2008 2009 2010 2011 2020 (target)
Buckwheat (10,000 tons) 2.7 1.7 3.0 3.2 5.9
Rapeseeds (10,000 tons) 0.1 - 0.2 0.2 1.0
Potatoes (10,000 tons) 274.3 245.9 229.0 (234.6) 290
Sweetpotatoes
(10,000 tons) 101.1 102.6 86.4 88.6 103
Sugar beets (10,000 tons) 424.8 364.9 309.0 354.7 380
S (10 000 t ) 159 8 151 5 146 9 161Sugarcanes (10,000 tons) 159.8 151.5 146.9 - 161
Vegetables (10,000 tons) 1,255 1,234 1,173 - 1,308
Fruits (10,000 tons) 344 338 294 - 340
Feed crops (10,000 TDNt) 435.6 418.8 419.0 - 527
Milk (10,000 tons) 794.6 788.1 763.1 - 800
Beef (10,000 tons) 51.8 51.6 51.2 - 52
Pork (10,000 tons) 126.0 131.8 127.6 - 126
Chicken (10 000 tons) 139 5 141 3 141 7 138
2 500ha Other fruits Other citrus
Chicken (10,000 tons) 139.5 141.3 141.7 - 138
Eggs (10,000 tons) 253.5 250.8 251.5 - 245
Sources: MAFF, “Crop Statistics” and “Food Balance Sheet”
(Accumulated area for switching to higher-quality fruit species or varieties)
862298463
653
222
300
411
130
184
500
1,000
1,500
2,000
2,500
965
1,441
2,110
457
Other citrusfruits
Apples
“U h ”361 548
862298
0
500
FY2007 FY2008 FY2009 FY2010
“Unshu” Mandarins
Sources: MAFF, “Statistics on Cultivated Area and Planted Area,” MAFF surveysNote: The area for switching means the area for plans approved under the orchard management support project.
9

(1) Securing food safety and consumer confidence[Direction of policy measures as indicated by the basic plan]- Promoting policy measures for food safety improvement backed by scientific knowledge and introduction of the Good Agricultural
Practice and the Hazard Analysis and Critical Control Point (HACCP) based on the concept that “an ounce of prevention is worth apound of cure ”
Chapter 2: Securing stable food supply
pound of cure,- Promoting traceability efforts, expanding of the origin labeling requirement for materials of processed food products steadily, etc.- Implementing appropriate risk management and control measures to enhance import quarantine, domestic control and epidemic
prevention measures
① It is important for improving food safety to take appropriate measures in each step from primary production to final consumption based on the concept that “an ounce of prevention is worth a pound of cure”. MAFF makes risk management decisions based on scientific evidence.
(Actions for ensuring food safety throughout the food chain)( g y g )
Preparing and disseminating food safety improvement guidelines
- Guidelines for reducing cadmium concentration in rice (August 2011)
Examples of actions for ensuring food safety from the farm to the table
Collection of scientific information and data, including surveillance and monitoring of
contamination in food and feed
Production Processing Distribution Consumption
Actions required
No concernAssessment Confirmation of food safety
- Guidelines for management to prevent fungal contamination of rice (February 2012)
- Guidelines for vegetable sanitary control from the cultivation to shipment stages (June 2011)
- Handbooks of good sanitary practices to prevent introduction and transmission of
Possibility of Contamination by mycotoxins in fungi-infected cereals
Possibility of increasing acrylamide level in heat-processing food
Growth of microorganisms in animal products and fish products
Adherence of food-poisoning bacteria to hands
② By FY2010 19% of food manufacturers introduced
prevent introduction and transmission of foodborne pathogenic bacteria in beef farms and chicken farms (August 2011)
- A manual for treating meat for raw consumption (Prepared in July 2011, revised in February 2012)
Timely control by fungicide application for each type of cereal.
Appropriate control of heating time and temperature
Keeping foods at a suitable temperature during transportation to stores
Washing hands thoroughly with soap before eating and cooking
Having introduced
IntroducingNo plan to introduce
Planning introductionUnaware of HACCP concept
2,1942,500Locations
(HACCP introduction trends by food sales scale)
③ A steady increase has been seen in the number of agricultural production locations that have adopted the GAP, which contribute to food safety improvement.
② By FY2010, 19% of food manufacturers introduced the HACCP. In the future, efforts are required to promote the HACCP introduction among small and medium-sized companies.
(Trends of GAP introducing agricultural production locations)
66
17
6
5
10
4
9
24
14
14
14
43
50
52
12
29
28
5-10 billion yen
100-5,000 million yen
50-100 milliion yen
Less than 50 millin yen
1,572
1,9842,194
500
1,000
1,500
2,000
16
68
3
5
20
16
44
10
17
0 20 40 60 80 100
All
More than 10 billion yen
y
%
0March 2009 March 2010 March 2011
Source: MAFFNote: GAP stands for Good Agricultural Practices. GAP are
sustainable improvement activities through the accurateimplementation, recording, inspection and assessment ofeach process in agricultural production operations in linewith check lists worked out according to relevant laws.
Source: MAFF
10

(Changes in products subject to origin labeling
requirement for materials of processed food products)(Outline of rice traceability)
⑤ Origin labeling for materials of processed food products under the JAS (Japanese Agricultural Standards) Law has increased steadily. In March 2011, two food categories were subjected to the origin labeling requirement. At present, the requirement covers 22 processed food categories and four processed food products including farm pickles.
④ In efforts to promote the traceability of rice and rice products, business entities have been required to prepare and keep transaction records since October 2010 and to relay place of origin information of rice ingredients of covered products since July 2011.
20 categories+ 4 products
8 products
20 categories+ 4 products
22 categories + 4 products
2 products
2 categories
Food service
enterprise
Steamed rice provision
Steamed rice arrival
Rice wholesaler
Rice arrival
Rice shipm
ent
Producer
Rice production
Rice sale
Consumer
Eating
Processing/manufacturing
Steamed rice shipm
ent
Rice arrival
Man
ufactu
reProcess
Conveying
production loc a
Conveying
production loc a
Conveying
production loc a
Conveying
production loca
q p p )
2006
Continued individual requirement
2009 2013
4 products
20categories
20categories
22Categories
2001
Arrival records
nl
Shipment
records
Arrival records
Shipment
records
Shipment
records
Arrival records
tation
ation
ation
g ation
Source: MAFF
Notified in 2004
Notified in 2007
Notified in 2011
⑥ Given that a Foot and Mouth disease (FMD) outbreak in Miyazaki Prefecture in 2010 and a Highly Pathogenic Avian Influenza epidemic from 2011 affected the livestock industry and the economy, the Act on Domestic Animal Infectious Diseases Control was revised in April 2011.
⑦ Over the recent years, FMD outbreaks have continuously occurred in neighboring Asian countries such as China and South Korea In response to such developments MAFF has disinfected shoe soles of all visitors from abroad
Source: Prepared by MAFF from Consumers Affairs Agency data
(Foot and Mouth Disease outbreaks in the world (as of April 1, 2011))
and South Korea. In response to such developments, MAFF has disinfected shoe soles of all visitors from abroad and vehicles and used quarantine detector dogs for enhanced baggage inspection at airports and seaports.
=Free countries where FMD vaccination is practiced (one country)
=Non-FMD-free countries (see note)
=Free countries where FMD vaccination is not practiced (65 countries)
=Non-FMD-free countries that have reported FMD outbreaks to the OIE since 2008
Source: MAFFNote:The above non-FMD-free countries include those that have OIE-identified
free regions where FMD vaccination is not practiced and those that haveOIE-identified free regions where FMD vaccination is practiced.
11

(2) Food consumption trends and promotion of food education
[Direction of policy measures as indicated by the basic plan]- Continuing to promote food education
① The Engel’s coefficient in Japan has leveled off at around 23% since 1995 after declining consistently from the end of the war. The leveling-off has come as food consumption has declined in line with a fall in overall household
ti di
23.7
23.6 24
28
32
20
25
30
3510,000 yen/month %
Household consumption spending
consumption spending.
(Trends of Engel’s coefficient)
23.7
8
12
16
20
0
5
10
15
20
1980 1990 1995 2000 2005 2011
Engel’s coefficient (right scale)
Food expense
0
Source:Ministry of Internal Affairs and Communications “Family Income and Expenditure
7
8 1st group2nd group
Unit: 1,000 yen
Source:Ministry of Internal Affairs and Communications, Family Income and Expenditure Survey” (two-or-more-member families)
(Trends of five income groups’ rice spending)
② Five income groups’ spending on rice indicates that rice spending has declined for higher-income groups since 1985 and that there was little rice spending gap between the groups in 2011.
0
1
2
3
4
5
6 2nd group3rd group4th group5th group
0 1980 1990 2000 2011
Source:Prepared by MAFF based on “Family Income and Expenditure Survey” by the Ministry of Internal Affairs and Communications
Notes: <1> Two-or-more-member families. Agriculture-forestry-fisheries families are excluded for 1999 and
earlier years.<2> The five income groups mean that all families are lined up in the order of income from the lowest
income families and divided equally into five groups.
Presentlevel
Target for 2015
70.5% 90% or more2. Reducing share for breakfast-skipping people (men in their 20’s and 30’s) 28.7% 15% or more
Target item
1. Share for people interested in Shokuiku
(Shokuiku promotion numerical targets and present levels in the Second Basic Plan for Promotion of Shokuiku (excerpts))
③ The government put forward the Second Basic Plan for Promotion of Shokuiku (food education) in March 2011. Priority challenges cited in the plan are lifetime Shokuiku, Shokuiku for prevention and improvement of lifestyle diseases, and Shokuiku for children through eating with family.
q y g p
g pp g p p .7% % o o e26.1% 30% or more
50.2% 60% or more
27.0% 30% or more
37.4% 90% or more
5. Increasing share for people experiencing agriculture-forestry- fisheries operations6. Increasing share for people with basic knowledge about food safety
3. Share for local products used in school lunches4. Increasing share for people with eating habits giving consideration to nutritional balance
Source: Prepared by MAFF based on the Cabinet Office’s Second Basic Plan for Promotion of Shokuiku
12

(3) Actions for developing food industry
[Direction of policy measures as indicated by the basic plan]- Given the requirement for environmental considerations, enterprises should promote the reduction of food
waste and greenhouse gas emissions to fulfill their social responsibility.- Food manufacturers and distributors should promote production and sales in Asian and other foreign
i h h i b i b
① The food industry has stepped up environmental conservation efforts. In FY2009, the industry recycled 80% of food waste for such purposes as feed and fertilizer production.
countries to enhance their overseas business bases.- “Food Industry Vision of the Future” will be established within FY2010, in which the proper form and
future direction of food industries will be set out.
② The number of Japanese food manufactures in Asia has increased year by year in line with the global expansion and diversification of food consumption.
7473 78 76 71 73
782623
21 21 23 2122
89 10 12 16 17
17
150
200
250
300
220235
246 253267
288Companies
ASEAN4
NIEs 3Others259
(Unit: %)
100 tonsor more
Less than100 tons
Foodmanufacturers
93 93 94 40 85
FY2008FY2012(Target)
FY2009
p
(Changes in number of Japanese food manufacturers in Asian countries)
(Estimated rate for recycling of recyclable food waste)
112 130 137 144 149 156 171
0
50
100
2003 2004 2005 2006 2007 2008 2009
ChinaFood
wholesalers59 58 64 44 70
Food retailers 37 36 38 26 45
Restaurants 13 16 34 9 40Food industry
total79 81 - - -
Source: MAFF
Source: Prepared by MAFF based on the Survey on Overseas Business Activities by the Ministry of Economy, Trade and Industry
Notes: 1) NIEs 3 includes 3 countries/regions: Singapore, Taiwan and Korea.2)ASEAN 4 includes 4 countries: Malaysia, Thailand, Indonesia and
Phili iPhilippines.
③ The food industry’s diffusion index (DI*) in the first half of 2011 declined from the year-before level due to the impact of the Great East Japan Earthquake. In the second half, however, the index indicated an improvement.
④ “Food Industry Vision of the Future” was established in March 2012, in which the proper form and future direction of food industries was set out.
*The DI is a gap between the percentage shares for enterprises expecting an increase (improvement) and those anticipating a decline (deterioration)
-13.8-9.8
-10
0
10
Sales DI Cash flow DI
(Changes in Food industry DI) (Food related industries market sizes in 2020)
23 525.9 11.2
12.7
14.0
2.62.9
3.2
2.3
2.6
2.8
80
100
120Unit: 1 trillion yen
Restaurants
Agriculture/fisheries
Materials supply industry
Related investment(118.9)
(107.7)
(95.7)
-19.3
-14.3
-50
-40
-30
-20
‐43.2
‐27.0‐26.7
‐35.5
Current profit DI
Business condition DI
34.5 38.9 42.9
24.2 27.2
30.1
20.9 23.5
0
20
40
60 Distribution industry
Food manufacturers
98.989.6
Food industry
79.5
501st half 2006
1st half 2007
1st half 2008
1st half 2009
1st half 2010
1st half 2011
Source:JFC, “Food Industry Trend Survey”Notes: 1) The business condition DI represents an average of sales, current
profit and cash flow DIs.2) The survey covered food related enterprises (manufacturers,
wholesalers, retailers and restaurants) throughout Japan.
Source: Prepared by MAFF based on MAFF’s “Economic Accounts for Agriculture and Food related Industries,” etc.
02009 2015 2020
13

(4) Establishing comprehensive food security
[Direction of policy measures as indicated by the basic plan]- Establishing comprehensive food security- Efforts to realize an emergency rice reserve arrangement for ASEAN+3 (ASEAN, Japan, China and South Korea)
① International grain and soybean prices rose again from 2010 and on. Grain production in 2011/2012
800
900
1,000
16
18dollars per tondollars per bushel
16.6941
(Changes in International price of grains and soybeans)
① te at o a g a a d soybea p ces ose aga o 0 0 a d o . G a p oduct o 0 / 0reached a record level exceeding demand. However, the inventory-sales ratio at the end of the season is expected to slip below the year-before level, indicating a tighter supply-demand balance for grains.
6.7
6.6
13.3
574
200
300
400
500
600
700
800
4
6
8
10
12
14 Rice (right scale)
SoybeansWheat
7.5
10.9
3.1
5.4
290
0
100
200
0
2
2005 2006 2007 2008 2009 2010 2011 2012
Corn2.1
Sources: Prepared by MAFF based on data from the Chicago Board of Trade and the Rice Committee, Board of Trade of Thailand
Note: One bushel is equivalent to 27.2155 kg of soybeans and wheat, and 25.4012 kg of corn.
②Given the Great East Japan Earthquake, we will consider various risks regarding stable food supply and revise the food security manual by the summer of 2012.
③ In October 2011, Japan signed the ASEAN Plus Three Emergency Rice Reserve (APTERR) Agreement.
(O i f APTERR)(Overview of APTERR)
Reserve release program①Ti 1
Each country’s earmark reservesJapan: 250 000 tons
Out of its reserve, each country may release a portion earmarked for an emergency release.
Earmark reserves
Country A
APTERR reservesFood aid
①Tier 1Aid using commercial futures trading contracts
②Tier 2Earmark reserve aid other than Tier 1 (including grant and long-term loans)
Japan: 250,000 tonsChina: 300,000 tonsSouth Korea: 150,000 tonsASEAN countries: 87,000 tons
Physical reserves are made available for the first emergency food aid after a disaster. After reserve periods pass, physical reserves may be used for the Poverty Alleviation and Malnourishment Eradication (PAME) program. Cash reserves may be used for a quicker response.
Japan’s achievements
Physical reserves (cash reserves)
Occurrence of a major
disaster
Source: MAFF
Japan s achievements(1) Physical reserves totaling about 1,860 tons
Philippines: about 950 tonsCambodia: about 380 tonsIndonesia: about 180 tonsLaos: about 350 tons
(2) Cash reserves covering about 480 tons(Myanmar, Indonesia, etc.)
Reserve release program③Tier 3
Aid using physical reserves (or cash reserves). (Cash reserves mean that a budget at the APTERR secretariat may be used for quick local rice imports.)
Country B
14

(1) Implementation of Income Support Direct Payment Program for Farmers
[Direction of policy measures as indicated by the basic plan]- Agriculture plays key roles for citizens’ livelihood, including the stable provision of food and the
demonstration of multiple functions Agriculture can play these roles only if it maintains sustainability as
Chapter 3: Sustainable development of agriculture
①Based on the implementation of the Pilot Income Support Direct Payment Program in FY2010, we formally implemented the Income Support Direct Payment Program for Farmers from FY2011.
demonstration of multiple functions. Agriculture can play these roles only if it maintains sustainability as an industry. The Income Support Direct Payment Program for Farmers has been introduced to secure sustainability and create an environment where all motivated farmers can continue agriculture and tackle their business development.
F t
② The number of participants under the program in FY2011 increased by 55,000 from the number under the pilot program in the previous year to 1,218,000.
(Number of participants under the Income Support Direct
Payment Program for Farmers by farm category)
Independentfarms
Incorporatedfarms
Community-basedfarm cooperatives
FY2011 1,218,237 1,203,367 7,254 7,616
FY2010 1,163,090 1,149,505 6,187 7,398
Change vs previous year
Number ofparticipants
Farm category
Change vs. previous year(growth rate)
55,147(4.7%) 53,862(4.7%) 1,067(17.2%) 218(2.9%)
Source: MAFF
③ The planned crop acreage size for income support direct payment participants for rice farming in FY2011 increased by 25,000 hectares from the previous year to 1,152,000 hectares. The excessive rice
Unit: hectares
i i l fExcessive rice
l d
FY2011 increased by 25,000 hectares from the previous year to 1,152,000 hectares. The excessive rice planted area compared with the target volume of rice production declined by 19,000 hectares to 22,000 hectares.
(Planted area for income support direct payment participants for rice farming)
Participants’planned cropacreage size
Staple rice plantedarea (nationwide)
Target volume ofrice productioncalculated area
planted areacompared with the
target volume of riceproduction
FY2011 1,151,545 1,526,000 1,503,864 22,136
FY2010 1,127,040 1,580,000 1,538,697 41,303
Change vs. previous year 24,505 -54,000 -34,833 -19,167
Source: MAFF
15

(Rice farmer's business conditions by planted area group)
④ The implementation of the Income Support Direct Payment Program for Farmers has made some contributions to improving farming business performance, promoting the adjustment of rice supply and expanding production of rice for new uses.
Revenues can cover business management
24,000 22,700
6,800
19,30020,000Family labor
costs
Revenues cannot cover business management or family labor costs
costs while failing to cover family labor costsRevenues can cover both business management and family labor costs
Production cost (yen per 60 kilograms)
Yellow: Variable paymentGreen: Fixed payment
10,500
10,260
9 200
8,000
8 900 8 600
1,7003,900
11,20012,0003,300 1,700
2,600
15,00016,000
15,900
13,660
4,500
13,900
6,8005,400
Business FY2010 selling
Profit
Green: Fixed payment
13,100
12,200
(Unit: 10,000 ha)100 120 140 1600
0 20 40 60 80
9,200 8,900 8,6004,000 management costs
selling price
Less than 0.5 ha265,000 ha(17 4%)
0.5-1.0 ha273,000 ha(17.9%)
1.0-2.0 ha282,000 ha(18.5%)
2.0-3.0 ha139,000 ha(18.5%)
3.0-5.0 ha147,000 ha(9.6%)
5.0 ha or more417,000 ha
Area covered by rice mutual relief
association1,526,000 ha
Staple rice
planted area
(Trends of excessive rice planted area compared
i h h l f i d i )
(Trends of planted area for rice for new uses)
Source: MAFFNote: Business management costs cover material procurement, interest payment, land rent and employment
costs for rice production.
(17.4%)( ) ( ) (9.6%)
(27.5%) (100%)area
15 939
23,086
30 000
40,000
50,000
60,000
70,000
WCS (Whole Crop Silage) rice
64,365
35,779
ha
7.1
5.44.9
4.14
5
6
7
8Unit: 10,000 ha
-1.7-0.5
-0.8
1 9
with the target volume of rice production)
4,957 7,324
14,883
33,955
9,08910,203
15,939
0
10,000
20,000
30,000
2008 2009 2010 2011
Rice for feed
Flour-use rice
10,60716,7272.2
0
1
2
3
4
2007 2008 2009 2010 2011
-1.9
Source: MAFF Source:MAFF
16

),(2) Income expansion through sixth industry promotion (collaboration of primary, secondary and tertiary
industries), etc.
[Direction of policy measures as indicated by the basic plan]- Promoting the expansion of added value through the qualitative improvement, processing and direct sales of agricultural products- Core direct sales stores should expand annual product lineups and enhance management and sales capabilities to promote the
local consumption of local produce.- Maintaining and expanding overseas sales channels for high-quality Japanese agriculture-forestry-fisheries and food products to
E
Various local resources originating from rural areas
Agriculture-forestry-fisheries products Se
Promoting collaboration of primary, secondary and tertiary industries
while attempting to expand markets
Integrating production, processing and distribution (sales) operations to expand
boost annual exports of these products to 1 trillion yen by 2020.
(Image of sixth industry promotion (collaboration of primary, secondary and tertiary industries) for agriculture and rural areas)
Effective utilization
Bio mass
ecuring employm
to revitalize an
distribution (sales) operations to expand added values
Secondary and tertiary industries’ participation in agriculture forestry and fisheries
Agriculture-forestry-fisheries sector’s processing and marketing efforts (diversification, integration, etc.), local consumption of local produces, exporting agriculture-forestry-fisheries and food products, etc.
- Rice straw- Food wastes n of resources in r
Natural energy
Experiences/knowledge
Landscape
Etc
ment and im
provind invigorate ruraTraditional culture
Agriculture-forestry-fisheries sector’s collaboration and fusion with secondary and tertiary industries to develop local businesses and create new industries
in agriculture, forestry and fisheries
Creating new businesses utilizing biomass and other resources in rural areas
Promoting agriculture-commerce-industry collaboration
Food wastes- Unused thinned wood
rural areas
Etc. ing income
al areas
Industries utilizing rural areas’ local resources for new businesses
Food industry, tourism industry, information technology industry, cosmetic/drug manufacturers, energy industry Etc.
Creating new added value
industry collaboration
Promoting renewable energy uses, etc.
① Commercial farm households that undertake farm product processing and other related business of agricultural
Source: MAFF
Note: The term “sixth industry” is derived by multiplying the industrial sectors as follows. First (primary)× second(secondary)× third (tertiary) to come up with the “sixth industry.” The sixth industry is expected to synergistically createnew added-value through effective use of agricultural, forestry and fishery products, as well as land, water and otherresources in farming, mountain and fishing villages, by integrating production, processing and distribution activities
Number of commercial farm households undertaking relatedbusiness of agricultural production
Number ofcommercial farm
(10,000 Households, %)
production doubled their share of Japan’s total commercial farm households between FY2000 and FY2010.
(Changes in Number of commercial farm households undertaking related business of agricultural production)
Processing ofagricultural products
Direct sales to storesand consumers
2000 233.7 (100.0) 25.3 (10.8) 2.0 (0.9) 8.4 (3.6)
2005 196.3 (100.0) 34.5 (17.6) 2.2 (1.1) 32.4 (16.5)
2010 163.1 (100.0) 34.2 (21.0) 3.2 (2.0) 32.1 (19.7)
commercial farmhouseholds
Source: MAFF, “Census of Agriculture and Forestry”
17

67.3Differentiation of products and development of product brands
(Unit: years)Average number
of years inCategoryNumber of years taken to
produce profit
(Key challenges conceived for cooperation of primary, secondary and tertiary industries)
(Years taken to produce profit (by farming category))
② Sixth industry promotion efforts (collaboration of primary, secondary and tertiary industries) may take some years to get on a profitable path (surplus).
③ Challenges for such collaboration include the development of product brands and the acquisition of relevant personnel.
52.7
54.5
55.8
0 20 40 60 80
Smooth funds procurement for launching or continuing businesses
High quality of raw materials and products
Acquisition of personnel for specific businesses
development of product brands
%
Average Minimum MaximumAll categories 13.5 4.1 0.0 25.0Rice farming 8.4 4.4 1.0 15.0
Vegetable farming 10.8 2.2 0.0 9.0Pig farming 16.2 8.8 2.0 25.0
Dairy farming 16.7 1.8 0.0 3.0Orchard farming 18.9 4.5 0.0 15.0
of years inoperation
Category produce profit
77 0%
0 20 40 60 80%
④ Most farmers running tourist farms and farm restaurants undertake direct sales and processing of agricultural
products integrally. Farmers running tourist farms and farm restaurants have a stronger sense of income growth
than those doing other businesses for collaboration of primary, secondary and tertiary industries.
Source: JFC, “Survey on Collaboration of Primary, Secondary and Tertiary Industries” (released in December 2011)
(Changes in farmers’ income through collaboration with primary, secondary and tertiary industries)
5.3 18.4
7.7
31.6
30.8
23.7
23.1
10.5
23.1
Tourist farms
Farm restaurants
No specific change
10% increase in income
10-30% increase in income
30-50% increase in income
50% or more increase in income
65.8%
77.0%
10.5
15.4
Decreased
4.4
5.4
22.4
17.7
20.0
23.4
32.7
33.9
10.2
12.4
9.8
6.5
0.5
0.8
0 20 40 60 80 100
Processing of agricultural
products
Direct sales
%
No response52.8%
52.7%
0 20 40 60 80 100
(Number of business plans approved under the sixth industry promotion act by region)
(Trends of agriculture-forestry-fisheries and food products exports)
⑤ Under the sixth industry promotion (collaboration of primary, secondary and tertiary industries) act implemented in March 2011, 709 business plans have been approved. The sixth industry’s planners have been distributed throughout Japan.
⑥ Agriculture-forestry-fisheries and food products exports in 2011 declined substantially from the previous year due mainly to the TEPCO Fukushima Daiichi nuclear plant accident and the yen’s appreciation.
Source: MAFF, “Survey on Consciousness and Intentions about Food, Agriculture and Rural Areas, and Fisheries and Fishery Products” (Conducted in January-February 2012)
1,482 2,040
2,077 1,724
1,950 1,736
2 000
3,000
4,000
5,000
6,000 Agricultural products Forestry productsFishery products
Unit: 100 million yen
3,609
4,4905,078
4,4544,920
4,511
industry promotion act by region) exports)
144
3 2
3
4
44
1
6
128
60
80
100
120
140
160
Fishery products-related plans
Cases
Forestry products-related plans
3
Agricultural and livestockproducts-related plans
2,038 2,359 2,883 2,637 2,865 2,652
0
1,000
2,000
2004 2006 2008 2009 2010 2011
Source: MAFF Source:Prepared by MAFF, based on Ministry of Finance, “Trade Statistics”
4982 88
3461
84 92
22
3
0
20
40
60
Hokkaido
Tohoku
Kanto
Hokuriku
Tokai
Kinki
Chugoku/
Shikoku
Kyushu
Okinaw
a
11
1
18

(3) Promoting motivated, diversified farmers’ business management
① Farms’ average agricultural income increased from 1.04 million yen in 2009 to 1.22 million yen in 2010 after continuing a downward trend. Particularly, paddy farms’ agricultural income in 2010 expanded 37% from the
[Direction of policy measures as indicated by the basic plan]- Raising and securing motivated, diversified farmers
60
Unit: 10,000 yen
47.537.3%
100
120
140 Unit: 10,000 yen
previous year affected by subsidies provided under the Pilot Income Support Direct Payment Program for rice farmers, despite rice price drops.
(Agricultural income trends) (Agricultural income trends (rice farming))
39.2 42.4 38.6 37.2 39.3
34.6
20.2
27.3
0
20
40
2004 2005 2006 2007 2008 2009 2010
Pilot program subsidies for rice farmers
Agricultural income (excluding pilot program subsidies for rice farmers)
126.2 123.5 122.8 119.5 108.2 104.2 122.3
0
20
40
60
80
100
2004 2005 2006 2007 2008 2009 2010
585.8 602.6
600
700
Unit: 10,000 yen
Source: MAFF, “Statistical Survey on Farm Management –Statistics by Farm Category (independent farms)”
Source: MAFF, “Statistical Survey on Farm Management –Statistics by Farming Category (independent farms)”
(Agricultural income trends by farming region)
104.2 122.3
90 0110.0 98 9 105.8 116.5 102.1 89 5
118.4 153.1
200
300
400
500
2010
2009
1,400 Agricultural income in 2009
Unit: 10,000 yen
90.0 61.2
98.9 78.0
102.1
54.7 71.4 82.0 78.4 82.7 89.5
0
100
Japan Hokkaido Tohoku Hokuriku Kanto/Tosan Tokai Kinki Chugoku Shikoku Kyushu
Source: MAFF, “Statistical Survey on Farm Management – Statistics by Farm Category (independent farms)”
(Rice farmers’ agricultural income (by planted area group))
27.3 40
60
47.5
34.6
Unit: 10,000 yen
600
800
1,000
1,200
Pilot program subsidies for rice farmers
Agricultural income in 2010 (including pilot program subsidies)
0
20
21(2009)
22(2010)
Average-200
0
200
400
1 2 3 4 5 6 7 8 9 10 11 12 13 14 15 16 17 18 19 20 21 22 23 24 25 26 27 28 29 30Less than
0.5 haMore than
20.0 ha15.0-20.010.0-15.07.0-10.05.0-7.03.0-5.02.0-3.01.0-2.00.5-1.0
)
Source: MAFF, “Statistical Survey on Farm Management – Statistics by Farming Category (independent farms)”
19

12 000
14,000
11,82912,052
Legal persons
14,000
16,000
Hokkaido
Farms
13,062
14,736
(Changes in community-based farm cooperatives by farming region) (Changes in agriculture production legal persons by farming
category)
② The number of community-based farm cooperatives has increased year by year, standing at 15,000 as of February 2012.
③ The number of agriculture production legal persons has also increased year by year, standing at 12,000 in 2011.
4,000
6,000
8,000
10,000
12,000
Orchard farming
Dairy farming
Vegetable farming
Others
3,816
5,889
2,249
2,068
2,423
915
4,000
6,000
8,000
10,000
12,000Tohoku
Hokuriku
Kanto/Tosan
Tokai
Kinki
Chugoku
10,063
0
2,000
1990 2000 2010 2011
Rice/wheat farming
4,397
0
2,000
2005 2008 2012
Shikoku
Kyushu
Okinawa
④ It is important to raise and secure new farmers. Challenges include how to secure income and improve
Source: MAFFSource: MAFF, “Survey on Community-Based Farm Cooperatives”
20.1
30.8
E i t i t t f d
Insufficient skill
Income is low
p g pskills. The farming grant system for young farmers started in FY2012.
(Business management problems for new entrants into agriculture in first or second year (biggest problem)
3.8
4.0
7.5
7.9
13.3
Labor shortage
Sales are unexpectedly slack
Failure to collect farmlands
Operating fund shortage
Equipment investment fund shortage
9.4
3.1
0 5 10 15 20 25 30 35
Others
Cultivation plans or schedules fail to be implemented
%
Source: National Chamber of Agriculture, “Fact-finding Survey on New Entrants into Agriculture”
(Ch i f )(Persons)
2006 2007 2008 2009 2010
72,350 64,420 49,640 57,400 44,800
39-year-old or younger persons 10,310 9,640 8,320 9,310 7,660
6,510 7,290 8,400 7,570 8,040
New self-employed farmers
New employed farmers
(Changes in new farmers)
39-year-old or younger persons 3,730 4,140 5,530 5,100 4,850
2,180 1,750 1,960 1,850 (1,680) 1,730
39-year-old or younger persons 700 560 580 620 (580) 640
81,030 73,460 60,000 66,820 54,570
39-year-old or younger persons 14,740 14,340 14,430 15,030 13,150
New participants in farming
Total new farmers
Source: MAFF, “Survey on Newcomers in agriculture”
20

(4) Active use of rural women’s capabilities
[Direction of policy measures as indicated by the basic plan]- Promoting rural women’s participation in farming management and women’s income-generating activities
for processing and marketing of agricultural products- Promoting working styles giving consideration to the rural work-life balance through the conclusion of
f il ’ f h i i i i l l i
① Rural women’s income-generating activities have increased steadily. While group-managed businesses account for a majority of new businesses launched by rural women, independently managed businesses have increased year by year. Many businesses are for food processing and sales in the farm stand.
② In 2011, for the first time all agricultural committees in Tochigi and Yamaguchi Prefectures included women members through elections. The number of agricultural committees with women members increased from the previous elections in 33 prefectures.
family management agreements to secure women’s further participation in local society.
previous elections in 33 prefectures.
③ In 2011, all agricultural cooperatives in Aichi, Shimane and Okayama Prefectures had female executives for the first time, joining Nara, Tottori, Kagawa, Kumamoto and Okinawa Prefectures that already had female executives at all such cooperatives.
④ The number of family management agreements to promote women’s participation in farm management has increased year by year, standing at 49,000 in 2011.
⑤ Opportunities for rural women to actively participate have increased, including the establishment of nationwide networks and attendance to international conferences
75.2Food processing
8 000
10,000
Cases
6 824
9,0509,533 9,757
networks and attendance to international conferences.
(Changes in the number of income-generating activities by rural women and type of activities)(Trends of the number of income-generating activities by rural women) (Type of activities (multiple answers))
20.4
20.5
59.7
Agricultural production
Exchanges with urban regions (through agricultural production and product
processing activities, farm restaurants, etc.)
Distribution/sales (including sales through farm stands and Internet)
3 3053,944 4,473
5,141
5,7455,589
5,284
2,000
4,000
6,000
8,000 6,824
Group management
Individual
3.3
0 20 40 60 80
Non-food processing
%
1,683
3,3053,9
0
,
2000 2005 2007 2010
management
48,60250 000
Households
Source: MAFF
(Changes in family management agreements)
12,030
21,575
32,120
40,663
,
10 000
20,000
30,000
40,000
50,000
5,335
0
10,000
1996 1999 2002 2005 2008 2011
Source: MAFF
21

(5) Securing fine farmland and promoting its effective use
[Direction of policy measures as indicated by the basic plan]- Securing fine farmland and promoting its effective use steadily to improve Japan’s food self-sufficiency ratio- Raising the utilization rate of cultivated land to 108% in 2020- Supporting efforts to utilize abandoned farmland and promoting efforts to eliminate idle farmlands under the revised
Agricultural Land Act
① The utilization rate of cultivated land in 2010 rose slightly for the first time in eight years due to an
increase in the planted area size for rice paddies as a decline in the total cultivated area size.
- Promoting farmland concentration for motivated, diversified farmers
(Aggregate planted area size, cultivated area size and utilization rate of cultivated land trends)
2008 2009 20102008 2009 2010Aggregate planted area (①) (10,000 ha) 426.5 424.4 423.3
Rate of change (%) (-0.95) (-0.49) (-0.26)Cultivated area (②) (10,000 ha) 462.8 460.9 459.3
Rate of change (%) (-0.47) (-0.41) (-0.35)Utilization rate of cultivated land(①/②)
(%) 92.2 92.1 92.2
Aggregate
Unit: 10,000 ha1985 1990 1995 2000 2005 2010
(Changes in area of abandoned cultivated land)
②The increase in abandoned cultivated land has slowed down over recent years.
Source: MAFF, “Statistics on Cultivated Area and Planted Area”
1985 1990 1995 2000 2005 2010
13.5 21.7 24.4 34.3 38.6 39.6Commercial farmhouseholds 7.3 11.3 12.0 15.5 14.4 12.4Non-commercial farmhouseholds 1.9 3.8 4.1 5.6 7.9 9.0Non-farm householdspossessing cultivated land 4.2 6.6 8.3 13.3 16.2 18.2
Total
Source: MAFF, “Census of Agriculture and Forestry”
15 9818.68 20.10 21.48 22.01
17.46 20.52
23.58 24.98 27.07 27.64
15
20
25
30 Hokkaido (business farm households)ha
(Changes in cultivated land under management per commercial farm household and per business farm household)
③ Cultivated land under management per commercial farm household continued increasing in 2011.
3.23
3.91 4.36
4.85 4.88 5.05
2 78 2 72 2 86
4
5
6 ha Entire Japan (business
farm households)
Japan excluding Hokkaido (business farm households)
3.54 4.09 6.76
10.11 11.88
13.95 15.98
0
5
10 Hokkaido (commercial farm households)
0.88 0.91 0.97 1.33 1.41 1.50 1.60
1.76 1.87 1.96 2.02
0.77 0.79 0.80 1.05 1.10 1.15 1.21 1.30 1.38 1.42 1.46
1.98 2.26
2.48 2.78 2.72 2.86
0
1
2
3
1960 1965 1975 1985 1990 1995 2000 2005 2008 2010 2011
Entire Japan (commercial farm households)
Japan excluding Hokkaido (commercial farm households)
Sources: MAFF, “Census of Agriculture and Forestry” and “Survey on Agriculture Structure Dynamism”
22
350
400
Unit: 10,000 ha
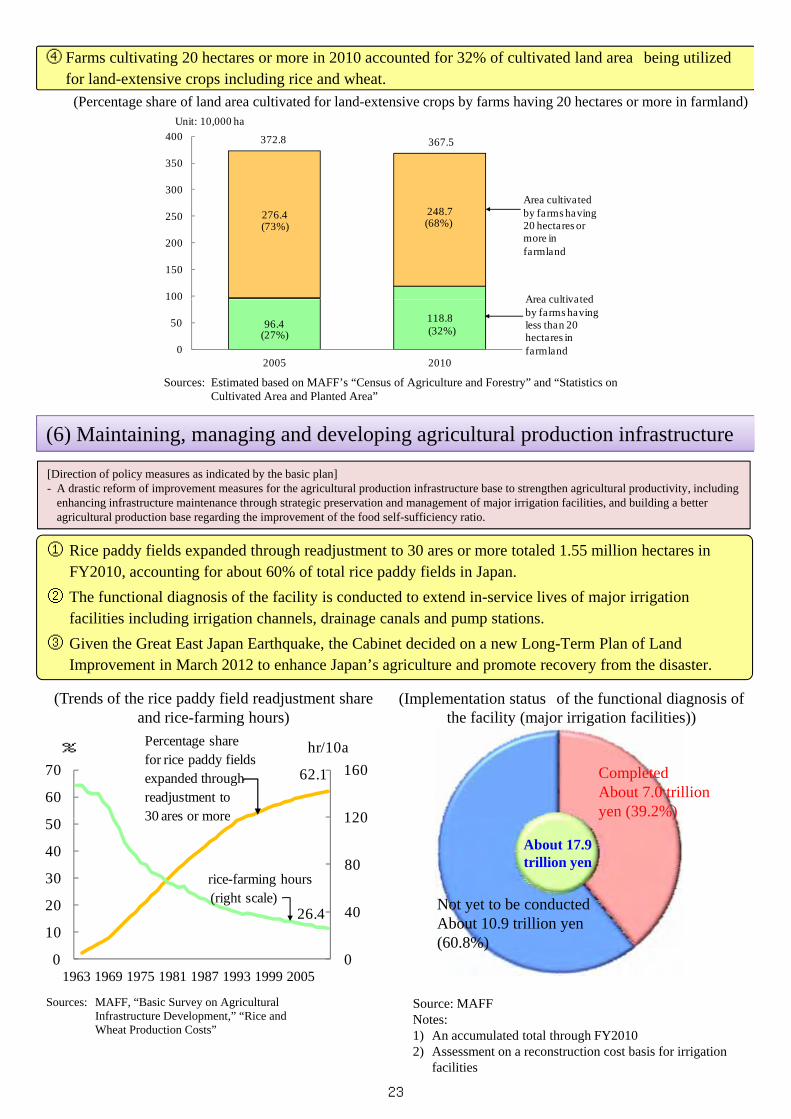
372.8 367.5
④ Farms cultivating 20 hectares or more in 2010 accounted for 32% of cultivated land area being utilized for land-extensive crops including rice and wheat.
(Percentage share of land area cultivated for land-extensive crops by farms having 20 hectares or more in farmland)
276.4 248.7
100
150
200
250
300
(73%) (68%)
Area cultivated by farms having 20 hectares or more in farmland
Area cultivated
96.4 118.8
0
50
100
2005 2010
(27%) (32%)
Area cultivated by farms having less than 20 hectares in farmland
(6) M i t i i i d d l i i lt l d ti i f t t
Sources: Estimated based on MAFF’s “Census of Agriculture and Forestry” and “Statistics on Cultivated Area and Planted Area”
(6) Maintaining, managing and developing agricultural production infrastructure
① Rice paddy fields expanded through readjustment to 30 ares or more totaled 1.55 million hectares in
[Direction of policy measures as indicated by the basic plan]- A drastic reform of improvement measures for the agricultural production infrastructure base to strengthen agricultural productivity, including
enhancing infrastructure maintenance through strategic preservation and management of major irrigation facilities, and building a better agricultural production base regarding the improvement of the food self-sufficiency ratio.
y g jFY2010, accounting for about 60% of total rice paddy fields in Japan.
② The functional diagnosis of the facility is conducted to extend in-service lives of major irrigation facilities including irrigation channels, drainage canals and pump stations.
③ Given the Great East Japan Earthquake, the Cabinet decided on a new Long-Term Plan of Land Improvement in March 2012 to enhance Japan’s agriculture and promote recovery from the disaster.
120
160
60
70
% Percentage share for rice paddy fields expanded through readjustment to 30 ares or more
hr/10a
62.1
(Trends of the rice paddy field readjustment share and rice-farming hours)
(Implementation status of the functional diagnosis of the facility (major irrigation facilities))
CompletedAbout 7.0 trillion yen (39.2%)
40
80
120
10
20
30
40
50
rice-farming hours(right scale)
30 ares or more
26.4
About 17.9 trillion yen
y ( )
Not yet to be conductedAbout 10.9 trillion yen (60.8%)
0 01963 1969 1975 1981 1987 1993 1999 2005
Source: MAFFNotes:1) An accumulated total through FY20102) Assessment on a reconstruction cost basis for irrigation
facilities
Sources: MAFF, “Basic Survey on Agricultural Infrastructure Development,” “Rice and Wheat Production Costs”
( %)
23

(7) Sustainable agricultural production
[Direction of policy measures as indicated by the basic plan]- Promoting agriculture and food industries’ introduction of energy-saving facilities and machinery, the optimization of
fertilization and other measures to address global warming, and networks of farmers who tackle farming operations contributing to conservation of the environment.
- Promoting the expansion of production and distribution of organic agricultural products
① Energy-saving farm machinery and facilities have increased steadily. In FY2010, greenhouse gases emission cuts for facility horticulture and farm machinery totaled 319,000 tons-CO2.
(Trends of certified eco farmers (by region))(Greenhouse gases emission cuts for facility
② The number of eco-farmers certified as promoting sustainable agriculture giving consideration to the environment increased to 212,000 at the end of March 2011 against the backdrop of growth in consumer needs.
1,500
2,000
2,500
Unit: 100 cases
Hokkaido
Tohoku1,863
1,964
2,116
18 9
27.1
31.9
25
30
3510,000t-CO₂
(Trends of certified eco-farmers (by region))horticulture and farm machinery)
0
500
1,000
Kanto
Hokuriku
TokaiKinki
Chugoku/Shikoku
Kyushu
Okinawa0.1
262
989
4.1
8.7
18.9
0
5
10
15
20
2000 2003 2006 2009 2010 20112006 2008 2010
Source: MAFFNote: Numbers given for the end of March in each yearSource: MAFF
③ Agricultural products rated as organic under the organic JAS system in FY2010 totaled 56,000 tons including vegetables.
④ Di f i ll f i dl i l d i FY2011 f ’
(Unit: ton)
Total
Vegetables Rice Fruits Others
FY2001 33 734 19 675 7 777 1 391 4 891
(Trends of agricultural products rated as organic under the organic JAS system)
④ Direct payment for environmentally friendly agriculture started in FY2011 to support farmers’ activities which address global warming and enhance biodiversity.
FY2001 33,734 19,675 7,777 1,391 4,891
FY2002 43,759 24,545 12,338 1,939 4,937
FY2003 46,192 28,444 10,433 2,163 5,152
FY2004 47,428 29,674 10,400 2,029 5,325
FY2005 48,172 29,107 11,369 2,222 5,474
FY2006 48,596 29,949 10,811 1,766 6,070
FY2007 53 446 32 780 10 828 2 199 7 639FY2007 53,446 32,780 10,828 2,199 7,639
FY2008 56,164 36,164 11,278 2,050 6,672
FY2009 57,342 37,644 11,565 2,436 5,697
FY2010 56,415 36,854 10,976 2,506 6,079
Source: MAFF
24

(1) Creating new industries in rural areas through renewable energy promotion and other efforts
[Direction of policy measures as indicated by the basic plan]- Expanding renewable energy production, promoting regional renewable energy utilization, developing
new profit-making systems in rural areas
Chapter 4: Promoting and revitalization of rural areas
① Renewable energy accounts for some 10% of Japan’s total electricity generation (in FY2010). The vast majority of this renewable energy is large-scale hydroelectric power generation. Other renewable energy sources including solar energy, wind power and biomass energy account for only about 1% of the total.
- A strategy for “Revolution in Environmental Technology Preserving Water and Greenery” will be worked out to implement measures for creating new industries.
(Breakdown of Japan’s electricity generation)Electric source Share (%)
Source: Ministry of Economy, Trade and Industry, “FY2010 Annual Report on Energy”
New energy sources 1.2
Pumped-up water 0.9
Ordinary hydro energy 7.8
Crude oil 8.3
Coal 23.8
LNG 27.2
Nuclear energy 30.8
(Efforts to utilize renewable energy)
メタン発酵施設 堆肥化施設
Note: “New energy sources” include solar energy, wind power, geothermal energy and biomass energy.
② Demonstration tests for cutting costs for small hydroelectric power generation, installation of solar panels on agricultural facilities and efforts to convert biomass energy into electricity will be promoted at various points in Japan toutilize renewable energy.
A methane fermentation facility
A compost facility
Demonstration tests of a small hydroelectric power generator (Takeda City, Oita Prefecture)
Biomass conversion facilities (Yamaga City, Kumamoto Prefecture)
Solar panels installed on a compost facility (Sanmu City, Chiba Prefecture)
③ Technology verification and other studies are conducted at various points in Japan to build independent distributed
Tokuai Wind Power Station (Itoigawa City, Niigata Prefecture)
(Smart Village image)
energy systems including Smart Village systems to integrally control renewable energy on a regional basis.
④ Various measures to create new industries in rural areas are promoted under the “Comprehensive Strategy for
Revolution in Environmental Technology Preserving Water and Greenery”, adopted in February 2011.
Electricity l
An upland community
Solar power generation
Agricultural facilities
using renewable energy, storage batteries, HEMS (Home Energy
Management System) cogeneration systems, etc.
heat and electricity supply to greenhouses
An energy management system to adjust the supply-demand balance in
response to renewable energy fluctuations
A biomass power plant (supplying heat
and electricity)
Livestock waste, etc.
Wooden biomass
Thinned wood
supplyHeat supply
Transport
A saw mill
A large plywood factory
Heat and electricity supply to the lumber
industry
Source: MAFF
Small hydroelectric power generation
Seafood processing and distribution
facilities (cooling)
y) factory
Wind power generation
25

(2) Preservation of community functions and conservation of local resources and environment
[Direction of policy measures as indicated by the basic plan]- The “direct payment to farmers in the hilly and mountainous areas”, The “payment for conserving farm land and
water”, maintaining and revitalizing rural communities, promoting measures to prevent damage from wild animals, etc.
① The “direct payment to farmers in the hilly and mountainous areas” has been revised to implement
27,869 28,515 28,708 28,757 28,765
26,937 27,580
8030000
① The direct payment to farmers in the hilly and mountainous areas has been revised to implement third-phase measures from FY2010. In FY2011, about 28,000 agreements under the program are expected to be signed for about 678,000 hectares of farmland.
(Changes in agreements and the total area covered by direct payment for the direct payment to farmers in the hilly and mountainous areas)
Unit: 10,000 haAgreements
Number of agreements
65.4 66.3 66.5 66.4 66.4 66.267.8
40
60
0
10000
20000
H17年度 18 19 20 21 22 23(見込み)
協定数 交付面積(右目盛)
Source: MAFFNote: The figure for FY2011 is an estimate given
as of January 31, 2012
2nd-phase measures 3rd-phase measures
g
Total area covered by direct payment
FY2005 FY2006 FY2007 FY2008 FY2009 FY2010 FY2011 (estimate)
Number of agreements Total area covered by direct payment (right axis)協定数 交付面積(右目盛)
Q: Has the payment system been useful for maintaining functions of
Q: Has the payment system been useful for conserving and improving regional
Q: Has the payment system been useful for invigorating and enhancing regional
(Effects of “payment for conserving farm land and water”)
Number of agreements Total area covered by direct payment (right axis)
② The “payment for conserving farm land and water” has been useful for maintaining agricultural irrigation canals,
for conserving and improving rural environments and for invigorating and enhancing regional links. In FY2011,
Its support was expanded to extend service lives of canals and other relevant facilities.
52%41%
5%No response1%
Useful to some extent
No opinion
Not so useful1%
Not useful at all1%
44%
10%
1%Not so useful
Very usefulNo opinion
No response1%
Not useful at all0%
25%
1%
Very usefulUseful to some extent
No opinionNot so useful
1%
useful for maintaining functions of agricultural irrigation canals, etc.?
conserving and improving regional environments?
invigorating and enhancing regional (community) links?
52%41%
Very useful
some extent44%
Useful to some extent
73%
③ The number of members of “Regional Cooperation Teams” and “Community Supporters” are increasing throughout Japan. Members of “Regional Cooperation Teams” are city residents who supply support service in
Source: MAFF, “Survey on Active Organizations” (conducted in March 2011)
200
250 Other birds
199
Other beasts
Unit: 100 million
Crows
Birds196185
213
239
rural areas. “Community Supporters” are agricultural experts, supporting residents in rural areas.
④ Crop damage by wild animals totaled 23.9 billion yen in FY2010. Comprehensive measures must be promoted to reduce crop damage by wild animals that greatly affect farming and rural livelihood.
(Changes in crop damage by wild animals)
0
50
100
150
2006 2007 2008 2009 2010
Other beasts
Monkeys
Deer
Wild boars
Beasts
Source: MAFF
26

(3) Exchanges between urban and rural areas and enhancing links between farmers and consumers
[Direction of policy measures as indicated by the basic plan]- Promoting Exchanges between urban and rural areas by creating new exchange demand in rural areas, by securing
and training human resources in urban and rural areas and by utilizing rural areas for education, medical services and nursing care.
- Promoting urban residents’ understanding of functions and effects of urban agriculture, protecting urban agriculture, stepping up efforts for sustainable urban agriculture promotion to allow urban farming to fully produce its functions pp g p g p g y pand effects.
① For green tourism (where tourists stay in rural areas for leisure activities), various imaginative efforts have been implemented in line with local conditions.
② According to the FY2010 Census of Agriculture and Forestry, in FY2010 there were 636,000 farm households in urban areas accounting for 25% of Japan’s total farm households and 658,000 hectares or 14% of the nation’s total cultivated land.or 14% of the nation s total cultivated land.
③ According to a survey on urban farm households, the cultivated land under management per urban farm household is 60% of the average for all Japanese farm households.
④ Urban farm households produce mainly open field vegetables and paddy/upland rice. Those with annual sales at 7 million yen or more produce mainly open field and protected vegetables.
⑤ A urban agriculture promotion panel has been created to consider how best to conserve urban farmland and promote urban agriculture.
69 60
33
83
38 31
49
2340
60
80
100 % Farm households with annual sales at 7 million yen or more
Total urban farm households
Agricultural land reservedin urbanization promotion
area
36.3a 16.1a 38.2a 74.5 133.1(56%) (100%)
(Unit: households, ares)
(Reference)Average for all
farm householdsCategory
Total
Farmland inurbanizationcontrol area
Total
Farmland in urbanization promotion area
p g
(Managed cultivate land area per urban farm household) (Survey results)
(Produced agricultural crops (multiple answers))
33
18 12 8
31 20
23
0
20
40
Open field vegetables
Paddy/upland rice
Miscellaneous cereals,
potatoes, Pulses
Fruits Vegetable grown in facilities
Flowers and ornamental
tree
(56%) (100%)
Sources: MAFF, “Fact-finding Survey on Urban Farming” (released in October 2011), “Census of Agriculture and Forestry (2010)”
Source: MAFF, “Fact-finding Survey on Urban Farming” (released in October 2011)
⑥ Building on health promotion and other functions of agriculture, programs have been promoted to link agriculture to healthcare and welfare.
[Specific program]:Shimada Kensetsu Corporation, Narita City, Chiba Prefecture
○An outpatient nursing care facility encourages users to grow vegetables and flowers at a farming garden.
○ The company cooperates with a university in a scientific study on the effects of the activity○ The company cooperates with a university in a scientific study on the effects of the activity.
○ Elevated flowerbeds have been developed to allow elderly people to work without bending over. These flowerbeds have also been introduced to other facilities.
[Specific program]:Agricultural production corporation Nagahori, Ageo City, Saitama Prefecture○ The corporation expands its crop acreage by recycling and leasing abandoned cultivated lands and employs many
local elderly people for harvesting and classifying komatsuna, a vegetable similar to spinach. ○ The corporation allows new employees to freely choose time periods for their work, creating an environment
where it is easy for elderly people to work.○ Elderly people made positive comments: “I have become more vigorous and healthy,” “I am now more healthy
than before my retirement,” and “I feel pleased to communicate with friends.” The program not only creates jobs but also produces significant effects for elderly people, including introducing new meaning for life and health promotion.
27
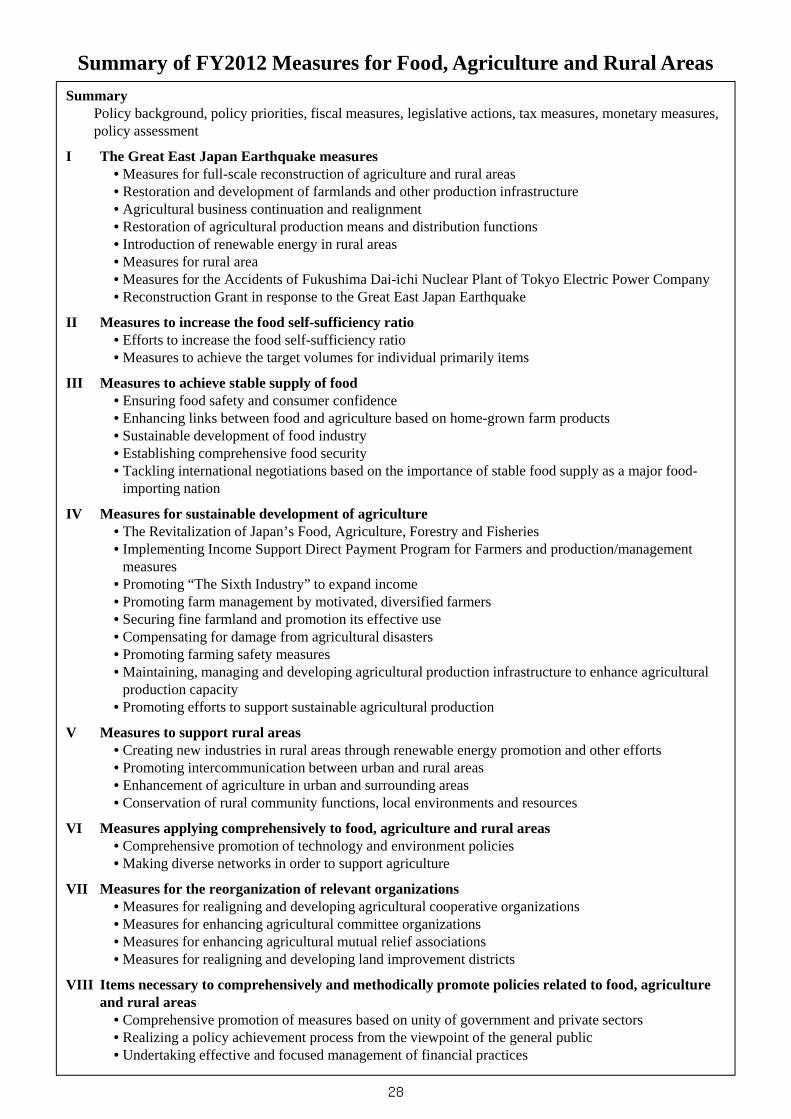
SummaryPolicy background, policy priorities, fiscal measures, legislative actions, tax measures, monetary measures, policy assessment
I The Great East Japan Earthquake measuresM f f ll l i f i l d l
Summary of FY2012 Measures for Food, Agriculture and Rural Areas
• Measures for full-scale reconstruction of agriculture and rural areas • Restoration and development of farmlands and other production infrastructure• Agricultural business continuation and realignment • Restoration of agricultural production means and distribution functions • Introduction of renewable energy in rural areas • Measures for rural area• Measures for the Accidents of Fukushima Dai-ichi Nuclear Plant of Tokyo Electric Power Company• Reconstruction Grant in response to the Great East Japan EarthquakeReconstruction Grant in response to the Great East Japan Earthquake
II Measures to increase the food self-sufficiency ratio• Efforts to increase the food self-sufficiency ratio• Measures to achieve the target volumes for individual primarily items
III Measures to achieve stable supply of food• Ensuring food safety and consumer confidence• Enhancing links between food and agriculture based on home-grown farm products• Sustainable development of food industry• Establishing comprehensive food security• Tackling international negotiations based on the importance of stable food supply as a major food-
importing nation
IV Measures for sustainable development of agriculture• The Revitalization of Japan’s Food, Agriculture, Forestry and Fisheries• Implementing Income Support Direct Payment Program for Farmers and production/management
measures• Promoting “The Sixth Industry” to expand income• Promoting farm management by motivated, diversified farmers• Securing fine farmland and promotion its effective use• Compensating for damage from agricultural disasters• Promoting farming safety measures• Maintaining, managing and developing agricultural production infrastructure to enhance agricultural
production capacityproduction capacity• Promoting efforts to support sustainable agricultural production
V Measures to support rural areas• Creating new industries in rural areas through renewable energy promotion and other efforts• Promoting intercommunication between urban and rural areas• Enhancement of agriculture in urban and surrounding areas• Conservation of rural community functions, local environments and resources
VI Measures applying comprehensively to food, agriculture and rural areas• Comprehensive promotion of technology and environment policies• Making diverse networks in order to support agriculture
VII Measures for the reorganization of relevant organizations• Measures for realigning and developing agricultural cooperative organizations• Measures for enhancing agricultural committee organizations• Measures for enhancing agricultural mutual relief associationsg g• Measures for realigning and developing land improvement districts
VIII Items necessary to comprehensively and methodically promote policies related to food, agriculture and rural areas
• Comprehensive promotion of measures based on unity of government and private sectors• Realizing a policy achievement process from the viewpoint of the general public• Undertaking effective and focused management of financial practices
28

[Definitions]
1. Basic statistical terminology (1) Classification of farm households (definitions used since the 1990 World Census of Agriculture and Forestry)
Terminology Definition
Farm household Household engaged in farming and managing cultivated land of 10 ares or more, or earning more than 150,000 yen per year from sales of agricultural products.
Commercial farm household
Farm household managing cultivated land of 30 ares or more, or earning more than 500,000 yen per year from sales of agricultural products.
Business farm household
Farm household whose main source of income (50% or more) is farming, and which possess at least one family member under the age of 65 who is engaged in self-employed farming for more than 60 days a year.
Semi-business farm household
Farm household whose main income (50% or more) is from sources other than agriculture and which possess at least one family member under the age of 65 who is engaged in self-employed farming for more than 60 days a year.
Side-business farm household
Farm household without any members under the age of 65 engaged in self-employed farming for more than 60 days a year (farm households other than business and semi-business farm households).
Non-commercial farm household
A farm household managing cultivated land of less than 30 ares, and earning less than 500,000 yen per year from sales of agricultural products
Agricultural holding other than farm household
A holding other than farm household managing cultivated land of 10 ares or more, or earning 150,000 yen or more per year from sales of agricultural products.
Agricultural service enterprise An enterprise conducting farm work on contract (including enterprise other than agricultural holding, specializing in production and sale of seedlings).
Non-farm household possessing cultivated land
A household other than a farm household possessing 5 ares or more in cultivated land and abandoned cultivated land.
(2) Classification of farms (definitions used since the 2005 Census of Agriculture and Forestry)
Terminology Definition
Farm An establishment that either performs agricultural production directly or on contract and fulfills one of the following conditions: (1) manages 30 ares or more cultivated land, (2) possesses a planted area or cultivated area or a number of livestock being raised or delivered that is equal to or greater than a predetermined standard (e.g. 15 ares for outdoor grown vegetables, 350 square meters for vegetables grown in facilities, one cow), (3) accepts farm work on contract. (Censuses from 1990 to 2000 regard farms as the combination of commercial farm households, agricultural holdings other than a farm household, and agricultural service enterprises.)
Family farm An independent farm (farm household) or a single-household corporation (a farm household that is incorporated).
Independent farm An agricultural establishment that operates as a household. This category excludes single-household corporations.
Incorporated farm An agricultural establishment that has been incorporated This category includes single-household corporations.
29

(3) Farm household economics Terminology Definition
Total income Agricultural income + Income from agriculture-related production + Nonagricultural income + Income from pensions, etc.
Agriculture income Gross agricultural income (total income from farming) – Agricultural expenditures (all expenses necessary for farming)
Income from agriculture-related production
Earnings from agriculture-related production (earnings from businesses such as agricultural processing, country inns, restaurants and tourist farms, which are related to agriculture and managed by individuals engaged in farming) - Expenditures from agriculture-related production (expenditures such as labor and material costs required for the aforementioned businesses)
Non-agriculture income Non-agriculture earnings (e.g. earnings from independent part-time nonagricultural businesses, salaries and wages) - Non-agriculture expenses (e.g. expenses for independent part-time non-agricultural businesses, transportation expenses for commuting)
Production cost The production cost is the total cost (combining property and labor costs) for production of farm products minus by-product values
material cost The material cost combines liquid goods costs (seeding, fertilizers, agricultural chemicals, heating, lighting, power and other materials costs) and depreciation costs for fixed goods (depreciable assets including buildings, automobiles, agricultural machines and production management equipment).
Land rent The land rent for a crop subject to the survey is calculated by multiplying the actually paid farm rent by the contribution rate for the relevant crop.
Interest payment Interest payments are classified by use of underlying loans and multiplied by a contribution rate for a crop subject to the survey to calculate the borrowed capital interest to be shouldered by the crop.
Family labor cost The family labor cost is calculated by multiplying family working hours by an average hourly wage for men and women (paid actually irrespective of sex in a relevant region) as computed based on wage data for business establishments with five to 29 workers in construction, manufacturing and transportation/postal industries (construction, manufacturing and transportation industries for 2009 under the former industry classification) in the Monthly Labor Survey Report (by the Ministry of Health, Labor and Welfare).
Employed labor cost The employed labor cost represents wages paid to workers employed on an annual, seasonal or daily basis for producing farm products. Boarding and material compensations are assessed based on market prices. The cost includes rewards paid separately from wages.
Equity capital interest The equity capital interest is calculated by multiplying equity capital – gross capital minus debt capital – by an annual interest rate of 4%.
Rent for owned land The rent for owned land is based on a rent for similar farmlands (having capabilities similar to the farmland for a crop subject to the survey) within the same region.
30

Relationship between agricultural expenditures and production cost
Note: Actually, by-product values are deducted from “production cost,” “production cost counted in payment interest /land rent” and “production cost counted in capital interest/land rent.”
(4) Agricultural labor by farm household members
Labor status Household member As a rule, people who live and earn a living together
1) Core persons engaged mainly in farming
Among household members involved in self-employed farming (population engaged mainly in farming), those who are working mainly in agriculture during regular hours.
2) Population engaged in farming Persons engaged only in self-employed farming, or persons who are also engaged in work other than farming but spend more time engaged in farming on a yearly basis.
3) Persons engaged mainly in farming Household members 15 years old and over who are engaged in self-employed farming for more than one day per year.
- Full-time farmers
Among persons engaged mainly in farming, those who are engaged in self-employed farming for more than 150 days per year.
Engaged only in self-employed
farming
Engaged in both self-employed farming and other work Engaged in
other work only
Not engaged in any work
Mainly self-employed
farming Mainly
other work
Stat
us d
urin
g re
gula
r hou
rs En
gage
d m
ainl
y in
wor
k
Enga
ged
mai
nly
in
hous
ewor
k an
d ch
ild re
arin
g O
ther
(1)
(2)
Core person engaged mainly in farming
Population engaged mainly in
farming
Pers
on e
ngag
ed
mai
nly
in fa
rmin
g
(3)
The Statistics on Management by Type of Farming
Family labor cost
Employed labor cost
The Statistics on Production Cost
Farming management
cost
Rent for owned land Equity capital interest Labor cost
Payment interest Land rent
Material cost
Self-supporting
Production cost counted in paym
ent interest/land rent
Shipment cost, Packaging/packing cost and Administration and management cost, etc.
Farming management cost
Production cost
Production cost counted in capital interest/land rent
31

(5) New farmers (definition used in the survey on new farmers) Type of involvement in farming New farmers
Defined as individuals who fulfill one of the following conditions:
1) Self-employed farmers
Members of farm households whose living status has changed anytime within a year of the survey date from “student” or “employed in other work” to “new graduate who has become a farmer” or “a new farmer who changed occupations”.
2) Employed farmers Persons engaged in farming who have been hired by corporations anytime within a year of the survey date and work for their employers for 7 months a year or more.
3) New participants Persons who have started farming anytime within a year of the survey date by securing land and funds on their own.
- New graduates who have become farmers Self-employed farmers who have changed their status from “student” to “engaged mainly in farming”, as well as employed farmers who were recently students.
- New farmers who have changed occupations New farmers whose status has changed from “mainly employed in another industry” to “engaged mainly in self-employed farming” anytime within a year of the survey (including at-home workers and U-turn workers).
Self-employed farming
Employed fulltime by corporations, etc.
Just entering farming
Stat
us b
efor
e fa
rmin
g St
uden
t
Empl
oyed
in o
ther
wor
k
(6) Agricultural regions nationwide
Agricultural region Prefecture Agricultural region Prefecture Hokkaido Hokkaido Kinki Shiga, Kyoto, Osaka, Hyogo, Nara,
Wakayama Tohoku Aomori, Iwate, Miyagi, Akita,
Yamagata, Fukushima Chugoku
Sanin Sanyo
(Sanin, Sanyo) Tottori, Shimane Okayama, Hiroshima, Yamaguchi
Hokuriku Niigata, Toyama, Ishikawa, Fukui Shikoku Tokushima, Kagawa, Ehime, Kochi Kanto/Tosan
Northern Kanto Southern Kanto Tosan
(Northern Kanto, Southern Kanto, Tosan) Ibaraki, Tochigi, Gunma Saitama, Chiba, Tokyo, Kanagawa Yamanashi, Nagano
Kyushu Northern Kyushu Southern Kyushu
(Northern Kyushu, Southern Kyushu) Fukuoka, Saga, Nagasaki, Kumamoto, Oita Miyazaki, Kagoshima
Tokai Gifu, Shizuoka, Aichi, Mie Okinawa Okinawa
(2) (3) (1)
New graduates who have
become farmers
New farmers who changed
occupation
Self-employed farmers Employed farmers New participants
32

(7) Food self-sufficiency ratio Terminology Definition
Food self-sufficiency ratio This index indicates how much food for consumption is being supplied by domestic sources. - Self-sufficiency ratio for individual items:
The following equation is used to calculate the self-sufficiency ratio on a weight basis for individual items.
- Total food self-sufficiency ratio:
This ratio is an index for the total volume of food, and is expressed in both a calorie basis and a production value basis. Products made from domestic livestock raised with imported feed are not included in calculations.
- Total food self-sufficiency ratio on a calorie supply basis: Weight values for each item are converted to calories using the Standard Tables of Food Composition (2010), after which the calories of all items are totaled. This sum is equivalent to the amount obtained by dividing the value for domestic calorie supply per person per day by the value for total calorie supply per person per day.
- Total food-self sufficiency ratio on a production value basis: Weight values are converted to cost using farm gate prices from agricultural price statistics, after which all costs are totaled. This sum is equivalent to the amount obtained by dividing the domestic production value of food by the total food supply value for domestic consumption.
- Feed self-sufficiency ratio: This index indicates how much feed is being supplied by domestic sources, calculated in terms of total digestible nutrients (TDN) using the Standard Tables of Food Composition.
Self-sufficiency ratio
Domestic production volume Supply for domestic
consumption = =
Domestic production volume Domestic production volume + Import volume - Export volume ± fluctuations in inventory
Food self-sufficiency ratio calculation equation
33

2. Basic Terminology Abandoned cultivated land Abandoned cultivated land represents a section in the statistical survey conducted by the Ministry of
Agriculture, Forestry and Fisheries. In the Census of Agriculture and Forestry, it is defined as land that was cultivated in the past but has not been farmed for more than a year and will not be farmed for the next several years. Land that has not been farmed for more than a year but may be farmed in the next several years is called unplanted land and also includes cultivated land under management.
Agricultural production legal person
This is a legal person that can acquire rights to farmlands under the Agricultural Land Act and satisfy all the following requirements: (1) Requirements for incorporation (a stock corporation (not a publicly traded company), agricultural producer's cooperative corporation, a partnership, a joint-stock company or a limited liability company) (2) Requirements for business operations (main business is farming), (3) Requirements for members of the corporation (farming people account for at least three quarters of voting rights in principle), (4) Requirements for executives (the majority of executives are engaged in farming full time.
ASEAN ASEAN stands for the Association of Southeast Asian Nations. ASEAN was established in the Thai capital of Bangkok in 1963 for cooperation in addressing the promotion of economic growth, and social and cultural development, the achievement of political and economic stability and other challenges in Southeast Asia. Upon its establishment, it consisted of five countries -- Indonesia, Malaysia, the Philippines, Singapore and Thailand. Brunei acceded to ASEAN in 1997, Vietnam in 1995, Laos and Myanmar in 1997 and Cambodia in 1999. ASEAN now thus comprises 10 countries. Prompted by the 1997 Asian currency crisis, Japan, China, South Korea and ASEAN have formed the ASEAN+3 framework for cooperation in East Asia.
Biomass Biomass means organic resources of flora and fauna origin, excluding fossil resources. Biomass is made by organisms that create organic matter from inorganic water and CO2 through photosynthesis using solar energy falling on the earth. This type of resources is renewable throughout its life cycle as long as there are organisms and solar energy.
Calorie supply/Calorie intake
Calorie supply refers to the total amount of calories from food that is supplied to the public, and calorie intake refers to the total amount of calories actually consumed by the public. As a rule, the value for calorie supply is taken from the Food Balance Sheet issued by the Ministry of Agriculture, Forestry and Fisheries, while the value for calorie intake is taken from the National Health and Nutrition Examination Survey issued by the Ministry of Health, Labor and Welfare. Although it is necessary to keep in mind that calculations for both values are entirely different, since the calorie supply value includes leftovers and food destroyed in the distribution stage, the difference between this value and calorie intake can be used as a measure of the amount of food that has been destroyed or unconsumed.
Community based farm cooperatives
These farm cooperatives consist of farming households in certain regions that have developed a relationship through the local community or other geographical bases. In these cooperatives, farming households conduct agricultural production as a collaborative enterprise. Adopting the three basic tenets of (1) aggregation of diverted paddy fields, (2) communal use of communally purchased equipment and (3) communalization of the entire farming process from production to marketing with farming leaders playing a central role. These cooperatives take different forms and approaches depending on their geographical location.
Direct seeding Direct seeding, where rice seeds are directly scattered into paddies, can skip seedling-raising and transplanting steps required for the conventional practices including transplanting. There are various direct seeding methods, which are roughly divided into two groups – flooded direct seeding where seeds are scattered into flooded paddies after plowing and soil pudding, and dry direct seeding where seeds are scattered into non-flooded paddies.
Eco-farmer Based on Article 4-1 of the Act for Promoting the Introduction of Sustainable Agricultural Production Practices, prefectural governors certify eligible farmers as so-called eco-farmers. As persons expected to become popular among producers and consumers, a name of eco-farmers was selected in August 2000 from those who filed applications with a national conference for promoting environmentally friendly agriculture.
34

Foot-and-mouth disease Foot-and-mouth disease infected cloven-hoofed animals such as cattle and pigs show clinical signs, including vesicles/blisters on the mouth and feet, and the disease leads to reducing the productivity of industrial animals. The fatality rate for adult stock is several percent. Given the disease’s strong infectious and epidemic capacity and the absence of effective treatments, the World Organization for Animal Health, known as OIE (Office International des Epizooties), views it as one of the most alarming infectious diseases. Meat of stock infected with the disease is not shipped to the market. Even if humans eat meat or milk of stock infected with the disease, human health will not be affected.
GAP GAP stands for Good Agricultural Practices. GAP are sustainable improvement activities through the accurate implementation, recording, inspection and assessment of each process in agricultural production operations in line with check lists worked out according to relevant laws.
Greenhouse gas (GHG) Greenhouse gases heat the earth’s surface by absorbing and radiating a portion of infrared radiation reflected from the ground. The Kyoto Protocol designates carbon dioxide (CO2), methane (CH4, generated by rice paddies and final waste disposal sites), dinitrogen monoxide (N2O, generated during the process of manufacturing some raw ingredients for chemical products and from livestock waste), hydrofluorocarbons (HFCs, used as coolants for air conditioning devices), perfluorocarbons (PFCs, used in the production of semiconductors) and sulfur hexafluoride (SF6, used in the production of semiconductors) as greenhouse gases that should be reduced.
HACCP HACCP (Hazard Analysis and Critical Control Point) is a management system in which food safety is addressed through the analysis and control of biological, chemical, and physical hazards from raw material production, procurement and handling, to manufacturing, distribution and consumption of the finished product.
Highly pathogenic avian influenza
The avian influenza strain that causes serious clinical problems in poultry, including high mortality, is called highly pathogenic avian influenza (HPAI). An HPAI virus develops serious systemic problems, such as the neural, respiratory and/or digestive problems, and kills many poultry. Almost all cases of human infection with HPAI have been linked to close contact with birds infected with HPAI. There is no report of human cases following the consumption of adequately cooked poultry meat or eggs.
Local consumption of local products
The program for local consumption of local products is designed to expand the consumption of home-grown agricultural, forestry and fisheries products by promoting the utilization of local agricultural, forestry and fisheries products. The Act Concerning Agriculture, Forestry and Fisheries Operators’ Creation Of New Businesses Utilizing Local Resources and the Promotion of Utilization of Local Agricultural, Forestry and Fisheries Products (act for collaboration of primary, secondary and tertiary industries) was enacted in November 2010 to promote the program.
Promoting the “Sixth Industry”
Promoting the “Sixth Industry” means that agriculture, forestry and fisheries as the primary industry, manufacturers as the secondary industry, and retailers as the tertiary industry are promoted comprehensively and integrally to create new added values using regional resources. In order to proceed with the promotion, the Act on Promotion of the “Sixth Industry” to create new added value using agricultural products in rural areas was enacted in November 2010.
Rice whole crop silage (rice WCS)
Before rice berries ripen, rice berries, stems and leaves are harvested integrally and fermented with lactic bacteria into feed called rice whole crop silage. The area has been expanding for producing rice WCS as a feed crop contributing to the effective utilization of rice paddies and the improvement of Japan’s feed self-sufficiency ratio.
Traceability ‘Food traceability’ means the ability to trace and follow the movement of an agricultural product, processed product, or other food, from where the food came and to where the food went. The establishment and maintenance of records regarding movements of foods through all stages of production, processing and distribution enables identification of the movements from production to distribution and facilitates rapid withdrawal in the case of a food incident.
35


