FY2010 Full Year Results Presentation -...
21
Magnus Bocker, CEO Seck Wai Kwong, CFO 2 August 2010 Singapore Exchange Financial Year 2010 Full Year Results
Transcript of FY2010 Full Year Results Presentation -...

Magnus Bocker, CEO
Seck Wai Kwong, CFO
2 August 2010
Singapore ExchangeFinancial Year 2010 Full Year Results

2
1. Highlights
2. Financial Performance
3. Business Update
4. Conclusion
Agenda

3
(Note: Net profit after non-recurring items: $49M in FY2001; $16M in FY2003; $422M in FY2007 and $478M in FY2008)
5870 61 66
131
104
188
311
444
306318
FY00 FY01 FY02 FY03 FY04 FY05 FY06 FY07 FY08 FY09 FY10
FY 2010: Second Best Results
• Global market uncertainties, strong Singapore economic data
• Expanding customer base & product suite
• Reach initiative: Fastest trading engine, state-of-the-art data centre & point of presence in global liquidity hubs
• New organisation: Focus on key growth drivers

4
Financial Performance
Seck Wai Kwong

5
Financial PerformanceIncome Statement: Profit up 4% to $318M
• Strong results despite challenging environment
• Business focus: Reclassification of revenues and expenses
306 318
+45 +34 +1
FY09 Net Profit Revenues Expenses Others & Tax FY10 Net Profit
Earnings per share 28.7 cents 29.9 cents
Return on equity 39% 39%
Note 1: The above excludes (a) $2.7M in goodwill impairment; and (b) $5.0M in writeback of property impairmentNote 2: Some numbers may be subject to rounding
EBITDA $386M $405M

6
Financial PerformanceRevenues: Up 8% to $640M
• Increased securities trading and revival of primary market
• Derivatives picked up in 4Q FY10
SDAV $1.5B from
$1.2B
DDAV 232k from 238k
640
595
+57-25 -2 +3
+9 +3
FY09 Securities Derivatives Market Data Member
Services andConnectivity
Depository
Services
Issuer
Services
FY10
(46%) (21%) (5%) (5%) (13%) (10%)(% Revenue) (100%)
7
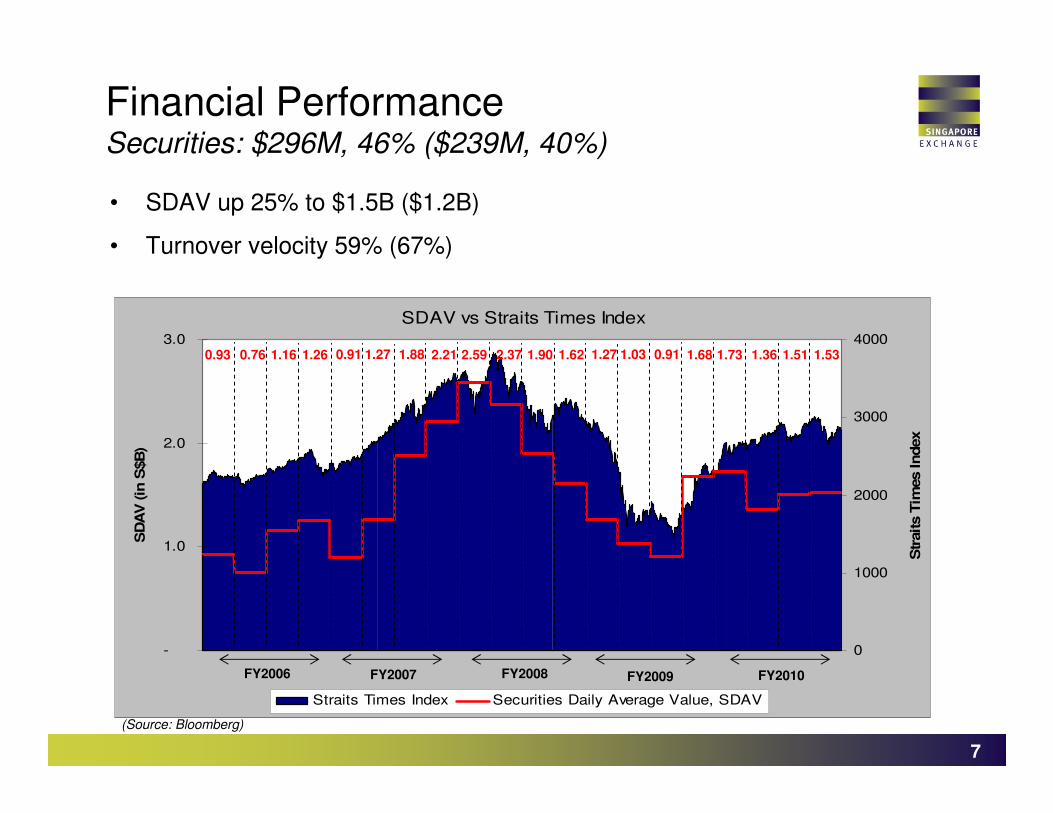
Financial PerformanceSecurities: $296M, 46% ($239M, 40%)
• SDAV up 25% to $1.5B ($1.2B)
• Turnover velocity 59% (67%)
SDAV vs Straits Times Index
-
1.0
2.0
3.0
SD
AV
(in
S$B
)
0
1000
2000
3000
4000
Str
aits T
imes Index
Straits Times Index Securities Daily Average Value, SDAV
1.27 1.03 0.91 1.68 1.73 1.36 1.51 1.530.91 1.27 1.88 2.21 2.59 2.37 1.90 1.620.93 0.76 1.16 1.26
(Source: Bloomberg)
FY2006 FY2007 FY2008 FY2009 FY2010

8
Futures & Options: DDAV vs Volatility
0
50
100
150
200
250
300
DDAV ('0
00 c
ontracts
)
0
20
40
60
80
100
120
140
10D V
ola
tility
(%
)
DDAV Nikkei225 Index TWSE Index Nifty Index Straits Times Index
Financial PerformanceDerivatives: $131M, 21% ($156M, 26%)
• DDAV down 3% at 231,938 contracts (238,446)
• High frequency trading 27% (15%)
273 246 204 227 214 222 234 257140 136 168 165 198 189 251 231103 125 155 156
(Source: Bloomberg)
FY2006 FY2007 FY2008 FY2009 FY2010

9
Financial PerformanceExpenses: Up 15% to $261M
• Reclassification
• New investments
• Securities pre-settlement matching system, derivatives data engine and SGXClear
261
228
+11
+17
+4 +5
FY09 Staff Technology Processing
and royalties
Premises Professional
Fees
Others FY10
CEO transition
Variable bonus
provision
Ongoing technology
spend
Accelerated depreciation
Increased market
activities

10
Financial PerformanceCapital Expenditure
• FY10 : SGXClear, OTC Financials, Reach initiative
• FY11 Guidance : $60-$65M (OTC Financials, Reach etc)
Capital Expenditure ($M)
1814
46
37
55
FY06 FY07 FY08 FY09 FY10

11
Financial PerformanceDividend
• FY10 : 27.0 cents per share
• FY11 : Base dividend 16.0 cents per share (15.0 cents)
DPS27.00
DPS26.00
EPS28.7
EPS29.9
Interim11.25
ProposedFinal15.75
Base16.00(15.00)
FY09 FY10 FY11
Payout: 91% Payout: 91%
EPS: Earnings per Share / DPS: Dividend per Share

12
Financial Indicators
FY10 FY09 FY08 FY07 FY06
EBITDA ($M) 404 386 588 509 251
Net Profit ($M) 318 306 444 311 188
Net Profit Margin (%) 49 51 57 53 45
Total Equity ($M) 816 778 894 830 587
Return on Equity (%) 39 39 50 38 32
Per Share (cents)
Operating cash flow per share 35.1 26.2 47.4 33.4 21.6
Earnings per share 29.9 28.7 41.9 29.5 18.0
Dividend per share 27.0 26.0 38.0 36.0 16.2
No. of shares issued (M) 1,071 1,069 1,067 1,061 1,050
Note 1: The above exclude non-recurring itemsNote 2: The above number of shares issued excludes treasury shares of 5.2M (FY10), 5.5M (FY09), 3.1M (FY08) and 2.8M (FY07)

13
Business Update
Magnus Bocker

14
Turnover Velocity (%)
59
82
32
68
199
70
196
148
113
134125
62
89 81
386
SG
X
AS
X
Bur
sa
HK
X
KR
X
NS
E
SSH
E
TWS
E
TSE
ND
AQ
(US)
NY
X
DB
LSE
ND
AQ
(EU
)N
YX
(EU
)
Securities: Trading and ClearingRevenue: $296M, 46% ($239M, 40%)
Securities Revenue ($M)
37 57 8046 57
139
221
301
187
237
FY06 FY07 FY08 FY09 FY10
Access Clearing Related Processing
180
285
391
239
296
� Market Structure
• An evolutionary process
• Reach initiative
• Membership structure
� Product & Services
• Exchange Traded Funds
• Depository Receipts quotation
• Alternative venue: Chi-EastContracts value
Metrics
Key driversFY10 FY09
4Q FY10
3Q FY10
4Q FY09
Straits Times Index 2835 2333 2835 2887 2333
No. of Trading Days 252 252 63 61 63
Equity Turnover Velocity (%) 59 67 54 57 85
Singapore issuers 57 73 54 52 88
Overseas issuers, excluding Chinese issues
48 44 40 56 62
Chinese issuers 146 125 148 139 191
Daily Average Trading Volume (billion shares)
1.69 1.23 1.48 1.61 2.23
Daily Average Trading Value ($ billion)
1.54 1.23 1.53 1.51 1.68
ETFs/ETNs ($ million) 20 14 30 14 27
Company warrants 2 0 2 2 1
More than $1.5M 37 39 39 37 36
Less than $1.5M 63 61 61 63 64
(Source: Average Jul 09 to Jun 10 monthly velocity, WFE)

15
Derivatives: Trading & ClearingRevenue: $131M, 21% ($156M, 26%)
� Market Structure
• Dodd-Frank Act
• Competition
• High frequency trading
� Product Development
• 4 futures & 2 swaps
• Pipeline
Metrics
Key driversFY10 FY09
4Q FY 10
3Q FY10
4QFY09
Daily Average Volume (‘000 contracts)
232 238 257 234 227
Nikkei 225 futures (days)
133(244)
110(244)
131(61)
106(60)
103(61)
MSCI Taiwan futures (days)
64(250)
66(246)
64(63)
70(56)
71(62)
Nifty futures (days)
36(246)
40(240)
42(63)
39(59)
32(59)
MSCI SG futures (days)
15(252)
17(252)
15(63)
15(61)
17(63)
Interest rate futures 3 4 3 3 3
Extended settlement (shares)
77,424 194,143 47,222 80,705 221,365
Structured warrants ($M)
29 58 22 25 59
Market Share (%)
Nikkei 225 futures 26 22 27 26 25
MSCI Taiwan futures 24 28 22 25 25
Nifty futures 10 9 12 11 7
HFT (%) 27 15 25 26 18
Commodities (Daily average trading volume, contracts)
Rubber futures 1,000 1,373 882 1,009 999
Gold futures 5,256 NA 5,158 8,530 NA
Fuel Oil futures 24 NA 24 24 NA
AsiaClear
Volume (lots) cleared 124,829 66,934 31,864 35,782 20,729
FFAs 72,072 40,084 13,420 20,920 12,943
Energy swaps 24,133 24,907 7,729 7,574 5,843
Iron Ore swaps 28.624 1,943 10,615 7,288 1,943
NA
Derivatives Revenue ($M)
6476
103117
101
11
15
209
5
21
26
33 30
25
FY06 FY07 FY08 FY09 FY10
F&O SW Interest income, license & others
96
117
156 156
131

16
Market Data: Information sales & distribution Revenue: $33M, 5% ($35M, 6%)
� Market Structure
• Evolving trading strategies
• Reach initiative
• Infrastructure
� Products and Services
• High frequency trading
• Non pricefeed products
Market Data Revenue ($M)
333534
2723
FY06 FY07 FY08 FY09 FY10
Key drivers
Metrics
FY10 FY094Q
FY103Q
FY104Q
FY09
Securities Data
No. of vendors 126 117 126 128 117
No. of terminals 38,567 36,509 36,509 43,070 36,509
Derivatives Data
No. of vendors 61 51 61 60 51
No. of terminals 23,957 26,780 23,957 25,469 26,780

17
� Membership
• New members
• Approved In-Principle Members
� Reach Initiative• Co-location & hubs
Member Services and ConnectivityRevenue: $30M, 5% ($27M, 4%)
Member Services and Connectivity Revenue ($M)
1215
19 1922
7
7
9 8
8
FY06 FY07 FY08 FY09 FY10
Terminal and connection Membership
1922
28 2730
Key drivers
Metrics
FY10 FY094Q
FY103Q
FY104Q
FY09
Membership
Securities members
Clearing Members 26 24 26 26 24
Trading Members 26 24 26 26 24
Trading Representatives 4095 3729 4095 4008 3729
Derivatives members
Clearing Members 26 25 26 25 26
Trading Members 30 30 30 30 30
Trading Member (Proprietary) 242 224 242 240 224
Trading Member (Individual) 228 195 228 214 195
SICOM members
Clearing / Non-Clearing Members: Brokers / Dealers
20 17 20 20 17
Trade / Associate Members 67 64 67 66 64
AsiaClear
No. of counterparty 512 336 512 467 336
Connectivity
Securities Market
Connectivity (no.) 88 86 88 84 86
Order Management System (no.) 28 28 28 28 28
Independent software vendor (no.) 11 11 11
Derivatives Market
Connectivity (no.) 578 467 578 559 467
Order Management System (no.) 55 35 55 53 35
Independent software vendor (no.) 11 10 11 11 10
Proximity Hosting 17 15 17 17 15

18
Depository Services: Settlement & DepositoryRevenue: $82M, 13% ($74M, 12%)
� Market Structure
• Linkages
• Infrastructure
� Services & Asset Classes
• Singapore Government Bonds
• Securities borrowing & lending
Key drivers
Metrics
FY10 FY094Q
FY103Q
FY104Q
FY09
Securities settlement
No. of settlement instructions (‘000) 3,967 3,346 1,071 954 962
Securities transfers (‘000) 396 439 87 95 105
Contracts processing
Contracts processed (‘000) 13,255 10,788 2,966 3,050 4,162
Depository management
Depository accounts 1.49M 1.44M 1.49M 1.48M 1.44M
Depository Services Revenue ($M)
1724
4046 5117
26
29 2226
4
4
5 6
6
FY06 FY07 FY08 FY09 FY10
Securities settlement Contracts processing Depository management
38
54
74 7482

19
� Capital Raising
• Equity: IPOs
• Debt: Bonds/Notes
� Issuer-related services
• Corporate governance & IR
Issuer Services: Listing and related servicesRevenue: $64M, 10% ($61M, 10%)
Issuer Services Revenue ($M)
2632
4234 37
22
36
41
2727
FY06 FY07 FY08 FY09 FY10
Listings Corporate actions
48
6861 64
83
Key drivers
Metrics
FY10 FY09 4Q FY103Q
FY104Q
FY09
Listings
No. of listed issues
Equity securities 763 752 763 763 752
Debt securities 1,229 1,099 1,229 1,198 1,099
ETFs/ETNs 73 35 73 58 35
Company warrants 80 75 80 82 75
Structured warrants 233 312 233 301 312
No. of Delistings: Equity securities 29 24 12 6 3
Equity Market Capitalisation, $B (No. of issuers)
702(763)
527(752)
702 (763)
682(763)
527(752)
Singapore issuers428
(459)341
(453)428
(459)435
(461)341
(453)
Overseas issuers, excluding Chinese issuers
240(152)
160(150)
240(152)
214(149)
160(150)
Chinese issuers33
(152)26
(149)33
(152)33
(153)26
(149)
New equity listings 42 19 12 7 1
Primary listings: IPOs & RTOs(Market capitalisation, $M)
40(15,211)
19(3,324)
11(3,758)
6(1,616)
1(27)
Secondary listings(Market capitalisation, $M)
2(28,885)
0(-)
1(27,647)
1(1,238)
0(-)
Total Equity Funds Raised ($M) 15,844 12,802 1,132 1,054 4,366
Primary fund raised 4,628 442 844 522 4
Secondary fund raised 11,216 12,360 288 532 4,362
Corporate actions
No. of transactions 2023 2183 689 414 595
No. of IPOs (Jul 09 to Jun 10)
8069
46
209 13
61 6254
4232 25
254
SGX ASX Bursa HKX KRX NSE SHFE SZSE TSE TWSE NYX
(US)
NDAQ
(US)
LSE
(Source: WFE)

20
SGX
LONDONNEW YORK
TOKYOCHICAGO
GDP Growth Forecast
SGP : 14%
Conclusion
� Second best results• Growing memberships and customers • Broader product portfolio• Revival of primary market activity
� Building for the future• Reach initiative• New organisation• Focus on key business drivers
20
Asia : 8% Asean : 11%
World : 4%

21
Q & APlease state your name and the company you represent
While care has been taken to ensure the accuracy of the information in this document, SGX and its affiliates make no warranty as to the accuracy, completeness, merchantability or fitness for any purpose, of the information contained in this document or as to the results obtained by any person from the use of any information or investment product mentioned in this document. SGX reserves the right to make changes to such information from time to time. Any change, omission or error in such information, shall not form the basis for any claim, demand or cause of action against SGX or any of its affiliates and SGX and its affiliates expressly disclaim liability for the same.