FY17 Full Year Result 28 August...
29
FY17 Full Year Result 28 August 2017
Transcript of FY17 Full Year Result 28 August...
FY17 Full Year Result 28 August 2017

• This presentation may contain forward-looking statements regarding future events and the future financial performance of Chorus, including forward looking statements regarding industry trends, regulation and the regulatory environment, strategies, capital expenditure, the construction of the UFB network, possible business initiatives, credit ratings and future financial and operational performance. These forward-looking statements are not guarantees or predictions of future performance, and involve known and unknown risks, uncertainties and other factors, many of which are beyond Chorus’ control, and which may cause actual results to differ materially from those expressed in the statements contained in this presentation. No representation, warranty or undertaking, express or implied, is made as to the fairness, accuracy or completeness of the information contained, referred to or reflected in this presentation, or any information provided orally or in writing in connection with it. Please read this presentation in the wider context of material published by Chorus and released through the NZX andASX.
• Except as required by law or the NZX Main Board and ASX listing rules, Chorus is not under any obligation to update this presentation at any time after its release, whether as a result of new information, future events or otherwise.
• The information in this presentation should be read in conjunction with Chorus’ audited consolidated financial statements for the year ended 30 June 2017. This presentation includes a number of non-GAAP financial measures, including "EBITDA”. These measures may differ from similarly titled measures used by other companies because they are not defined by GAAP or IFRS. Although Chorus considers those measures provide useful information they should not be used in substitution for, or isolation of, Chorus' audited financial statements. Refer to the presentation appendices for further detail relating to EBITDA measures.
• This presentation does not constitute investment advice or a securities recommendation and has not taken into account any particular investor’s investment objectives or other circumstances. Investors are encouraged to make an independent assessment of Chorus.
2
Disclaimer
Business performance overview
3
Kate McKenzie, Chief Executive Officer

> FY17 overview, connections and trends 5-7
> Fibre rollout and uptake 8-10
> Financial results 12-13
> Capex 14-16
> FY18 guidance summary 17-18
> Capital management, FY17 dividend, debt 19-20
> FY18 priorities 22-29
Appendices
A: FY16 Adjusted EBITDA 31
B: Pro Forma FY16-FY17 EBITDA , FY17 Capex 32-35
C: Revised FY18 Revenue reporting categories 36
D: FY17 Connections table 37
E: NZ broadband market 38-39
Agenda
4FY17 RESULT PRESENTATION
Kate McKenzie, CEO
Kate McKenzie, CEO
Andrew Carroll, CFO

5
FY17 RESULT OVERVIEW
See Appendix A for the detailed calculation.

FY17 CONNECTION TRENDS
30 June 2016
31 Dec 2016
30 June 2017
Unbundled Copper (incl SLU/SLES)
110,000 99,000 82,000
Baseband copper (no broadband)
368,000 343,000 313,000
Fibre broadband (GPON) 167,000 231,000 292,000
VDSL (includes naked) 159,000 199,000 244,000
Copper ADSL (includes naked) 900,000 784,000 650,000
Data services (copper) 10,000 9,000 8,000
Fibre premium (P2P) 13,000 13,000 13,000
Total fixed line connections 1,727,000 1,678,000 1,602,000
> Total connections reduced by 125,000
a reduction of 83,000 copper lines with no broadband
a 40,000 decrease in total broadband connections to 1,186,000
decline of 2,000 data services (copper) connections
0
200000
400000
600000
800000
1000000
1200000
1400000
1600000
1800000
30-Jun-16 30-Sep-16 31-Dec-16 31-Mar-17 30-Jun-17
Data services (copper) Fibre premium (P2P)Fibre broadband (GPON) VDSLCopper ADSL Unbundled copper (no broadband)Baseband copper (no broadband)
Copper ADSL
VDSL
Fibre (GPON)
UCLL
Baseband copper

7
FY17 CONNECTION TRENDS
TOTAL CONNECTIONS BY UFB ZONE Non-UFB1 & 2 areas Chorus UFB1 & 2 areas
Local Fibre Company UFB 1 & 2 areas
TOTAL
Indicative No. of connections at 30 June(excludes premium business connections)
66,000 voice only173,000 broadband
252,000 voice only853,000 broadband
79,000 voice only158,000 broadband
397,0001,184,000
TOTAL 239,000 1,105,000 237,000 1,581,000
> Chorus connections declined as:
▪ Local Fibre Companies grew broadband share: ~140k connections at 30 June 17 (~85k FY16)
▪ fixed (mobile) wireless retailers encouraged existing broadband customers onto their own networks
▪ voice only lines migrated to broadband and/or mobile/wireless; some consolidation of multiple lines
▪ BUT broadband losses have slowed progressively following advertising/promotional activity
FY17 CONNECTION CHANGES Non-UFB1 areas Chorus UFB1 areas Local Fibre Company UFB1 areas TOTAL CHANGE
H2 FY17 BroadbandCopper line only (incl UCLL)TOTAL
-13,000-9,000
-22,000
+8,000-28,000-20,000
-23,000-10,000-33,000 -75,000
H1 FY17 BroadbandCopper line only (incl UCLL)TOTAL
-6,000-7,000
-13,000
+15,000-24,000-9,000
-21,000-6,000
-27,000 -49,000

0
10
20
30
40
50
60
70
80
90
100
Jun-16 Sep-16 Dec-16 Mar-17 Jun-17
<100Mbps 100Mbps 200Mbps
Gigabit Education Business 100Mbps+
3%
8%
14%
24%
35%
0%
5%
10%
15%
20%
25%
30%
35%
0
50000
100000
150000
200000
250000
300000
Jun-13 Jun-14 Jun-15 Jun-16 Jun-17
Our UFB uptake
Customers connected % Uptake
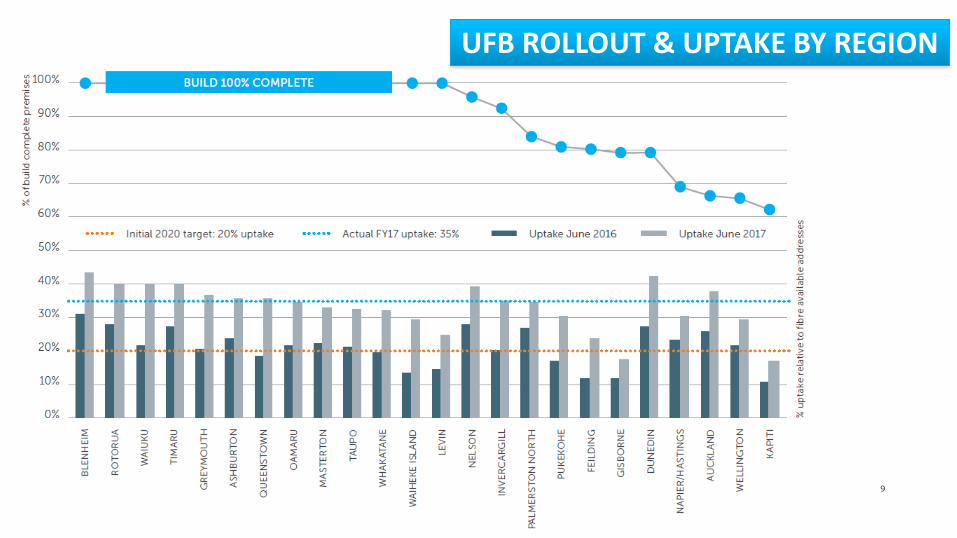
UFB1 rollout 70% complete with 581,000 premises passed
778,000 customers able to connect
FIBRE ROLLOUT & UPTAKE
8
35% uptake with 275,000 connections within UFB deployed footprint (FY16:156,000)
69% of mass market fibre plans now >100Mbps (FY16:54%)
Total mass market fibre uptake by plan type
50/10Mbps now $40.50/month
100/20Mbps now $43/month
FY17 RESULT PRESENTATION
% of plans
9
UFB ROLLOUT & UPTAKE BY REGION

0
5000
10000
15000
20000
25000
Jul-
15
Aug
-15
Sep
-15
Oct
-15
No
v-15
Dec
-15
Jan
-16
Feb
-16
Mar
-16
Apr
-16
May
-16
Jun
-16
Jul-
16
Aug
-16
Sep
-16
Oct
-16
No
v-16
Dec
-16
Jan
-17
Feb
-17
Mar
-17
Apr
-17
May
-17
Jun
-17
Jul-
17
Chorus fibre connection activity - all NZ
Connections built and activated Additional connections completed
Orders
10
FY17: A STEP UP IN FIBRE EXPERIENCE & DEMAND
(net of cancellations and rejections in the month)
update
1. As measured on a three month rolling average.
FY17 RESULT PRESENTATION
Financial performance
11
Andrew Carroll, Chief Financial Officer
FY17 RESULT PRESENTATION
FY17 $m
FY16 $m
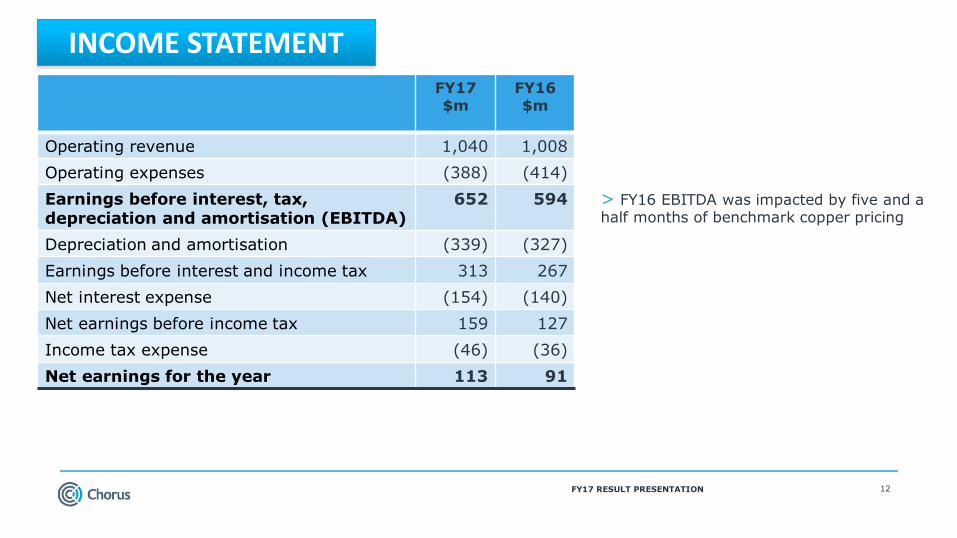
Operating revenue 1,040 1,008
Operating expenses (388) (414)
Earnings before interest, tax, depreciation and amortisation (EBITDA)
652 594
Depreciation and amortisation (339) (327)
Earnings before interest and income tax 313 267
Net interest expense (154) (140)
Net earnings before income tax 159 127
Income tax expense (46) (36)
Net earnings for the year 113 91
12
INCOME STATEMENT
> FY16 EBITDA was impacted by five and a half months of benchmark copper pricing
FY17 RESULT PRESENTATION

FY17 $m
FY16$m
Basic copper 450 489*
Enhanced copper 248 242*
Fibre 198 133
Value Added Network Services
36 35
Field Services 76 83*
Infrastructure 23 20
Other 9 6
Total 1,040 1,008
FY17 $m
FY16$m
Labour costs 74** 78
Provisioning 43 60
Network maintenance 87 89
Other network costs 27 34
IT costs 60** 65
Rents, rates and property maintenance
30 28
Regulatory levies 13 13
Electricity 14 14
Consultants 10 4
Insurance 3 3
Other 27 26
Total 388 414
Revenue Expenses
* included ~6 months of the final copper pricing determination
13FY17 RESULT PRESENTATION
Note: simplifying revenue categories for FY18 – see Appendix C ** These costs are impacted by a changed capitalisation approach in FY17
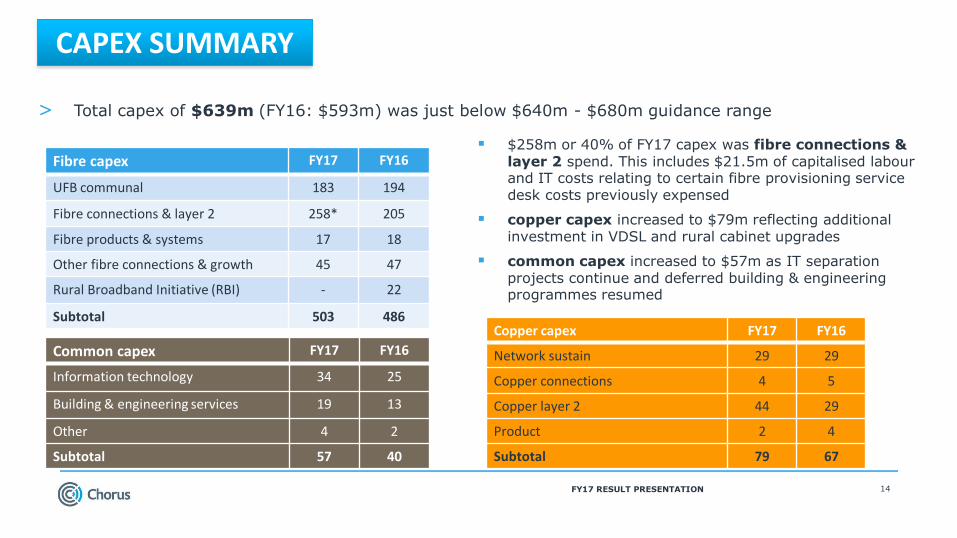
Fibre capex FY17 FY16
UFB communal 183 194
Fibre connections & layer 2 258* 205
Fibre products & systems 17 18
Other fibre connections & growth 45 47
Rural Broadband Initiative (RBI) - 22
Subtotal 503 486Copper capex FY17 FY16
Network sustain 29 29
Copper connections 4 5
Copper layer 2 44 29
Product 2 4
Subtotal 79 67
$258m or 40% of FY17 capex was fibre connections & layer 2 spend. This includes $21.5m of capitalised labour and IT costs relating to certain fibre provisioning service desk costs previously expensed
copper capex increased to $79m reflecting additional investment in VDSL and rural cabinet upgrades
common capex increased to $57m as IT separation projects continue and deferred building & engineering programmes resumed
14
Common capex FY17 FY16
Information technology 34 25
Building & engineering services 19 13
Other 4 2
Subtotal 57 40
CAPEX SUMMARY
> Total capex of $639m (FY16: $593m) was just below $640m - $680m guidance range
FY17 RESULT PRESENTATION

15
0
1000
2000
3000
4000
5000
FY13 FY14 FY15 FY16 FY17
Cost per premises connected
Cost per premises passed
$NZ
UFB COSTS
Chorus FTTP average cost per premises
0
50
100
150
200
250
300
350
400
UFB communal Fibre connections + layer 2
Fibre capex spend FY12 - FY17
FY12 FY13 FY14 FY15 FY16 FY17
> Cost per premises passed (CPPP):
$1,651 vs $1,550 - $1,650 guidance
> $41m work in progress (FY16 $48m)
> Cost per premises connected (CPPC):$1,122* vs $1,100 - $1,250 guidance
* excludes layer 2 and includes standard installations, some non-standard single dwellings and service desk costs
> ~$2.3 billion invested in UFB communal and fibre connections + layer 2 since demerger
FY17 RESULT PRESENTATION
$m
Includes capitalised service desk costs Includes capitalised service desk costs
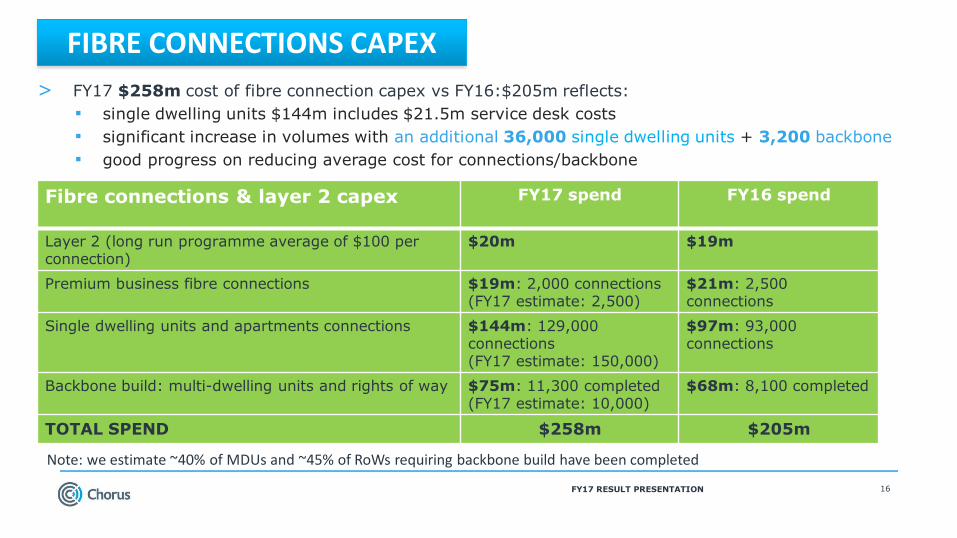
Fibre connections & layer 2 capex FY17 spend FY16 spend
Layer 2 (long run programme average of $100 per connection)
$20m $19m
Premium business fibre connections $19m: 2,000 connections(FY17 estimate: 2,500)
$21m: 2,500 connections
Single dwelling units and apartments connections $144m: 129,000 connections (FY17 estimate: 150,000)
$97m: 93,000 connections
Backbone build: multi-dwelling units and rights of way $75m: 11,300 completed(FY17 estimate: 10,000)
$68m: 8,100 completed
TOTAL SPEND $258m $205m
> FY17 $258m cost of fibre connection capex vs FY16:$205m reflects:
▪ single dwelling units $144m includes $21.5m service desk costs
▪ significant increase in volumes with an additional 36,000 single dwelling units + 3,200 backbone
▪ good progress on reducing average cost for connections/backbone
16
FIBRE CONNECTIONS CAPEX
FY17 RESULT PRESENTATION
Note: we estimate ~40% of MDUs and ~45% of RoWs requiring backbone build have been completed

FY18 guidance FY17 result
UFB1 Cost Per Premises Passed (CPPP)
$1,500 - $1,600 $1,651
UFB2 communal capex $50m - $70m(based on estimated starting premises of 30,000 to 40,000 and premises
handed over of 5,000 to 15,000)
UFB1 Cost Per Premises Connected(CPPC)
$1,050 - $1,200 (excluding layer 2 and including standard installations and some non-
standard single dwellings and service desk costs)
$1,122
Fibre connections & layer 2 capex
$260 – $290m (based on mass market 152,000 fibre connections, 12,000 backbone builds and 2,500 premium business fibre connections and
including service desk costs)
$258m
FY18 Gross capex $780 – $820m (see following page) $639m
FY18 EBITDA $625 – 650m (see appendices for illustrative IFRS impacts) $652m
17FY17 RESULT PRESENTATION
UFB programme guidance
UFB1 Communal guidance: $1.75 - $1.8 billion
Tracking toward the top half of this programme guidance, excluding additional splitter investment. As a result of higher than anticipated fibre uptake, Chorus is bringing forward the investment of additional
splitters prior to 2020, and expects to spend up to $30 million on this capability by 2020. This additional expenditure is growth related.
GUIDANCE SUMMARY

> FY18 GUIDANCE: $ 780m - $820m gross capex reflects the following:
Fibre $590m-$625m
~$10m capitalisation (IFRS 15)
~$10m pole replacement programme in Chorus UFB areas
$50-70m spend forecast for UFB2 communal
Growth in forecast fibre connections
Copper $125m-$145m
~$50m capitalisation of items previously expensed (IFRS 15)
~$10m pole replacement programme across the balance of the network
common: $50m-$65m
18
FY18 CAPEX GUIDANCE
FY17 FY18 GUIDANCE
FY17 vs FY18 illustrative capex profile
Common Copper Fibre
125-145
50-65
590-625
$780 - $820m
503
79
57
$639m
FY17 RESULT PRESENTATION

FY17 RESULT PRESENTATION 19
CAPITAL MANAGEMENT & FY18 DIVIDEND
> FY17 final dividend of 12.5 cps, fully imputed
▪ supplementary dividend of 2.2cps payable to non-resident shareholders
▪ record date: 26 September 2017
▪ payment date: 10 October 2017
▪ Dividend Reinvestment Plan applies with 3% discount to prevailing market price; open to New Zealand and Australian resident shareholders
> FY18 dividend guidance of 22cps, subject to no material adverse changes in circumstances or outlook.
> The Chorus Board considers that a ‘BBB’ credit rating or equivalent credit rating is appropriate for a company such as Chorus. It intends to maintain capital management and financial policies consistent with these credit ratings.
> During the UFB build programme to 2020, the Board expects to be able to provide shareholders with modest dividend growth from a base of 20cps per annum, subject to no material adverse changes in circumstances or outlook.

As at 30 June 2017
$m
Borrowings 1,862
+ PV of CFH debt securities (senior)
99
+ Net Finance leases 154
Sub total 2,115
- Cash (170)
Total net debt 1,945
Net debt/EBITDA 2.98 times
Financial covenants require senior debt ratio to be no greater than 4.75 times
> At 30 June, debt of $1,862m comprised:
▪ Long term bank facilities $350m undrawn
▪ NZ bond $400m
▪ Euro Medium Term Notes $1,462m (NZ$ equivalent at hedged rates)
FY17 RESULT PRESENTATION 20
DEBT
NZ $M
677
400
785
59 59 89 11327 46
7896
0
200
400
600
800
2018
2019
2020
2021
2022
2023
2024
2025
2026
2027
2028
2029
2030
2031
2032
2033
2034
2035
2036
CFH debt securities available
Face value of CFH debt securities issued
EUR EMTN
NZ Bond
GBP EMTN
Term debt profile

Our priorities for FY18
21
Kate McKenzie, Chief Executive Officer
FY17 RESULT PRESENTATION

WHAT WE’RE FOCUSED ON
18FY17 RESULT PRESENTATION

DELIVERING THE FUTURE BROADBAND NETWORK
23
> New regulatory framework bill introduced to Parliament 8 August (General Election 23 Sept)
Next steps: legislative process, then the Commerce Commission will consult and set input methodologies.
FY17 RESULT PRESENTATION

BETTER BROADBAND: CONGESTION FREE
24FY17 RESULT PRESENTATION
> A year ago we forecast ~170GB monthly average per connection by the end of FY17
▪ during FY17 average data usage grew 52% from 102GB to 155GB
▪ 167GB achieved in July
> Based on historical trends, we’re forecasting ~680GB average data usage by 2020
▪ HD TV uses 3GB per hour
▪ 4K TV uses 7GB per hour
▪ 22% of NZ consumers streaming programmes
▪ ~50% of Sky TV set-top boxes internet capable
▪ ~60% households on unlimited data plans
42
6878
89
106
134
92
134
155
186197
222
44
7284
102
123
155
DEC-14 JUN-15 DEC-15 JUN-16 DEC-16 JUN-17
Monthly average data usage per connection on Chorus network
Copper Fibre Average
Netflix launches in NZ

25
PEAK HOUR – WHEN CONGESTION FREE REALLY COUNTS
FY17 RESULT PRESENTATION
> Peak hour data traffic is growing rapidly
▪ 51% increase in Chorus network traffic at ~9pm between June 2016 and June 2017
▪ TrueNet data shows fixed line broadband (fibre/VDSL/ADSL) delivers consistent performance at peak times
▪ wireless (mobile) networks share capacity, as evidenced by significant video buffering
Rural fixed wireless achieving <60% of median best speed at peak time
Chorus network traffic by time of day
Broadband technology comparison by time of day
Source: TrueNet Urban Broadband Report July 2017
Source: TrueNet Urban and Rural Broadband Reports June 2017
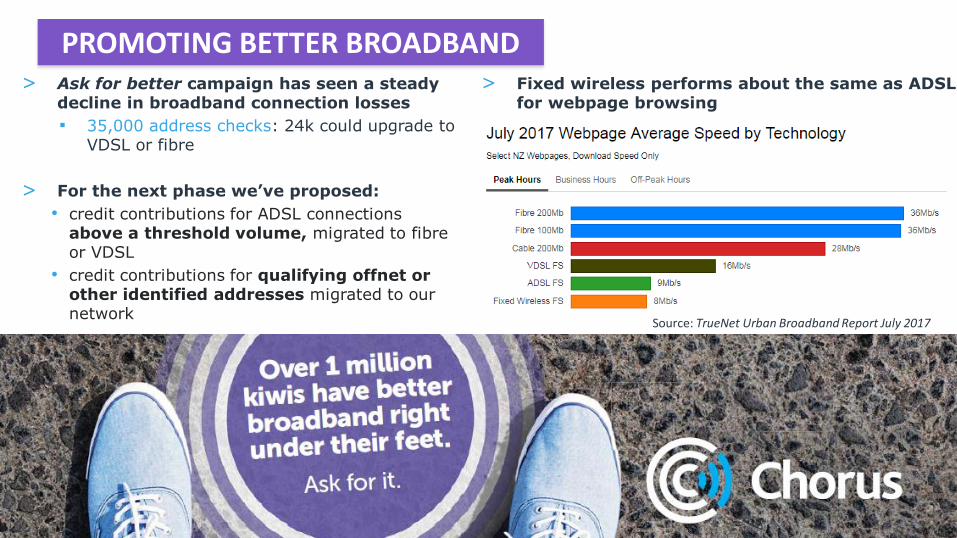
PROMOTING BETTER BROADBAND > Ask for better campaign has seen a steady
decline in broadband connection losses
▪ 35,000 address checks: 24k could upgrade to VDSL or fibre
> For the next phase we’ve proposed:
• credit contributions for ADSL connections above a threshold volume, migrated to fibre or VDSL
• credit contributions for qualifying offnet or other identified addresses migrated to our network
9FY17 RESULT PRESENTATION
Source: TrueNet Urban Broadband Report July 2017
> Fixed wireless performs about the same as ADSL for webpage browsing

> RSP led migrations in completed UFB areas
▪ linked to RSP door-to-door campaigns
> Chorus initiatives in completed UFB areas
▪ MDU fibre awareness campaigns underway
▪ door knock trial in suburban areas soon
> combined UFB street build + ONT installation
▪ strong response to door knock trial in Hokitika
▪ extending to rest of Hokitika build area
> Fibre ready subdivisions
▪ working with developers to pre-connect homes
27FY17 RESULT PRESENTATION
TRANSFORMING CUSTOMER EXPERIENCE & COST
Fibre migration activity> Strong fibre demand requires mass
connection solutions
▪ tactical fibre migration activity to group orders and reduce customer effort to <1 day

> We’re reshaping our structure to lift customer experience further
▪ need to orient the business around focused customer migration activities
▪ preparing for a post UFB rollout environment
28
TRANSFORMING CUSTOMER EXPERIENCE
RSP PRODUCT, SALES & MARKETING RSP relationships from operational matters to sales
CUSTOMER CARE order management, faults and fibre consenting
TECHNOLOGY consolidated planning for investment across network
NETWORK & FIELD MANAGEMENT responsibility for network resilience and service companies
STRATEGY &
BUSINESS OPS: drives end-to-end
performanceimprovement
CORPORATE
FY17 RESULT PRESENTATION

29
CREATING OPPORTUNITIES TO GROW
FY17 RESULT PRESENTATION
> Leveraging our network
▪ fixed line and 5G: we see a complementary future
▪ strong demand for trial data centre; more sites planned
▪ national backhaul contract with 2degrees
▪ emerging demand for non-broadband access points