FY Mar 17 Results - Ryanair | Investor Relations · PDF fileimpact Ryanair [sexpected results...
21
FY Mar 17 Results
Transcript of FY Mar 17 Results - Ryanair | Investor Relations · PDF fileimpact Ryanair [sexpected results...

FY Mar 17 Results
2
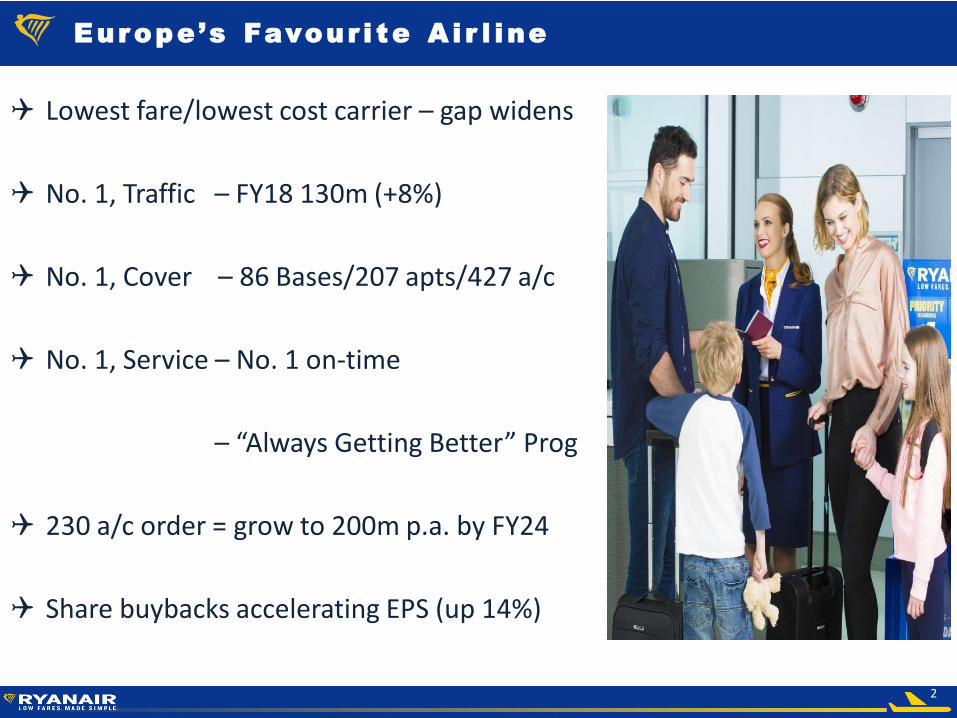
Europe’s Favour i te A i r l ine
Lowest fare/lowest cost carrier – gap widens
No. 1, Traffic – FY18 130m (+8%)
No. 1, Cover – 86 Bases/207 apts/427 a/c
No. 1, Service – No. 1 on-time
– “Always Getting Better” Prog
230 a/c order = grow to 200m p.a. by FY24
Share buybacks accelerating EPS (up 14%)
3
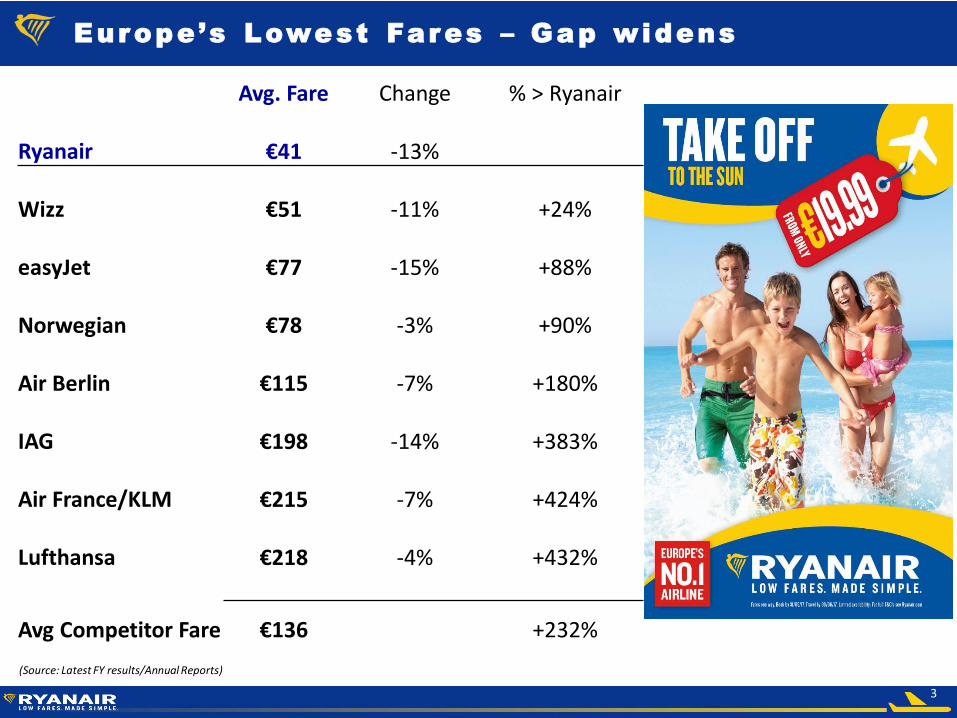
Europe’s Lowest Fares – Gap widens
(Source: Latest FY results/Annual Reports)
Avg. Fare Change % > Ryanair
Ryanair €41 -13%
Wizz €51 -11% +24%
easyJet €77 -15% +88%
Norwegian €78 -3% +90%
Air Berlin €115 -7% +180%
IAG €198 -14% +383%
Air France/KLM €215 -7% +424%
Lufthansa €218 -4% +432%
Avg Competitor Fare €136 +232%
4
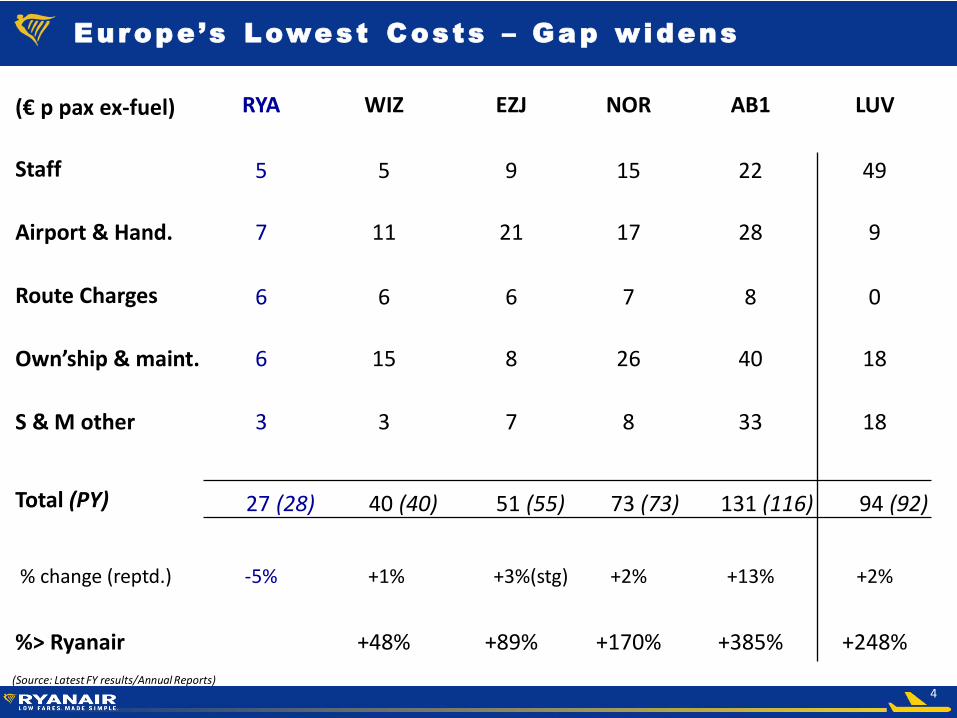
(€ p pax ex-fuel) RYA WIZ EZJ NOR AB1 LUV
Staff 5 5 9 15 22 49
Airport & Hand. 7 11 21 17 28 9
Route Charges 6 6 6 7 8 0
Own’ship & maint. 6 15 8 26 40 18
S & M other 3 3 7 8 33 18
Total (PY) 27 (28) 40 (40) 51 (55) 73 (73) 131 (116) 94 (92)
% change (reptd.) -5% +1% +3%(stg) +2% +13% +2%
%> Ryanair +48% +89% +170% +385% +248%
Europe’s Lowest Costs – Gap widens
(Source: Latest FY results/Annual Reports)
5
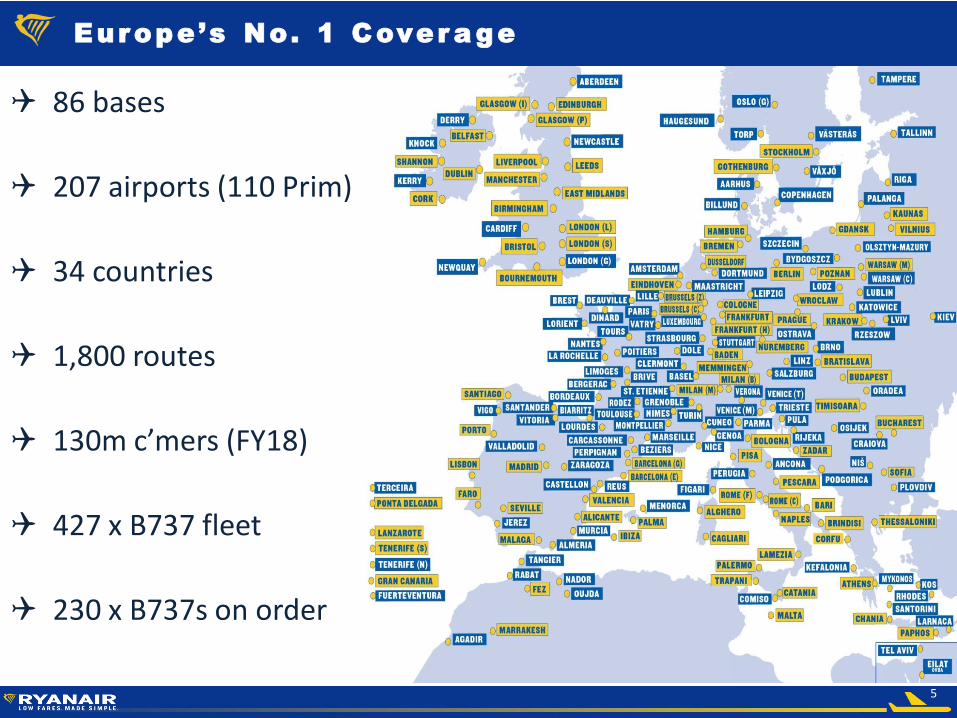
86 bases
207 airports (110 Prim)
34 countries
1,800 routes
130m c’mers (FY18)
427 x B737 fleet
230 x B737s on order
Europe’s No. 1 Cover age
6
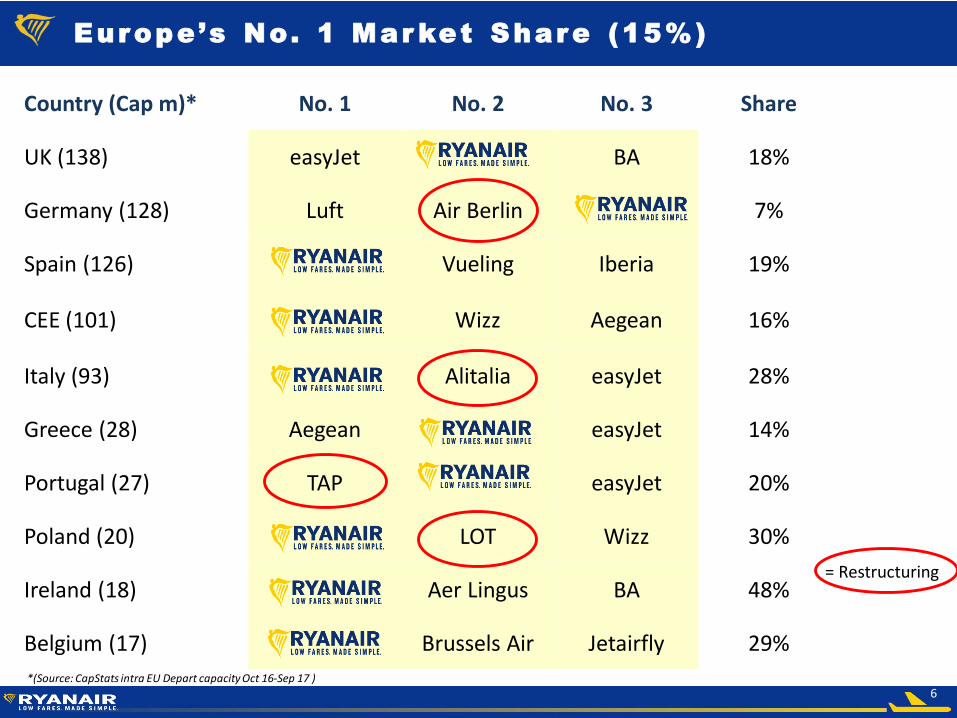
Europe’s No. 1 Mar ket Share (15%)
*(Source: CapStats intra EU Depart capacity Oct 16-Sep 17 )
Country (Cap m)* No. 1 No. 2 No. 3 Share
UK (138) easyJet BA 18%
Germany (128) Luft Air Berlin 7%
Spain (126) Vueling Iberia 19%
CEE (101) Wizz Aegean 16%
Italy (93) Alitalia easyJet 28%
Greece (28) Aegean easyJet 14%
Portugal (27) TAP easyJet 20%
Poland (20) LOT Wizz 30%
Ireland (18) Aer Lingus BA 48%
Belgium (17) Brussels Air Jetairfly 29%
= Restructuring
7
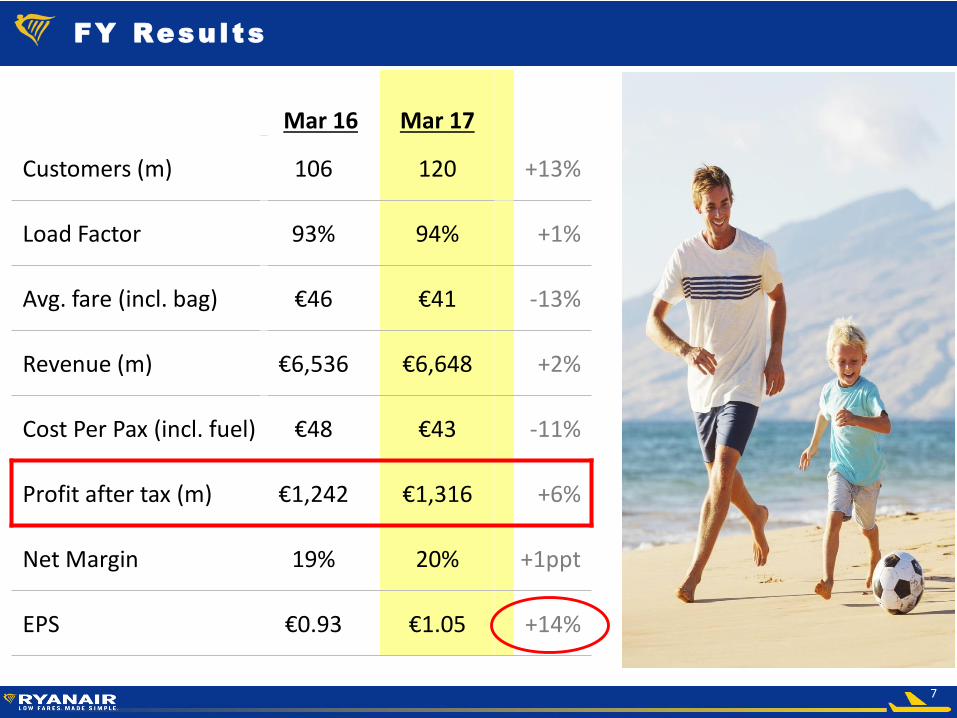
Mar 16 Mar 17
Customers (m) 106 120 +13%
Load Factor 93% 94% +1%
Avg. fare (incl. bag) €46 €41 -13%
Revenue (m) €6,536 €6,648 +2%
Cost Per Pax (incl. fuel) €48 €43 -11%
Profit after tax (m) €1,242 €1,316 +6%
Net Margin 19% 20% +1ppt
EPS €0.93 €1.05 +14%
FY Resul ts
8
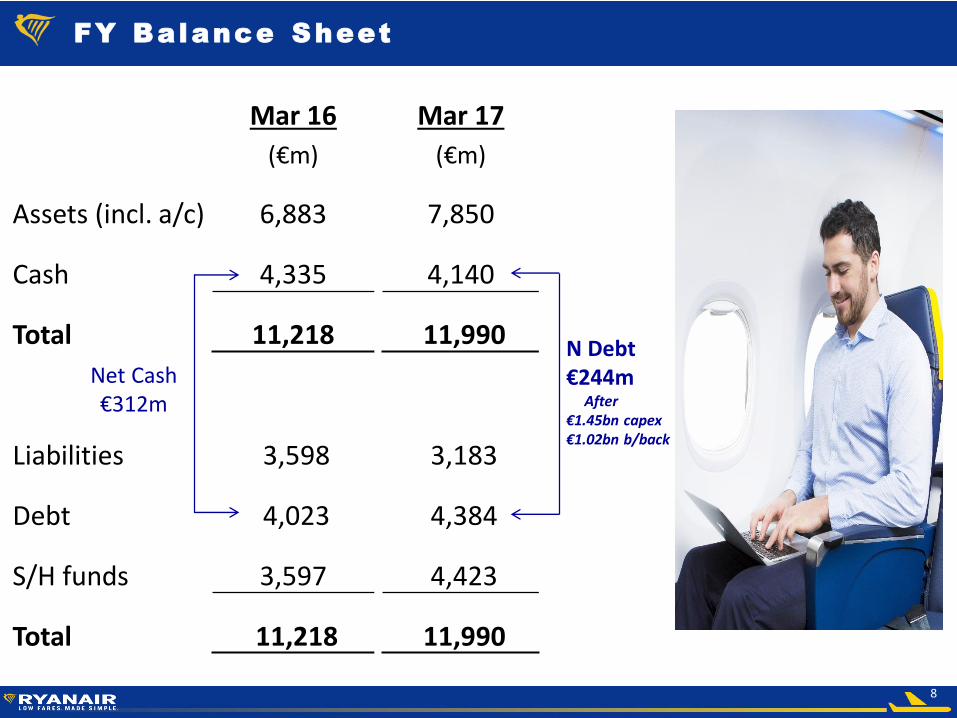
FY Balance Sheet
Mar 16 Mar 17
(€m) (€m)
Assets (incl. a/c) 6,883 7,850
Cash 4,335 4,140
Total 11,218 11,990
Liabilities 3,598 3,183
Debt 4,023 4,384
S/H funds 3,597 4,423
Total 11,218 11,990
Net Cash€312m
N Debt€244m
After€1.45bn capex€1.02bn b/back
9
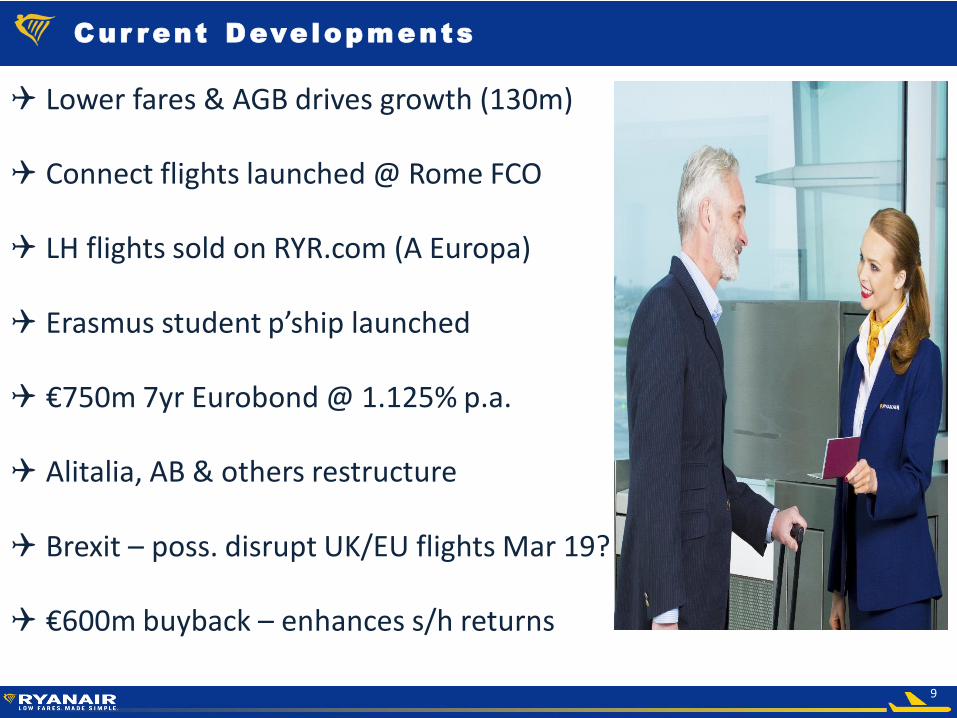
Cur rent Developments
Lower fares & AGB drives growth (130m)
Connect flights launched @ Rome FCO
LH flights sold on RYR.com (A Europa)
Erasmus student p’ship launched
€750m 7yr Eurobond @ 1.125% p.a.
Alitalia, AB & others restructure
Brexit – poss. disrupt UK/EU flights Mar 19?
€600m buyback – enhances s/h returns
10
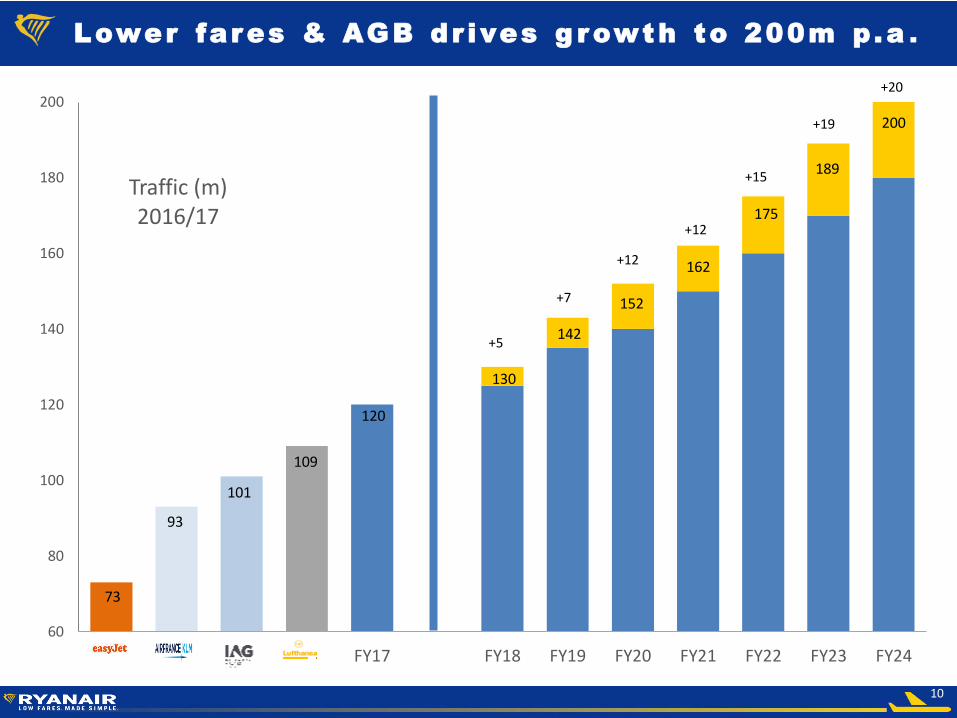
Lower fares & AGB dr ives g rowth to 200m p.a .
73
93
101
109
120
130
142
152
162
175
189
200
60
80
100
120
140
160
180
200
FY17 FY18 FY19 FY20 FY21 FY22 FY23 FY24
Traffic (m)2016/17
+5
+7
+12
+12
+15
+19
+20
11
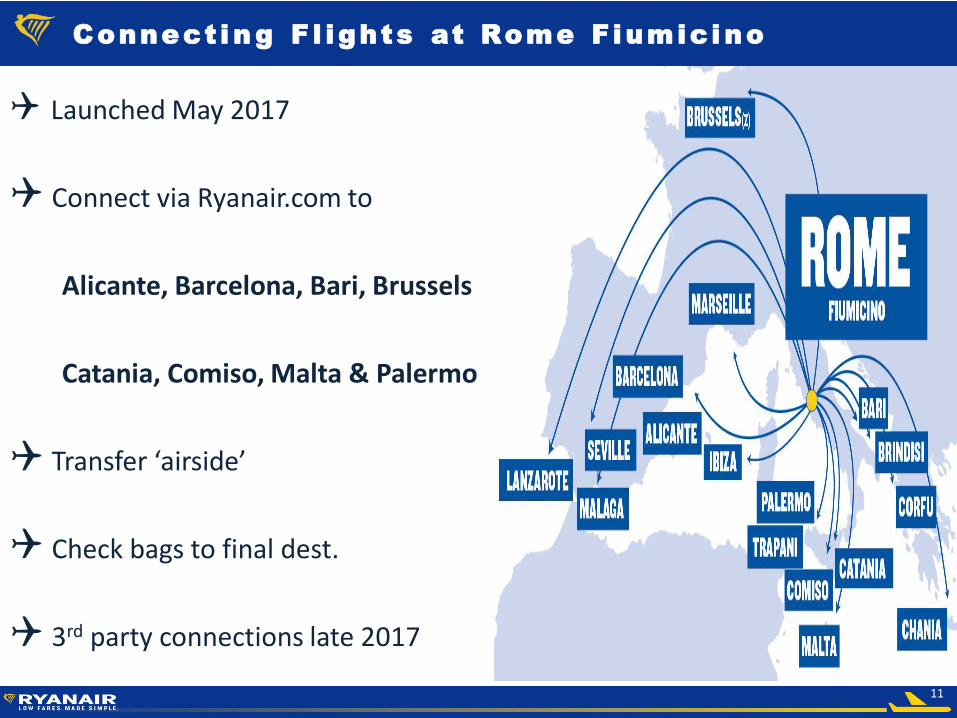
Connect ing F l ights at Rome Fiumicino
Launched May 2017
Connect via Ryanair.com to
Alicante, Barcelona, Bari, Brussels
Catania, Comiso, Malta & Palermo
Transfer ‘airside’
Check bags to final dest.
3rd party connections late 2017
12
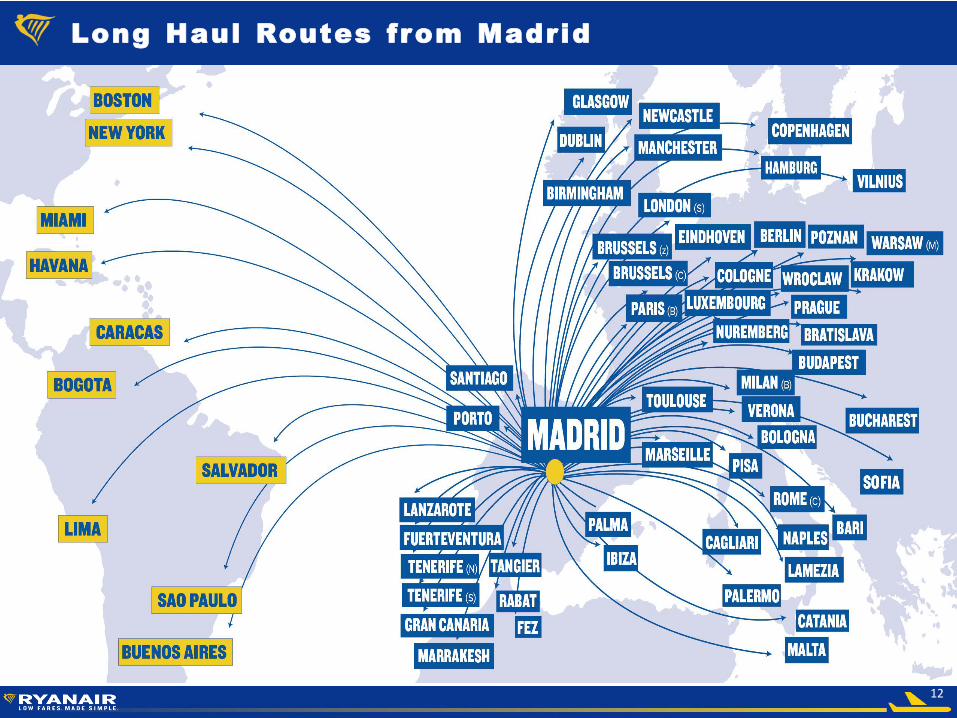
Long Haul Routes from Madrid
13
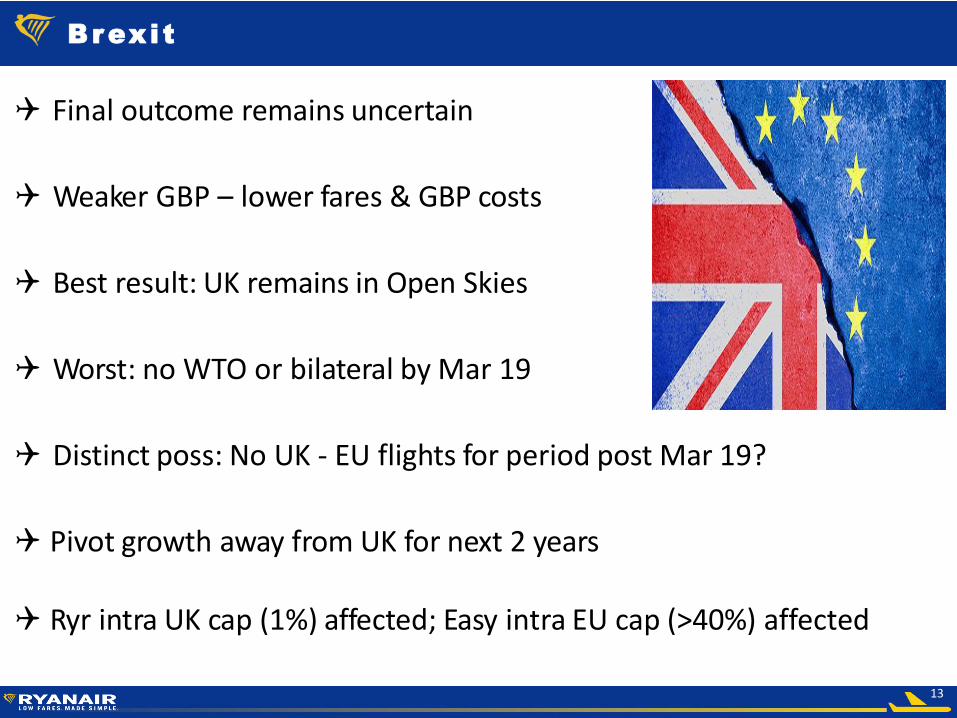
Brexi t
Final outcome remains uncertain
Weaker GBP – lower fares & GBP costs
Best result: UK remains in Open Skies
Worst: no WTO or bilateral by Mar 19
Distinct poss: No UK - EU flights for period post Mar 19?
Pivot growth away from UK for next 2 years
Ryr intra UK cap (1%) affected; Easy intra EU cap (>40%) affected
14
€-
€2
€4
€6
€8
€10
€12
€14
€16
€18
May 08 May 09 May 10 May 11 May 12 May 13 May 14 May 15 May 16 May 17
€2.54€3.41
€6.93€10.28
€13.17
€13.92
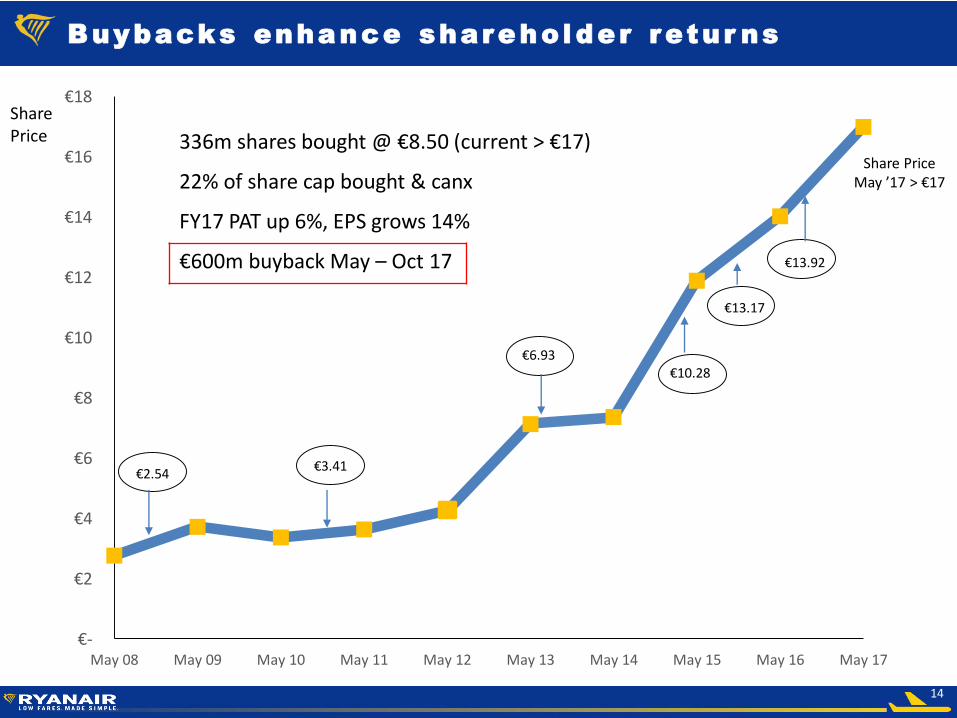
Buybacks enhance shareholder retur ns
Share Price May ’17 > €17
336m shares bought @ €8.50 (current > €17)
22% of share cap bought & canx
FY17 PAT up 6%, EPS grows 14%
€600m buyback May – Oct 17
Share Price
15
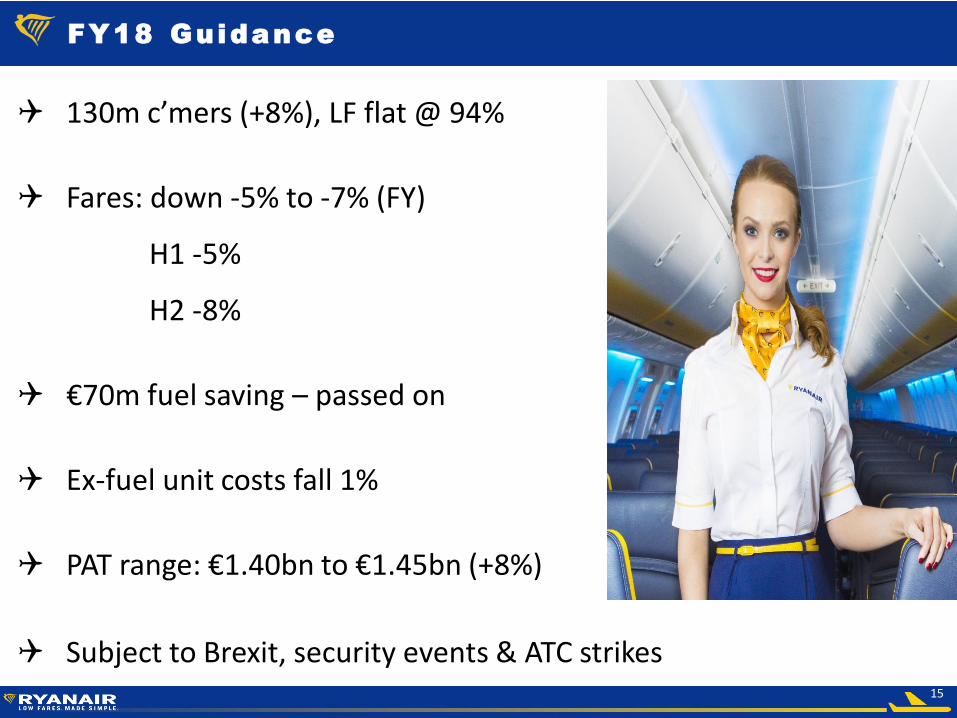
FY18 Guidance
130m c’mers (+8%), LF flat @ 94%
Fares: down -5% to -7% (FY)
H1 -5%
H2 -8%
€70m fuel saving – passed on
Ex-fuel unit costs fall 1%
PAT range: €1.40bn to €1.45bn (+8%)
Subject to Brexit, security events & ATC strikes

16
Appendices
17
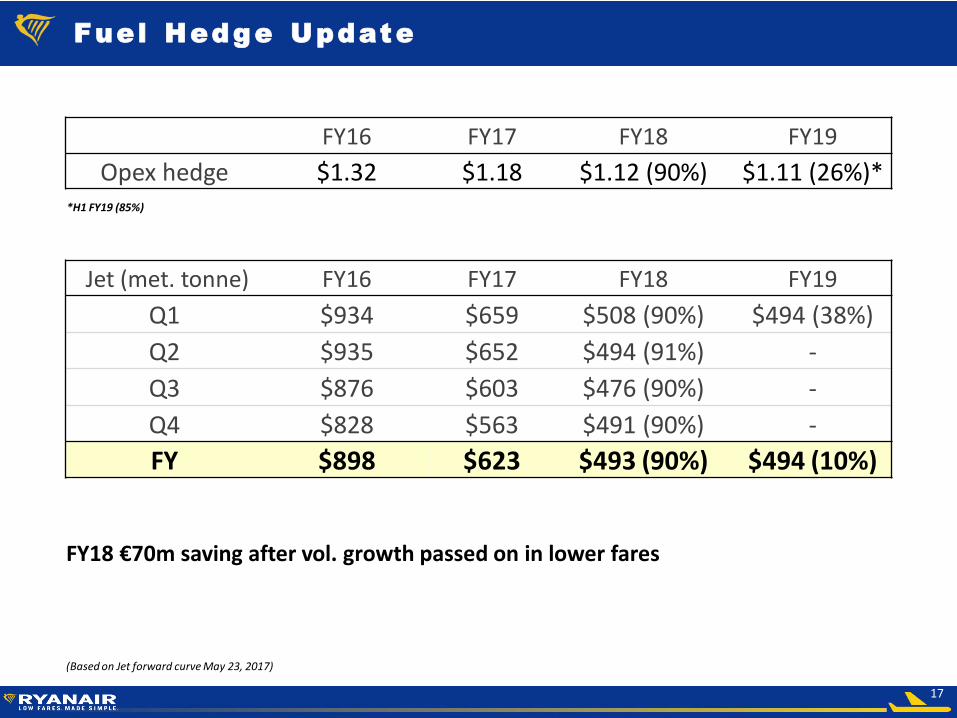
Fuel Hedge Update
FY16 FY17 FY18 FY19
Opex hedge $1.32 $1.18 $1.12 (90%) $1.11 (26%)**H1 FY19 (85%)
Jet (met. tonne) FY16 FY17 FY18 FY19
Q1 $934 $659 $508 (90%) $494 (38%)
Q2 $935 $652 $494 (91%) -
Q3 $876 $603 $476 (90%) -
Q4 $828 $563 $491 (90%) -
FY $898 $623 $493 (90%) $494 (10%)
(Based on Jet forward curve May 23, 2017)
FY18 €70m saving after vol. growth passed on in lower fares
18
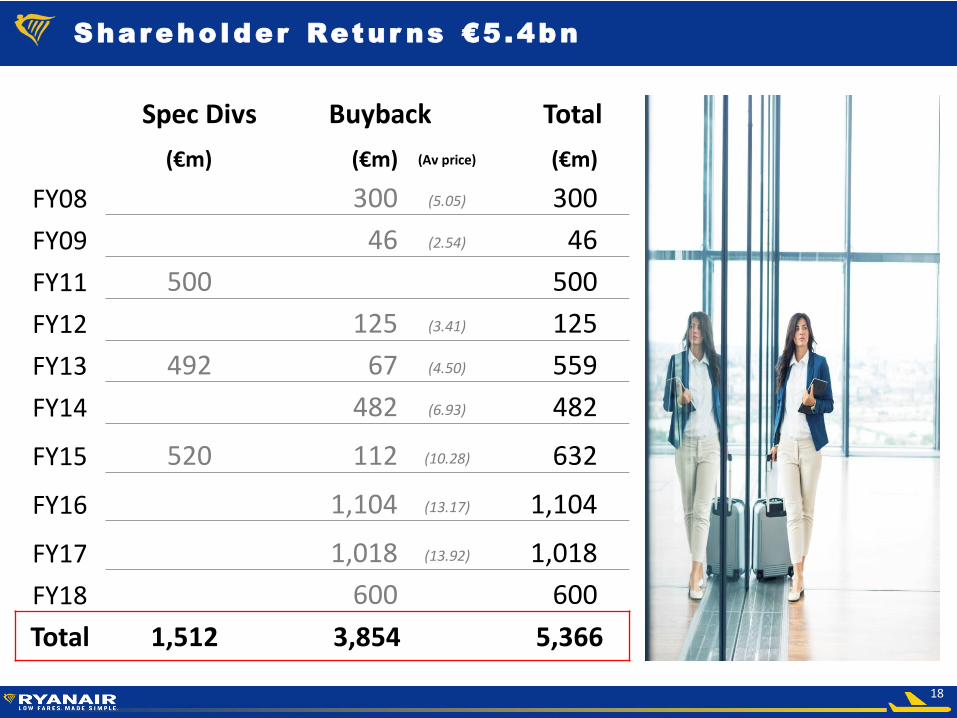
Shareho lder Retur ns €5.4bn
Spec Divs Buyback Total
(€m) (€m) (Av price) (€m)
FY08 300 (5.05) 300
FY09 46 (2.54) 46
FY11 500 500
FY12 125 (3.41) 125
FY13 492 67 (4.50) 559
FY14 482 (6.93) 482
FY15 520 112 (10.28) 632
FY16 1,104 (13.17) 1,104
FY17 1,018 (13.92) 1,018
FY18 600 600
Total 1,512 3,854 5,366
19
73
7-8
00
Ord
er
MA
X O
rde
r
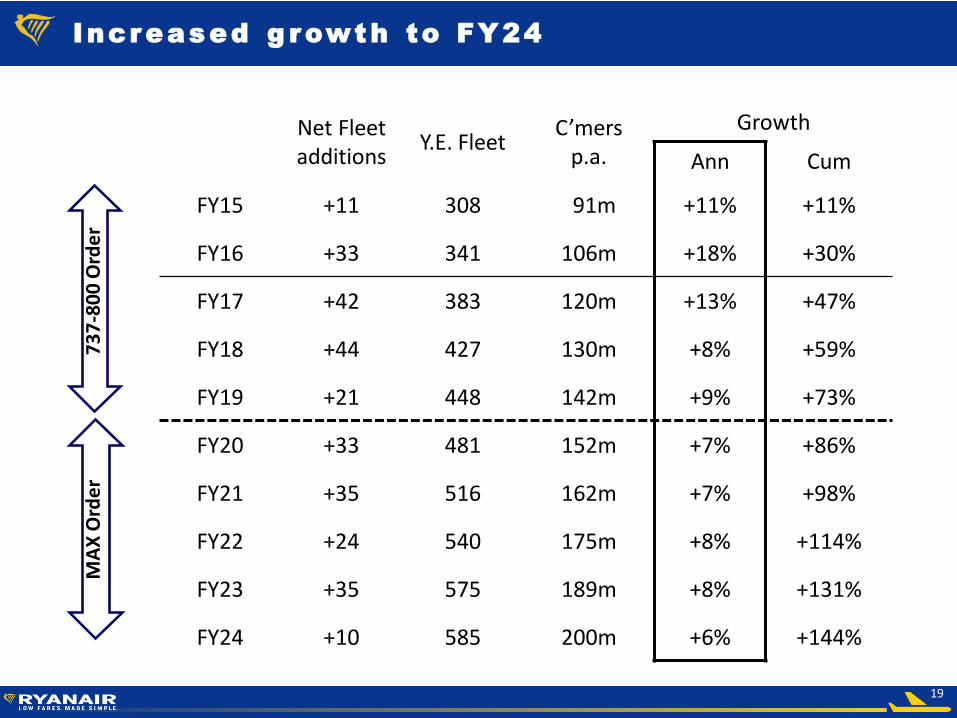
Increased g rowth to FY24
Net Fleet additions
Y.E. FleetC’mers
p.a.
Growth
Ann Cum
FY15 +11 308 91m +11% +11%
FY16 +33 341 106m +18% +30%
FY17 +42 383 120m +13% +47%
FY18 +44 427 130m +8% +59%
FY19 +21 448 142m +9% +73%
FY20 +33 481 152m +7% +86%
FY21 +35 516 162m +7% +98%
FY22 +24 540 175m +8% +114%
FY23 +35 575 189m +8% +131%
FY24 +10 585 200m +6% +144%
20
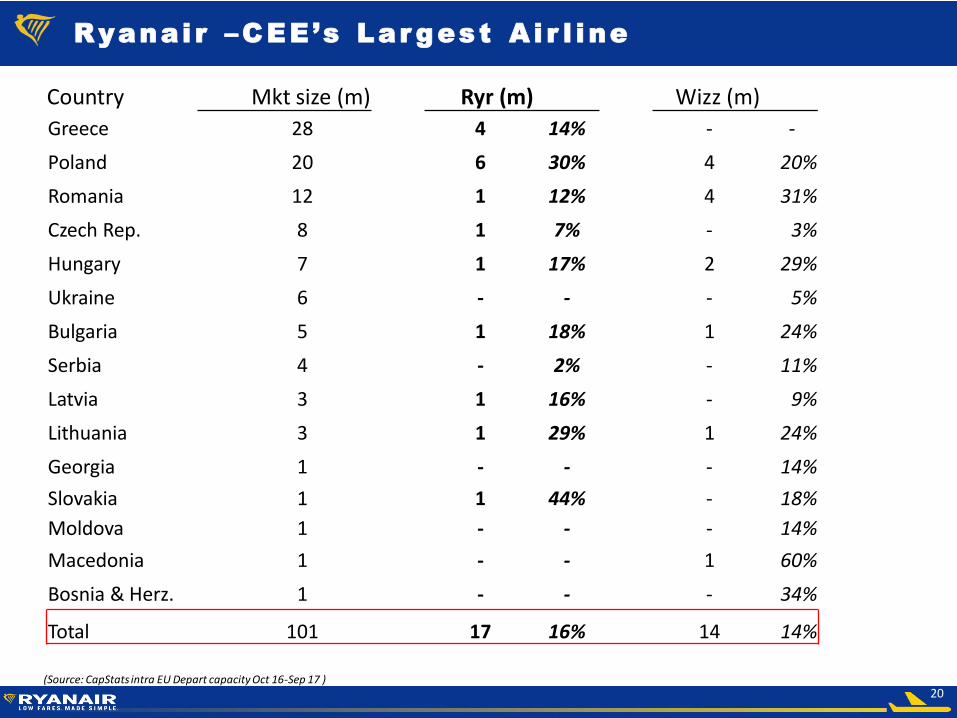
Ryanai r –CEE’s Lar gest A i r l ine
Country Mkt size (m) Ryr (m) Wizz (m)
Greece 28 4 14% - -
Poland 20 6 30% 4 20%
Romania 12 1 12% 4 31%
Czech Rep. 8 1 7% - 3%
Hungary 7 1 17% 2 29%
Ukraine 6 - - - 5%
Bulgaria 5 1 18% 1 24%
Serbia 4 - 2% - 11%
Latvia 3 1 16% - 9%
Lithuania 3 1 29% 1 24%
Georgia 1 - - - 14%
Slovakia 1 1 44% - 18%
Moldova 1 - - - 14%
Macedonia 1 - - 1 60%
Bosnia & Herz. 1 - - - 34%
Total 101 17 16% 14 14%
(Source: CapStats intra EU Depart capacity Oct 16-Sep 17 )
21
Certain of the information included in this presentation is forward looking and is subject to important risks and uncertainties that couldcause actual results and developments to differ materially from those expressed in or implied by such forward-looking statements. By theirnature, forward-looking statements involve risk and uncertainty because they relate to events and depend upon future circumstances thatmay or may not occur. A number of factors could cause actual results and developments to differ materially from those express or impliedby the forward-looking statements including those identified in this presentation and other factors discussed in our Annual Report onForm 20-F filed with the SEC. It is not reasonably possible to itemise all of the many factors and specific events that could affect theoutlook and results of an airline operating in the European economy. Among the factors that are subject to change and could significantlyimpact Ryanair’s expected results are the airline pricing environment, fuel costs, “Brexit”, competition from new and existing carriers,market prices for the replacement aircraft, costs associated with environmental, safety and security measures, actions of the Irish, U.K.,European Union (“EU”) and other governments and their respective regulatory agencies, fluctuations in currency exchange rates andinterest rates, airport access and charges, labour relations, the economic environment of the airline industry, the general economicenvironment in Ireland, the UK and Continental Europe, the general willingness of passengers to travel and other economics, social andpolitical factors and flight interruptions caused by volcanic ash emissions or other atmospheric disruptions. These and other factors couldadversely affect the outcome and financial effects of events or developments referred to in this presentation on the Ryanair Group.Forward looking statements contained in this presentation based on trends or activities should not be taken as a representation that suchtrends or activities will continue in the future.
Except as may be required by the Market Abuse Rules of the Central Bank of Ireland, Listing Rules of the Irish Stock Exchange or by anyother rules of any applicable regulatory body or by law, the Company disclaims any obligation or undertaking to release publicly anyupdates or revisions to any forward statements contained herein to reflect any changes in the Company’s expectations with regard to anychange in events, conditions or circumstances on which any such statement is based.
This presentation contains certain forward-looking statements as defined under US legislation. By their nature, such statements involveuncertainty; as a consequence, actual results and developments may differ from those expressed in or implied by such statementsdepending on a variety of factors including the specific factors identified in this presentation and other factors discussed in our AnnualReport on Form 20-F filed with the SEC
Discla imer