FY 2018 Operational Feasibility Study Project towards ...
50
FY 2018 Operational Feasibility Study Project towards Overseas Deployment of High-Quality Infrastructure (Republic of Indonesia: Feasibility Study Project for Flood Disaster Preparedness Planning Assuming the Use of Flood Simulator and Weather Radar in the Province of Gorontalo) Study Report February 2019 Kanematsu Corporation Japan Weather Association
Transcript of FY 2018 Operational Feasibility Study Project towards ...

FY 2018 Operational Feasibility Study Project towards
Overseas Deployment of High-Quality Infrastructure
(Republic of Indonesia: Feasibility Study Project for Flood
Disaster Preparedness Planning Assuming the Use of Flood
Simulator and Weather Radar in the Province of Gorontalo)
Study Report
February 2019
Kanematsu Corporation
Japan Weather Association

Table of Contents
1. Profile of the partner country/sector .............................................................................................................. 1
1-1. Economic and financial situations of the partner country .................................................................... 1
1-2. Profile of the target sector of the project............................................................................................ 1
1-3. Current state of the target region ...................................................................................................... 1
2. Study methodology .......................................................................................................................................... 3
2-1. Study content .................................................................................................................................. 3
2-2. Study method, organizational framework, and schedule ..................................................................... 3
(1) Study method ............................................................................................................................... 3
(2) Organizational framework for study implementation ....................................................................... 3
(3) Study schedule .............................................................................................................................. 4
2-3. Study results ................................................................................................................................... 5
(1) Current status of the use of weather radar and flood hazard maps in Japan......................................... 5
(2) Flood simulator-related ............................................................................................................... 10
(3) Weather radar-related .................................................................................................................. 14
(4) Past flood situation ...................................................................................................................... 18
(5) River improvement status (flow rate data collection covering lake water and irrigation) ................... 18
(6) Hosting local workshop and seminar at Gorontalo province ........................................................... 19
(7) Results of discussions held in Jakarta with the Japanese Embassy, the BMKG, and the BNPB .......... 21
(8) Results of activities at COP24 ...................................................................................................... 21
3. Consideration of the content and technical aspects of the project ............................................................ 23
3-1. Background, necessity, etc., of the project ....................................................................................... 23
(1) Background of the project ............................................................................................................ 23
(2) Necessity of the project ............................................................................................................... 23
3-2. Basic guidelines, decisions, etc., on the content of the project ........................................................... 24
3-3. Outline of the project ..................................................................................................................... 25
3-4. Items required to be considered ...................................................................................................... 26
(1) Inclusion in local government budget ........................................................................................... 26
(2) Development of collaboration between related agencies ................................................................. 26
(3) Personnel development and training, etc. ...................................................................................... 26
3-5. Environmental and social impacts associated with project implementation ........................................ 26
(1) Introduction of the radar(s) .......................................................................................................... 26
(2) Introduction of the flood simulator ............................................................................................... 27
4. Financial and economic feasibility ............................................................................................................... 28
4-1. Project cost estimation ................................................................................................................... 28
4-2. Summary of the results of (preliminary) financial/economic analysis ................................................ 29
(1) Prediction of the effect of the installation of the flood simulator ..................................................... 30
(2) Funding feasibility consideration.................................................................................................. 30
5. Project implementation schedule ................................................................................................................. 31
6. Implementation competence of the implementation agencies of the counterpart country ..................... 32
6-1. Profile of the implementation agencies of the counterpart country .............................................. 32

6-2. Organizational framework for project implementation in the counterpart country ..................... 32
6-3. Competence evaluation of the implementation agencies of the counterpart country and
countermeasures ................................................................................................................................ 33
7. Competitive advantages of Japanese enterprises in terms of technology and other aspects ................... 35
7-1. International competitiveness of Japanese enterprises in project bidding (by
equipment/product/service) and probability of winning orders .......................................................... 35
(1) International competitiveness of “Japan-made Flood-Simulator” ............................................. 35
(2) Probability of winning orders for “Japan-made Flood-Simulator” ............................................ 38
7-2. Descriptions and prices of the main materials and equipment expected to be procured from Japan
........................................................................................................................................................... 38
7-3. Measures necessary to help Japanese enterprises to win orders ................................................... 40
8. Prospects of fund procurement for the project ........................................................................................... 41
8-1. Views of the counterpart country’s government and agencies on fund procurement .................... 41
8-2. Movements of related agencies with regards to fund procurement .............................................. 41
8-3. Prospects of project-related fund procurement, the current status of requests for yen loan, and the
likelihood of its approval .................................................................................................................... 43
9. Challenges and action plan towards the realization of the project............................................................ 44
9-1. Progress in fund procurement efforts including requests for UN-GCF and yen loan .................... 44
9-2. Measures expected to be necessary for future funding requests for and provision of UN-GCF, yen
loan, etc. ............................................................................................................................................. 44
9-3. Specific challenges and action plan towards submission of funding requests for UN-GCF funds, yen
loans, etc.; and other issues including horizontal deployment to other countries ................................ 45

1
1. Profile of the partner country/sector
1-1. Economic and financial situations of the partner country
Indonesia maintained a high economic growth rate with a real GDP growth rate of 5.0% for 2016 and 5.1% for
2017. The per-capita nominal GDP for 2017 reached $3,876. Boasting a population of 240 million people,
Indonesia has increased its presence as a leading economic power country in the ASEAN region.1
Meanwhile, infrastructure development in Indonesia is lagging behind economic growth. This is the case not
only in terms of worsening traffic jams or a tight power supply and demand balance but also in terms of earthquake,
tsunami, and other natural disaster preparedness and commitment to global warming issues. While Indonesia’s
ratio of outstanding government debt to GDP is in the 20-percent range and is lower than those of its ASEAN
neighbors, the country has been posting fiscal deficits since 2012. The Indonesian government is promoting a
reform for fiscal health restoration.
1-2. Profile of the target sector of the project
Indonesia is populated by approximately 227 million people and extends over a land area of approximately 1.9
million km2. Located in the southern part of South East Asia, the country consists of more than 18,000 islands.
While most of its national territory belongs to tropical rainforest climate, Indonesia has a dry and rainy season.
Disastrous droughts and forest fires frequently occur in the dry season while squalls and heavy rains frequently
cause devastating inundations and floods in the rainy season. In addition, located over the boundaries between the
Pacific Plate, the Eurasian Plate, the Australian Plate, and the Philippine Sea Plate, Indonesia is constantly prone
to natural disasters including earthquakes, volcanic eruptions, and seismically-induced tsunami attacks.
The Bureau of Meteorology, Climate and Geophysics (BMKG) has been in charge of providing weather
observation services. The BMKG has been working on enhancing its information dissemination capability as one
of disaster control measures, through international cooperation and assistance received to improve its observation
equipment and operational capabilities. In 2008, following the recent chains of natural disasters, the central
government established the National Disaster Management Authority (BNPB) for further improvement of disaster
response capabilities. The BNPB collaborates with the BMKG in efforts to develop disaster preparedness plans,
develop regional hazard and risk maps, and enhance disaster response capabilities and disaster preparedness of
disaster-related agencies and communities.
Nevertheless, Regional Disaster Management Agencies (BPBD), BNPB’s regional branches, still fall short of
providing sufficient guidance and support to local governments. Meanwhile, Japan has been providing yen-loan
support, both material and non-material, such as flood control measures or capability building programs.
1-3. Current state of the target region
Typical impacts of climate change in Indonesia include increased sea water levels, increased sea surface water
temperatures, and changes in rainfall patterns. Adaptive challenges resulting from these include, among other
things: increases in floods/extreme weather phenomena; ecosystem destruction; and storm surge-induced or
otherwise induced damage to economy, livelihood, ecosystem, and special areas.
The Province of Gorontalo, the target region of this study project, suffers frequent droughts induced by climate
change such as El Niño. Additional problems associated with the Province are landslide and flood disasters that
1 JETRO “Indonesia: Basic Economic Indicators” at https://www.jetro.go.jp/world/asia/idn/stat_01.html

2
result from reduced ecosystem function due to deforestation for slash-and-burn agriculture. As a result, Lake
Limboto has not only diminished in area and depth (area reduced by 60 percent and max. depth reduced to 4
meters from 14 meters over 20 years) but has also come to face various environmental problems due to water
quality deterioration, such as survival crisis of endemic aquatic species and poor fish catches.
Additionally, the Gorontalo Provincial BPBD has been established only very recently and has yet to be able to
cooperate efficiently with the BMKG regional office in issuance of forecasts and warnings. Due to delays in local
government efforts in disaster prevention and environmental conservation, no flood disaster mitigation measures
have been implemented yet and no established data have been made available for estimating losses from disasters.

3
2. Study methodology
2-1. Study content
The purposes of this study project are as follows: proposing strategies for using the flood simulator (flood
hazard map development and real-time inundation prediction); lobbying the local government about the
effectiveness of the disaster prevention infrastructure system through a project implementation feasibility study
on the introduction of weather radar; and winning the contract for flood simulator installation financed locally by
the local government budget and/or weather radar installation financed by the UN’s GCF, a yen loan, or any other
foreign funds. The study items are as shown in Table 2-1:
Table 2-1: Study items
Item Details
1) Survey on the use of weather radars and
flood hazard maps in Japan
Investigated cases of their use in Japan and organize basic data
for considering feasible strategies in Gorontalo Province.
2) Current status survey on Gorontalo
Regency
Investigated the current state of precipitation observation,
frequency bands available for the weather radar to be
introduced. Collected information on, among other things, the
following; possible installation sites for the new weather radar;
flood response preparedness; and past flood disasters.
3) Current status survey on irrigation and
anti-flood infrastructure
Investigated the current status of any irrigation project and flood
control infrastructure development along the rivers supplying
water to the target region of this study project.
4) Feasibility study on the introduction of
the “flood simulator” and “weather
radar”
Verified the effectiveness of hazard map development using the
flood simulator. Performed cost-benefit analysis of its
introduction and narrowed down the list of possible weather
radar installation sites to analyze the effect and cost-benefit of
the introduction.
2-2. Study method, organizational framework, and schedule
(1) Study method
This study was conducted under the organization shown below according to the schedule shown below. A
total of six field investigation visits were made mainly to Gorontalo Regency and Gorontalo City governments,
the BMKG Regional Office, the Regional Disaster Management Agency (BPBD), the Ministry of Public Works
(PU) Regional Office, and Regional River Bureau (BWSSII); these visits were preceded and followed by
analysis work in Japan.
As explained below in the study results, the collaborative work with these government-affiliated
organizations consisted mainly of grasping the current state and activities, collecting related data, and
conducting joint on-site surveys. Regarding future equipment installation, a hearing was held in Jakarta with
related departments and agencies.
(2) Organizational framework for study implementation
The organizational framework for implementing this study project is as shown in Figure 2-1:

4
Figure 2-1: Organizational framework for study implementation
(3) Study schedule
The schedule for this study project is as shown in Figure 2-2:
作業項目 Work item
8 月 August
9 月 September
10 月 October
11 月 November
12 月 December
1 月 January
2 月 February
1.計画準備 1. Planning and preparation
2.本邦の気象レーダ・洪水ハザードマップの活用状況調査
2. Survey on use of weather radar and flood hazard maps
in Japan
3.ゴロンタロ県における現状調査 3. Current status survey in Gorontalo Regency
3.1 洪水シミュレータ関連データ確認収集 3.1 Flood simulator-related data check and collection
3.2 気象一般、既存レーダーのデータ収集分析 3.2 Collection and analysis of general meteorological and
existing radar data
3.3 灌漑、洪水状況(既往洪水水位等)の調査 3.3 Survey on irrigation/flood status (past flood water
作業項目
▲
実施スケジュール詳細
6.追加1回目(10月20日~31日)では、関係者会合及びワークショップ・シンポジウム開催に向けた詳細打ち合わせを実施。兼松、ゴーベルDKMが参加。7.追加2回目(10月29日~11月10日)では、関係者会合及び追加情報収集活動を実施。パスコ、ゴーベルDKMが参加。8. 経産省との打ち合わせは、契約打ち合わせ、及び報告書確認打ち合わせも入れて合計5回実施。
▲ ▲
1. 出張回数は6回実施、COP24にも参加。各出張期間と内容は下記の通り。追加調査2回については個別報告書は提出していない。2. 1回目(8月4日~10日)ではキックオフ、プレゼン説明、及び関連部署等との個別協議を実施。兼松、日本気象協会、パスコ、ゴーベルDKM、Daemeter社が参加。3. 2回目(9月25日~10月6日)では、資料収集、追加現場調査、ワークショップ準備等を実施。日本気象協会及びゴーベルDKMが参加。
4. 3回目(11月20日~28日)では、ワークショップを実施し調査結果を共有し、県主催のシンポジウムに参加。またジャカルタにて大使館・BMKG訪問及び関係者会合を 実施。兼松、日本気象協会、日立、パスコ、中外、ゴーベルDKM、Daemeter社が参加
5. 4回目(1月20日~24日)では、大使館・BMKG訪問及び関係者会合を実施。兼松、日本気象協会、ゴーベルDKMが参加。
★4
経産省打合せ ▲ 契約 ▲
追1 ★ 追2 ★ 3
6.ワークショップ・シンポジウムの実施 COP24
7.報告書の作成
現地(ゴロンタロ県)調査・訪問 ★ 1 ★ 2 ★
2月
1.計画準備
2.本邦の気象レーダ・洪水ハザードマップの活用状況調査
3.ゴロンタロ県における現状調査 3.1 洪水シミュレータ関連データ確認収集 3.2 気象一般、既存レーダーのデータ収集分析 3.3 灌漑、洪水状況(既往洪水水位等)の調査
4.ゴロンタロ県への気象レーダ導入可能性検討
5.ゴロンタロ県へのDioVISTA導入可能性検討
8月 9月 10月 11月 12月 1月
Outsourcing
Chugai Technos Corp.
Outsourcing
Hitachi, Ltd. Pasco Corp. Indonesia
Gorontalo Regency Govt.
Gobel Group
Cooperation in survey
Daemeter
METI
Commissioning
Coordination/support
for field survey Survey implemented by
Kanematsu Corp. JWA

5
levels, etc.)
4.ゴロンタロ県への気象レーダ導入可能性検討 4. Feasibility study on introduction of weather radar in
Gorontalo Regency
5.ゴロンタロ県への Japan-made Flood-Simulator導入可能性検討
5. Feasibility study on introduction of Japan-made Flood-
Simulator in Gorontalo Regency
6.ワークショップ・シンポジウムの実施 6. Holding of workshop/symposium
7.報告書の作成 7. Report preparation
現地(ゴロンタロ県)調査・訪問 Fact-finding missions/visits (Gorontalo Regency)
経産省打合せ Consultations with Ministry of Economy, Trade and
Industry (METI)
追 1 Follow-up 1
追 2 Follow-up 2
契約 Contract
実施スケジュール詳細 Details of implementation schedule
1. 出張回数は 6 回実施、COP24 にも参加。 各出張期間と内容は下記の通り。 追加調査 2 回については個別報告書は提出していない。
1. Made six visits. Also attended COP24. Periods of these
visits are as given below. No separate report presented
for two follow-up investigation visits.
2. 1 回目(8 月 4 日~10 日)ではキックオフ、プレゼン説明、及び関連部署等との個別協議を実施。 兼松、日本気象協会、パスコ、ゴーベル DKM、Daemeter
社が参加。
2. During 1st visit (Aug. 4 to 10), held kick-off meeting,
made presentation, and had individual discussions with
related departments. Participants joined from
Kanematsu, JWA, Pasco, Gobel DKM, and Daemeter.
3. 2 回目(9 月 25 日~10 月 6 日)では、資料収集、追加現場調査、ワークショップ準備等を実施。 日本気象協会及びゴーベル DKM が参加。
3. During 2nd visit, (Sept. 25 to Oct. 6), collected data,
conducted additional on-site investigations, made
preparations for workshop, and performed other related
tasks. Participants joined from JWA and Gobel DKM.
4. 3 回目(11 月 20 日~28 日)では、ワークショップを実施し調査結果を共有し、県主催のシンポジウムに参加。 またジャカルタにて大使館・BMKG 訪問及び関係者会合を実施。 兼松、日本気象協会、日立、パスコ、中外、ゴーベル DKM、Daemeter 社が参加
4. During 3rd visit (Nov. 20 to 28), held workshop to
share survey results. Then, joined symposium hosted by
Regency. Back in Jakarta, paid visits to Japanese
Embassy and BMKG and held stakeholder meeting.
Participants joined from Kanematsu, JWA, Hitachi,
Pasco, Chugai, Gobel DKM, and Daemeter.
5. 4 回目(1 月 20 日~24 日)では、大使館・BMKG
訪問及び関係者会合を実施。 兼松、日本気象協会、ゴーベル DKM が参加。
5. During 4th visit (Jan. 20 to 24), paid visits to Japanese
Embassy and BMKG and held stakeholder meeting.
Participants joined from Kanematsu, JWA, and Gobel
DKM.
6. 追加 1 回目(10 月 20 日~31 日)では、関係者会合及びワークショップ・シンポジウム開催に向けた詳細打ち合わせを実施。 兼松、ゴーベル DKM が参加。
6. During 1st follow-up (Oct. 20 to 31), held stakeholder
meeting and detailed meeting in preparation for and
workshop/symposium. Participants joined from
Kanematsu and Gobel DKM.
7. 追加 2 回目(10 月 29 日~11 月 10 日)では、関係者会合及び追加情報収集活動を実施。 パスコ、ゴーベル DKM が参加。
7. During 2nd follow-up (Oct 29 to Nov. 10), held
stakeholder meetings and collected additional
information. Participants joined from Pasco and Gobel
DKM.
8. 経産省との打ち合わせは、暫定的に契約打ち合わせも入れて 4 回実施。
8. Four meetings held with METI, tentatively including
contract consultation.
Figure 2-2: Study implementation schedule
2-3. Study results
(1) Current status of the use of weather radar and flood hazard maps in Japan
(i) Weather radar
A weather radar is an instrument to observe precipitation and winds by transmitting radio waves in a range
with a radius of several hundred kilometers and measuring the radio wave reflections from rain drops. In Japan,
a dual-polarization weather radar equipped with a solid-state transmitter was developed by a domestic
manufacturer. Now deployment of weather radar networks is underway to cover the whole country.
A dual-polarization radar simultaneously transmits and receives radio waves that oscillate in horizontal and

6
vertical directions. These two types of received signals are processed to calculate rainfall intensities with high
accuracy. Amounts of rainfall can be accurately estimated entirely on the basis of radar data without the need
of relying on rain gauges for corrective calculations. Additionally, the time required from observation until
weather information provision can be reduced to approximately 1 to 2 minutes. Figure 2-3 shows typical
measurements taken by single-polarization dual-polarization radars.
In dual-polarization measurement, as shown in Figure 2-4, longitudinal- and transverse-wave pulses are
transmitted to estimate the shapes of rain drops, thereby significantly improving the observation accuracy. This
allows acquisition of high-resolution data (250-meter mesh, 1-minute intervals) with accuracy almost equivalent
to that achievable by on-ground rain gauges. These data are expected to be useful in various fields of application.
直上メッシュ Overhead mesh
地上雨量計とレーダーメッシュ値の関係 Relationship between rain gauge readings and radar
mesh values
10 分雨量(mm/10 分) 10-minute precipitation (mm/10 minutes)
地上雨量(mm) Ground rainfall amount (mm)
二重偏波レーダ雨量(mm) Precipitation measured by dual-polarization radar (mm)
従来手法レーダ雨量(mm) Precipitation radar-measured by conventional method
(mm)
従来手法(単偏波)は誤差が大きい The conventional method (single-polarization) is prone
to large errors.
二重偏波レーダは地上雨量計による補正なしでも高精度
The dual-polarization radar provides highly accurate
measurements without relying on rain gauges for
corrective calculations.
2017 年 07 月 11 日 July 11, 2017
地上雨量計の直上メッシュと比較 Comparison of precipitation data between radar data on
overhead mesh and rain gauge data
Figure 2-3: Comparison in terms of observation accuracy between conventional and dual-polarization
radars
二重偏波レーダは地上雨量計による補正無しでも高精度
地上雨量 (mm)
二重偏波レーダ雨量(mm)
従来手法レーダ雨量(mm)
地上雨量計の直上メッシュと比較
従来手法(単偏波)は誤差が大きい
radar rain-gauge
直上メッシュ
地上雨量計とレーダーメッシュ値の関係

7
レーダ Radar
送信パルス Transmitted pulse
偏波間位相差 Specific differential phase
受信信号 Received signal
降水域 Precipitation area
雨滴の大きさにより雨滴の形状が扁平する性質を利用
The tendency of rain drops to become flatter with size is
used.
Figure 2-4: Principle of measurement using dual-polarization radar
In Japan, replacement is underway of conventional (single-polarization) radars with dual-polarization solid-
state radars. As detailed later, 14 out of 26 C-band weather radars under the control of the Ministry of Land,
Infrastructure, Transport and Tourism (MLIT) have been replaced with dual-polarization radars, most of which
are solid-state radars. A solid-state radar is one equipped with a transmitter built with semiconductors (solid-
state elements). The differences between the types of transmitters are as shown in Table 2-2. Solid-state
transmitters require low transmission power and hence provide a system suitable for use in Indonesia, troubled
with a worsening power shortage. Built with parts having a long service life of over 10 years, these transmitters
excel in terms of maintainability and hence provide operational and economic advantages.
Table 2-2: Comparison of radio wave transmission systems
Item Longevity Lifecycle cost Operability /
maintainability
Unit’s
footprint Transmission power
Magnetron × × × △ Approx. 250 kW
Klystron △ △ × × Approx. 200 kW
Solid-state element ◎ ◎ ◎ ◎ Approx. 6 kW
In Japan, the Japan Meteorological Agency (JMA) and the MLIT each operate a C-band radar observation
network covering the whole country (Figure 2-5). Additionally, the MLIT also operates a country-wide X-band
Polarimetric Radar Information Network (XRAIN) (Figure 2-6). The JMA’s radars are mainly used for daily
numerical prediction calculations and weather forecasts. Meanwhile, the MLIT uses its C-band radars mainly
for river management and disaster prevention purposes such as landslide disaster monitoring while operating
the XRAIN primarily to monitor short downpours in urban areas.

8
Figure 2-5: C-band radar observation networks operated by JMA (left: coverage radius = 200 km) and MLIT
(right: coverage radius = 120 km)
Figure 2-6: MLIT’s X-band Polarimetric Radar Information Network (XRAIN) (coverage radius =60 km)
(ii) Flood hazard maps
The Japanese Flood Protection Act requires that each municipality prepare a flood hazard map by adding the
following to flood- and inundation-prone area maps: the methods of disseminating flood-related information
including flood forecasts; locations of disaster refuge areas; and all other information necessary to ensure
efficient and rapid evacuation in the event of a flood disaster. As of March 2017, approximately 1,300
municipalities have made their flood hazard maps open to public access. The MLIT’s hazard map portal site
(https://disaportal.gsi.go.jp/) allows users to view flood hazard maps covering the whole country.
Table 2-3 shows typical applications of flood hazard maps. As an example of evacuation drills using a hazard
map, Figure 2-7 shows snapshots of one conducted in Okura Village, Yamagata Prefecture.
Table 2-3: Typical applications of flood hazard maps
• Disaster prevention lectures using flood hazard maps
• Evacuation drills using hazard maps

9
• Water disaster prevention education in collaboration with educational institutions
• River study meetings for promoting better understanding of hazard maps
• PR through mass media (radio)
• Wall or bulletin board displays at community centers, schools, etc.
• Application to evacuation action plan development
Figure 2-7: Typical example of evacuation drill using a flood hazard map
取組主体:大蔵村、大蔵村消防団 Conducted by: Okura Village and its fire brigade
参加人数:住民 71 人(大人 46 人、子ども 25 人) Number of participants: 71 residents (46 adults and 25
children)
取組概要:平成 23 年 9 月の「大蔵村総合防災訓練」において、住民に洪水ハザードマップ、まるごとまちごとハザードマップを理解してもらうため、3 地区に分かれて、ハザードマップを活用した防災訓練を実施
Description of activity: “Okura Village Comprehensive
Disaster Prevention Drill” was held in September 2011.
The participants were divided block by block into three
groups to help them better understand the flood hazard
map and village-wide hazard map.
・まるごとまちごとハザードマップの概要説明 • Briefing of village-wide hazard map
・標識を確認しながら避難誘導訓練 • Evacuation guidance drill conducted checking signs
・避難路の危険箇所などを確認し、評価シートに記入
• Evaluation sheet filled out, checking hazard spots along
evacuation routes.
・避難場所に集合し、アンケート調査を実施 • Participants reassembled at the disaster refuge area to
respond to questionnaire survey.
洪水ハザードマップ Flood hazard map
「平成 23 年度大蔵村総合防災訓練」の様子 Snapshots of “FY 2011 Okura Village Comprehensive
Disaster Prevention Drill”
説明の様子(清水 2・3 地区) Snapshot of briefing (Shimizu Districts 2 and 3)
避難の様子(清水 2・3 地区) Snapshot of evacuation (Shimizu Districts 2 and 3)
説明の様子(合海地区) Snapshot of briefing (Aikai District)
避難の様子(合海地区) Snapshot of evacuation (Aikai District)
An inundation simulation is necessary to develop flood- and inundation-prone area maps for inclusion in a
hazard map. The “Japan-made Flood-Simulator” flood simulator described in the next sub-section allows the
user to easily specify and manipulate the conditions for embankment failure and overtopping and the

10
computational conditions for rainfall scenarios. Thus, it serves as an optimal tool for developing flood hazard
maps.
The introduction of “Japan-made Flood-Simulator” to Gorontalo Province will allow the development and
revision of flood hazard maps and their application to evacuation drills and evacuation action planning, thereby
helping to enhance resilience against frequent water disasters.
(2) Flood simulator-related
To ensure the introduction of the “Japan-made Flood-Simulator” flood simulator to Gorontalo Province and
Regency, the Provincial and Regency governments must be lobbied about the simulator’s computational
performance, reproducibility, and operability. Then, this study project conducted a simulation covering the area
shown in Figure 2-8 and evaluated the obtained results.
A high-precision simulation requires accurate data, which are expensive and not readily available. Hence, we
used data provided by the relevant government agencies of Gorontalo Province and open data available on the
Internet. At a workshop held by the Gorontalo Regency Government Office (on November 23, 2018 during our
third stay), we made a presentation of the obtained evaluation results to the Regency Governor and those in
charge of disaster prevention. We also conducted an operational demonstration of “Japan-made Flood-
Simulator.”
Figure 2-8: Area covered by the simulation
(i) Acquisition of data necessary for simulation and its evaluation
In this study project, a list was made of data necessary to introduce “Japan-made Flood-Simulator” and
process analysis results. Then, consideration was given to the availability of such data.
More specifically, we investigated the websites of relevant Indonesian national agencies beforehand in Japan
and then conducted a hearing survey in Indonesia, as shown in Table 2-4, with assistance from Nusantara Secom
InfoTech (NSI), the local subsidiary of Pasco Corporation. These research activities clarified the presence or
absence of existing data and allowed us to grasp the detailed specifications of available existing data and their
availability for use in this project and to estimate the costs and expenses incurred from the use of such data.
Considering the continuity of the project, it is desirable to keep data collection and maintenance costs low. The

11
accuracy of data, however, will directly affect that of “Japan-made Flood-Simulator” analysis results.
Accordingly, we have to devise data collection and maintenance strategies with consideration given to the
balance between accuracy and cost-effectiveness.
Table 2-4: Outline of fact-finding mission on existing data
Period Main agencies visited
Aug. 4 to 10, 2018
BPBD Gorontalo Provincial Office
BMKG Gorontalo Office
PU Gorontalo Provincial Office
BWS Sulawesi Second Office
BPBD Gorontalo Regency Office
BPBD Gorontalo City Office
Oct. 30 to Nov. 8, 2018
Geospatial Information Agency (BIG)
Headquarters
BPBD Gorontalo Provincial Office
BWS Sulawesi Second Office
BPBD Gorontalo Regency Office
Gorontalo City Hall
Bappeda Gorontalo City Office
First, Table 2-5 shows the list of data necessary for a “Japan-made Flood-Simulator” simulation. Table 2-6
shows the survey results on the availability of such data.
Table 2-5: List of input data to “Japan-made Flood-Simulator”
Data item Description/specifications
Map data
• NASA satellite image data (Landsat, etc.)
• DigitalGlobe satellite image data (World View, etc.)
• Aerial photographs • Commercially available map data • Other map data
Elevation data • Satellite-measured elevation data (NASA SRTM) • LiDAR-measured elevation data
River-related data
• Flood hazard map • Flood history maps • River watershed maps
• River centerline data (longitudinal river cross-section survey maps)
• Transverse river cross-section survey maps
• River flow rate analysis results • Time-series river flow rate prediction data
• Flood prediction data based on assumed embankment failure
Precipitation data • Time-series precipitation data (observation data from flow-rate monitoring stations)
River water level
data • Historical and real-time flood water level data
Land use data • Land use data generated from satellite images (USGS GLCC)
• Land use data created by Indonesian government
Data on in-river
structures
• Data on dam specifications, reservoirs, and ponds (drainage discharge volumes and
water levels)
Table 2-6: Results of fact-finding mission on existing data availability
Data item Results of fact-finding mission
Map data
Satellite images: Landsat images are open and available for free.
The National Institute of Aeronautics and Space (LAPAN) delivered Pleiades images,
Worldview images (2013-2018), and SPOT6/7 images (2017-2018) to the BNBP
Gorontalo Provincial Office.
Aerial photographs: 1:10,000 aerial photographs of Gorontalo Province taken by the BIG
in 2012. These are not made open.
Topographic maps: The BIG has been developing 1:5,000 topographic maps of urban
areas since 2015. The target area of this project falls outside of the coverage of these maps.
The 1:50,000 topographic maps prepared by the BIG are available for download and use
free of charge from the BIG portal site (http://tanahair.indonesia.go.id/portal-web).
The BIG has also been developing 1:25,000 topographic maps, the data of which are not
made open and are limited for use within government agencies only.
Elevation data Satellite data: SRTM data are open and available for free.

12
LiDAR data: There are no existing measurement data covering the target area of this study
project.
River-related data
Hazard map: Flood hazard maps prepared by the BPBD. With their parameters and
specifications kept confidential, no judgment can be made as to their practical usability.
Flood history maps: Historical records do exist but not in the form of maps.
River watershed maps: The 1:50,000-scale shapefiles prepared in 2017 by BWSS2 are
open and available for use. There are shapefiles covering the Limboto-Bolango-Bone, the
Paguyaman, and the Landangan river basin.
River centerline (longitudinal and transverse cross-section) data: There are longitudinal
and transverse cross-sections prepared in 2007 by BWSS2. Data are available by
submission of a formal request for use.
Other river data seem to be included in reports prepared by BWSS2.
Precipitation data Monitored and recorded by the BMKG.
River water level
data
Made open in reports prepared by BWSS2. These reports contain water level, flow rate,
and precipitation data from monitoring stations installed along major rivers. BWSS2
annual reports have been prepared since 2002.
Land use data
USGS GLCC: Open and available for free.
Land use maps: Prepared as part of spatial planning at national, provincial, and regency
levels. The responsible agencies are Bappenas and Bappeda. Not made open in the form
of digital data.
Data on in-river
structures Prepared and maintained by BWSS2. Available by submission of a formal request for use.
The results of the fact-finding mission revealed that many of the input data to “Japan-made Flood-Simulator”
are absent in the existing digital datasets. Data absent in the existing digital datasets may be newly created.
In Gorontalo Province, we ran a demonstrative simulation that reproduced the cases of the flood disasters
that hit the Province of Gorontalo in 2013 and 2016. During our first and second stays, we locally collected the
data necessary for the reproduction. Table 2-7 shows the list of collected data.
Table 2-7: List of locally collected data
Description Collected by
River/embankment cross-sections of Bone river, Bolango river and Limboto lake basin BWSSII
Daily precipitations and river flow rates in Bone river, Bolango river and Limboto lake basin
(for recent 10 years) BWSSII
Daily precipitation data from BMKG monitoring stations around Lake Limboto (for recent 10
years)
(i) Stasiun Meteorologi Djalaluddin Gorontalo (ii) Stasiun Geofisika Gorontalo
(iii) Stasiun Klimatologi Tilongkabila Bone Bolango
BMKG
Gorontalo City flood hazard maps (inundation-prone area maps) BMKG
Gorontalo Regency flood hazard maps (inundation-prone area maps) BPBD
(ii) Simulation results and evaluation
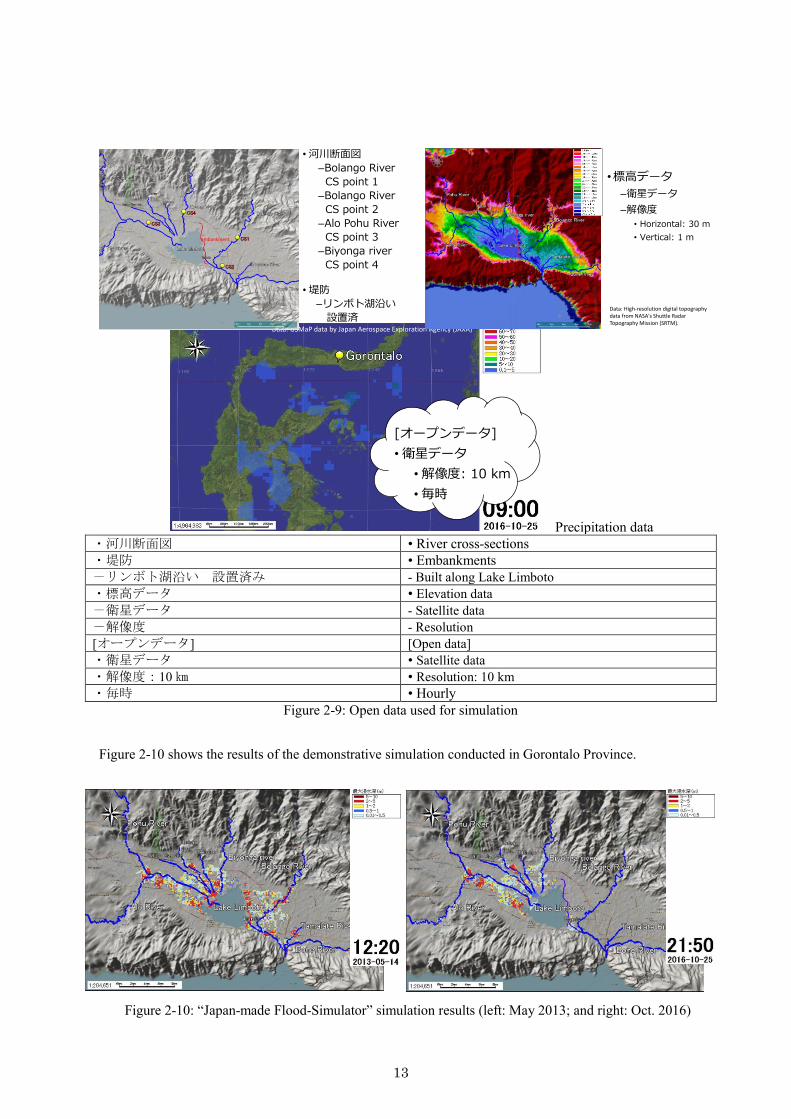
The obtained data were entered into “Japan-made Flood-Simulator” to simulate the cases of flood disasters
that hit the Province of Gorontalo in 2013 and 2016.
Figure 2-9 shows the details of the data used for the simulation.
13
Rivers
Elevations
Precipitation data
・河川断面図 • River cross-sections
・堤防 • Embankments
-リンボト湖沿い 設置済み - Built along Lake Limboto
・標高データ • Elevation data
-衛星データ - Satellite data
-解像度 - Resolution
[オープンデータ] [Open data]
・衛星データ • Satellite data
・解像度:10 ㎞ • Resolution: 10 km
・毎時 • Hourly
Figure 2-9: Open data used for simulation
Figure 2-10 shows the results of the demonstrative simulation conducted in Gorontalo Province.
Figure 2-10: “Japan-made Flood-Simulator” simulation results (left: May 2013; and right: Oct. 2016)
[オープンデータ]
•衛星データ
•解像度: 10 km
•毎時
Data: GSMaP data by Japan Aerospace Exploration Agency (JAXA)
•標高データ
–衛星データ
–解像度
• Horizontal: 30 m
• Vertical: 1 m
Data: High-resolution digital topography data from NASA's Shuttle Radar Topography Mission (SRTM).
•河川断面図
–Bolango River
CS point 1
–Bolango River
CS point 2
–Alo Pohu River
CS point 3
–Biyonga river
CS point 4
•堤防
–リンボト湖沿い
設置済
embankment

14
The primary objective of this demonstration was not simply to obtain high-accuracy simulation results but to
show the usefulness of the software by running simulations using open data, along with transverse data collected
from available sources, without the need for purchasing high-accuracy DEM data.
The simulation results were reviewed by the person in charge on the Indonesian side. The simulator was
highly valued for easy operation, high understandability of the graphic outputs it can generate, and high speed
that reduces the time required for the completion of a simulation.
There were no detailed precipitation data (time-series data), river cross-sections, or inundation area maps
available for this study project. Nevertheless, we consider that the sampling verification results obtained from
four locations, for each of which we conducted a hearing, are valid as far as inundation depths are concerned,
when considering that the historical flood marks and the simulation results showed minor differences ranging
from 0.3 to 0.65 meters (topographic accuracy/error of 1.0 m) as in Figure 2-11. If the differences fall within
the range observed in our demonstrative verification, the simulator will be sufficiently effective for identifying
inundation risks (hazard map development).
For the purpose of early flood warning, the simulator must be also evaluated in terms of river level prediction
accuracy. Accordingly, detailed time-series precipitation data, topographic data, and river data must be loaded
and verified.
過去の洪水痕 Historical flood marks
比較検証 Comparative verification
シミュレーション結果 Simulation results
Figure 2-11: “Japan-made Flood-Simulator” simulation results evaluation
(3) Weather radar-related
(i) Current status of weather radar deployment in Indonesia
Figure 2-12 shows the status (as of January 2018) of the Indonesian weather radar network deployed by the
BMKG. There are 37 C-band radars (coverage radius: 150 km) deployed along with 4 X-band radars (ditto: 60
km). In the northern part of Sulawesi Island, where Gorontalo Province is situated, the C-band radars installed
in Gorontalo and Manado are already in operation for weather monitoring.
Table 2-8 quotes the allocation status of the main frequency bands used for weather radars from the
“Indonesian Table of Frequency Allocation (2003).”2 As of November 2016, Indonesia allocates the 5,540-
5,640-MHz band to 5-cm (C-band) weather radars and the 9,500-MHz band to 3-cm (X-band) weather radars.
2http://kambing.ui.ac.id/onnopurbo/orari-diklat/pemula/teknik/bandplan/CUPLIKAN%20TABEL%20FRQ.PDF
過去の洪水痕 シミュレーション結果
FL1 Ilotidia villageSimulation: 1-2 mHistorical : 1.7 m
比較検証
FL2 Tualango villageSimulation: 1-2 mHistorical : 1.35 m
FL3 Detafu villageSimulation: 0.5-1 mHistorical : 0.62 m
FL4 Limboto villageSimulation: 0.5-1 mHistorical : 0.79 m

15
Figure 2-12: Indonesian weather radar network (as of January 2018: coverage radius = 60 km)
(Source: BMKG’s presentation shown at 2018 WMO Regional Conference in RA II (Asia))
Table 2-8: International and Indonesian allocations of frequency bands (MHz)
International allocation Indonesian allocation
Region 1 Region 2 Region 3
5,570-5,650 MHz
Mobile (except aeronautical mobile): 5.446A 5.450A
Radiolocation: 5.450B
Maritime radionavigation:
5.450 5.451 5.452
5,470-5,650MHz
Mobile (except aeronautical mobile): 5.446A
5.450A
Radiolocation: 5.450B
Maritime radionavigation:
5.450 5.451 5.452
9,500-9,800 MHz
Earth exploration-satellite (active)
Radiolocation
Radionavigation
Space research (active)
5.476A
9,500-9,800MHz
Earth exploration-satellite (active)
Radiolocation
Radionavigation
Space research (active)
5.476A
(ii) Fact-finding mission on weather radar deployment in Gorontalo
<First fact-finding mission (Aug. 2018)>
We visited the BMKG Gorontalo Weather Monitoring Office (Stasiun Meteorologi Djalaluddin Gorontalo)
and the BMKG Gorontalo Earthquake Monitoring Office (Stasiun Geofisika Gorontalo) for hearings on the use
of weather radars (Photo 2-1).
The Gorontalo C-band radar is installed on the premises of Stasiun Geofisika Gorontalo, north east to Lake
Limboto. This is a relatively new radar put into operation in January 2012. The radar observation tower is a
four-storey building topped with a radome (radar antenna) at an elevation of 76 m. The third floor
accommodates the machine monitoring room.

16
The observation scheme is such that the radar is operated at 9 elevation angles in 10-minute cycles (0.5°→
1.45°→2.4°→3.35°→4.3°→6.0°→9.9°→14.6°→19.5°→0.5°).
This radar is used for weather warning (Severe Weather Warning, issued 2 hours before danger arises) and
also for air traffic control at Gorontalo Airport. The data transmitted from this radar are received at the BMKG
Jakarta Headquarters and combined there with data from other weather radars to make weather predictions
based on the numerical model WRF.
According to the radar site personnel, noises sometimes occur due to radio wave interference in the waters
south-south-east of the radar site but do not become so intense as to affect inland precipitation monitoring or
weather warning issuance.
Photo 2-1: Gorontalo weather radar observation tower (upper left); Area near Lake Limboto as viewed from
observation tower (upper right); radar control machine on 3rd floor of radar observation tower (bottom left); and
radar monitor screen (bottom right)
<Second fact-finding mission (Sept. to Oct. 2018)>
We conducted an on-site survey to qualitatively evaluate 10 locations in Gorontalo Regency in terms of
visibility, site space, road conditions, power supply conditions, and telecommunications conditions. Figure 2-
13 shows the locations of the candidate sites. Table 2-9 shows the itemized evaluation scores on the proposed
introduction of X-band radars.
Located at an elevation of 600 meters in the southern part of Gorontalo Regency and overlooking Gorontalo
Airport and Lake Limboto, the mountain plateaus (Site No.9 Hepu and Site No.10 Bolongga) are the perfect
locations for monitoring rain clouds. These sites, however, have the drawbacks of power supply unavailability,

17
poor road conditions, and poor telecommunications access. Hence, we found it difficult to install new X-band
radars in these locations. During the hearing with the BMKG, it turned out that when they considered installing
C-band radars in 2011, they excluded the very same mountainous sites from the list of candidate installation
sites without conducting an on-site survey. Therefore, the X-band radars should basically be installed on flat-
ground sites with easy access to electric power and telecommunications, even if some radio wave interference
occurs due to the surrounding mountains, and should preferably be installed at the following sites:
• Case of introducing one radar: No.4 Limehe Barat (between Airport and Lake Limboto)
• Case of introducing two radars: No.1 Mulyonegoro (west to Airport) and No.7 Kota Gorontalo (Maqna Hotel)
Figure 2-13: Names and locations of candidate radar sites
Gorontalo Airport Radar site

18
Table 2-9: Itemized evaluation scores on the proposed introduction of X-band radars
No. Site name Elevation
(m)
LOS
availability
Site
space
Road
situation
Power
supply
situation
Telecom
situation Evaluation
1 Mulyonegoro 181 〇 〇 〇 〇 〇 〇
2 Reksonegoro 44 △ ◎ ◎ 〇 〇 △
3 Molopatodu 108 △ 〇 △ 〇 〇 △
4 Limehe Barat 15 〇 〇 ◎ 〇 〇 〇
5 Ilomangga 13 △ ◎ ◎ 〇 〇 △
6 Tomulabutao 15 〇 △ △ 〇 〇 △
7 Kota Gorontalo 8 〇 ◎ ◎ 〇 〇 〇
8 Tanggilingo 19 △ △ 〇 〇 〇 △
9 Hepu 598 ◎ △ × × × △
10 Bolongga 602 ◎ 〇 × × × △
◎ = Excellent; 〇 = Good; △ = Inferior; × = Poor
(4) Past flood situation
We investigated past flood situations as shown in Figure 2-13.
The investigation results boil down to the following two points:
✓ The past floods experienced at the three locations around Lake Limboto were of types accompanied
by a slow increase/decrease in water level. The maximum flood water levels observed in 2016 were
1.7 m at Ilotidea (F1), 1.35 m at Tualango (F2), and 0.8 m at Kayubulan (F4). The results of this
investigation were used to adjust and correct the flood simulator.
✓ It was ascertained that the flood experienced near the airport and near the confluence of Alo and
Mokaraf Rivers had been of a different type characterized by a high flow velocity. The maximum
flood water level observed also in 2016 was 0.6 m at Datafu (F3). Notably, the flow velocity was 1 m
per second or more.
(5) River improvement status (flow rate data collection covering lake water and irrigation)
We investigated the current status of flood control measures and river improvements as shown in Figure 2-
14.
The investigation results boil down to the following three points:
✓ In accordance with the countermeasure work plan based on, among other things, JICA Master Plan
Study on Flood Control Measures, the countermeasure works have been completed for the most part
(P2 to P5) with some sections still under construction. The construction of the Bolango-Limboto
Communication Canal has been aborted in the middle.
✓ The super embankment east to Lake Limboto (P6: 4-meter height increase) has been completed.
Meanwhile, the floodway downstream to the adjustment sluice gate has not been completed yet.
✓ The Tamalate Flood Interception Channel (P1) was completed in 2015, making a significant
contribution to flood mitigation in Gorontalo City.

19
Figure 2-14: Past flood situations / locations of river improvement status survey points
(6) Hosting local workshop and seminar at Gorontalo province
Local workshop has been held in the 3rd fact-finding mission as shown in Table 2-10 and Photo 2-2. Moreover,
by the request from Gorontalo province, additional presentation has been conducted local seminar in the next
day hosted by Gorontalo province as shown in Table 2-11 and Photo 2-3.
Table 2-10: Outline of local workshop
Item Outline
Venue and time Gorontalo provincial government hall, 23rd-Nov-2018
Paeticipants
Gorontalo provincial governor, personnel concerned with disaster prevention in Gorontalo
province, representative of BPBD in Gorontalo city, personnel concerned with university
and university students (about 100 person)
Contents
Results report of feasibility study project
1) Feasibility Study on Adaptation Program Against flood with Introduction of Flood
Simulator and Weather Radar Systems in Gorontalo District : Japan Weather Association
2) Japan-made Flood-Simulator/Flood -Save the nation from flood by ICT- : Hitachi, Ltd.
3) Progress report of REDD+ project : Kanematsu Corporation
Questions and
comments
(Gorontalo province)
Budget for the installation of weather radar and flood simurator should be managed with
Japan government’s cooperation.
(Dr. Nelson, governor of Gorontalo province)
How Japan government can contribute when Indonesian local government could cover
some costs for the installation?
(Student of Gorontalo university)
How long should rainfall input data be needed when flood simurator is used for real time
operation of early warning?
How do we tune flood simurator software for improving the accuracy of flood
prediction?

20
Photo 2-2: Local workshop
Table 2-11: Outline of local seminar
Item Outline
Venue and time Pentadio (outside stage), 24th-Nov-2018
Paeticipants
Gorontalo state vice governor, Gorontalo provincial governor, personnel concerned with
disaster prevention in Gorontalo state, personnel concerned with university and university
students (about 200 person)
Contents
【AM】
1) Action of the information propagation for the disaster mitigation : BNPB
2) Mechanism of Earthquake, Tsunami and liquefaction in Indonesia : Bandung Institute of
Technology
3) Environmental destruction issue and conservation activities at the Lake Limboto :
Gajamada university
4) Effort for the female-centric community formation of disaster prevention such as river
maintenance : Gorontalo university
【PM】
5) Japan’s experience of past major disasters, information for the disaster prevention and
latest study of Tsunami detection : Japan Weather Association
6) Introduction of Flood simurator “Japan-made Flood-Simulator” and demonstration of
Tsunami prediction in the Gorontalo city : Hitachi, Ltd.
7) Risk assessment in Banda-aceh before and after 2004 Sumatra huge tsunami disaster :
Pasco, Ltd.
Photo 2-3: Local seminar

21
(7) Results of discussions held in Jakarta with the Japanese Embassy, the BMKG, and the BNPB
The following are the results of our survey activities in Jakarta, including visits to central government
agencies:
✓ Through the activities in Jakarta, we obtained some tips on building connections with government
officials above the working level and with sponsor countries. We also found the future direction of
the sales promotion activities for the introduction of disaster control infrastructure. It would be
effective to deploy activities in candidate localities, to win the understanding of the relevant provincial
government, and to lobby the central government.
✓ Our visit to the BMKG revealed that the series of disasters during last year prompted the BMKG to
adopt a policy for promoting rapid enhancement of equipment and organizations for monitoring,
forecasting, and warning meteorologically or otherwise dangerous phenomena (it is unknown to us
whether funds from aid agencies are available to the BMKG). More specifically, it turned out that PT
SUCOFINDO (state-operated comprehensive inspection company) will be deeply involved from the
enhancement planning phase through the equipment introduction phase. During the visit for this study
project, we contacted both parties and expect that there will be some headway made.
✓ Our visit to the BNPB revealed that monitoring, forecasting, and warning are the responsibilities of
the BMKG while disaster prevention education activities, which are ex-ante activities, and disaster
response operations, which are ex-post activities, are the main tasks of the BNPB. Hence, it became
clear that the forecasting/warning technology based on coordinated operations of Japan-made Flood-
Simulator and radars is intended for the BMKG. On the other hand, it was confirmed that Japan-made
Flood-Simulator is useful for improving hazard maps for disaster reduction, developing disaster
preparedness plans, and making disaster predictions based on analyses of past data. Therefore, we
decided to continue detailed consideration of the installation site and the content of the proposal to
the BNPB.
✓ Our visit to the Japanese Embassy revealed that JICA stands a slim chance in joining the scheme for
emergency support in Palu. Meanwhile, it seems in line with the intention of the Japanese government
to help the operator entity develop its capacity through a technical cooperation project for long-term
capacity development.
(8) Results of activities at COP24
To publicize the achievements of this study project to countries around the world, Kanematsu Corporation
together with Dr. Nelson, the Governor of Gorontalo Regency, attended the 24th Conference of the Parties to
the United Nations Framework Convention on Climate Change (COP24). During the event, Kanematsu and the
Regency Governor delivered a total of four presentations on this study project at the Indonesian and Japanese
Pavilions. Additionally, Kanematsu efficiently interviewed, among others, government officials and key persons
of both Indonesia and Japan, participants from the GCF and other financial institutions, and those from NGOs
and had discussions with them towards the formulation of this project.
The results of interviews with the Indonesian government officials (Dr. Nur, Special Advisor to the Minister
of Environment and Forestry, Ms. Emma, Director of the Bureau of Climate Change, as well as Mr. Dudi
Rulliadi, Deputy Director for International Climate Finance Division, Center for Climate Finance and

22
Multilateral Policy, Fiscal Policy Agency, Ministry of Finance [MoF]) boil down to the following three points:
✓ Visit both Ministries jointly with Gobel Group and lay the groundwork for the proposal to be
presented to the GCF
✓ Explain the project to the Ministry of Environment and Forestry (MoEF), which is the “Focal Point”
of the proposal to the GCF, and persuade the MoEF to recommend the proposal to the GCF to the
MoF.
✓ Explain the project to the MoF and sound out the MoF about the issuance of “No-objection Letter,”
which is necessary for submission of a “Funding Proposal” to the GCF.

23
3. Consideration of the content and technical aspects of the project
3-1. Background, necessity, etc., of the project
(1) Background of the project
With the recent increase in occurrences of flood disasters around the world including Asian countries,
Indonesian provincial governments are urgently required to introduce an infrastructure system for developing
disaster plans on the basis of theoretical databases and to develop disaster planners from among working-level
officials.
Typical impacts of climate change in Indonesia include increased sea water levels, increased sea surface water
temperatures, and changes in rainfall patterns. Adaptive challenges resulting from these include, among other
things: increases in floods/extreme weather phenomena; ecosystem destruction; and storm surge-induced or
otherwise induced damage to economy, livelihood, ecosystem, and special areas. The Province of Gorontalo
suffers frequent droughts induced by climate changes such as El Niño. Another problem associated with the
Province is landslide and flood disasters that result from reduced ecosystem function due to deforestation for
slash-and-burn agriculture.
Accordingly, this study project proposed that Gorontalo Provincial and Regency Governments should
introduce an infrastructure system (flood simulator and weather radars) as a platform that supports the
governments and all those involved in provincial- and regency-level flood disaster risk management.
(2) Necessity of the project
Gorontalo Province is hit by three or more large-scale floods per year (Photo 3-1) and suffers damage on its
society and economy. In Gorontalo Province, agriculture is a major industry and its expansion is causing more
and more deforestation. This causes forest top soil to erode into rivers and settle on the bottom of Lake Limboto.
Now with diminishing water depths, it is feared that Lake Limboto may disappear. In addition to this, localized
heavy rains induced by climate change adversely contribute to the increasingly frequent occurrences of floods
in Gorontalo Province. In the drainage basins in the target region of this study project, there is rainfall
throughout the year with precipitation peaking in the period from April to June. Thus, Limboto, Bone, and
Bolango Rivers flood nearly every year, causing long-term inundation in urban areas and farm lands (The Study
on Flood Control and Water Management in Limboto-Bolango-Bone Basin in the Republic of Indonesia, Japan
International Cooperation Agency (JICA), Dec. 2002). Although reinforcement works, including emergency
countermeasures, were completed in 2017, specific details still remain unknown to us. Meanwhile, there has
been little progress in the development of a countermeasure planning and implementation framework towards
flood disaster mitigation. Hence, damage amounts and other evaluation data still remain obscure.

24
Photo 3-1: Flood disaster in Gorontalo
(Source: AKSI CEPAT TANGGAP “1,500 Houses Affected by Gorontalo Flood” 2017)
The disaster prevention infrastructure system considered for introduction by this study project with the above
circumstances in mind collects real-time precipitation data from its “weather radars” and loads these data to
“Japan-made Flood-Simulator” to run flood simulations, thereby allowing implementation of ex-ante disaster
prevention measures and helping to minimize damage to the provincial society and economy.
Moreover, the above system can contribute to improving the Disaster Risk Index set by the Indonesian
government. This index is used to evaluate local government-level efforts in disaster risk management and
disaster prevention. This index will be improved when local governments promote disaster prevention efforts
hand-in-hand with residents and academicians as practiced in Japan as part of the Regional Adaptation
Consortium Project.3
If this disaster prevention infrastructure system is introduced in the future, training will be provided for
system operation and hazard map development, whereby the disaster preparedness and response capabilities of
Gorontalo Regency government will be enhanced. Then, collaborative use of the disaster prevention
infrastructure system between the Provincial and Regency governments will help improve the disaster risk index
for Gorontalo Province, thereby leading to reduction or mitigation of natural disaster damage (human lives,
properties, etc.).
As stated in the “Infrastructure System Export Strategy4 ” formulated by the Japanese government, the
introduction of the “Japan-made Flood-Simulator” flood simulator will lead to that of weather radars, thereby
producing a complex ripple effect of infrastructure system export. This will trigger the transfer of advanced
Japanese technology, know-how, systems, and so on to emerging economies, thereby contributing to solving
global-scale issues such as environmental protection and disaster prevention in counterpart countries.
3-2. Basic guidelines, decisions, etc., on the content of the project
On the basis of the study results, the following basic guidelines and a disaster prevention infrastructure
introduction plan (Table 3-1) based thereon were established to study the financial/economic feasibility and cost-
effectiveness of the project.
3 http://www.adaptation-platform.nies.go.jp/lets/conso/index.html 4 http://www.kantei.go.jp/jp/singi/keikyou/dai4/kettei.pdf
25
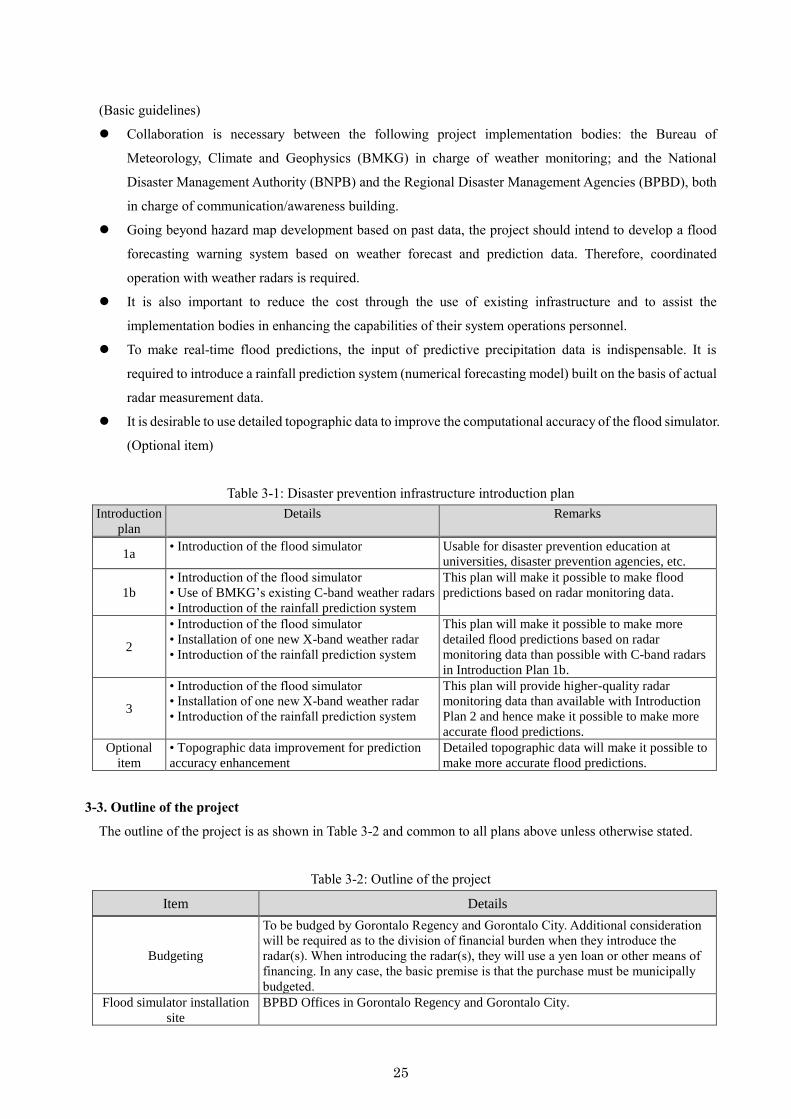
(Basic guidelines)
⚫ Collaboration is necessary between the following project implementation bodies: the Bureau of
Meteorology, Climate and Geophysics (BMKG) in charge of weather monitoring; and the National
Disaster Management Authority (BNPB) and the Regional Disaster Management Agencies (BPBD), both
in charge of communication/awareness building.
⚫ Going beyond hazard map development based on past data, the project should intend to develop a flood
forecasting warning system based on weather forecast and prediction data. Therefore, coordinated
operation with weather radars is required.
⚫ It is also important to reduce the cost through the use of existing infrastructure and to assist the
implementation bodies in enhancing the capabilities of their system operations personnel.
⚫ To make real-time flood predictions, the input of predictive precipitation data is indispensable. It is
required to introduce a rainfall prediction system (numerical forecasting model) built on the basis of actual
radar measurement data.
⚫ It is desirable to use detailed topographic data to improve the computational accuracy of the flood simulator.
(Optional item)
Table 3-1: Disaster prevention infrastructure introduction plan
Introduction
plan
Details Remarks
1a • Introduction of the flood simulator Usable for disaster prevention education at
universities, disaster prevention agencies, etc.
1b
• Introduction of the flood simulator
• Use of BMKG’s existing C-band weather radars
• Introduction of the rainfall prediction system
This plan will make it possible to make flood
predictions based on radar monitoring data.
2
• Introduction of the flood simulator
• Installation of one new X-band weather radar
• Introduction of the rainfall prediction system
This plan will make it possible to make more
detailed flood predictions based on radar
monitoring data than possible with C-band radars
in Introduction Plan 1b.
3
• Introduction of the flood simulator
• Installation of one new X-band weather radar
• Introduction of the rainfall prediction system
This plan will provide higher-quality radar
monitoring data than available with Introduction
Plan 2 and hence make it possible to make more
accurate flood predictions.
Optional
item
• Topographic data improvement for prediction
accuracy enhancement
Detailed topographic data will make it possible to
make more accurate flood predictions.
3-3. Outline of the project
The outline of the project is as shown in Table 3-2 and common to all plans above unless otherwise stated.
Table 3-2: Outline of the project
Item Details
Budgeting
To be budged by Gorontalo Regency and Gorontalo City. Additional consideration
will be required as to the division of financial burden when they introduce the
radar(s). When introducing the radar(s), they will use a yen loan or other means of
financing. In any case, the basic premise is that the purchase must be municipally
budgeted.
Flood simulator installation
site
BPBD Offices in Gorontalo Regency and Gorontalo City.

26
Installation site for radar,
server, etc.
BMKG Gorontalo Office. A system for transferring data via a data line or otherwise
from the radar to the simulator shall also be introduced.
Development of personnel
for introduced radar(s),
server, etc.
To be provided to BPBD Offices in Gorontalo Regency and Gorontalo City. The
same shall apply to BMKG Gorontalo Office if a radar is newly introduced thereto.
Hazard map
improvement/updating
The introduced simulator shall be used to improve or update the current hazard
maps to develop disaster preparedness plans. BPBD shall take initiative in public
awareness building, evacuation drills, etc.
3-4. Items required to be considered
The items required to be considered for the implementation of this project are shown below along with facts
found during this study project:
(1) Inclusion in local government budget
The discussions at the workshop and other occasions revealed that, having long been dependent on
development aid funding from foreign countries and international organizations, Indonesian local governments
are reluctant to purchase equipment with their own budget. Meanwhile, Gorontalo Province, which suffered
damage from the Palu Earthquake and tsunami, is considering its own measures through collaboration with
universities and appears positive about the project, regarding it not only as an anti-flood measure but also as a
measure for saving Lake Limboto from disappearance. Hence, we intend to stay in continuous contact with
Gorontalo Province to lead the Province into budgeting the purchase.
(2) Development of collaboration between related agencies
Both the BMKG Regional Monitoring Office and the provincial, regency, and city BPBD offices under the
National Disaster Management Authority (BNPB) are expected to operate weather radars. Nevertheless,
progress has been slow in developing an organizational framework for data sharing between the former and the
latter and cooperation therebetween in public awareness building activities. Established much later than the
BMKG, the BPBD is considered short of knowledgeable and experienced staff. Hence, the provincial and
central governments will be lobbied to ensure that the provincial government will move to develop collaboration
between the BMKG and the BPBD.
(3) Personnel development and training, etc.
The introductory training provided by the manufacturer and the distributor is far from sufficient for trainees
to achieve a skill level for making full use of the simulator and other equipment for disaster prevention activities.
Therefore, a long-term personnel development plan is necessary along with the budget therefor including the
cost of equipment maintenance by the local governments. It has turned out that the local governments currently
cannot easily afford to budget the purchase of the equipment alone. To enable continuous discussion and support,
we are considering, among other things, periodic visits by Gobel Group.
3-5. Environmental and social impacts associated with project implementation
The following were considered with respect to environmental and social impacts:
(1) Introduction of the radar(s)
Installation on a flat-ground site with easy access to electric power and telecommunications is assumed for
the case of introducing one or two X-band radars (see Section 2-3). In this case, there will be little environmental

27
impact because neither road construction nor tree-clearing for radar site preparation will be necessary. The
installation of the radar(s) and pylon(s) may make the landscape look slightly different than before to the eyes
of the residents around the candidate radar site(s). This, however, will not cause direct inconvenience to their
life. Hence, the resulting impacts on society will be slight, if any.
Another point to keep in mind is that no new environmental or social impacts will occur from the use of
BMKG-owned existing C-band radars. Accordingly, it is desirable to promote the development of a system that
allows the flood simulator to use monitoring data from the existing C-band radars.
(2) Introduction of the flood simulator
When the flood simulator is introduced, a stand-alone desktop PC (Introduction Plan 1a) or a server-type
machine (Introduction Plans 1b to 3) will be delivered to the BPBD Regency Office. There will be no new
environmental and social impacts to the outside. Nor will there be additional points to keep in mind.

28
4. Financial and economic feasibility
4-1. Project cost estimation
Tables 4-1 and 4-2 show the project costs and construction periods for the respective introduction plans.
Introduction Plan 1a proposes that the flood simulator be introduced as stand-alone equipment. This plan is
relatively inexpensive with a price tag of ¥15.4 million because no radar equipment, data server, or rainfall
prediction system is required. Moreover, the time required for introduction is as short as six months. Introduction
Plan 1b involves the introduction of a data server for weather radar data loading, a rainfall prediction system, and
other equipment. Hence, a specification change will occur, requiring the flood simulator to be converted into a
server type.
Table 4-1: Rough estimation of introduction cost for each introduction plan
Item Introduction Plan 1a Introduction Plan 1b Introduction Plan 2 Introduction Plan 3
Configuration - Flood simulator - Flood simulator
- Existing C-band radars
- Flood simulator
- One X-band radar
- Flood simulator
- Two X-band radars
Additional
infrastructure
- Flood simulator - Flood simulator
- Existing radar adjustment
software
- Data exchange server
- Rainfall prediction
system
- Flood simulator
- One X-band radar
- Data exchange server
- Rainfall prediction
system
- Flood simulator
- Two X-band radars
- Data exchange server
- Rainfall prediction
system
Project cost
¥15.4 million
<Breakdown>
- Manufacturing of
flood simulator: ¥11
million
- System design,
training, and
documents: ¥4.4
million
¥81.6 million
<Breakdown>
- Manufacturing of flood
simulator: ¥53 million
- Server and rainfall
prediction system
development: ¥22 million
- System design, training,
and documents: ¥6.6
million
¥530 million
<Breakdown>
- Manufacturing of flood
simulator: ¥53 million
- One radar introduced:
¥385 million
- Server and rainfall
prediction system
development: ¥22
million
- Radar pylon
construction, radar
control room, electrical
work, etc.: ¥22 million
- System design,
training, and
documents: ¥48 million
¥970 million
<Breakdown>
- Manufacturing of flood
simulator: ¥53 million
- One radar introduced:
¥770 million
- Server and rainfall
prediction system
development: ¥22
million
- Radar pylon
construction, radar
control room, electrical
work, etc.: ¥44 million
- System design,
training, and
documents: ¥81 million
Table 4-2: Project cost breakdown based on Infrastructure Introduction Plans (unit: ¥1,000)
Introdu
ction
plan
Total
project
cost
Flood
simulator
Radar
equipment
Data server
and rainfall
prediction
system
Civil
engineering
work cost
System design cost,
training cost,
document
preparation cost, etc.
Time required for
introduction
(incl. construction
period)
1a 15,400 11,000 - - - 4,400 6 months
1b 81,600 53,000 - 22,000 - 6,600 12 months
2 530,000 53,000 385,000 22,000 22,000 48,000 15 months
3 970,000 53,000 770,000 22,000 44,000 81,000 18 months
* Topographic data improvement cost to be separately charged
For additional information, the preparation cost of the input data to the flood simulator was estimated. As shown
in Table 4-3, three plans were considered for the input data; these plans range from one that uses low-accuracy

29
data available for free to a plan that requires high-accuracy data to be newly created in order to improve the
accuracy of simulations. As a result, the rough estimate for extra cost ranges from ¥3 million to ¥132 million as
shown in Table 4-4.
Table 4-3: Specifications for data preparation
Data item Plan 1: Spec. for existing data Plan 2: Spec. for newly prepared
data
Plan 3: Spec. for newly
prepared data
Map data
1/50,000-scale topographic
maps
50 cm-resolution ortho-photos
(equivalent to 1/10,000-scale maps)
15 cm-resolution ortho-
photos
(equivalent to 1/2,000-
scale maps)
Elevation
data
30-m mesh 5-m mesh 1-m mesh
River-related
data
Approx. 40 cross-sections for
full river reach
390 cross-sections for full river reach 781 cross-sections for full
river reach
Table 4-4: Data preparation cost (unit: ¥1,000)
Data
preparation
plan
Total extra
cost Map data Elevation data River-related data
Data
preparation
period
Plan 1 3,000
1,000
(BIG 1:50,000-scale
maps to be used)
1,000
(NASA’s SRTM to
be used)
1,000
(BWSS2’s longitudinal
and transverse cross-
section data to be used)
1 month
Plan 2 26,500
7,500
(off-the-shelf ortho-
photos to be
purchased)
2,500
(Off-the-shelf DTM
to be purchased)
16,500
(Longitudinal and cross-
sectional river surveys to
be newly performed)
8 months
Plan 3 132,000
22,000
(ortho-photos to be
newly taken)
77,000
(LiDAR survey to be
conducted)
33,000
(Longitudinal and cross-
sectional river surveys to
be newly performed)
12 months
* This table assumes the use of existing precipitation data, river water level data, land use data, and data on in-river structures.
4-2. Summary of the results of (preliminary) financial/economic analysis
On the basis of the infrastructure introduction plans presented in the last section, the cost-effectiveness of the
introduction was considered. The conclusion finds that at present, considerable difficulties are anticipated
regarding the introduction in accordance with Introduction Plan 2 or 3 because:
1) While the flood-prone population may be reduced from the current 178,614 persons to none as part of the
cost-effectiveness of the introduction, no significant monetary effects can be expected to result from
prevention of physical and economic damage.
2) The relevant local government still has a strong tendency to rely on ODA. The introduction of equipment
including the radar is difficult with the disaster preparedness budget of Gorontalo Regency.
Moreover, as observed above in 2-3(3) Weather radar-related survey results, the BMKG has already covered
nearly the whole area of Indonesia with weather radars. Hence, it would be difficult to persuade the BMKG to
spend Indonesia’s own budget to introduce new weather radars. Additionally, as revealed by the results of the fact-
finding mission, Gorontalo Province started to operate weather radars in 2012. Since then, these radars have been
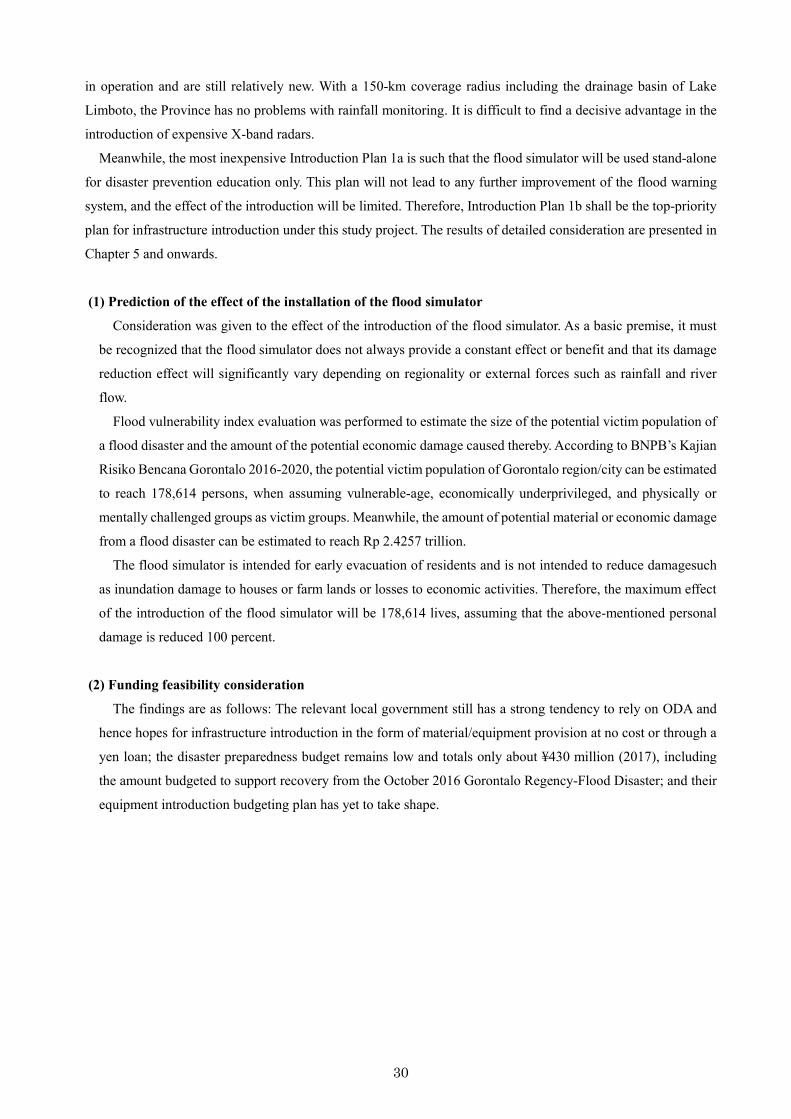
30
in operation and are still relatively new. With a 150-km coverage radius including the drainage basin of Lake
Limboto, the Province has no problems with rainfall monitoring. It is difficult to find a decisive advantage in the
introduction of expensive X-band radars.
Meanwhile, the most inexpensive Introduction Plan 1a is such that the flood simulator will be used stand-alone
for disaster prevention education only. This plan will not lead to any further improvement of the flood warning
system, and the effect of the introduction will be limited. Therefore, Introduction Plan 1b shall be the top-priority
plan for infrastructure introduction under this study project. The results of detailed consideration are presented in
Chapter 5 and onwards.
(1) Prediction of the effect of the installation of the flood simulator
Consideration was given to the effect of the introduction of the flood simulator. As a basic premise, it must
be recognized that the flood simulator does not always provide a constant effect or benefit and that its damage
reduction effect will significantly vary depending on regionality or external forces such as rainfall and river
flow.
Flood vulnerability index evaluation was performed to estimate the size of the potential victim population of
a flood disaster and the amount of the potential economic damage caused thereby. According to BNPB’s Kajian
Risiko Bencana Gorontalo 2016-2020, the potential victim population of Gorontalo region/city can be estimated
to reach 178,614 persons, when assuming vulnerable-age, economically underprivileged, and physically or
mentally challenged groups as victim groups. Meanwhile, the amount of potential material or economic damage
from a flood disaster can be estimated to reach Rp 2.4257 trillion.
The flood simulator is intended for early evacuation of residents and is not intended to reduce damagesuch
as inundation damage to houses or farm lands or losses to economic activities. Therefore, the maximum effect
of the introduction of the flood simulator will be 178,614 lives, assuming that the above-mentioned personal
damage is reduced 100 percent.
(2) Funding feasibility consideration
The findings are as follows: The relevant local government still has a strong tendency to rely on ODA and
hence hopes for infrastructure introduction in the form of material/equipment provision at no cost or through a
yen loan; the disaster preparedness budget remains low and totals only about ¥430 million (2017), including
the amount budgeted to support recovery from the October 2016 Gorontalo Regency-Flood Disaster; and their
equipment introduction budgeting plan has yet to take shape.

31
5. Project implementation schedule
In Chapter 5 onwards, focus is placed on Introduction Plan 1 as presented in 4-1. Table 5-1 shows the schedule
towards the proposal for the introduction of the flood simulator. The Japanese fact-finding mission will continue
the implementation of the project until the end of the current fiscal year. From this coming fiscal year, preferably
after the completion of the study project, a local corporation knowledgeable about the flood simulator (negotiations
underway with several candidates) should take over and start lobbying the provinces of Sulawesi Island. Proposal
activities shall be promoted so that the introduction of the flood simulator will be in view by December 2019. It
is desired that the flood simulator be wedged into the procurement budgets of the provincial governments for FY
2020 to ensure the conclusion of the contract with them.
Table 5-1: Schedule towards the proposal for the introduction of the flood simulator
Period Description
Sept. 2018
(Implemented)
Data collection and on-site surveys for the demonstration version of the flood simulator for
Gorontalo Regency
Nov. 2018
(Implemented)
Presentation of the flood simulator and demonstrative simulations of typical floods at a
workshop and a seminar (two days) in Gorontalo Regency
- Audience: Gorontalo Regency Governor, representative of Gorontalo City BPBD,
disaster management officials of the regency government, and university academics
May 2019 Proposal to Gorontalo Province for export of the flood simulator
Aug. 2019 Start of an expanded feasibility study targeting the governments of Gorontalo, Middle
Sulawesi, and South Sulawesi Provinces in the eastern part of Indonesia
Sept. to Dec.
2019
Starting proposal activities in Indonesia, such as lobbying the above-mentioned provincial
governments into wedging a flood simulator introduction budget into their budget plan

32
6. Implementation competence of the implementation agencies of the counterpart country
6-1. Profile of the implementation agencies of the counterpart country
The flood simulator is intended for introduction to Gorontalo Province. In the case of Gorontalo Province, the
Gorontalo City BPBD (municipal disaster management office) will be responsible for the actual operation of the
flood prediction system. Figure 6-1 shows disaster management organizations at different administrative levels in
Indonesia. The national-level disaster management authority is the BNPB (National Disaster Management
Agency), while regional-level disaster management authorities are the BPBD Offices. The Indonesian Disaster
Management Law requires the government of each province (Provinci), regency (Kabupaten), and city (Kota) to
establish a disaster management office at their respective administrative level.
The input flood predictions data are data provided by the BMKG (Bureau of Meteorology, Climate and
Geophysics), such as ground and radar precipitation measurements, weather predictions, and weather warnings.
The BMKG consists of a head office in Jakarta, five regional headquarters offices, 120 weather stations, 31
seismological stations, and 22 climate change observatories. In Gorontalo Province, they have a weather station,
a seismological station, and a climate change observatory.
If successfully introduced to Gorontalo Province, the simulator will be rolled out to the Middle Sulawesi and
South Sulawesi Provinces, which are also located on Sulawesi Island.
Figure 6-1: Disaster management organizations at different administrative levels in Indonesia
6-2. Organizational framework for project implementation in the counterpart country
The organizations under the BPBD are in place according to the National Disaster Management Agency
Director-General’s Directive No.3/2008 “Guidelines for Establishing Regional Disaster Management Offices.”
The organizational structure is the same at the provincial, regency, and municipal levels. In addition to the BPBD
Director and the Secretariat, there are the following three different working-level departments: (1) Department of
Preventive Measures (damage prevention and mitigation); (2) Emergency Response Department; and (3) Recovery
and Reconstruction Department. The Department of Preventive Measures is responsible for, among other things,
hazard map development, regional disaster management planning, and warning issuance and information
BMKG
Weather Warning
Information

33
dissemination to areas under its jurisdiction. This department is expected to be responsible for the actual operation
and maintenance of the flood prediction system. In the Gorontalo Provincial government, the Meteorological
Bureau (BMKG) in charge of weather radars coexists with Regional Disaster Management Offices (BPBD). In
practice, however, the former and the latter are yet to work in good coordination with each other.
6-3. Competence evaluation of the implementation agencies of the counterpart country and
countermeasures
From the results of the hearing during the fourth mission to Jakarta, it turned out that weather monitoring,
forecasting, and warnings are the responsibility of the BMKG, while disaster prevention education and disaster
response are provided by the BNPB/BPBD. This suggests that the flood prediction system may be introduced to
the respective agencies. Accordingly, this section presents the competence evaluation of the BNPB/BPBD and
BMKG and the measures to be taken.
In Indonesia, to avoid overlap among preventive measures or confusion during emergency response, regional
agencies specializing in disaster management are in place in addition to the central (national) one. In practice,
however, the BNPB, which is above the BPBD in the organizational hierarchy, has among its staff many new
personnel who are from other ministries and agencies and ill-versed in disaster management. Thus, the BNPB is
not ready and able to provide sufficient support to localities. Similarly, provincial, regency, and municipal BPBD
offices are seriously understaffed, under-budgeted, and insufficiently competent in disaster management. Naturally,
the BNPB is expected to provide continuous guidance. As stated above, however, the BNPB cannot afford to
extend support to localities. Moreover, during and after the Palu Earthquake Tsunami Disaster, which occurred in
the central region of Sulawesi Island on September 28, 2018, the central government were forced to take frontline
command. This is partly responsible for the stagnation in preventive measure activities. For the implementation
of this project, it is a matter of urgency that the BPBD, the prospective operator of the flood prediction system,
should enhance disaster preparedness, including preventive measure activities.
The BMKG can make weather predictions using numerical forecasting models. As can be seen from the
variations in monitoring data accuracy between its permanently and non-permanently manned weather stations,
the BMKG still remains unable to provide sufficient maintenance to its weather stations or proper quality control
of monitoring data. In addition, the BMKG has only a limited number of personnel capable of correctly judging
the validity of weather prediction results or the appropriateness of issuing weather watches or warnings. Regional
BMKG offices are also understaffed and under-budgeted, but at an even more severe level than the BPBD.
What we should do to grasp the opportunity for flood prediction system introduction is to lobby the Gorontalo
Provincial government into organizing a mobile disaster management team and promoting coordination between
the BMKG responsible for C-band radar operation and the BPBD responsible for warning information
dissemination. Additionally, through Gobel Group, our local counterpart, we will present the BNPB/BPBD and
the BMKG with a proposal for a capacity building program for providing flood simulator training as detailed in
Table 6-1. With hands-on access to the flood prediction system, the personnel of the respective local agencies
would become able to perform disaster prevention activities more effectively. The introduction of the state-of-the-
art technology would be effective in enhancing the motivation of the staff.

34
Table 6-1: Details of flood simulator training (BNPB/BPBD and BMKG)
No Description
BNPB HQ/
Regional
BPBD
BMKG
HQ
(1) Outline of the flood simulator ○ ○
(2) Installing the flood simulator ○ ○
(3)
Operating the flood simulator (setting the conditions for river
infrastructure such as embankment; and making a flood prediction,
using observed and predicted precipitation data as input values)
○ ○
(4) Creating a flood hazard map using the results of a flood prediction ○
(5)
Developing a river infrastructure improvement plan based on the
results of a preliminary simulation with the inclusion of river
infrastructure settings
○
(6) Developing a regional disaster preparedness plan based on the results
of a flood prediction ○
(7) Converting weather radar monitoring data or weather prediction data
into precipitation input data to flood simulator ○
(8) Issuing a flood watch or warning based on the results of a flood
prediction ○
* Introduction Plan 1a in Table 4-1 intended for BNPB HQ/Regional BPBD while Introduction Plan 1b for
BMKG HQ

35
7. Competitive advantages of Japanese enterprises in terms of technology and other aspects
7-1. International competitiveness of Japanese enterprises in project bidding (by
equipment/product/service) and probability of winning orders
(1) International competitiveness of “Japan-made Flood-Simulator”
Table 7-1 shows the results of a comparison of the flood simulator “Japan-made Flood-Simulator” with
domestic and foreign competing technologies equipped with similar functions. “Japan-made Flood-Simulator”
has the following three competitive advantages:
Table 7-1: Comparison of flood simulators (1)
1. Technology to be
proposed
“Japan-made Flood-
Simulator”
2. Competing technology
Flood-Simulator overseas-
made, A
3. Competing technology
Flood-Simulator overseas-
made, B
Image of
product/techno
logy
Year released 2006 2008 1960
Characteristics
(advantages
and
disadvantages)
Vertical integration system for
professional use, specially
designed for hazard map
development and river water
level prediction. Allows the
user to specify simulation
conditions, create hazard maps
based on diverse conditions,
and develop the resulting
maps into a river water
level/inundated area prediction
system.
Allows automatic collection of
geographic information data,
land use data, and satellite-
monitored rainfall data and their
application to calculation of
river flow rates, etc.
Vertical integration system for
professional use, specially
designed for hazard map
development and river water
level prediction. Allows the user
to specify simulation conditions,
create hazard maps based on
diverse conditions, and develop
the resulting maps into a river
water level/inundated area
prediction system.
Technological
category
Large category: water budget
software
Small category: hazard map
development and river water
level prediction
Large category: water budget
software
Small category: river water level
prediction
Large category: water budget
software
Small category: riverbed
fluctuation simulation, etc.
Price
(unit price)
Software: ¥3,000,000 and up
Annual maintenance cost:
¥150,000 and up
* Japanese domestic version
Software: ¥0
Annual maintenance cost: ¥0
Software: approx. ¥3,000,000
and up
Annual maintenance cost:
(unknown)
Table 7-1: Comparison of flood simulators (2)
5分経 15分経洪水直
(a) Highly user-friendly, allowing non-specialist users to intuitively run simulations based on various
conditions and settings;
(b) High functionality and convenience that allow high-speed computational processing and real-time
representation of prediction results in 4D-GIS; and
(c) Excellent operability and extensibility that allow organic coordination with precipitation data or
related equipment, such as river water level telemetry gauges, and seamlessly enable future
predictions of river water levels/inundated locations.

36
1. Technology to be proposed
“Japan-made Flood-Simulator”
2. Competing technology
Flood-Simulator overseas-
made, A
3. Competing technology
Flood-Simulator overseas-
made, B
Function (1)
Flood
calculation
function
Capable of 2D-flood
calculations
(Equipped with high-speed
calculation function)
No function Capable of 2D-flood
calculations
(No high-speed calculation
function)
Function (2)
Calculation
results
display
Capable of displaying results
on maps
Interfacing with other systems
such as non-commercial 2D-GIS
is required in order to display
results on maps.
Interfacing with other systems
such as commercial 2D-GIS is
required in order to display
results on maps.
Function (3)
Setting and
editing of
calculation
conditions
Allows the user to set and edit
calculation conditions on 4D-
GIS.
Allows the user to set and edit
calculation conditions on 2D-
GIS.
Interfacing with other systems
such as commercial 2D-GIS is
required in order to use on-
screen support.
Function (4)
River water
level
prediction
by coupled
simulation
Possible
Function (5)
Creation of
flooded
areas
envelopes
Possible with a one click Not supported by the software
Cost-
efficiency
Initial cost: ¥3,600,000 and up Initial cost: ¥0 Initial cost: approx. 3,000,000
and up
User-
friendliness
Usable by non-specialist users Intended for specialist users Intended for specialist users
Durability There is no wear from using the software.
Safety There is no danger resulting from use of the software.
Environment
-friendliness
Extremely low in power consumption. No environmental impact results from the use of the software.
Market
share in
Japan
No objective research data available
Overseas
market share
No objective research data available
Special
remarks
None None None
Table 7-2 shows the list of patents and awards granted to “Japan-made Flood-Simulator.”
Table 7-2: Patents and awards granted to “Japan-made Flood-Simulator”
Category Evaluation
Patents granted
Japanese patents: 4431545, 4761865, 4959346, 4979322, 5026992,
5337995, 5403726, 5531365, 5873941
US patents: 7603263, 7957945
Chinese patents: PZL200610008661.4, PZL200710089468.2
Moreover, “Japan-made Flood-Simulator” has a proven track record of introduction to flood-disaster prone
Vietnam (FY 2013 Private-Sector Technology Promotion Project for Socio-Economic Development of

37
Developing Countries - ICT-Based Sustainable Disaster Prevention/Reduction System Promotion Project,
JICA). “Japan-made Flood-Simulator” is valued as useful for improving the disaster response capabilities of
local disaster management personnel. It is considered that the current demonstrative proposal, together with the
eventual development of a disaster prevention information sharing platform as shown in Figure 7-1, is necessary
to improve the disaster preparedness of counterpart countries including Indonesia. It can be concluded that such
a platform will have an international competitive edge with the inclusion of “Japan-made Flood-Simulator” as
its core product.
情報収集元 Sources of information to be collected
気象情報 Weather information
予測雨量情報 Predicted precipitation information
実測雨量情報 Measured precipitation information
水文ステーション Hydrological stations
河川水位 River water levels
・降雨量 • Rainfall amounts
漁船 Fishing boats
漁船位置情報 Fishing vessel position information
監視カメラ映像 Surveillance camera videos
河川・洪水画像 River/flood images
住民 Residents
職員 Employees
被害、対策状況報告 Damage and response status reports
他行政機関、関係組織など Other administrative agencies, related organizations, etc.
情報連携 Information sharing
防災情報共有プラットフォーム Disaster prevention information sharing platform
電気、ガス、水道被災状況 Damage status of power, gas, and water lines
公共インフラ会社など Public utility companies, etc.
リアルタイム情報収集・表示・配信システム Real-time information collection, display, and distribution system
洪水シミュレーション Flood simulations
シミュレーション結果情報 Simulation results information
情報配信先 Information distribution destinations
災害情報 Disaster information
避難勧告 Evacuation advice

38
住民(スピーカ) Residents (speakers)
住民(スマホ) Residents (smart phones)
洪水警告通知 Flood warning notification
職員 Employees
Figure 7-1: Conceptual-image of flood simulation-based disaster information sharing platform
(2) Probability of winning orders for “Japan-made Flood-Simulator”
It is estimated that the probability of winning an order will be quite high if we continue lobbying the
Gorontalo Regency government until December 2019, and if as a result the budget for flood simulator
introduction is wedged into the Regency’s fiscal 2020 procurement budget. In addition, seeing the actual
occurrence of a severe earthquake and tsunami damage to Palu in Middle Sulawesi Province, and currently, the
governments of the provinces in Sulawesi Island are strongly interested in disaster management. Hence, Japan’s
experience in the field of disaster management may improve the chance of system sales compared to other
donor countries.
From now on, we intend to start a strong promotional campaign targeting the governments of Gorontalo
and South Sulawesi Provinces neighboring Middle Sulawesi Province on the superiority of Japanese disaster
management technology so that we will stand a better chance of winning orders for “Japan-made Flood-
Simulator.”
7-2. Descriptions and prices of the main materials and equipment expected to be procured from Japan
The assumption is that all materials and equipment necessary for the implementation of the project will be
procured from Japan. Table 7-3 shows the descriptions and prices of the main materials and equipment expected
to be procured from Japan according to Introduction Plan 1. Similarly, Table 7-4 shows the descriptions and prices
of the flood simulator-related items included in Introduction Plan 1b, whose rainfall prediction system-related
portions appear in Table 7-5.
Table 7-3: Main materials, equipment and prices expected to be procured from Japan according to Introduction
Plan 1a
Item Description Cost (before tax) Remarks
Software “Japan-made Flood-Simulator” /Flood
Professional Edition ¥11,000,000
Inclusive of spec PC*
Operator training Cost of the three-day operator training to
be provided in Indonesia ¥3,400,000
Delivery to be made
through NSI
Annual maintenance Annual technical support service via e-mail
(Approx. 20 times per year) ¥1,000,000
* OS - Microsoft® Windows® 7, 8.1, or 10, 64-bit; CPU - Intel® Core™ i5 or higher compatible processor (Intel® Core™ i7
recommended); Memory - 2 GB or more; HDD -100 GB or more free space; Graphics memory - 128 MB or more recommended;
USB terminal - 1 or 2 USB ports required for license key validation
Note: The models of the relevant rivers are not included. If these must be delivered, their development must be ordered at separate
cost.

39
Table 7-4: Main materials, equipment and prices expected to be procured from Japan according to Introduction
Plan 1b
Item Description Cost (before tax) Remarks
Hardware Server × 2 units ¥4,700,000 One for backup in
case of failure NAS × 2 units ¥400,000
Client × 1 unit ¥250,000
UPS ¥300,000
Rack-related ¥757,000
Peripheral devices (HUB, etc.) ¥30,000
Software “Japan-made Flood-Simulator” /Flood
Enterprise Edition ¥17,000,000
Client software ¥2,500,000 For results display
Model
development
(*1)
Bolango River, Bone River, Alo River,
etc.
¥8,000,000
SE cost Server construction,
on-site commissioning, and
system adjustments (data collection) ¥15,570,000
Sundry
expenses
Transportation costs, travel costs, and
administrative costs ¥3,500,000
Annual
maintenance
(*2)
Annual technical support service via e-mail
(Approx. 20 times per year)
¥2,000,000
Delivery to be
made through NSI
* 1: For detailed information on the hardware, see the list of hardware separately attached.
* 2: The period of the system operation and maintenance contract is one year.
Table 7-5: Main materials, equipment and prices expected to be procured from Japan according to Introduction
Plan 1b (rainfall prediction system-related)
Item Description Cost (before
tax)
Remarks
Hardware
Server for radar data processing × 1 unit (*1) ¥500,000
Server for numerical rainfall prediction × 1 unit (*1) ¥500,000
System
construction
Radar data conversion system ¥9,000,000 Creation of input
data to flood
simulator rainfall prediction system ¥9,000,000
SE cost Network construction and on-site system adjustment ¥2,000,000
Sundry
expenses
Transportation costs, travel costs, and administrative
costs ¥1,000,000
* 1: Tower type, Linux OS, Xeon 6 core or higher, and HDD free space of 3 TB

40
7-3. Measures necessary to help Japanese enterprises to win orders
As was seen in the 60th diplomatic relations establishment anniversary held in 2017, Panasonic and Gobel
Group play a large role in the Japan-Indonesia relationship. Therefore, an effective infrastructure introduction
scheme would be one coordinated through Mr. Rachmat Gobel, the Chairman of the Gobel Group, or through
economic and political circles associated with him. Incidentally, the flood simulator was recommended for the
first time to Gorontalo Province, home to Mr. Gobel. It should be noted, however, that Indonesia has long been
receiving ODA, World Bank’s funds, etc., to promote its infrastructure improvement; and there are many asking
about the possibility of introduction through ODA of Government of Japan. To help secure orders, the provincial
government must be lobbied, with cooperation from Mr. Gobel, to consider introducing a disaster prevention
system based on BMKG-BPBD collaboration, and proposal activities will be continued to ensure budget allocation
for that system.
Furthermore, focus should not be placed exclusively on simulator-based flood disaster mitigation. Other disaster
management components should also be included in the package to cover earthquakes, tsunamis, volcanic
eruptions, and so on. It will be important to form a Team Japan and make joint efforts to export technologically-
driven disaster management infrastructure in collaboration with JICA, the lead player in the Palu Emergency
Support Scheme.
Also considered effective is lobbying the Regency Governor, the final decision-maker on the purchase, jointly
with the Japanese Embassy, JICA Indonesia Office, and MITI’s staff stationed in Indonesia. Considering the
schedule and budget, it is difficult to make frequent visits to Sulawesi. Therefore, it is planned to keep visiting the
Regency Governor, with cooperation from Gobel Group, at an approximate frequency of once every two to three
months.

41
8. Prospects of fund procurement for the project
8-1. Views of the counterpart country’s government and agencies on fund procurement
As shown in Table 8-1, three methods of fund procurement are under consideration for the implementation of
this project.
As stated in 4-2(2), the likelihood of approval of a yen loan request can be judged low because the loan amount
to be requested will be too small unless the introduction plan includes radars or unless more than one simulator is
introduced at the same time.
Table 8-1: Prospective sources of fund procurement
Item Name of fund Name of
government/agency
Descriptions
Fund 1 Gorontalo Regency
government budget
Gorontalo Regency Gorontalo Regency’s budget (APBD II)
Fund 2
Green Climate Fund (GCF) GCF International fund for supporting the efforts
of developing countries to prevent, reduce,
or absorb (alleviate) GHG emissions and
adapt to climate change effects
Fund 3
Project or Programme
Funding from the
Adaptation Fund
The Adaptation
Fund (AF)
Funding provided to projects or programs
for supporting adaptation of vulnerable
communities in developing countries to
climate change
Option
Project for Supporting the
Development and
Implementation of
Reconstruction Plans for
Middle Sulawesi Province,
Indonesia
JICA JICA technical cooperation project for
developing various reconstruction plans and
supporting their implementation according
to the Basic Reconstruction Plan developed
jointly with the Indonesian Ministry of
National Development Planning
(BAPPENAS)
8-2. Movements of related agencies with regards to fund procurement
Through this study project, discussions are underway with Gorontalo Regency Governor and other interested
parties regarding how to procure funding in the form of Fund 1 “Gorontalo Regency government budget.” We are
aiming to win budget allocation from the Regency’s fiscal 2020 budget.
The total amount of declared donations from developed and developing countries (a total of 43 countries) to
Fund 2 “Green Climate Fund (GCF)” is approximately US$ 10.3 billion, which includes US$ 1.5 billion (approx.
¥154 billion) from Japan. So far, the GCF has granted US$ 1.63 billion to support 93 projects (as of January 2019).
Projects are classified by size into the following four levels: micro-scale projects with a total project cost of US$ 10
million or less; small-scale projects with a total project cost of between US$ 10 and 50 million; medium-scale
projects with a total project cost of between US$ 50 and 250 million; and large-scale projects with a total project

42
cost of over US$ 250 million. If GCF money is made available, our project will be able to introduce C-band radars
as well.
国家指定期間 national designated agency
コーディネート coordinate
監督 supervise
理事会 administrative board
事務局 secretariat
申請 application
資金 fund
ダイレクト・アクセス機関 direct access institute
国際アクセス機関 international access institute
案件形成 project forming
贈与/融資/保証/出資 bestowal/loan/guarantee/financial contribution
プロジェクト/プログラム project/program
民間セクター&その他関係機関 private sector & other concerned institute
Figure 8-1: Overview of the utilization of GCF funding
Source: MoE “About the Green Climate Fund” (https://www.env.go.jp/earth/ondanka/gcf.html)
Fund 3 “Project or Programme Funding from the Adaptation Fund” is a scheme recommended from the
Indonesian side during this study project. The Adaptation Fund provides financial support for projects or programs
for supporting adaptation of vulnerable communities in developing countries to climate change. Since 2010, the
Adaptation Fund has provided US$ 532 million to 80 adaptation projects (as of February 2019). The Adaptation
Fund is financed with contributions from governmental and private-sector donors and with a 2-percent share of
proceeds from the clean development mechanism (CDM) project activities. The eligible areas of adaptation
projects are as follows: agricultural and coastal land management; disaster risk reduction; food security; forestry;
interdisciplinary projects; rural and urban development; and water resources management.
We intend to ask and check with the relevant agencies about the eligibility of this project for financial support
from the Adaptation Fund.
The Option “Project for Supporting the Development and Implementation of Reconstruction Plans for Middle
Sulawesi Province, Indonesia” is a JICA technical cooperation project aiming to support the reconstruction of the
central region of Sulawesi Island, Indonesia. For this project, a dedicated consultation office was established in

43
Palu, Middle Sulawesi Province, in January 2019. Through a five-party consortium formed by Yachiyo
Engineering Co., Ltd., Oriental Consultants Global Co., Ltd., Nippon Koei Co., Ltd., Pacific Consultants Co., Ltd.,
and Pasco Corporation, this project will implement the following activities, among others: disaster risk
assessment; hazard map development; spatial plan development; disaster resilience enhancement of infrastructure
and public facilities; and livelihood rehabilitation assistance for survivors.
8-3. Prospects of project-related fund procurement, the current status of requests for yen loan, and the
likelihood of its approval
In this research project, Gorontalo Regency government has been lobbied through Gobel Group for budget
allocation. At present, however, there is no positive sign regarding Fund 1 “Gorontalo Regency government
budget.” Aiming to win budget allocation from the Regency’s fiscal 2020 budget, we intend to explore continuous
approaches in fiscal 2019 while also exploring the possibilities of winning orders for ongoing extended projects
from METI.
Preparation is underway for a cross-cutting proposal to Fund 2 “Green Climate Fund (GCF)” for funding for
the combination of the REDD+ project (alleviation) promoted by Kanematsu Corporation jointly with Gorontalo
Province and this project (adaptation). The GCF sets a “50-50 fund allocation to alleviation and adaptation” as the
target to be achieved. This makes it all the more likely that the GCF will adopt cross-cutting proposals for
alleviation-adaptation combination projects. Accordingly, this project is also combined with another into a cross-
cutting proposal to stand a better chance of winning funding.
With regards to Fund 3 “Project or Programme Funding from the Adaptation Fund,” we intend to ask and check
with the relevant agencies about the eligibility of this project for financial support from the Adaptation Fund. The
possibility of us winning funding is unknown.

44
9. Challenges and action plan towards the realization of the project
9-1. Progress in fund procurement efforts including requests for UN-GCF and yen loan
In this study project, a lobbying campaign targeting Gorontalo Regency government has been promoted through
Gobel Group as an effort to procure funding in the form of Fund 1 “Gorontalo Regency government budget.”
As an effort to procure funding in the form of Fund 2 “Green Climate Fund (GCF),” concept note preparation
is underway. The concept note is a document prepared optionally by accredited entities prior to submission of a
proposal for a project. In return for its submission to the GCF Secretariat, feedback and advice will be received.
Meanwhile, selection of an accredited entity (AE) is also underway for this project. A proposal to the GCF must
be submitted through an AE. What makes the GCF unique is that the eligibility to become an AE is not limited to
international organizations and governmental agencies but extends to private financial institutions or non-
governmental organizations (NGOs). In Japan, JICA and Tokyo Mitsubishi UFJ Bank have become AEs (as the
end of March 2018). AE selection is currently underway from two candidates, one of which is JICA while the
other is PT Sarana Multi Infrastruktur (Persero) (a.k.a.: PT SMi), an Indonesian AE.
Assuming that there continue to be open bid opportunities for Fund 3 “Project or Programme Funding from the
Adaptation Fund,” the information to be provided in the proposal is undergoing close scrutiny.
9-2. Measures expected to be necessary for future funding requests for and provision of UN-GCF, yen loan,
etc.
Aiming to win budget allocation from Fund 1 "Gorontalo Regency government budget" for fiscal 2020, we
intend to explore continuous approaches in fiscal 2019 while also exploring the possibilities of winning orders for
ongoing extended projects from METI. While doing so, departments and organizations expected to use “Japan-
made Flood-Simulator” must be identified. At the same time, capacity building of operators will also be necessary.
With regards to Fund 2 “Green Climate Fund (GCF),” AE selection and scrutiny of the content of the concept
note will be initiated upon the completion of the concept note. Along with the scrutiny, it will also be necessary
to consider the modalities of GCF funding support (Table 9-1) and specification approval for the Japanese
technologies and products discussed in this study project.
Moreover, a proposal to the GCF must be submitted with the attachment of a Non Objection Letter issued by
the national designated authority (NDA) of the project-implementing country. In the case of Indonesia, the NDA
is the Ministry of Finance. In the past, Kanematsu has received support for an REDD+ project from the Ministry
of Environment and Forestry. Exploiting this experience, we must receive support from the Ministry of
Environment and Forestry and Gobel Group in order to obtain the Non Objection Letter from the Ministry of
Finance.

45
Table 9-1: Modalities of GCF funding support
Assistance to public sector Assistance to private
sector
Grant 〇 〇
Loan aid
〇
〇 (Conditions variable
depending on project)
High-concessionality Low-concessionality
Period 40 years 20 years
Grace period 10 years 5 years
Capital repayment
rate (% of initial
principal)
(11th-20th years) 2%
(21st-40th years) 4%
(6th-20th years) 6.70%
(21st-40th years) N/A
Interest rate 0.25% 0.75%
Commitment fee 0.75% 0.75%
Guarantee 〇 (Conditions variable depending on project) 〇 (Conditions variable
depending on project)
Investment
(equity) ×
〇 (Conditions variable
depending on project)
With regards to Fund 3 “Project or Programme Funding from the Adaptation Fund,” we intend to ask and check
with the relevant agencies about the eligibility of this project for financial support from the Adaptation Fund.
During the process, necessary measures will be taken.
9-3. Specific challenges and action plan towards submission of funding requests for UN-GCF funds, yen
loans, etc.; and other issues including horizontal deployment to other countries
To procure funding in the form of Fund 1 “Gorontalo Regency government budget,” the intention of Gorontalo
Regency Governor is important in the first place. The Governor has already shown a strong interest in introducing
“Japan-made Flood-Simulator.” This is because Gorontalo Regency is frequently hit by floods, partly due to
climate change, and disaster risks are increasing, posing a threat to life in its community. So, a continuous lobbying
campaign must be mounted to have a “Japan-made Flood-Simulator” procurement budget wedged into the
Regency’s fiscal 2020 budget. Consideration should also be given to turning the introduction of “Japan-made
Flood-Simulator” into an established fact by starting basic capacity building ahead of the introduction of “Japan-
made Flood-Simulator” in order to facilitate the budgeting of its introduction.
To procure funding in the form of Fund 2 “Green Climate Fund (GCF),” the content of the concept note does
matter. Accordingly, Kanematsu Corporation intends to complete a concept note in collaboration with Gobel
Group. Its content will be explained to related parties for feedback, based on which the concept note will be
modified as necessary and then will be formally submitted to the GCF for technical evaluation.
To procure funding in the form of Fund 3 “Project or Programme Funding from the Adaptation Fund,”
information on the next bidding opportunity must be obtained as early as possible to make preparations towards

46
adoption simultaneously with preparation for application to the GCF.
With regards to the Option “Project for Supporting the Development and Implementation of Reconstruction
Plans for Middle Sulawesi Province, Indonesia,” Pasco Corporation will act as a go-between for us to approach
the Consortium and JICA about the introduction of “Japan-made Flood-Simulator.” During the process, necessary
measures will be taken.
Horizontal deployment would be targeted at, among other countries, Vietnam and Thailand. In both countries,
frequent floods due to causes such as typhoons are social headaches and there is expected to be high need for
introducing “Japan-made Flood-Simulator” and even weather radars as well. With regards to Vietnam in particular,
as stated in 7-1, “Japan-made Flood-Simulator” has a proven track record of introduction (FY 2013 Private-Sector
Technology Promotion Project for Socio-Economic Development of Developing Countries - ICT-Based
Sustainable Disaster Prevention/Reduction System Promotion Project, JICA). This suggests a high probability of
successful horizontal deployment to Vietnam.

(様式2)
頁 図表番号
31 Table 4-1
31 Table 4-2
32 Table 4-332 Table 4-4
43 Table 7-3
43 Table 7-4
44 Table 7-5
Main materials, equipment and pricesexpected to be procured from Japan accordingto Introduction Plan 1bMain materials, equipment and pricesexpected to be procured from Japan accordingto Introduction Plan 1b (rainfall predictionsystem-related)
二次利用未承諾リスト
委託事業名FY 2018 Operational FeasibilityStudy Project towards OverseasDeployment of High-QualityInfrastructure
報告書の題名FY 2018 Operational FeasibilityStudy Project towards OverseasDeployment of High-QualityInfrastructure(Republic of Indonesia: FeasibilityStudy Project for Flood DisasterPreparedness Planning Assuming theUse of Flood Simulator and WeatherRadar in the Province of Gorontalo)Study Report
受注事業者名Kanematsu CorporationJapan Weather Association
Main materials, equipment and pricesexpected to be procured from Japan accordingto Introduction Plan 1a
タイトルRough estimation of introduction cost foreach introduction planProject cost breakdown based onInfrastructure Introduction Plans (unit:\1,000; 1US$ = \110)Specifications for data preparationData preparation cost (unit: \1,000)