FY 2017 Status Report: CIRFT Data Update and Data … · The curvature SNF rod bending is obtained...
108
Spent Fuel and Waste Disposition FY 2017 Status Report: CIRFT Data Update and Data Analyses for Spent Nuclear Fuel Vibration Reliability Study Revision 1 Prepared for US Department of Energy Spent Fuel and Waste Science and Technology Jy-An Wang, Hong Wang Bruce B. Bevard, John M. Scaglione Oak Ridge National Laboratory September 28, 2017 SFWD-SFWST-2017-000030/R1 ORNL/SPR-2017/521 Approved for public release. Distribution is unlimited.
Transcript of FY 2017 Status Report: CIRFT Data Update and Data … · The curvature SNF rod bending is obtained...

Spent Fuel and Waste Disposition
FY 2017 Status Report: CIRFT Data Update and Data Analyses for Spent Nuclear Fuel Vibration Reliability Study Revision 1
Prepared for US Department of Energy
Spent Fuel and Waste Science and Technology
Jy-An Wang, Hong Wang
Bruce B. Bevard, John M. Scaglione Oak Ridge National Laboratory
September 28, 2017
SFWD-SFWST-2017-000030/R1
ORNL/SPR-2017/521
Approved for public release. Distribution is unlimited.

DOCUMENT AVAILABILITY
Reports produced after January 1, 1996, are generally available free via US Department of Energy (DOE) SciTech Connect.
Website http://www.osti.gov/scitech/
Reports produced before January 1, 1996, may be purchased by members of the public from the following source:
National Technical Information Service
5285 Port Royal Road
Springfield, VA 22161
Telephone 703-605-6000 (1-800-553-6847)
TDD 703-487-4639
Fax 703-605-6900
E-mail [email protected]
Website http://www.ntis.gov/help/ordermethods.aspx
Reports are available to DOE employees, DOE contractors, Energy Technology Data Exchange representatives, and International Nuclear Information System representatives from the following source:
Office of Scientific and Technical Information
PO Box 62
Oak Ridge, TN 37831
Telephone 865-576-8401
Fax 865-576-5728
E-mail [email protected]
Website http://www.osti.gov/contact.html
DISCLAIMER This information was prepared as an account of work sponsored by an agency of the U.S. Government. Neither the U.S. Government nor any agency thereof, nor any of their employees, makes any warranty, expressed or implied, or assumes any legal liability or responsibility for the accuracy, completeness, or usefulness, of any information, apparatus, product, or process disclosed, or represents that its use would not infringe privately owned rights. References herein to any specific commercial product, process, or service by trade name, trade mark, manufacturer, or otherwise, does not necessarily constitute or imply its endorsement, recommendation, or favoring by the U.S. Government or any agency thereof. The views and opinions of authors expressed herein do not necessarily state or reflect those of the U.S. Government or any agency thereof.
ORNL/SPR-2017/521
Materials Science and Technology Division
FY 2017 Status Report: CIRFT Data Update and Data Analyses for Spent Nuclear Fuel Vibration Reliability Study, Revision 1
Jy-An John Wang, Hong Wang
Program Manager
Bruce Bevard and John Scaglione
Date Published: September 28, 2017
Prepared by
OAK RIDGE NATIONAL LABORATORY
Oak Ridge, TN 37831-6283
managed by
UT-BATTELLE, LLC
for the
US DEPARTMENT OF ENERGY
under contract DE-AC05-00OR22725

CIRFT Data Update and Data Analyses for Spent Nuclear Fuel Vibration Reliability Study, Rev. 1 iv July 28, 2017
This page intentionally left blank.

CIRFT Data Update and Data Analyses for Spent Nuclear Fuel Vibration Reliability Study, Rev. 1 July 28, 2017 v
SUMMARY The objective of this research is to collect experimental data on spent nuclear fuel (SNF) from pressurized water reactors (PWRs), including the H. B. Robinson Nuclear Power Station (HBR), Catawba Nuclear Station, North Anna Nuclear Power Station (NA), and the Limerick Nuclear Power Station (LMK) boiling water reactor (BWR). Data will be collected under simulated transportation environments using the cyclic integrated reversible-bending fatigue tester (CIRFT), an enabling hot-cell testing technology developed at Oak Ridge National Laboratory (ORNL). These data will be used to support ongoing SNF modeling activities and to address regulatory issues associated with SNF transport.
The first portion of this report provides an overall update on the static and dynamic test data developed by utilizing CIRFT. These data are used to evaluate the vibration integrity of SNF under normal conditions of transport (NCT). The CIRFT consists of a U-frame test setup, and it uses a real-time curvature measurement method. The three-component U-frame setup of the CIRFT has two rigid arms and linkages connecting to a universal testing machine. The curvature SNF rod bending is obtained through a three-point deflection measurement method. Three linear variable differential transformers (LVDTs) are clamped to the side connecting plates of the U-frame and used to capture deformation of the rod.
The LVDTs’ sensor spacing correction is based on the developed equivalent gauge length that was used as a correction factor and implemented into this update. In addition to this correction, the LVDTs’ stem dynamic correction factor was also developed and implemented into this most recent CIRFT dynamic test data update.
The correction factors based on the equivalent gauge length methodology and the LVDTs’ stem vibration stability have been successfully used in CIRFT data analysis for static and dynamic tests conducted on LMK (18 tests), NA (7 tests), Catawba Nuclear Station mixed oxide (MOX) SNF samples (25 tests), and HBR (30 tests). The data sets obtained from static measurements and dynamic online monitoring were processed and analyzed, and the fatigue life of the rods was characterized in terms of moment, curvature, and equivalent stress and strain.
The second portion of this report provides the details of analyses procedures for using CIRFT test data for SNF fatigue life prediction. The modified equivalent stress-strain approach (MESA) was also developed in FY2017 to effectively translate the global CIRFT moment-curvature data into the local cladding surface stress-strain profile. This new approach was implemented into both CIRFT static test data and CIRFT dynamic test data in the FY2017.
The variations in fatigue life are provided in terms of moment, equivalent stress, curvature, and equivalent strain for the tested SNF. The equivalent stress or strain plots collapsed the data points from all the SNF samples into a single zone. A detailed examination revealed that at the same stress or strain level, fatigue lives display a descending order, as follows: LMK, HBR, and MOX. A discontinuity or knee point for the endurance limit in the curve of moment and curvature or equivalent quantities is more clearly defined for LMK and HBR fuels.
To estimate the potential damage to SNF system vibration lifetime caused by transient shocks resulting from component contact interaction, drop impact tests were performed on the CIRFT specimen prior to the CIRFT harmonic vibration fatigue testing. The combined 12-inch drop-impact and CIRFT cyclic harmonic vibration test results show significant reduction in fatigue life.
There are two types of vibration loading modes involved in SNF transport under NCT: harmonic vibration modes and periodic transient shocks. These shocks include SNF system components’ contact interactions. The associated damage mechanisms are described below.

CIRFT Data Update and Data Analyses for Spent Nuclear Fuel Vibration Reliability Study, Rev. 1 vi July 28, 2017
1) In a harmonic vibration loading mode:
• Due to maximum axial tensile stress occurring on the outer cladding wall, crack growth is likely initiated at the outer clad wall under loading.
• Due to circumferential hydride rim reinforcement near the outer cladding wall, no obvious crack growth was observed from as-irradiated CIRFT test post irradiation examination (PIE) data.
• The high burnup (HBU) SNF failure under harmonic vibration appears to result from spontaneous brittle fracture mode.
2) In an SNF component’s contact interactions or periodic transient shocks loading mode:
• Due to maximum axial/hoop tensile stress occurring at the cladding’s inner wall, the crack growth is likely initiated at the cladding’s inner wall region, and then it propagates toward the cladding’s outer wall under cyclic fatigue loading.
• The crack growth phenomenon was further confirmed by the severe reduction in flexural rigidity observed in CIRFT real-time monitoring data.
Therefore, under NCT, two failure damage mechanisms are involved in the SNF vibration stability investigation: harmonic vibration mode and transient shock mode. Apparently, the crack growth initiated at the cladding’s inner wall has a much higher damage potential. With one drop from 12 inches (contact load intensity similar to that of a 20 g transient shock at the spacer grid region), a 75% fatigue life reduction was observed from CIRFT test results. Thus, based on the potential for repeated contact transient shocks, the potential for associated reduced fatigue life deserves special attention and should be included in the accumulated damage (AD) evaluation of SNF transported under NCT.

CIRFT Data Update and Data Analyses for Spent Nuclear Fuel Vibration Reliability Study, Rev. 1 July 28, 2017 vii
This page is intentionally left blank.

CIRFT Data Update and Data Analyses for Spent Nuclear Fuel Vibration Reliability Study, Rev. 1 viii July 28, 2017
ACKNOWLEDGMENTS
This research was sponsored by the US Department of Energy (DOE) Used Fuel Disposition Campaign under DOE contract DE-AC05-00OR22725 with UT-Battelle, LLC. The authors thank ORNL program managers Bruce Bevard and John Scaglione for their support and guidance during the project, Chuck Baldwin for post-irradiation examination, Yong Yan for preparation hydride reorientation samples, Dale Caquelin and Bob Morris for logistic support, Josh Schmidlin for fuel rod cutting and dimension measurement, Bryan Woody and Scott Thurman for hot cell operation support, Brian Sparks and Randy Parten for drawing and machining support, and Lianshan Lin and Rose Raney for reviewing the report.

CIRFT Data Update and Data Analyses for Spent Nuclear Fuel Vibration Reliability Study, Rev. 1 July 28, 2017 ix
This page intentionally left blank.

CIRFT Data Update and Data Analyses for Spent Nuclear Fuel Vibration Reliability Study, Rev. 1 x July 28, 2017
CONTENTS
SUMMARY ............................................................................................................................................ v
ACKNOWLEDGMENTS .................................................................................................................... viii
LIST OF FIGURES ............................................................................................................................... xii
LIST OF TABLES ................................................................................................................................ xv
ACRONYMS ....................................................................................................................................... xvi
1. INTRODUCTION ......................................................................................................................... 1 1.1 Cyclic Integrated Reversible-Bending Fatigue Tester ........................................................... 2 1.2 Moment and Curvature Calculations .................................................................................... 5 1.3 Sensor Spacing Correction for Curvature Measurements ...................................................... 7
1.3.1 The Half Gauge Length Approach for LVDT Sensor Spacing Adjustment ............... 9 1.3.2 Curvature Adjustment for LVDT Stem Dynamic Stability ..................................... 11
1.4 CIRFT Test Protocol ......................................................................................................... 12 1.4.1 Static CIRFT Testing ............................................................................................ 12 1.4.2 Dynamic CIRFT Testing ....................................................................................... 13 1.4.3 Data Processing .................................................................................................... 13 1.4.4 Flexural Rigidity Calculation ................................................................................ 18
2. STATIC CIRFT TEST DATA ANALYSES ................................................................................ 21 2.1 Characteristics of Moment-Curvature Curve ...................................................................... 21 2.2 Comparison of Static Results with Pacific Northwest National Laboratory Zry-4 and
ORNL M5 Cladding Data .................................................................................................. 24 2.3 The Equivalence Stress Approach Verification and Benchmark ......................................... 29
2.3.1 Equivalent Stress-Strain Approach Methodology .................................................. 29 2.3.2 The Development of Modified Equivalent Stress-Strain Methodology ................... 30 2.3.3 The Development of Modified Equivalent Stress Approach (MESA) for
Strain Level beyond Yield Strain........................................................................... 32 2.3.4 Applying Modified Equivalent Stress-Strain Approach to CIRFT Static Test
Data ...................................................................................................................... 39
3. DYNAMIC CIRFT TEST DATA ANALYSIS ............................................................................ 43 3.1 Data Analysis Results for Dynamic Tests .......................................................................... 43 3.2 CIRFT Evaluations of LMK Fuel Rods .............................................................................. 44 3.3 CIRFT Evaluations of NA Fuel Rods................................................................................. 50 3.4 CIRFT Evaluations of MOX Fuel Rods ............................................................................. 55 3.5 CIRFT Evaluations of HBR Fuel Rods .............................................................................. 60
3.5.1 Cladding Oxide Effect Study ................................................................................. 66 3.5.2 HR CIRFT Test Data Evaluation ........................................................................... 69
3.6 Discussion ......................................................................................................................... 72 3.6.1 SNF Fatigue Life Comparison ............................................................................... 72
CIRFT Data Update and Data Analyses for Spent Nuclear Fuel Vibration Reliability Study, Rev. 1 July 28, 2017 xi
3.6.2 SNF Dynamic Deformation Simulation Assessments ............................................ 76 3.6.3 The Impact of the SNF Skeleton Integrity to SNF Vibration Intensity .................... 77
4. Applying CIRFT Data for SNF System Vibration Reliability Study ............................................. 79 4.1 Methodology Used for Evaluating SNF System Dynamic Stability .................................... 80 4.2 Using CIRFT S-N Data and SNF System Vibration Time-History Data to Determine
SNF System AD ................................................................................................................ 81 4.2.1 CIRFT Load Determination from Random Vibration Histogram ........................... 81 4.2.2 SNF System Transport AD Evaluation .................................................................. 83
5. CONCLUSIONS ......................................................................................................................... 87 5.1 CIRFT Data Trends ........................................................................................................... 87 5.2 Damage Mechanisms Involved in SNF Vibration under NCT ............................................ 88
6. REFERENCES............................................................................................................................ 89
CIRFT Data Update and Data Analyses for Spent Nuclear Fuel Vibration Reliability Study, Rev. 1 xii July 28, 2017
LIST OF FIGURES
Figure 1. Three views of the ORNL CIRFT: (a) Horizontal layout of the U-frame setup, (b) a rod specimen undergoing testing with three LVDTs in place for curvature measurements (the operator is facing the LVDTs), and (c) a front view of the CIRFT installed in a hot cell. ......................................................................................................................................... 4
Figure 2. Determination of the bending curvature of the rod based on deflections measured at three points. ............................................................................................................................. 6
Figure 3. Grip design of CIRFT with one end-block removed. ................................................................. 6
Figure 4. Deflections measured by LVDTs may be at different points from initial positions, and sensor spacing h needs to be corrected. .................................................................................... 8
Figure 5. (a) For a positive curvature induced by tension on the U-frame, the sensor must be adjusted 2.9 mm so that the disk- and chisel-based measurements match; (b) for the negative curvature induced by compression on the U-frame, the sensor must be adjusted 2.4 mm so that the disk- and chisel-based measurements match. ................................ 9
Figure 6. Diagram of circle showing quantities in calculating half gauge length of bent rod. .................. 10
Figure 7. Curvature measurements of polycarbonate rod using the M-based estimate and the disk type probe with 2.50 mm sensor spacing correction. ............................................................... 11
Figure 8. Variations of (a) peak strain and (b) valley strain as a function of driving frequency. At 5 Hz, the corrected strain level is about 18% higher than the strain gauge estimate for peak and valley strain plots. ................................................................................................... 12
Figure 9. Flowchart for cyclic testing of SNF rod. .................................................................................. 13
Figure 10. Moment and curvature as a function of time and moment-curvature loops based on measurements when (a) N=1 and (b) N = 111,000 cycles for D1 (607C4B). Measurements were made with 0.8 and 1.2 mm relative displacements; Nf = 1.1 × 10⁵ cycles under ±15.24 N∙m, 5 Hz. ............................................................................................. 14
Figure 11. (a) Moment-curvature relation and (b) moment-flexural rigidity relation at various numbers of cycles for D1 (607C4B); Nf = 1.1 × 10⁵ cycles under ±15.24 N∙m, 5 Hz. .............. 15
Figure 12. Variations of (a) curvature range, (b) moment range, (c) and flexural rigidity as a function of the number of cycles for D1 (607C4B); Nf = 1.1 × 10⁵ cycles under ±15.24 N∙m, 5 Hz. ............................................................................................................................. 15
Figure 13. Variations of (a) curvature range, (b) applied moment range, (c) flexural rigidity, (d) maximum and minimum values of curvature, (e) maximum and minimum values of moment, and (f) flexural hysteresis as a function of number of cycles for D1 (607C4B); Nf = 1.1 × 10⁵ cycles under ±15.24 N∙m, 5 Hz. ....................................................................... 16
Figure 14. Moment and curvature as a function of time and moment-curvature loops at (a) 26 and (b) 1.10 × 10⁵ cycles; results based on online monitoring. The unsymmetrical curvature deformation of the tested rod at the 26th cycle and 1.1 × 10⁵ cycle was also observed.............. 17
Figure 15. Empty-run conducted without specimen installed for which the load and displacement were plotted; associated with static test on D1. ....................................................................... 19
Figure 16. Characteristic points of moment-curvature curve. .................................................................. 21

CIRFT Data Update and Data Analyses for Spent Nuclear Fuel Vibration Reliability Study, Rev. 1 July 28, 2017 xiii
Figure 17. (a) Comparison of static M5 CIRFT test data with theoretical ORNL moment-curvature derived from ORNL M5 cladding only stress-strain data, and (b) comparison of all static CIRFT test data with theoretical PNNL and ORNL moment-curvature derived from PNNL Zry-4 and ORNL M5 cladding only stress-strain data. ............................ 27
Figure 18. (a) HBR Dcal M-κ trend curve, and (b) HBR Dcal equivalent stress-strain curve. .................. 31
Figure 19. Comparison of stress-strain curves from PNNL data, equivalent stress with c=1, and modified equivalent stress approach for HBR Dcal CIRFT test data. ...................................... 32
Figure 20. The comparison of stress-strain curves from PNNL data, equivalent stress with c=1, and modified equivalent stress approach with oxide thickness correction factor applied and yield zone modulus update for HBR Dcal CIRFT test data. The ORNL CIRFT stress-strain curve data match that of PNNL data.................................................................... 33
Figure 21. The comparison between PNNL Zry-4 data and cladding surface stress-strain profiles obtained from CIRFT static tests for HBR rods, incluidng HRT sample of HR2 data. ............. 40
Figure 22. The comparison between ORNL M5 data and cladding surface stress-strain profiles obtained from CIRFT static tests for MOX and NA rods. ....................................................... 41
Figure 23. (a) Moment amplitude, (b) stress amplitude, (c) curvature amplitude/ maximum, and (d) strain amplitude/maximum as a function of cycles or cycles to failure. .............................. 49
Figure 24. (a) Moment amplitude, (b) stress amplitude, (c) curvature amplitude/maximum, and (d) strain amplitude/maximum as a function of cycles or cycles to failure. .............................. 54
Figure 25. (a) Moment amplitude, (b) stress amplitude, (c) curvature amplitude/maximum, and (d) strain amplitude/maximum as a function of cycles or cycles to failure (MOX_A: as-received; MOX_D: 12 in. drop; MOX_H: heat treated). ..................................................... 59
Figure 26. (a) Moment amplitude, (b) stress amplitude, (c) curvature amplitude, and (d) strain amplitude rigidity as a function of cycles or cycles to failure. ................................................. 64
Figure 27. HR fractured sample HR1 revealed mixed-mode failure mechanisms [23]. ............................ 65
Figure 28. (a) Moment amplitude vs. number of failure cycles, (b) strain amplitude vs. number of failure cycles, (c) flexural rigidity vs. strain as function of clad oxide thickness, and (d) moment amplitude vs. number of failure cycles as function of hydrogen of span; flexural rigidity seems to be dependent on strain amplitude; HR4 has thermal heat treatment only without pressurization applied......................................................................... 69
Figure 29. Metallographic examination of fuel and cladding: MET results of HR1 showing debonding phenomenon and gap formation at pellet-clad interface and high density of radial hydride formation in HR treated rod [23]. ..................................................................... 70
Figure 30. HBU MOX rod real-time dynamic monitoring data of flexural rigidity (R) under CIRFT testing, (a) CIRFT test without drop showing no flexural rigidity reduction till failure, and (b) CIRFT test with prior 12-inch drop of CIRFT sample showing significant flexural rigidity reduction and indicating cladding crack initiation and growth in the 12-inch drop sample during CIRFT harmonic vibration testing [24]. ................. 72
Figure 31. (a) Moment amplitude, (b) equivalent stress amplitude, (c) curvature amplitude, and (d) equivalent strain amplitude as a function of cycles to failure. ............................................ 75
Figure 32. SNF assembly submodel for normal transportation evaluation. .............................................. 76

CIRFT Data Update and Data Analyses for Spent Nuclear Fuel Vibration Reliability Study, Rev. 1 xiv July 28, 2017
Figure 33. Typical fuel assembly skeleton at spacer grids region (left), and SNF system and
canister basket walls interactions (right). ................................................................................ 77
Figure 34. Components of SNF system fatigue life evaluation................................................................ 79
Figure 35. Typical fatigue life estimate procedures based on S-N approach. ........................................... 79
Figure 36. Core activities of DOE UFDC SNF transport vibration reliability investigation. .................... 80
Figure 37. Vibration amplitude in frequency domain chosen for CIRFT testing. ..................................... 81
Figure 38. Estimating SNF system stress-strain based on cask external vibration data. ........................... 82
Figure 39. Full model stress results for the SNF rod under rail transport [26]; maximum stress of 44.1 MPa is equivalent to an 8.4 N-m bending loading on an HBU HBR rod under CIRFT testing. ....................................................................................................................... 82
Figure 40. Weakest portion within an HBU HBR fuel assembly located at the upper region of SNF rod as indicated from CIRFT vibration test results. ......................................................... 83
Figure 41. Methodology for evaluating AD of SNF system under NCT. ................................................. 84

CIRFT Data Update and Data Analyses for Spent Nuclear Fuel Vibration Reliability Study, Rev. 1 July 28, 2017 xv
LIST OF TABLES Table 1. Characteristic points and quantities based on curvature-moment curves. ................................... 22
Table 2. Characteristic points and quantities based on equivalent stress-strain curves. ............................ 22
Table 3. Comparison of flexural rigidity results between CIRFT testing and PNNL and ORNL data........................................................................................................................................ 28
Table 4. Detailed Dcal CIRFT static test results and the associated MESA stress. .................................. 34
Table 5. The yield strains and Young’s modulus from PNNL Zry-4 and ORNL M5 cladding materials and the corresponding yield properties obtained from CIRFT testing data............... 39
Table 6a. Dynamic test results for LMK SNF rods. ................................................................................ 46
Table 7a. Dynamic test results for NA SNF rods. ................................................................................... 50
Table 8a. Dynamic test results for MOX SNF rods. ............................................................................... 55
Table 9a. Dynamic test results for HBR SNF rods.................................................................................. 60
Table 10. HBR SNF CIRFT data with the associated tested rod’s oxide thickness. ................................. 66

CIRFT Data Update and Data Analyses for Spent Nuclear Fuel Vibration Reliability Study, Rev. 1 xvi July 28, 2017
ACRONYMS
AD accumulated damage
BE bonding efficiency
BWR boiling water reactor
CIRFT cyclic integrated reversible-bending fatigue tester
DOE US Department of Energy
EI flexural rigidity
EPRI Electric Power Research Institute
FEA finite element analysis
FEM finite element method
FFT Fast Fourier Series Transformation
FY fiscal year
HBR H. B. Robinson Nuclear Power Station
HBU high-burnup
HR hydride reorientation
ID inner diameter
LMK Limerick Nuclear Power Station
LVDT linear variable differential transformer
MESA modified equivalent stress-strain approach
MOX Catawba mixed uranium-plutonium oxide
NA North Anna Power Station
NCT normal conditions of transport
NRC US Nuclear Regulatory Commission
NUREG Nuclear Regulatory Commission technical report
NUREG/CR NUREG contractor report
OD outer diameter
ORNL Oak Ridge National Laboratory
PIE post-irradiation examination
PNNL Pacific Northwest National Laboratory
PPI pellet-to-pellet interface
PWR pressurized water reactor
RHT radial hydride treatment
SNF spent nuclear fuel

CIRFT Data Update and Data Analyses for Spent Nuclear Fuel Vibration Reliability Study, Rev. 1 July 28, 2017 xvii
SS stainless steel
UFDC Used Fuel Disposition Campaign


CIRFT Data Update and Data Analyses for Spent Nuclear Fuel Vibration Reliability Study, Rev. 1 July 28, 2017 1
SPENT FUEL AND WASTE SCIENCE AND TECHNOLOGY
FY 2017 Status Report: CIRFT Data Update and Data Analyses for Spent Nuclear Fuel Vibration Reliability Study
1. INTRODUCTION The objective of this research is to collect experimental data on spent nuclear fuel (SNF) from pressurized water reactors (PWRs)—including the H. B. Robinson Nuclear Power Station (HBR), Catawba Nuclear Station, and North Anna Power Station (NA), and the Limerick Nuclear Power Station (LMK) boiling water reactor (BWR)—under simulated transportation environments using the cyclic integrated reversible-bending fatigue tester (CIRFT) [1–5], an enabling hot-cell testing technology developed at Oak Ridge National Laboratory (ORNL). These data will be used to support ongoing SNF modeling activities and to address regulatory issues associated with SNF transport.
Testing of SNF rods from PWRs, including HBR Zircaloy-4 cladding, NA, and Catawba M5 cladding [6–8], demonstrated that the cyclic fatigue lifetime of SNF rods generally depends on the amplitude of the applied moment when a 5 Hz waveform is used. It was also demonstrated that the lifetime of SNF is related to the degree of damage to cladding and fuel pellets resulting from irradiation after long-term service inside a reactor. SNF lifetime is also affected by the loading amplitude and loading rate of the applied moment caused by different fatigue damage mechanisms triggered by the intensity of pellet-cladding mechanical interaction. Detailed high-burnup (HBU) HBR CIRFT results are published in US Nuclear Regulatory Commission (NRC) technical report (NUREG)/CR-7198 [9]. The CIRFT program also extended the vibration data collected to include Zircaloy-2 data from a BWR environment [10]. A stress-failure frequency (S-N) trend similar to the PWR data was also observed in the BWR data. Furthermore, the accumulated damage (AD) from the combination of low-amplitude CIRFT cyclic bending plus transient shocks (high-amplitude bending load) indicates an accelerated aging effect compared with low-amplitude cyclic loading alone.
CIRFT enables examination of the underlying mechanisms of the SNF system’s dynamic performance. Major findings from CIRFT evaluations on HBU SNF include:
• SNF system interface bonding plays an important role in SNF vibration performance.
• Fuel structure contributes to the SNF system’s stiffness.
• There are significant variations in the stress and curvature of SNF systems during vibration cycles which result from the interaction of pellets and cladding.
• SNF failure initiates at the pellet-pellet interface (PPI) region and appears to be spontaneous.
Due to the inhomogeneous composite structure of the SNF system, finite element analysis (FEA) was needed to translate the global moment-curvature measurement into local stress-strain profiles for further investigation. Furthermore, the detailed mechanisms of the pellet-pellet and pellet-cladding interactions and the stress concentration effects at the PPI cannot be readily obtained from a CIRFT system measurement. Therefore, detailed FEA is necessary to further understand the global test response.
The theoretical basis to improve CIRFT curvature measurements was developed in fiscal year (FY) 2016, including the associated verification testing protocols needed to validate this approach. The effort was extended to cover all the dynamic CIRFT data sponsored by the US Department of Energy (DOE)
CIRFT Data Update and Data Analyses for Spent Nuclear Fuel Vibration Reliability Study, Rev. 1 2 July 28, 2017
excluding HBR data sponsored by the NRC [9]. The FEA protocols developed for this activity provide powerful tools to quantify the CIRFT system biases and the associated uncertainties of HBU SNF during CIRFT examinations. In FY 2016, efforts were also extended to loading intensity investigations and evaluation with real time SNF vibration under normal condition of transport (NCT). These efforts served as additional benchmarks for quantifying and justifying the CIRFT test loading intensity ranges.
In FY 2017, the update curvature measurement procedure was also extended to all the static CIRFT tested data; the updated dynamic correction factor that considers the linear variable differential transformers’ (LVDTs) stem vibration stability was also implemented into all the dynamic CIRFT test data. Furthermore, the curvature measurements of both the static and dynamic CIRFT test data for HBU HBR rods, sponsored by NRC, were also updated.
The modified equivalent stress-strain approach (MESA) was also successfully developed in FY 2017 to effectively translate the global CIRFT moment-curvature trend into local cladding surface stress-strain data. This new approach will be implemented into both static and dynamic CIRFT tests in the next report period.
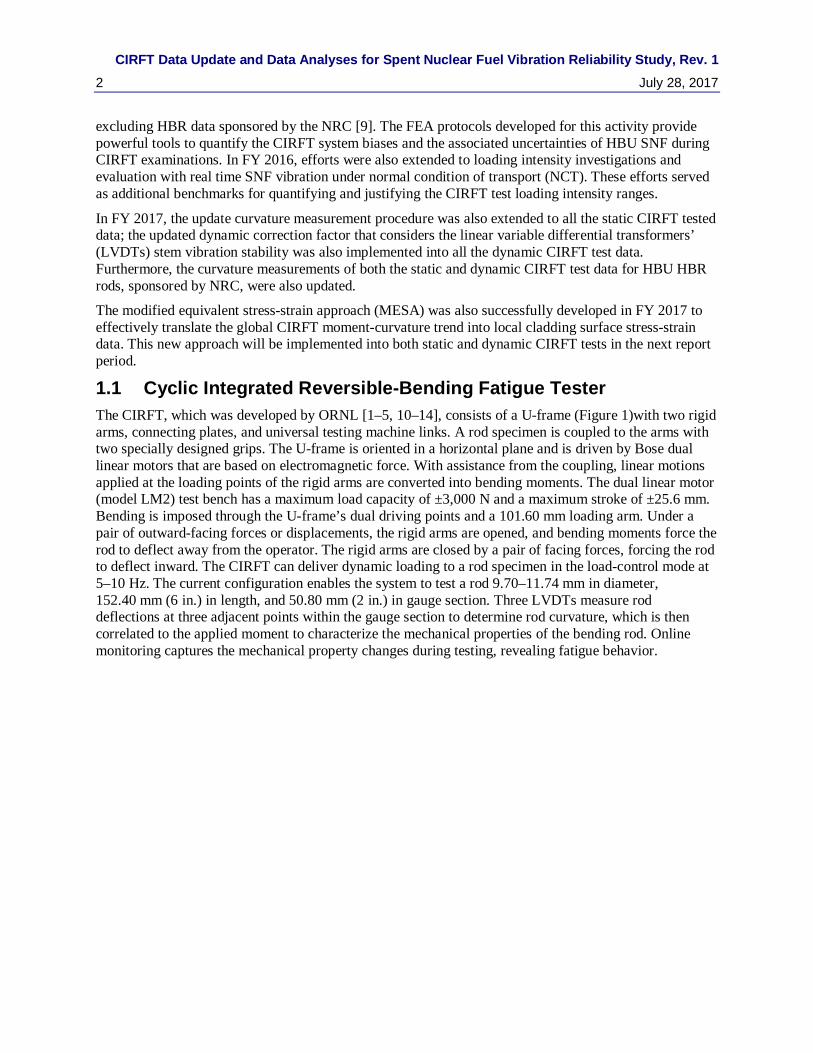
1.1 Cyclic Integrated Reversible-Bending Fatigue Tester The CIRFT, which was developed by ORNL [1–5, 10–14], consists of a U-frame (Figure 1)with two rigid arms, connecting plates, and universal testing machine links. A rod specimen is coupled to the arms with two specially designed grips. The U-frame is oriented in a horizontal plane and is driven by Bose dual linear motors that are based on electromagnetic force. With assistance from the coupling, linear motions applied at the loading points of the rigid arms are converted into bending moments. The dual linear motor (model LM2) test bench has a maximum load capacity of ±3,000 N and a maximum stroke of ±25.6 mm. Bending is imposed through the U-frame’s dual driving points and a 101.60 mm loading arm. Under a pair of outward-facing forces or displacements, the rigid arms are opened, and bending moments force the rod to deflect away from the operator. The rigid arms are closed by a pair of facing forces, forcing the rod to deflect inward. The CIRFT can deliver dynamic loading to a rod specimen in the load-control mode at 5–10 Hz. The current configuration enables the system to test a rod 9.70–11.74 mm in diameter, 152.40 mm (6 in.) in length, and 50.80 mm (2 in.) in gauge section. Three LVDTs measure rod deflections at three adjacent points within the gauge section to determine rod curvature, which is then correlated to the applied moment to characterize the mechanical properties of the bending rod. Online monitoring captures the mechanical property changes during testing, revealing fatigue behavior.

CIRFT Data Update and Data Analyses for Spent Nuclear Fuel Vibration Reliability Study, Rev. 1 July 28, 2017 3
(b)
Rigid arms
Connecting plates Three LVDTs for curvature measurement
Rod specimen
(a)

CIRFT Data Update and Data Analyses for Spent Nuclear Fuel Vibration Reliability Study, Rev. 1 4 July 28, 2017
(c)
Figure 1. Three views of the ORNL CIRFT: (a) Horizontal layout of the U-frame setup, (b) a rod specimen
undergoing testing with three LVDTs in place for curvature measurements (the operator is facing the LVDTs), and (c) a front view of the CIRFT installed in a hot cell.
SNF rod
End-blocks
LVDT clamp

CIRFT Data Update and Data Analyses for Spent Nuclear Fuel Vibration Reliability Study, Rev. 1 July 28, 2017 5
1.2 Moment and Curvature Calculations Measurement data are converted into the applied moment and curvature based on the load channel (load1 and load2) information, the loading arm length (101.60 mm), and LVDT data (LVDT1, 2, and 3).
The moment was estimated by
M = F × L, (1)
where F is the averaged value of applied loads (load1 and load2) from the Bose dual motors, and L is the loading arm length, 101.60 mm.
Theoretically, the bending radius and maximum strain of a rod can be estimated based on the traveling displacement at the loading points of the rigid arm. However, the measured displacement contains the contribution of the compliant layers and the level of loading.
To address this issue, direct measurements were made of specimen displacement at three adjacent points along the rod [15] to evaluate the curvature of a bending rod in this study [1,11].
Given any curve C and a point P on the curve, there is a unique circle or line that most closely approximates the curve near P, the osculating circle at P. The curvature of C at P is then defined as the curvature of that circle or line. The radius of the curvature is defined as the reciprocal of the curvature. Given the deflections from three LVDTs—d1, d2, and d3 (Figure 2)—the curvature κ of the bending rod was determined using the following equation:
2/12
02
20 ])[( −+−= ydxκ, (2)
where
)(2)()(2 2132
0ab
baba
mmddmddmhmmx
−+++−−
=,
221 21
00hddx
my
a
−
+
−−=,
and
12 ddhma −
=,
23 ddhmb −
=.
The sensor distance is h (12 mm).
CIRFT Data Update and Data Analyses for Spent Nuclear Fuel Vibration Reliability Study, Rev. 1 6 July 28, 2017
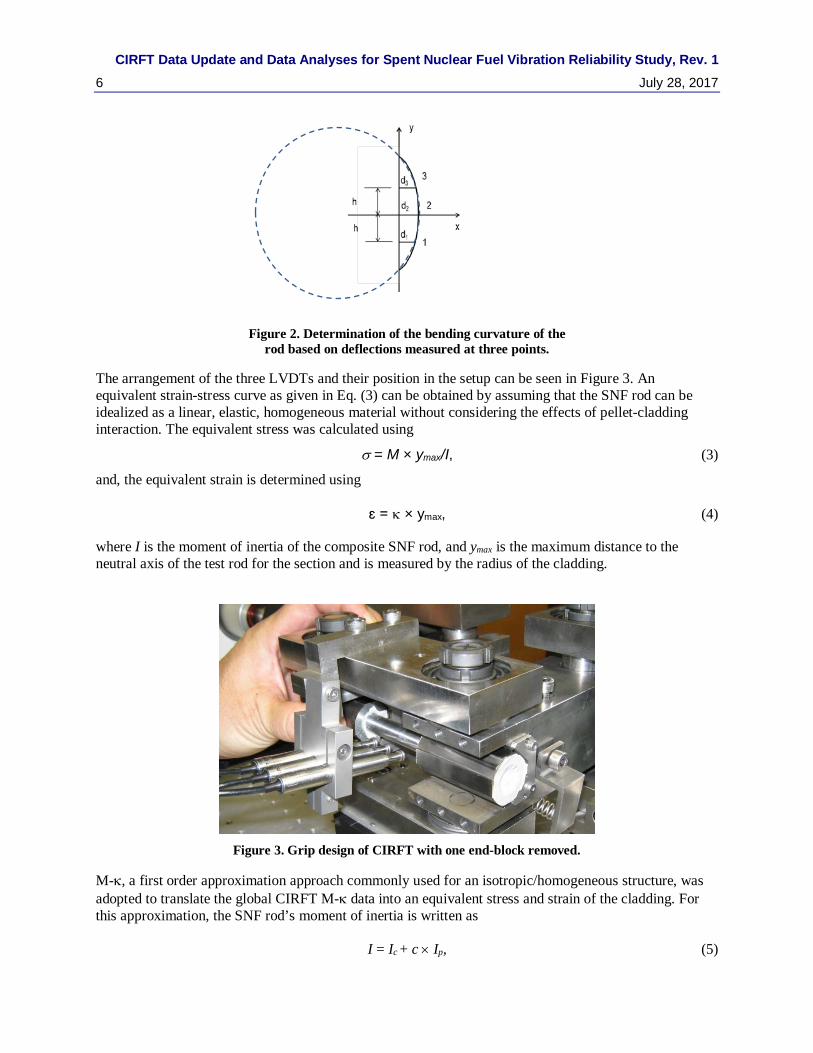
Figure 2. Determination of the bending curvature of the rod based on deflections measured at three points.
The arrangement of the three LVDTs and their position in the setup can be seen in Figure 3. An equivalent strain-stress curve as given in Eq. (3) can be obtained by assuming that the SNF rod can be idealized as a linear, elastic, homogeneous material without considering the effects of pellet-cladding interaction. The equivalent stress was calculated using
σ = M × ymax/I, (3)
and, the equivalent strain is determined using
ɛ = κ × ymax, (4)
where I is the moment of inertia of the composite SNF rod, and ymax is the maximum distance to the neutral axis of the test rod for the section and is measured by the radius of the cladding.
Figure 3. Grip design of CIRFT with one end-block removed.
M-κ, a first order approximation approach commonly used for an isotropic/homogeneous structure, was adopted to translate the global CIRFT M-κ data into an equivalent stress and strain of the cladding. For this approximation, the SNF rod’s moment of inertia is written as
I = Ic + c × Ip, (5)

CIRFT Data Update and Data Analyses for Spent Nuclear Fuel Vibration Reliability Study, Rev. 1 July 28, 2017 7
where Ic and Ip are moments of inertia of cladding and pellet, respectively, and c = Ep/Ec. (Because the baseline Young’s modulus of the oxide fuel is twice that of the cladding, c is likely greater than 1.) In the proposed equivalent stress and strain approach, c is set to 1, which implies a 50% reduction in the pellet Young’s modulus to account for operationally induced degradation of the HBU fuel pellet. This hypothesis of 50% reduction in fuel flexural rigidity was also validated and demonstrated in Jiang et al. [16]. The moment range (∆M), curvature range (∆κ), and flexural rigidity EI are used to characterize the mechanical response of the fuel rod. These are defined as:
∆M = Mmax − Mmin, (6)
∆κ = κmax − κmin, and
EI = ∆M / ∆κ,
where the subscripts max and min represent the maximum and minimum oscillation height (see Sect. 1.4.4 for more information on the flexural rigidity calculation).
These parameters were derived from the CIRFT data and test specimens and are used to examine the SNF rod fatigue performance and investigate phenomena of interest.
Two items of interest are discussed within the context of the data obtained through CIRFT testing: (1) the role of the pellet in nucleating fatigue failures (termed pellet-cladding interaction within this document) and (2) the extension or reduction of the fatigue lifetime resulting from mechanical1 or chemical2 bonding between the pellet and cladding or pellet and pellet (termed bonding in this document). The effects of a stress concentration at locations of pellet-cladding interaction relative to the gauge strain at pellet-to-pellet interfaces (PPIs) on the global flexural rigidity and the local plastic deformation were studied using the finite element method (FEM) [16]. The implication of the FEM numerical results on the interpretation of bending testing is discussed. It is noted that the instrumentation used on the CIRFT device measured the global rod deformation within the gauge section, or the gauge strain that covers several pellet lengths with several PPIs. The localized strain at the PPIs cannot be precisely known for these experiments, but it will be greater than the gauge strain measured in the tests.
1.3 Sensor Spacing Correction for Curvature Measurements The contact of the LVDT probe with the rod being tested depends on the bending direction and induced curvature, especially when contact is made by a disk with a flat head. This contact caused the sensor spacing to deviate from the ideal condition (Figure 4).
For a positive curvature, when the tensile load was applied to the U-frame, actual sensor spacing h2 is,
hhh ∆+=2 , (7)
1 During reactor operation, pellet swelling and cladding creep down result in a mechanical interference fit between cladding and
pellet that produces a mechanical bond through clad radial compressive residual stress. The mechanical bond is likely maintained throughout the fuel’s dry storage and transport lifetime and is likely providing enhanced rod rigidity to SNF rod.
2 There is evidence that a chemical bond between the zirconium-based fuel rod cladding and the uranium dioxide pellets can be developed at HBU, likely providing certain enhanced rod rigidity at chemically bonded locations. However, due to thermal expansion and contraction mismatch at clad-pellet interface region, during thermal cycling events of nuclear fuel operations, such a chemical bond is expected to be broken as shown from post-irradiation examination (PIE) of Catawba mixed uranium-plutonium oxide (MOX) SNF where the crack profile existed in the chemical bond region paralleled along the pellet-clad interface. Thus, the chemical bond effect on the SNF’s enhanced rigidity is very limited.

CIRFT Data Update and Data Analyses for Spent Nuclear Fuel Vibration Reliability Study, Rev. 1 8 July 28, 2017
and for negative curvature, when the compressive load was applied to the U-frame, actual sensor spacing h1 is
Figure 4. Deflections measured by LVDTs may be at different points
from initial positions, and sensor spacing h needs to be corrected.
A polycarbonate rod (0.4375 in. diameter and 6 in. length), specimen PC01, was tested under -6 mm and +6 mm rigid arm end displacements with disk-head LVDTs. The curvatures in the positive and negative directions appeared to be quite different (Figure 5).
The same specimen (PC01) was tested with the same level of applied displacement, except curvatures were based on chisel-head LVDTs. The curvatures in both directions were close to 2 m−1. The repeatable results indicated that PC01 behaved elastically, and the effect of chisel-head LVDTs on the curvature was negligible.
Analysis revealed the following:
• For a positive curvature induced by tension on the U-frame, a sensor adjustment of 2.90 mm is needed to have the disk-based measurement match the chisel-based measurement; this results in a 50% reduction in curvature measurement.
• For a negative curvature induced by compression on the U-frame, a sensor adjustment of 2.40 mm is needed for the disk-based measurement to match the chisel-based measurement; this results in a 40% increase in curvature measurement.
Based on the sensor spacing adjustments obtained for both conditions, a new half gauge length concept was developed and is discussed in next section.
hhh ∆−=1 (8)

CIRFT Data Update and Data Analyses for Spent Nuclear Fuel Vibration Reliability Study, Rev. 1 July 28, 2017 9
1.3.1 The Half Gauge Length Approach for LVDT Sensor Spacing Adjustment The bent rod is considered as an elastic curve that can be represented by part of a circle with radius R (Figure 6). The half gauge length can be expressed by arc AB, whose central angle is θ,
RLg ⋅= θ2/ (a)
(a)
(b)
Figure 5. (a) For a positive curvature induced by tension on the U-frame, the sensor must be adjusted 2.9 mm so that the disk- and chisel-based measurements match; (b) for the negative curvature
Curvature obtained with disk-head LVDTs
Curvature obtained with chisel-head LVDTs
Curvature obtained with disk-head LVDTs
Curvature obtained with chisel-head LVDTs

CIRFT Data Update and Data Analyses for Spent Nuclear Fuel Vibration Reliability Study, Rev. 1 10 July 28, 2017
induced by compression on the U-frame, the sensor must be adjusted
2.4 mm so that the disk- and chisel-based measurements match.
The deflection BD of the bent rod at the middle LVDT is measured as d2 and can be expressed in terms of chord AB:
BADABd ∠= sin2 , where 2/θ=∠=∠ ABCBAD .
ABC∠ is so small that
2/sin θ=∠≅∠ ABCABC , 2/gLAB ≅ .
So,
2/2/2 θ⋅= gLd . (b)
Dividing left and right sides of Eq. (a) by d2 and Lg/2 • θ /2 of Eq. (b), respectively, results in
RdLg ⋅= 222/ . (c)
It is known that the R is the inverse of curvature, so
κ/22/ 2dLg = . (9)
Figure 6. Diagram of circle showing quantities in calculating half gauge length of bent rod.
While the magnitude of the half gauge length bias adjustment is the same whether the rod is bent in a positive or negative direction, it must be applied appropriately according to the flexure direction. Resolving Eq. (9) to accommodate flexure direction results in the following relation:
hhhpphhhpp dd ∆−=−−
∆+=++ =
12|/|/ 22 κκ . (10)
The spacing correction ∆h can thus be obtained by solving Eq. (10).

CIRFT Data Update and Data Analyses for Spent Nuclear Fuel Vibration Reliability Study, Rev. 1 July 28, 2017 11
Application of the bias correction was tested using a polycarbonate rod 11.11 mm in diameter and 152.40 mm long. A displacement control was used at ±6 mm at each loading point. With this input, the rod was expected to behave elastically. Note that the flexural rigidity of rod EI is 1.80 Nm2, so the curvature of the rod can be effectively calculated when the moment M is provided, namely,
EIM /=κ . (11)
The three LVDT-based curvature curves obtained with a disk probe are presented in Figure 7 with and without the correction applied.
Figure 7. Curvature measurements of polycarbonate rod using the M-based estimate and the disk type probe with 2.50 mm sensor spacing correction.
Implementing the correction procedure in the polycarbonate rod example suggested that a ∆h of 2.50 mm is needed. The corrected curvature showed a good correspondence with the M-based curvature according to Eq. (11). In the monotonic test, ∆h = 2.50 mm obtained from the calibration can be used for spacing correction in data analysis. In the reversed cyclic bending, the ∆h is applied directly using Eq. (10) because the peak and valley pair is available in the data block. This is preferred since with the same loading in both directions, the flexure/curvature of an irradiated fuel rod can be asymmetric due to local bonding and pellet-cladding interface effects.
1.3.2 Curvature Adjustment for LVDT Stem Dynamic Stability To verify the curvatures calculated from the three LVDT readings under dynamic loading, a strain gauge was introduced as a verification method. A strain gauge was mounted on calibration rod SS30402 and tested under load control at varying frequencies. Correction was applied to the probe sensor spacing as shown in Figure 8.
Peak and valley strains based on the corrected exhibit have demonstrated a trend similar to the response of strain gauge as a function of driving frequency, as shown in Figure 8. The levels of the three-LVDT-based strains are usually higher than those of the strain gauge in both peak and valley directions, which
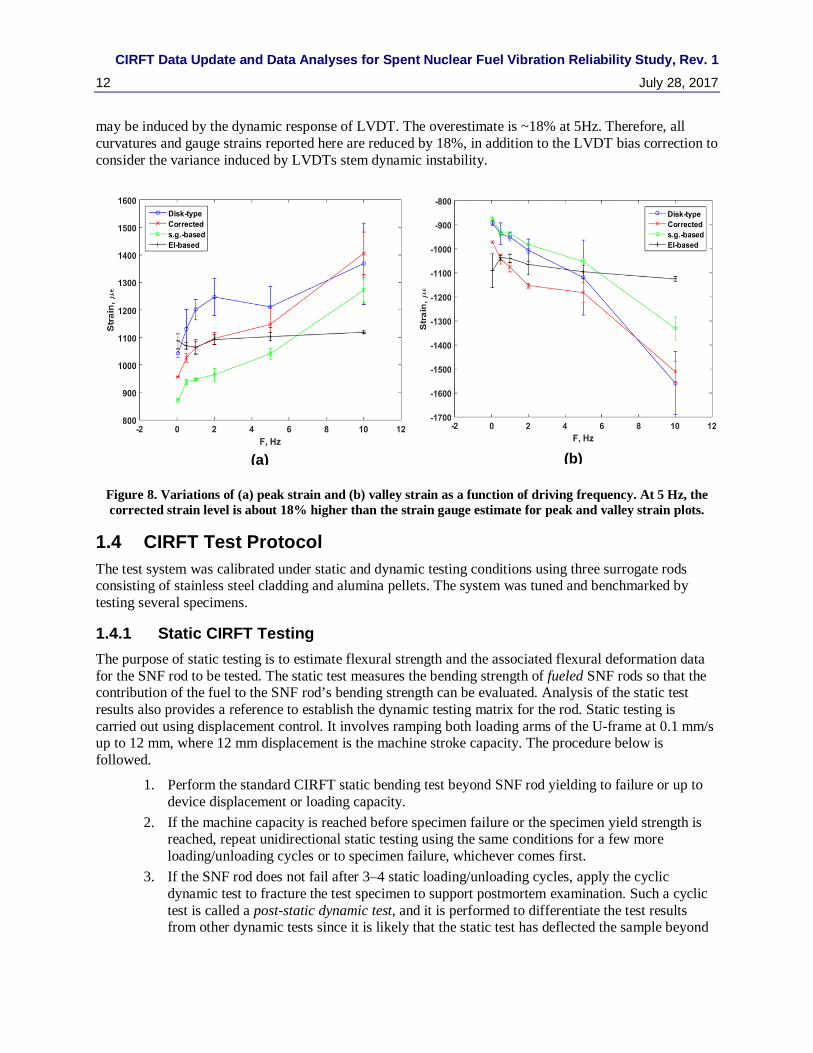
CIRFT Data Update and Data Analyses for Spent Nuclear Fuel Vibration Reliability Study, Rev. 1 12 July 28, 2017
may be induced by the dynamic response of LVDT. The overestimate is ~18% at 5Hz. Therefore, all curvatures and gauge strains reported here are reduced by 18%, in addition to the LVDT bias correction to consider the variance induced by LVDTs stem dynamic instability.
Figure 8. Variations of (a) peak strain and (b) valley strain as a function of driving frequency. At 5 Hz, the corrected strain level is about 18% higher than the strain gauge estimate for peak and valley strain plots.
1.4 CIRFT Test Protocol The test system was calibrated under static and dynamic testing conditions using three surrogate rods consisting of stainless steel cladding and alumina pellets. The system was tuned and benchmarked by testing several specimens.
1.4.1 Static CIRFT Testing The purpose of static testing is to estimate flexural strength and the associated flexural deformation data for the SNF rod to be tested. The static test measures the bending strength of fueled SNF rods so that the contribution of the fuel to the SNF rod’s bending strength can be evaluated. Analysis of the static test results also provides a reference to establish the dynamic testing matrix for the rod. Static testing is carried out using displacement control. It involves ramping both loading arms of the U-frame at 0.1 mm/s up to 12 mm, where 12 mm displacement is the machine stroke capacity. The procedure below is followed.
1. Perform the standard CIRFT static bending test beyond SNF rod yielding to failure or up to device displacement or loading capacity.
2. If the machine capacity is reached before specimen failure or the specimen yield strength is reached, repeat unidirectional static testing using the same conditions for a few more loading/unloading cycles or to specimen failure, whichever comes first.
3. If the SNF rod does not fail after 3–4 static loading/unloading cycles, apply the cyclic dynamic test to fracture the test specimen to support postmortem examination. Such a cyclic test is called a post-static dynamic test, and it is performed to differentiate the test results from other dynamic tests since it is likely that the static test has deflected the sample beyond
(a) (b)

CIRFT Data Update and Data Analyses for Spent Nuclear Fuel Vibration Reliability Study, Rev. 1 July 28, 2017 13
yield and has perhaps affected the bonding, in addition to significant residual stress generated in clad materials.
4. Collect and weigh any fuel fragments that may have dislodged during the test. The loading processes to be used after the first loading cycle were suggested because the device may not have sufficient stroke to test these specimens to failure.
1.4.2 Dynamic CIRFT Testing Dynamic testing consists of two major activities—dynamic real-time online monitoring and periodic quasistatic deformation measurements (see Figure 9).
Figure 9. Flowchart for cyclic testing of SNF rod.
The procedure is as follows:
1. Perform the dynamic cyclic test under constant load control using a sine wave input in reverse bending mode.
2. Set the cycle frequency at 5 Hz and select the amplitudes for individual cycle tests considering the target cycles to be achieved with each test.
3. Monitor the SNF fatigue evolution with defined intervals, performing static measurements of (a) the rod deformation at the end of each target cycle with a frequency of 0.05 Hz and (b) reduced loading amplitude relative to the dynamic loading amplitude under displacement control.
4. Stop the dynamic test when failure/clad fracture is detected or the preselected number of cycles is reached.
5. Weigh any fuel fragments that fall out of the fracture.
1.4.3 Data Processing Measurement data and online monitoring data are converted into the applied moment and curvature based on the load channel (load1 and load2) information, the loading arm length (101.60 mm), and LVDT data (LVDT1, 2, and 3). This information is used to generate the time series plots of moment and curvature and the moment-curvature hysteresis loops such as those illustrated in Figure 10 for D1. The data are

CIRFT Data Update and Data Analyses for Spent Nuclear Fuel Vibration Reliability Study, Rev. 1 14 July 28, 2017
processed using the approach defined in Section 1.2 for the applied deflection, moment, strain, and stress. The calculation of stress disregards the difference of elastic moduli between cladding and pellets. The gauge strain is then:
ɛ = κ × ymax. (12)
Figure 10. Moment and curvature as a function of time and moment-curvature loops based on measurements when (a) N=1 and (b) N = 111,000 cycles for D1 (607C4B). Measurements were made with 0.8 and 1.2 mm
relative displacements; Nf = 1.1 × 10⁵ cycles under ±15.24 N∙m, 5 Hz.
The relations of moment-range versus curvature-range and flexural rigidity are illustrated in Figure 11.
(a) (b)

CIRFT Data Update and Data Analyses for Spent Nuclear Fuel Vibration Reliability Study, Rev. 1 July 28, 2017 15
Figure 11. (a) Moment-curvature relation and (b) moment-flexural rigidity relation at various numbers of cycles for D1 (607C4B); Nf = 1.1 × 10⁵ cycles under ±15.24 N∙m, 5 Hz.
Most of the rigidity degradation occurred in the first 1,000 cycles. Variations of these quantities as a function of the number of cycles are provided in Figure 12. The flexural rigidity of the measurements at two displacements converged before the failure and exhibited a slightly declining trend.
Figure 12. Variations of (a) curvature range, (b) moment range, (c) and flexural rigidity as a function of the number of cycles for D1 (607C4B); Nf = 1.1 × 10⁵ cycles under ±15.24 N∙m, 5 Hz.
(a) (b)
N (cycles)
10 0 10 1 10 2 10 3 10 4 10 5 10 6
Mom
ent r
ange
(Nm
)
0
5
10
15
20
measdl1.inp
0.8
1.2
N (cycles)
10 0 10 1 10 2 10 3 10 4 10 5 10 6
Flex
ural
rigi
dity
(Nm
2)
0
10
20
30
40
50
60
70
80
measdl1.inp
0.8
1.2
(c)
N (cycles)
10 0 10 1 10 2 10 3 10 4 10 5 10 6
Cur
vatu
re ra
nge
(m-1
)
0
0.05
0.1
0.15
0.2
0.25
0.3
0.35
0.4measdl1.inp
0.8
1.2
(a) (b)
CIRFT Data Update and Data Analyses for Spent Nuclear Fuel Vibration Reliability Study, Rev. 1 16 July 28, 2017
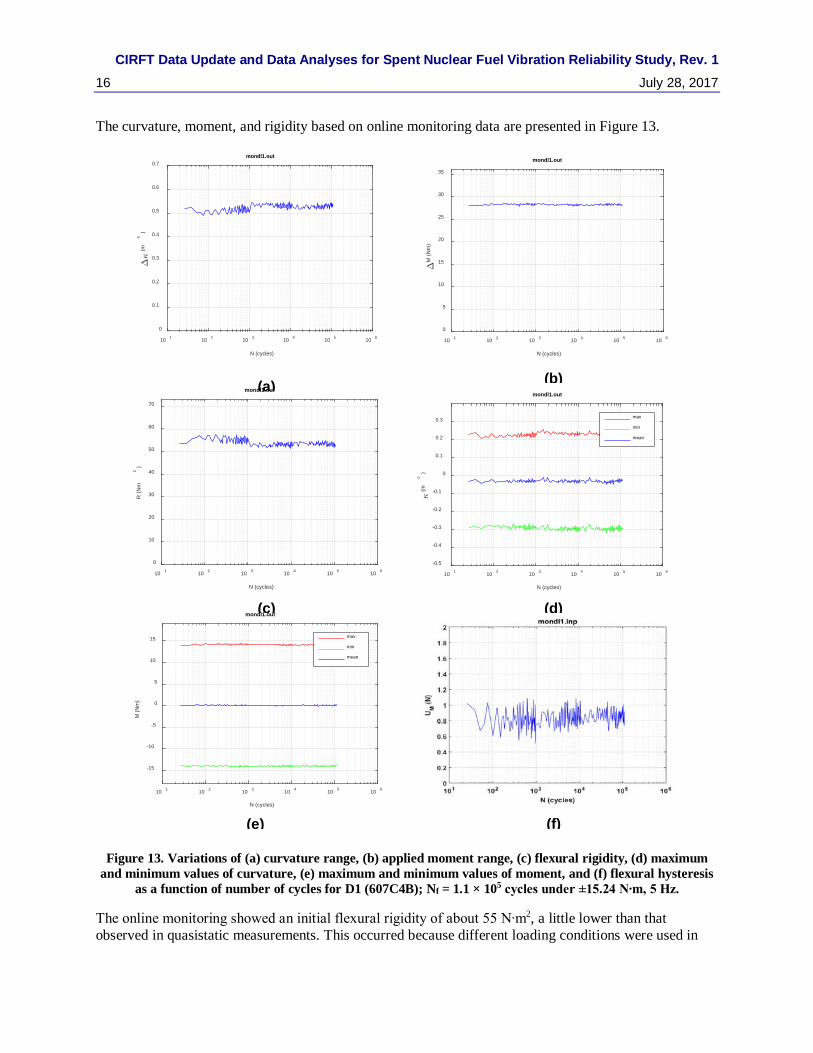
The curvature, moment, and rigidity based on online monitoring data are presented in Figure 13.
Figure 13. Variations of (a) curvature range, (b) applied moment range, (c) flexural rigidity, (d) maximum and minimum values of curvature, (e) maximum and minimum values of moment, and (f) flexural hysteresis
as a function of number of cycles for D1 (607C4B); Nf = 1.1 × 10⁵ cycles under ±15.24 N∙m, 5 Hz.
The online monitoring showed an initial flexural rigidity of about 55 N∙m2, a little lower than that observed in quasistatic measurements. This occurred because different loading conditions were used in
N (cycles)
10 1 10 2 10 3 10 4 10 5 10 6
R (N
m2
)
0
10
20
30
40
50
60
70
mondl1.out
N (cycles)
10 1 10 2 10 3 10 4 10 5 10 6
(m-1
)
0
0.1
0.2
0.3
0.4
0.5
0.6
0.7mondl1.out
N (cycles)
10 1 10 2 10 3 10 4 10 5 10 6
M (N
m)
0
5
10
15
20
25
30
35
mondl1.out
N (cycles)
10 1 10 2 10 3 10 4 10 5 10 6
M (N
m)
-15
-10
-5
0
5
10
15
mondl1.out
max
min
mean
N (cycles)
10 1 10 2 10 3 10 4 10 5 10 6
(m-1
)
-0.5
-0.4
-0.3
-0.2
-0.1
0
0.1
0.2
0.3
mondl1.out
max
min
mean
(a) (b)
(c) (d)
(e) (f)

CIRFT Data Update and Data Analyses for Spent Nuclear Fuel Vibration Reliability Study, Rev. 1 July 28, 2017 17
quasistatic measurement and online measurements. A curvature range of less than 0.3 m-1 was used in the quasistatic measurement, which is lower than that used in the online measurement of the cyclic test, to ensure that the measurement process did not affect the dynamic cycle data.
In general, the flexural rigidity tends to increase with decreasing curvature. This is likely due to a better interface bond at a relatively low load resulting in less stiffness reduction. Overall, a stable rod response was exhibited before the final failure. The curvature-cycle history shown in Figure 13(d), it clearly indicated a non-symmetric deformation under reversal loading, where the cladding tension site has much higher deformation (about 1.6 times) compared to that at cladding compression site. This phenomenon could be the consequence of debonding at the PPI and the stress concentration occurring at the PPI region at the tension side of the cladding, in addition to sensor probe sensitivity.
In general, flexural hysteresis, shown in Figure 13(f), remains quite uniform throughout the reversal bending test except with slight reductions at higher cycles. Similar flexural hysteresis reduction at a higher cycle was also observed from the periodic measurement data shown in Figure 10; at 1.1 × 10⁵ cycle, the moment-curvature loading and unloading curves had a smaller loop compared to that of 26th cycle. Under relatively low loading amplitude of dynamic testing, the clad or fuel pellet would be mainly under linear elastic behavior. The root cause of hysteresis energy dissipation under cyclic loading could be the system’s nonlinear response associated with segment pellets induced by stress concentration at interface regions, as well as uncertainly resulting from sensor probe sensitivity.
Figure 14 shows the moment and curvature time history, which are based on online monitoring data collected during dynamic test at 26 and 1.1 × 10⁵ cycles. The asymmetrical curvature deformation mode of the tested rod at the 26th cycle and 1.1 × 10⁵ cycle was also observed.
Figure 14. Moment and curvature as a function of time and moment-curvature loops at (a) 26 and (b) 1.10 × 10⁵ cycles; results based on online monitoring. The unsymmetrical curvature
deformation of the tested rod at the 26th cycle and 1.1 × 10⁵ cycle was also observed.
CIRFT Data Update and Data Analyses for Spent Nuclear Fuel Vibration Reliability Study, Rev. 1 18 July 28, 2017
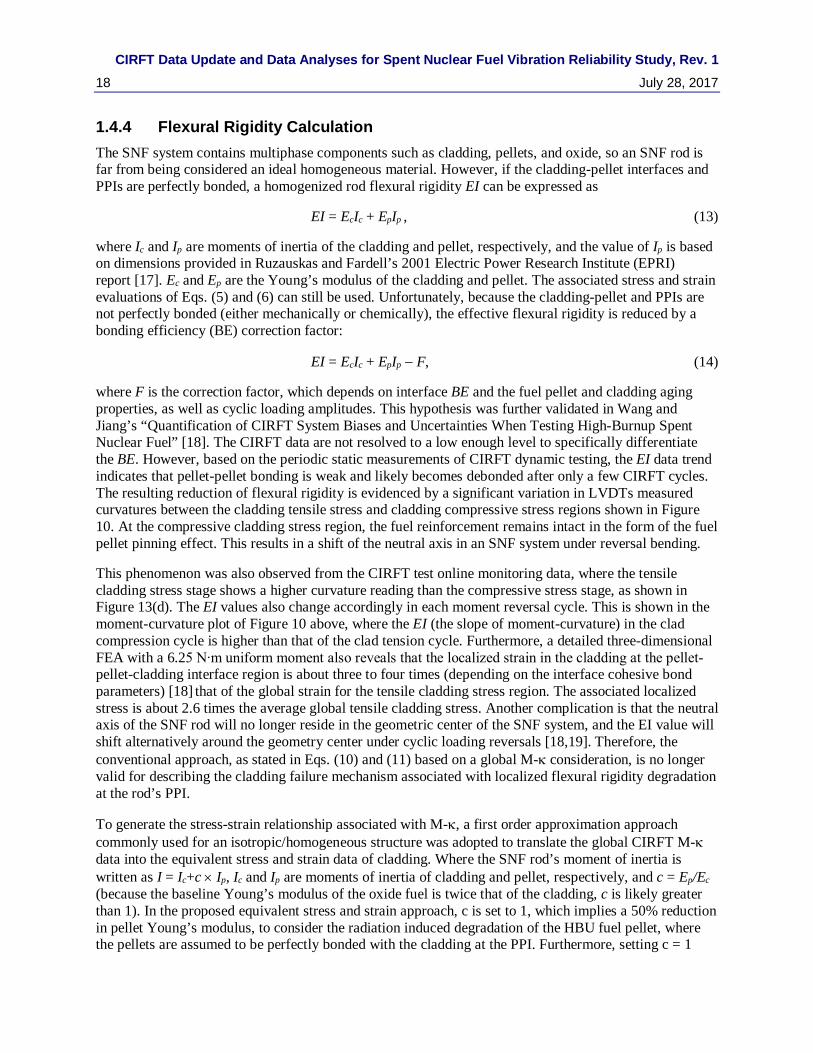
1.4.4 Flexural Rigidity Calculation The SNF system contains multiphase components such as cladding, pellets, and oxide, so an SNF rod is far from being considered an ideal homogeneous material. However, if the cladding-pellet interfaces and PPIs are perfectly bonded, a homogenized rod flexural rigidity EI can be expressed as
EI = EcIc + EpIp , (13)
where Ic and Ip are moments of inertia of the cladding and pellet, respectively, and the value of Ip is based on dimensions provided in Ruzauskas and Fardell’s 2001 Electric Power Research Institute (EPRI) report [17]. Ec and Ep are the Young’s modulus of the cladding and pellet. The associated stress and strain evaluations of Eqs. (5) and (6) can still be used. Unfortunately, because the cladding-pellet and PPIs are not perfectly bonded (either mechanically or chemically), the effective flexural rigidity is reduced by a bonding efficiency (BE) correction factor:
EI = EcIc + EpIp − F, (14)
where F is the correction factor, which depends on interface BE and the fuel pellet and cladding aging properties, as well as cyclic loading amplitudes. This hypothesis was further validated in Wang and Jiang’s “Quantification of CIRFT System Biases and Uncertainties When Testing High-Burnup Spent Nuclear Fuel” [18]. The CIRFT data are not resolved to a low enough level to specifically differentiate the BE. However, based on the periodic static measurements of CIRFT dynamic testing, the EI data trend indicates that pellet-pellet bonding is weak and likely becomes debonded after only a few CIRFT cycles. The resulting reduction of flexural rigidity is evidenced by a significant variation in LVDTs measured curvatures between the cladding tensile stress and cladding compressive stress regions shown in Figure 10. At the compressive cladding stress region, the fuel reinforcement remains intact in the form of the fuel pellet pinning effect. This results in a shift of the neutral axis in an SNF system under reversal bending.
This phenomenon was also observed from the CIRFT test online monitoring data, where the tensile cladding stress stage shows a higher curvature reading than the compressive stress stage, as shown in Figure 13(d). The EI values also change accordingly in each moment reversal cycle. This is shown in the moment-curvature plot of Figure 10 above, where the EI (the slope of moment-curvature) in the clad compression cycle is higher than that of the clad tension cycle. Furthermore, a detailed three-dimensional FEA with a 6.25 N∙m uniform moment also reveals that the localized strain in the cladding at the pellet-pellet-cladding interface region is about three to four times (depending on the interface cohesive bond parameters) [18] that of the global strain for the tensile cladding stress region. The associated localized stress is about 2.6 times the average global tensile cladding stress. Another complication is that the neutral axis of the SNF rod will no longer reside in the geometric center of the SNF system, and the EI value will shift alternatively around the geometry center under cyclic loading reversals [18,19]. Therefore, the conventional approach, as stated in Eqs. (10) and (11) based on a global M-κ consideration, is no longer valid for describing the cladding failure mechanism associated with localized flexural rigidity degradation at the rod’s PPI.
To generate the stress-strain relationship associated with M-κ, a first order approximation approach commonly used for an isotropic/homogeneous structure was adopted to translate the global CIRFT M-κ data into the equivalent stress and strain data of cladding. Where the SNF rod’s moment of inertia is written as I = Ic+c × Ip, Ic and Ip are moments of inertia of cladding and pellet, respectively, and c = Ep/Ec (because the baseline Young’s modulus of the oxide fuel is twice that of the cladding, c is likely greater than 1). In the proposed equivalent stress and strain approach, c is set to 1, which implies a 50% reduction in pellet Young’s modulus, to consider the radiation induced degradation of the HBU fuel pellet, where the pellets are assumed to be perfectly bonded with the cladding at the PPI. Furthermore, setting c = 1

CIRFT Data Update and Data Analyses for Spent Nuclear Fuel Vibration Reliability Study, Rev. 1 July 28, 2017 19
implies the same E properties for the fuel and the cladding, which allows Eqs. (10) and (11) to be used under the homogenous properties hypothesis for an equivalent stress and strain evaluation. Generally, the moment range (∆M), curvature range (∆κ), and flexural rigidity EI are used to characterize the mechanical properties of the fuel rod. These are defined as:
∆M = Mmax − Mmin, (15)
∆κ = κmax − κmin,
EI = ∆M / ∆κ,
where the subscripts max and min represent the maximum and minimum waveforms.
Under a load-controlling mode, the curvature response of a rod is not necessarily symmetric in one cycle of loading. The offset of the M-κ loop on the κ axis with respect to the origin can be described by a mean value of curvatures, κm:
κm = 0.5 × (κmax + κmin), (16)
and the maximum of absolute curvature extremes, |κ|max, is
),max( minmaxmaxκκκ = . (17)
For a given specimen, the |κ|max given by Eq. (16) corresponds to the curvature that creates the maximum tensile stress in the cladding. The resistance force of the CIRFT system may be significant, depending on the amplitude of the rigid arm movement. The CIRFT system static resistance force was measured at different displacement levels without a specimen loaded. The net applied load at each displacement level was estimated by subtracting the measured resistance from the applied static test load shown in Figure 15.
Figure 15. Empty-run conducted without specimen installed for which the load and displacement were plotted; associated with static test on D1.
0 50 100 150 200-2
0
2
4
6
8
10
12
14
Time (sec)
Dis
p (m
m)
test001.dat
disp1disp2
0 50 100 150 200-5
0
5
10
15
20
25
Time (sec)
Rel
ativ
e D
isp
(mm
)
test001.dat
0 50 100 150 200-20
-10
0
10
20
30
40
50
60
70
80
Time (sec)
Load
(N
)
test001.dat
load1load2
0 50 100 150 200-20
-10
0
10
20
30
40
50
60
70
Time (sec)
Aver
age
Load
(N)
test001.dat

CIRFT Data Update and Data Analyses for Spent Nuclear Fuel Vibration Reliability Study, Rev. 1 20 July 28, 2017
The CIRFT system resistance was tested and evaluated by using empty runs in which the specimen was not loaded on the testing machine. These empty runs were conducted in the specified period or whenever the calibration is needed.

CIRFT Data Update and Data Analyses for Spent Nuclear Fuel Vibration Reliability Study, Rev. 1 July 28, 2017 21
2. STATIC CIRFT TEST DATA ANALYSES 2.1 Characteristics of Moment-Curvature Curve The CIRFT test moment-curvature responses of SNF rod specimens were similar. They are characterized by two distinct linear responses, EI1 and EI2, followed by EI3, a nonlinear response during the loading and a linear response upon unloading. It was observed that when reloaded, the rod followed the unloading curve linearly and proceeded with the nonlinear response after passing the previous maximum load. Such loading/unloading/reloading responses occur in many mechanical systems where irreversible changes take place during loading [3]. An effort was made to characterize the moment-curvature response based on characteristic points to facilitate understanding of the test results. The values for EI1, EI2, and EI3 were obtained, corresponding to the slopes of the first and second linear segments and of the unloading segment, by using curve fitting with the first order polynomial (Figure 16).
Figure 16. Characteristic points of moment-curvature curve.
The characteristic curvatures and moments at the slopes’ changed points A and B were then identified. In addition, the moment at point C corresponding to a 0.37 m−1 irreversible curvature, or 0.2% equivalent plastic strain, was found by using a line with the same slope as that of unloading, EI3, and horizontal axis intercept 0.37 m−1. The quantities corresponding to points A, B, and C are designated as κA, κB, κC, and MA, MB, and MC. The results are summarized in Table 1. For an as-irradiated specimen, EI1, EI2, and EI3 are generally in decreasing order, with a marginal difference between EI2 and EI3. The characteristics derived from equivalent stress-strain curves are provided in Table 2. The LMK with Zry2 cladding has similar dimension as that of HBR with Zry-4 cladding, except LMK data have higher curvature than HBR data. In general, due to relatively smaller geometry of M5 cladding compared to Zry-4 cladding, the flexural rigidity of SNF with M5 cladding is lower than that of SNF with Zry-4 cladding.

CIRFT Data Update and Data Analyses for Spent Nuclear Fuel Vibration Reliability Study 22 July 28, 2017
Table 1. Characteristic points and quantities based on curvature-moment curves.
Spec ID Seg. ID
EI1 EI2 EI3 κA κB κC κD MA MB MC MD
N∙m2 N∙m2 N∙m2 m−1 m−1 m−1 m−1 N∙m N∙m N∙m N∙m
HBR S1 606C3C 76.34 58.384 50.939 0.204 0.923 2.006 2.153 16.524 58.518 83.279 84.702
HBR S2 605D1E 73.016 60.848 52.699 0.32 1.009 2.001 2.154 20.18 62.133 85.914 87.294
HBR Dcal 609C5 71.517 59.369 47.101 0.311 0.933 2.149 2.308 22.338 59.288 83.728 85.235
HBR Scal 609C6 63.117 54.849 41.704 0.503 0.862 2.329 2.507 28.54 48.244 81.656 85.02
HBR HR2* 607D4A 62.769 41.517 55.027 0.487 1.007 1.585 2.158 30.301 51.884 66.809 79.606
LMK LMK01 574D-A 61.984 53.636 43.217 0.425 0.761 2.208 2.756 24.462 42.468 80.293 85.343
MOX MOX01 MOX-A-11 34.308 26.269 26.833 0.292 1.204 1.88 2.685 8.643 32.603 39.256 46.76
MOX MOX03 MOX-A-13 34.846 24.821 28.76 0.444 0.975 1.674 2.465 12.858 26.041 36.173 47.121
NA NA3 651D3 29.738 26.154 25.529 0.545 1.13 1.946 2.845 14.312 29.611 39.082 46.805
*Hydride reorientation (HR) test sample
Table 2. Characteristic points and quantities based on equivalent stress-strain curves.
Spec ID Seg. ID
E1 E2 E3 ɛA ɛB ɛC ɛD σA σB σC σD
GPa GPa GPa % % % % MPa MPa MPa MPa
HBR S1 606C3C 121.648 93.035 81.172 0.11 0.497 1.079 1.158 141.663 501.674 713.954 726.149
HBR S2 605D1E 116.704 97.255 84.23 0.172 0.542 1.075 1.157 173.206 533.284 737.397 749.247
HBR Dcal 609C5 114.654 95.178 75.511 0.167 0.501 1.154 1.239 192.306 510.412 720.813 733.788

CIRFT Data Update and Data Analyses for Spent Nuclear Fuel Vibration Reliability Study July 28, 2017 23
HBR Scal 609C6 101.069 87.83 66.781 0.27 0.463 1.251 1.346 245.417 414.854 702.162 731.089
HBR HR2* 607D4A 99.543 65.841 87.266 0.262 0.542 0.853 1.161 258.53 442.672 570.012 679.201
LMK LMK01 574D-A 83.219 72.011 58.023 0.243 0.434 1.261 1.574 187.571 325.63 615.663 654.39
MOX MOX01 MOX-A-11 88.357 67.654 69.106 0.14 0.578 0.902 1.289 106.856 403.086 485.349 578.125
MOX MOX03 MOX-A-13 89.742 63.926 74.069 0.213 0.468 0.804 1.184 158.974 321.959 447.234 582.584
NA NA3 651D3 76.312 67.116 65.511 0.262 0.544 0.937 1.369 176.78 365.748 482.732 578.131
*HR test sample

CIRFT Data Update and Data Analyses for Spent Nuclear Fuel Vibration Reliability Study 24 July 28, 2017
For HBR rods, the E1 in the initial stage of the stress-strain curve was 101–125 GPa, and the 0.2% yield strength (σC) was 702–737 MPa. The ranges of the elastic modulus and the 0.2% yield strength appear consistent with the range of HBU HBR cladding [20]. However, the observation should not be overemphasized, because the results observed here based on equivalent stress approach and reflect a comprehensive global response of fuel rods with both pellets and cladding included. On the other hand, linear stages of HR2 are not defined as well as those in as-irradiated specimens. For as-irradiated rods, EI1 > EI2 > EI3. However, for HR2, EI1 > EI3 > EI2. Figure 16 above shows that the unloading curve drops rapidly before transitioning to a linear unloading response (EI3). This may indicate potential flaw formation such as gaps and cracks forming in the SNF system components or debonding occurring at the pellet-clad interfaces region. Static CIRFT testing indicated that the HR treatment has changed the SNF rod system’s characteristics when compared to an as-irradiated SNF rod and the associated SNF deformation response and damage mechanism under loading.
The HR2 sample had a lower flexural rigidity than the as-irradiated test segments. It would be expected that HR2 could therefore survive greater deformation before failure than the as-irradiated segments. However, due to limitations of the CIRFT test device, this could not be confirmed. Nevertheless, the flexural rigidity is consistently reduced under the similar curvature, and the maximum moment level of HR2 was reduced from 86 Nm of the as-irradiated to 80 Nm.
2.2 Comparison of Static Results with Pacific Northwest National Laboratory Zry-4 and ORNL M5 Cladding Data
To investigate the contribution of fuel pellets in the fuel rod structure, analysis was performed to compare the measured static results to predicted values considering cladding alone. The cladding properties used for this analysis were obtained from a database maintained by Pacific Northwest National Laboratory (PNNL) [21]. The database allows the user to specify the cladding type, temperature, fluence, and cold work of the cladding of interest. For this study, the following values were specified:
• Cladding – Zry-4
• Temperature – 75 °F
• Fluence – 12 × 1025 n/m2
• Cold work – 0.5
• Cladding ID – 9.25 mm
• Cladding OD – 10.7 mm
• Cladding thickness – 0.76 mm
• Calculated cladding moment of inertia (Ic) – 2.971 x 10⁻¹⁰ m4
Using these values in the PNNL database, the Young’s modulus Ec was given as 9.15 × 10¹⁰ Pa, the yield stress 919 MPa, the uniform elongation 0.00393, and the ultimate tensile strength 976 MPa. From these values, the engineering stress and strain values can be calculated. The ORNL M5 data were obtained from SNF M5 cladding tubing tensile tests as reported in Morris et al., “MOX PIE Fuel and Clad Examination Final Report” [22].
The CIRFT LVDTs measured the global rod deformation within the gauge section. Thus, the stress-strain estimate is an average evaluation throughout the gauge section that covers several pellet lengths with

CIRFT Data Update and Data Analyses for Spent Nuclear Fuel Vibration Reliability Study July 28, 2017 25
several PPIs. For the linear response of the cladding region of the rod away from the PPI, evaluation of the stress and strain can be a straightforward composite flexural rigidity formulation due to a relatively good bond at the pellet-cladding interface. However, due to the composite structure segmented pellets, the localized stress riser or curvature magnification at the PPI region cannot be estimated directly from the equivalent stress and strain approach; instead, it must be evaluated using FEA [18,19]. To estimate the contribution of the fuel pellets to the composite bending response, the comparison based on CIRFT M-κ

CIRFT Data Update and Data Analyses for Spent Nuclear Fuel Vibration Reliability Study 26 July 28, 2017
data was completed as shown in Figure 17 below.
(a)

CIRFT Data Update and Data Analyses for Spent Nuclear Fuel Vibration Reliability Study July 28, 2017 27
Figure 17. (a) Comparison of static M5 CIRFT test data with theoretical ORNL moment-curvature derived from ORNL M5 cladding only stress-strain data, and (b) comparison of all static
CIRFT test data with theoretical PNNL and ORNL moment-curvature derived from PNNL Zry-4 and ORNL M5 cladding only stress-strain data.
(b)

CIRFT Data Update and Data Analyses for Spent Nuclear Fuel Vibration Reliability Study 28 July 28, 2017
For comparison, the PNNL Zry-4 and ORNL M5 data (σ−ε curve) were converted to moment-curvature curves (shown in Figure 17 as PNNL and ORNL) using the following equations, with the consideration of stress distribution that is appropriate for a thin-walled tube under uniform bending,
M = σ·I/ymax, (18)
and,
κ = ε/ymax, (19)
where I = Ic, and other quantities have the same meanings as those in Eqs. (1–6).
The hypothetical cladding only moment-curvature response was plotted, together with moment-curvature response of the HBU fuel rod system as shown in Figure 17, where data for the SNF rod show much higher flexural rigidity compared to data from PNNL and ORNL with cladding alone. From the stress vs. strain plot, it also clearly indicated that the estimate equivalence stress of a composite SNF system is lower than that of the cladding-only stress-strain data for Zry-4 and M5 cladding. A comparison of CIRFT testing results with cladding-only rigidity based on PNNL and ORNL data is given in Table 3.
Table 3. Comparison of flexural rigidity results between CIRFT testing and PNNL and ORNL data.
EI1 (N⋅M²) EI2 (N⋅M²) EI3 (N⋅M²)
HBR (Zry) 71.576 58.099 48.133
HR2 (Zry-4) 62.769 41.517 43.333
LMK (Zry-2) 61.984 53.636 43.217
PNNL data (Zry-4) 26.933
MOX (M5) 34.577 25.545 27.7965
NA (M5) 29.738 26.154 25.529
ORNL data (M5) 16.458
The data comparison for Zry-4 cladding materials shows a distinct difference from that of the HBU fuel rod systems which was observed in the slope of the PNNL data. The slopes of both the as-irradiated and HR-treated HBU fuel rod systems are greater than that shown in the PNNL data. By focusing on the initial slope between 0–15 N∙m, the slope (flexural rigidity) of HBU fuel rods was approximately twice that of the PNNL data for cladding alone. The similar phenomenon was also observed for SNF rods with M5 cladding materials.
The increase of SNF rod system stiffness is attributed to the fuel’s mechanical properties and moment of inertia. However, the measured flexural rigidity of a fuel rod system is much less than that estimated from a direct summation of EcIc + EpIp , assuming a perfect mechanical bond between the fuel and the cladding, perfect bonding between the PPIs and a single pellet. However, bonding at fuel-cladding and fuel PPIs is not perfect and evolves during the test, in addition to pellets’ segmentation. The initial fuel-clad gap size also influences the system’s response. Furthermore, due to segmental pellet structure, numerous stress

CIRFT Data Update and Data Analyses for Spent Nuclear Fuel Vibration Reliability Study July 28, 2017 29
concentration sites are created within cladding at PPIs in an SNF rod. In general, the stress concentration sites cause the structure to have accelerated aging or reduced lifetime as compared to the very same system without stress concentration sites or discontinuous materials interfaces. The stress concentration effect due to an HBU rod segment structure was further validated from the dynamic testing, where the CIRFT test specimens are all failed at PPIs. Moreover, the intensity of the stress concentration or the pellet-clad interaction is strongly dependent on the loading intensity. Thus, at a low loading level, the PPI stress risers are expected to be small, so cladding alone likely dictates the SNF rod’s composite flexural response.
All these factors affect the degree to which the presence of fuel results in an increase in the rod’s flexural rigidity relative to cladding alone. This research effort did not attempt to account for and quantify each of these factors. Thus, the preliminary conclusion based on CIRFT SNF static bending testing is that flexural rigidity was approximately twice what would be obtained if cladding properties alone were used to predict behavior.
2.3 The Equivalence Stress Approach Verification and Benchmark 2.3.1 Equivalent Stress-Strain Approach Methodology The equivalent stress-strain methodology proposed in Section 1 is described below.
The equivalent stress was calculated using
σ = M × ymax/I, (3)
and, the equivalent strain is determined using
ɛ = κ × ymax. (4)
where, I is the moment of inertia of the composite SNF rod, and ymax is the maximum distance to the neutral axis of the test rod for the section and is measured by the radius of the cladding.
M-κ, which is a first order approximation approach commonly used for an isotropic/homogeneous structure, was adopted to translate the global CIRFT M-κ data into an equivalent stress and strain of the cladding. For this approximation, the SNF rod’s moment of inertia is written as
I = Ic + c × Ip, (5)
where, Ic and Ip are moments of inertia of the cladding and pellet, respectively, and c = Ep/Ec. (Because the baseline Young’s modulus of the oxide fuel is twice that of the cladding, c is likely greater than 1.) In the proposed equivalent stress and strain approach, c is set to 1, which implies a 50% reduction in the pellet Young’s modulus to account for operationally induced degradation of the HBU fuel pellet.
The overall flexural rigidity is as follows, including the consideration of BE
EI = Ec Ic + c × Ec Ip, (20)
As shown in Figure 17, the EI (flexural rigidity) values decrease accordingly with increase of the curvature. The hypothesis of the equivalent stress-strain concept used in this report for different curvature ranges is examined herein.
Based on the HBR EI1 data of 71.6 Nm² in Table 3, representing the flexural rigidity in the initial stage of bending loading, the associated c value evaluation is described below.

CIRFT Data Update and Data Analyses for Spent Nuclear Fuel Vibration Reliability Study 30 July 28, 2017
• Ec is the cladding Young’s modulus of 91.5 GPa for HBU Zry-4 cladding. The outer diameter (OD) of the HBR cladding is 10.76 mm, and the inner diameter (ID) is 9.26 mm. The associated fuel pellet dimension is assigned as 9.26 mm in diameter.
• The estimated Ip is equal to 3.609 × 10⁻¹⁰ m4, and the estimate Ic,is equal to 2.971 × 10⁻¹⁰ m4. Substituting Ic, and Ip into Eq. 5, with c = 1, the estimated flexural rigidity based on the equivalent stress concept is 60.2 Nm², which is less than measurement EI data of 71.6 Nm². The estimated EcIc for cladding only is 27.18 Nm².
• By substituting measurement EI, EC, Ic, and Ip into Eq. (20) one can solve c = 1.345. This is larger than 1, which is the equivalent stress approach’s c value.
Based on HBR EI2 data of 58.1 Nm², representing the middle stage of loading shown in Figure 16, the estimated c value is equal to 0.936. This is less than 1 of the equivalent stress-strain method.
At 78 Nm load, the higher end portion of the moment-curvature curve, the estimate HBR EI shown on Figure 17(b) is 44.88 Nm². The associated c value is estimated as 0.536, which indicates that the significant system property changes already occurred within the SNF composite system. However, since c is greater than zero, this implies that fuel pellet is still providing support to the SNF composite system at such a loading level. The estimated stress on the cladding surface is 855 MPa, which is lower than the yield stress of 919 MPa shown in Figure 17(b) from PNNL data.
The study described above it shows that the c factor chosen in the equivalent stress approach as a constant is not correct or self-consistent. It also shows that the c factor is strongly dependent on the localized moment-curvature profile. Thus, a variable or localized EI derived from the secant line of the moment-curvature trend curve, dM/dκ, is preferred at the target loading and deformation level. Based on this methodology, a modified equivalent stress-strain approach was developed accordingly and described below.
2.3.2 The Development of Modified Equivalent Stress-Strain Methodology The CIRFT static test HBR Dscal data were used to illustrate the modified equivalent approach developed to translate the global moment-curvature measurement data into localized stress-strain profile data on the cladding surface. The moment-curvature plot and the associated equivalent stress-strain data of HBR Dscal, including PNNL data, are shown in Figure 18.
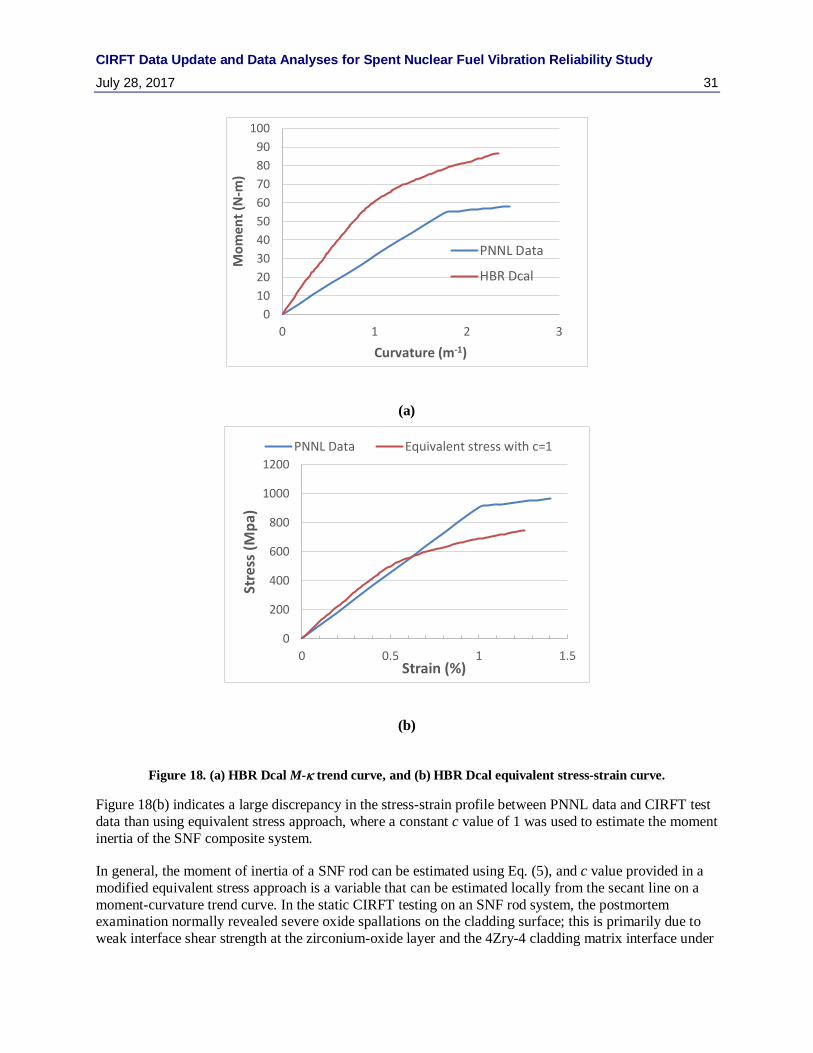
CIRFT Data Update and Data Analyses for Spent Nuclear Fuel Vibration Reliability Study July 28, 2017 31
(a)
(b)
Figure 18. (a) HBR Dcal M-κ trend curve, and (b) HBR Dcal equivalent stress-strain curve.
Figure 18(b) indicates a large discrepancy in the stress-strain profile between PNNL data and CIRFT test data than using equivalent stress approach, where a constant c value of 1 was used to estimate the moment inertia of the SNF composite system.
In general, the moment of inertia of a SNF rod can be estimated using Eq. (5), and c value provided in a modified equivalent stress approach is a variable that can be estimated locally from the secant line on a moment-curvature trend curve. In the static CIRFT testing on an SNF rod system, the postmortem examination normally revealed severe oxide spallations on the cladding surface; this is primarily due to weak interface shear strength at the zirconium-oxide layer and the 4Zry-4 cladding matrix interface under
0102030405060708090
100
0 1 2 3
Mom
ent (
N-m
)
Curvature (m-1)
PNNL Data
HBR Dcal
0
200
400
600
800
1000
1200
0 0.5 1 1.5
Stre
ss (M
pa)
Strain (%)
PNNL Data Equivalent stress with c=1

CIRFT Data Update and Data Analyses for Spent Nuclear Fuel Vibration Reliability Study 32 July 28, 2017
the flexural deformation. Thus, the oxide layer must be deducted from cladding radius for cladding surface stress evaluation.
In the modified equivalent stress approach, the localized EI can be obtained by dividing the moment M with the corresponding curvature κ, as shown in Figure 18(a), and the localized I value of Eq. (5) can then be estimated by dividing EI with Ec. Substituting I values into Eq. (3), the stress-strain profile on the cladding surface can be estimated accordingly, as illustrated in Figure 19. The ymax in Eq. (3) is equal to fuel cladding outer radius minus the surface oxide thickness. The oxide thickness of Dcal is 70–100 µm, so the mean value of 85µm was used as oxide thickness.
Figure 19 shows a significant improvement up to the Zry-4 yield strain level on the stress-strain curve evaluation from the modified equivalent approach compared to that of the equivalent stress approach, where PNNL data and the modified equivalent stress-strain profile have good agreement except at stress beyond the Zry-4 yield strain level. This is because there is a significant reduction in flexural rigidity EI beyond the cladding yield strain level. Therefore, the yield region’s Young’s modulus must be considered in addition to the initial linear-elastic Young’s modulus of Zry-4 cladding material for estimating the EI using the modified equivalent stress approach. Development of the modified equivalent stress approach that covers the cladding strain level beyond the yield strain is discussed further in Section 2.3.3.
Figure 19. Comparison of stress-strain curves from PNNL data, equivalent stress with c=1, and modified equivalent stress approach for HBR Dcal CIRFT test data.
2.3.3 The Development of Modified Equivalent Stress Approach (MESA) for Strain Level beyond Yield Strain
Based on the bilinear model of PNNL Zry-4 cladding data shown in Figure 18(b), the cladding has a yield stress, σy, of 919.49 MPa; a yield strain, εy, of 1% strain; and two Young’s modules, 91.5 GPa and 13.31 GPa, for linear-elastic and material hardening regions, respectively. From HBR Dcal data, at 1% yield cladding strain level, the associated cladding yield moment is at 79.97 Nm, and the corresponding
0
200
400
600
800
1000
1200
0 0.5 1 1.5
Stre
ss (M
Pa)
Strain (%)
PNNL DataEquivalent stress with c=1Modified Equivalent stress

CIRFT Data Update and Data Analyses for Spent Nuclear Fuel Vibration Reliability Study July 28, 2017 33
curvature, κy, is 1.863 m-1. The methodology developed for estimating the modified equivalent stress profile at the cladding surface beyond yield is described below. The stress level above the yield can be written as
σ = σy + ∆σ, ∆σ = ∆M × ymax /I, (21)
where ∆M = M - Myield = M – 79.97 Nm, and the associated moment inertia I can be written as shown below:
I = (∆M/∆κ)/E2 = (∆M/∆κ)/(13.31 GPa) ,
where ∆κ = κ - κy = κ - 1.863m-1.
Based on Eq. (21), the stress level beyond yield was calculated accordingly. For the Dcal CIRFT test, the final estimated modified equivalent stress-strain curve on the cladding surface is very close to that of PNNL data as shown in Figure 20. The details of the Dscal-MESA data are provided in Table 4, which shows significant reduction in the flexural rigidity and the moment of inertia at higher bending loading level.
Figure 20. The comparison of stress-strain curves from PNNL data, equivalent stress with c=1, and modified equivalent stress approach with oxide thickness correction factor applied and yield zone modulus update for
HBR Dcal CIRFT test data. The ORNL CIRFT stress-strain curve data match that of PNNL data.
The investigation described above indicated that MESA can effectively translate the global M-k response obtained from a CIRFT test to a local stress-strain curve on the SNF rod’s cladding surface. Such an
0
200
400
600
800
1000
1200
0 0.5 1 1.5
Stre
ss (M
Pa)
Strain (%)
PNNL DataEquivalent stress with c=1Dcal-MESA

CIRFT Data Update and Data Analyses for Spent Nuclear Fuel Vibration Reliability Study 34 July 28, 2017
approach will be applied to CIRFT static test data as presented in the next section, and the same methodology will be applied to all the CIRFT dynamic data in the next report period.
Table 4. Detailed Dcal CIRFT static test results and the associated MESA stress.
Curvature Moment Strain Flexural rigidity
Moment of inertia Stress
m-1 N-m % N-m² m4 MPa
0.0000 0.09 0.0000
0.00
0.0390 2.68 0.0209 68.87 7.5269E-10 18.87
0.0719 5.04 0.0386 70.06 7.6570E-10 34.84
0.1006 7.21 0.0540 71.65 7.8303E-10 48.73
0.1266 9.24 0.0680 72.94 7.9714E-10 61.35
0.1518 11.18 0.0815 73.66 8.0504E-10 73.54
0.1729 12.74 0.0928 73.71 8.0558E-10 83.75
0.1729 12.74 0.0928 73.71 8.0558E-10 83.75
0.1777 13.09 0.0954 73.65 8.0492E-10 86.10
0.2054 14.99 0.1102 73.00 7.9780E-10 99.50
0.2340 16.88 0.1256 72.13 7.8831E-10 113.36
0.2532 18.12 0.1359 71.57 7.8221E-10 122.67
0.2532 18.12 0.1359 71.57 7.8221E-10 122.67
0.2625 18.72 0.1409 71.33 7.7952E-10 127.18
0.2905 20.53 0.1560 70.65 7.7214E-10 140.76
0.3185 22.30 0.1710 70.01 7.6511E-10 154.30
0.3333 23.22 0.1789 69.66 7.6127E-10 161.47
0.3333 23.22 0.1789 69.66 7.6127E-10 161.47
0.3468 24.04 0.1862 69.33 7.5765E-10 168.04
0.3755 25.78 0.2016 68.65 7.5026E-10 181.93
0.4038 27.50 0.2168 68.10 7.4423E-10 195.62
0.4142 28.14 0.2223 67.94 7.4251E-10 200.67
0.4142 28.14 0.2223 67.94 7.4251E-10 200.67

CIRFT Data Update and Data Analyses for Spent Nuclear Fuel Vibration Reliability Study July 28, 2017 35
Curvature Moment Strain Flexural rigidity
Moment of inertia Stress
m-1 N-m % N-m² m4 MPa
0.4309 29.19 0.2313 67.75 7.4044E-10 208.76
0.4569 30.88 0.2453 67.57 7.3852E-10 221.38
0.4826 32.57 0.2591 67.48 7.3749E-10 233.84
0.4886 32.96 0.2623 67.46 7.3730E-10 236.74
0.4886 32.96 0.2623 67.46 7.3730E-10 236.74
0.5086 34.28 0.2730 67.40 7.3661E-10 246.43
0.5350 36.00 0.2872 67.29 7.3540E-10 259.18
0.5614 37.68 0.3014 67.12 7.3354E-10 272.01
0.5637 37.82 0.3026 67.10 7.3335E-10 273.11
0.5637 37.82 0.3026 67.10 7.3335E-10 273.11
0.5880 39.32 0.3156 66.87 7.3087E-10 284.86
0.6149 40.94 0.3301 66.58 7.2760E-10 297.93
0.6411 42.49 0.3442 66.27 7.2425E-10 310.62
0.6411 42.49 0.3442 66.27 7.2425E-10 310.62
0.6429 42.59 0.3451 66.25 7.2403E-10 311.47
0.6721 44.30 0.3608 65.92 7.2043E-10 325.61
0.7015 46.02 0.3766 65.60 7.1696E-10 339.86
0.7242 47.34 0.3888 65.37 7.1439E-10 350.87
0.7242 47.34 0.3888 65.37 7.1439E-10 350.87
0.7300 47.67 0.3919 65.31 7.1375E-10 353.67
0.7571 49.24 0.4064 65.04 7.1078E-10 366.79
0.7837 50.76 0.4207 64.77 7.0783E-10 379.68
0.8012 51.74 0.4301 64.59 7.0585E-10 388.17
0.8012 51.74 0.4301 64.59 7.0585E-10 388.17
0.8110 52.30 0.4354 64.48 7.0472E-10 392.94
0.8398 53.87 0.4508 64.15 7.0105E-10 406.85
0.8697 55.40 0.4669 63.70 6.9618E-10 421.35

CIRFT Data Update and Data Analyses for Spent Nuclear Fuel Vibration Reliability Study 36 July 28, 2017
Curvature Moment Strain Flexural rigidity
Moment of inertia Stress
m-1 N-m % N-m² m4 MPa
0.8850 56.13 0.4751 63.42 6.9311E-10 428.77
0.8850 56.13 0.4751 63.42 6.9311E-10 428.77
0.9006 56.82 0.4834 63.09 6.8955E-10 436.32
0.9322 58.13 0.5004 62.36 6.8149E-10 451.62
0.9642 59.38 0.5176 61.59 6.7306E-10 467.14
0.9755 59.82 0.5237 61.32 6.7018E-10 472.63
0.9755 59.82 0.5237 61.32 6.7018E-10 472.63
0.9964 60.64 0.5349 60.86 6.6510E-10 482.75
1.0294 61.89 0.5526 60.13 6.5713E-10 498.73
1.0642 63.09 0.5713 59.29 6.4796E-10 515.60
1.0717 63.33 0.5753 59.09 6.4582E-10 519.23
1.0717 63.33 0.5753 59.09 6.4582E-10 519.23
1.1018 64.20 0.5915 58.26 6.3677E-10 533.82
1.1418 65.24 0.6129 57.14 6.2447E-10 553.19
1.1831 66.30 0.6351 56.04 6.1247E-10 573.22
1.1856 66.37 0.6365 55.98 6.1180E-10 574.42
1.1856 66.37 0.6365 55.98 6.1180E-10 574.42
1.2250 67.44 0.6576 55.06 6.0171E-10 593.50
1.2673 68.60 0.6803 54.13 5.9160E-10 614.01
1.3065 69.60 0.7014 53.27 5.8221E-10 632.99
1.3065 69.60 0.7014 53.27 5.8221E-10 632.99
1.3103 69.69 0.7034 53.19 5.8128E-10 634.82
1.3540 70.65 0.7269 52.18 5.7027E-10 655.99
1.3984 71.53 0.7507 51.15 5.5901E-10 677.53
1.4330 72.19 0.7693 50.38 5.5056E-10 694.26
1.4330 72.19 0.7693 50.38 5.5056E-10 694.26
1.4436 72.39 0.7750 50.15 5.4804E-10 699.41

CIRFT Data Update and Data Analyses for Spent Nuclear Fuel Vibration Reliability Study July 28, 2017 37
Curvature Moment Strain Flexural rigidity
Moment of inertia Stress
m-1 N-m % N-m² m4 MPa
1.4893 73.27 0.7995 49.20 5.3768E-10 721.55
1.5352 74.16 0.8242 48.30 5.2790E-10 743.81
1.5637 74.70 0.8394 47.77 5.2210E-10 757.58
1.5637 74.70 0.8394 47.77 5.2210E-10 757.58
1.5811 75.03 0.8488 47.45 5.1863E-10 766.01
1.6267 75.88 0.8732 46.65 5.0983E-10 788.11
1.6724 76.74 0.8978 45.89 5.0151E-10 810.26
1.6950 77.18 0.9099 45.53 4.9761E-10 821.21
1.6950 77.18 0.9099 45.53 4.9761E-10 821.21
1.7185 77.63 0.9225 45.17 4.9369E-10 832.60
1.7649 78.51 0.9474 44.48 4.8617E-10 855.06
1.8107 79.29 0.9721 43.79 4.7857E-10 877.29
1.8264 79.52 0.9804 43.54 4.7586E-10 884.85
1.8264 79.52 0.9804 43.54 4.7586E-10 884.85
1.8556 79.90 0.9962 43.06 4.7057E-10 899.04
1.9004 80.39 1.0202 42.30 4.6233E-10 905.15
1.9469 80.94 1.0451 41.57 4.5435E-10 908.43
1.9565 81.07 1.0503 41.43 4.5284E-10 909.10
1.9565 81.07 1.0503 41.43 4.5284E-10 909.10
1.9964 81.66 1.0717 40.91 4.4706E-10 911.91
2.0458 82.47 1.0983 40.31 4.4057E-10 915.40
2.0902 83.16 1.1221 39.78 4.3480E-10 918.52
2.0922 83.18 1.1232 39.76 4.3451E-10 918.67
2.0922 83.18 1.1232 39.76 4.3451E-10 918.67
2.1266 83.59 1.1416 39.31 4.2959E-10 921.09
2.1622 84.01 1.1607 38.85 4.2462E-10 923.60
2.2023 84.66 1.1822 38.44 4.2012E-10 926.42

CIRFT Data Update and Data Analyses for Spent Nuclear Fuel Vibration Reliability Study 38 July 28, 2017
Curvature Moment Strain Flexural rigidity
Moment of inertia Stress
m-1 N-m % N-m² m4 MPa
2.2023 84.66 1.1822 38.44 4.2012E-10 926.42
2.2072 84.75 1.1849 38.40 4.1964E-10 926.77
2.2646 85.90 1.2157 37.93 4.1455E-10 930.82
2.3160 86.76 1.2433 37.46 4.0942E-10 934.44
2.3372 86.70 1.2547 37.10 4.0545E-10 935.93
2.3372 86.70 1.2547 37.10 4.0545E-10 935.93

CIRFT Data Update and Data Analyses for Spent Nuclear Fuel Vibration Reliability Study July 28, 2017 39
2.3.4 Applying Modified Equivalent Stress-Strain Approach to CIRFT Static Test Data
The developed MESA was applied to all the CIRFT static testing data. The required info to project global moment-curvature CIRFT data into local cladding surface stress-strain profile are listed in Table 5. The MESA results for HBR rods and LMK rod are shown in Figure 21 and for MOX and NA rods are shown in Figure 22, which show MRESA CIRFT test results has excellent agreement with that of PNNL and ORNL data obtained from tubing tensile test results.
Table 5. The yield strains and Young’s modulus from PNNL Zry-4 and ORNL M5 cladding materials
and the corresponding yield properties obtained from CIRFT testing data.
Spec ID Seg. ID
εy* EC1*/EC2* My κy σy Oxide Clad OD
% GPa N∙m m−1 MPa µm mm
HBR S1 606C3C 1.0 91.50/13.31 81.59 1.860 900.5 70–100 10.76
HBR S2 605D1E 1.0 91.50/13.31 84.08 1.860 906.7 40–70 10.76
HBR Dcal 609C5 1.0 91.50/13.31 79.97 1.863 902.5 70–100 10.76
HBR Scal 609C6 1.0 91.50/13.31 79.80 1.862 902.2 70–100 10.76
HBR HR2 607D4A 1.0 91.50/13.31 71.84 1.857 907.2 40–44 10.76
LMK LMK01 574D-A 1.0 91.50/13.31 73.96 1.751 914.0 <10 11.43
MOX MOX01 MOX-A-11 0.70 96.65/3.479 36.92 1.461 676.6 <10 9.60
MOX MOX03 MOX-A-13 0.70 96.65/3.479 33.87 1.461 676.7 <10 9.60
NA NA3 651D3 0.70 96.65/3.479 35.25 1.459 676.0 <20 9.626
*Based on PNNL Zry-4 [21] and ORNL M5 [22] cladding tensile data.

CIRFT Data Update and Data Analyses for Spent Nuclear Fuel Vibration Reliability Study 40 July 28, 2017
Figure 21. The comparison between PNNL Zry-4 data and cladding surface stress-strain profiles
obtained from CIRFT static tests for HBR rods, incluidng HRT sample of HR2 data.

CIRFT Data Update and Data Analyses for Spent Nuclear Fuel Vibration Reliability Study July 28, 2017 41
Figure 22. The comparison between ORNL M5 data and cladding surface stress-strain profiles obtained from CIRFT static tests for MOX and NA rods.

CIRFT Data Update and Data Analyses for Spent Nuclear Fuel Vibration Reliability Study 42 July 28, 2017
This page is intentionally left blank.

CIRFT Data Update and Data Analyses for Spent Nuclear Fuel Vibration Reliability Study July 28, 2017 43
3. DYNAMIC CIRFT TEST DATA ANALYSIS All the dynamic CIRFT test data were updated in this report period based on the correction factors developed for LVDTs’ spacing adjustment and LVDTs’ stem dynamic stability considerations; the newly developed MESA was also integrated into dynamic CIRFT test data for dynamic stress evaluations.
3.1 Data Analysis Results for Dynamic Tests The data sets for each of the dynamic tests, including periodic quasistatic measurement data and online dynamic real-time monitoring data, were processed following the procedure described in Section 1.
For each test,
1) The variations of curvature range, moment range, flexural rigidity, curvature peak/valley, and moment peak/valley are presented whenever they are available.
2) The curvature and moment plots are given for the beginning data block of a test session when the load reaches the designated level. The results for two test sessions are presented: the first (tested to 1,000 cycles) and last sessions.
3) Finally, the data based on online monitoring are presented, including the variations of curvature range, moment range, flexural rigidity, curvature peak/valley, and moment peak/valley as a function of number of cycles or the cycles to failure.
For each cyclic test, several sets of measurements were obtained between test sessions. These measurements were made with small displacement amplitudes at 0.05 Hz. With this input, both moment and curvature varied or decreased with the accumulated number of cycles. The obtained rigidities were generally higher than those from monitoring data, and the degree of change was similar to the monitoring data.
The corrected curvature depends on the spacing correction applied. Generally, the correction observed for the curvature is not significant because of the small input. However, the signal-to-noise ratio is reduced at lower input levels. The amplitude of de-noised curvature was lower compared with the original noisy data. The summary table of dynamic data is self-explanatory and includes the following columns:
1) TN: test number 2) Spec: Specimen ID 3) ID: inner diameter of cladding 4) OD: outer diameter of cladding 5) Dia: diameter of pellet 6) Load: load amplitude at the loading point of U-frame 7) N: number of cycles accumulated or the cycles to failure 8) Fail: 1 as failure, and 0 as no failure 9) ma: mean of moment amplitude (∆M/2) based on de-noised monitoring data 10) ma_std: standard deviation of moment amplitude (4 in. or 101.60 mm loading arm) based on de-
noised monitoring data 11) ka: mean of curvature amplitude (∆κ/2) based on corrected and de-noised monitoring data 12) ka_std: standard deviation of curvature amplitude based on corrected and de-noised monitoring
data

CIRFT Data Update and Data Analyses for Spent Nuclear Fuel Vibration Reliability Study 44 July 28, 2017
13) km: mean of curvature extreme values based on corrected and de-noised monitoring data, km = max{|κp|,|κv|}, where κp and κv are peak/valley values
14) km_std: standard deviation of curvature extremes based on corrected and de-noised monitoring data
15) R: mean of flexural rigidity 16) R_std: standard deviation of flexural rigidity 17) sa—: mean of equivalent stress amplitude (∆σ/2) based on de-noised monitoring data 18) sa_st: d – standard deviation of equivalent stress amplitude based on de-noised monitoring data 19) ea: mean of equivalent strain amplitude (∆ε/2) based on corrected and de-noised monitoring data 20) ea_std: standard deviation of equivalent strain amplitude based on corrected and de-noised
monitoring data 21) em: mean of strain extreme values based on corrected and de-noised monitoring data, em =
max{|εp|,|εv|}, where εp and εv are peak/valley values 22) em_std: standard deviation of strain extremes based on corrected and de-noised monitoring data 23) Lg2: mean of half gauge length, Lg/2 24) Lg2_std: standard deviation of half gauge length 25) dh: mean of sensor spacing correction, ∆h 26) dh_std: standard deviation of sensor spacing correction
3.2 CIRFT Evaluations of LMK Fuel Rods A total of 16 specimens—LM1–LM3 and LM5–LM17—were tested in a hot cell. LM1 was used in the tuning and static test. The remaining 15 specimens were used in dynamic tests. The dynamic tests were conducted with a range of moment amplitudes from 7.11–30.48 Nm. A total of 13 specimens failed with fatigue lives from 104 to 4.7 × 10⁶ cycles. LM12 and LM17 were cycled to more than 3.4 × 10⁶ cycles without failure. LM12 was stopped at 7.6 × 10⁶ cycles. LM17 was tested continuously at an increased amplitude of 30.48 Nm and failed at 1.3 × 10⁴ cycles. Major results for the dynamic tests are summarized in Table 6.
The plots based on the mean values of major quantities can be found in Figure 23(a–d), where the circles represent the tests with failure, and the circles with arrows designate the tests with no failure. The results obtained from the follow-up tests for LM1 and LM17 are also included.
As expected, the fatigue life increased with decreasing amplitude, but the variation was not continuous. A discontinuity, or knee point, was observed near 7 Nm and 0.2 m−1 in the moment–N and curvature–N curves. For this SNF, these parameters correspond to 50 MPa of equivalent stress and 0.1% of equivalent strain. At the same time, curvature extreme values were generally higher than curvature amplitudes as expected, but the difference was small.
The flexural rigidity was mostly shown to be either quite flat or featuring a decreasing trend with the number of cycles. Several tests also suggested a tendency to increase with number of cycles, including LMK2, 8, and 14. Overall, the degree of variation of rigidity is limited. Meanwhile, no relation of rigidity to the number of cycles to failure can be seen.
The effective half gauge length was found to be limited with a range between 38–50 mm and to increase with increased amplitude of moment. On the other hand, the sensor spacing correction did not suggest any relation to the moment amplitude.

CIRFT Data Update and Data Analyses for Spent Nuclear Fuel Vibration Reliability Study July 28, 2017 45

CIRFT Data Update and Data Analyses for Spent Nuclear Fuel Vibration Reliability Study 46 July 28, 2017
Table 6a. Dynamic test results for LMK SNF rods.
TN Spec Load N
Fail ma ma_std ka ka_std km km_std
N cycles Nm Nm m^1 m^−1 m^−1 m^−1
1 LM1 250.000 9.40E + 03 Y 23.426 0.087 0.739 0.027 0.826 0.027
2 LM2 125.000 1.71E + 05 Y 11.468 0.090 0.218 0.006 0.226 0.008
3 LM3 100.000 4.92E + 05 Y 9.016 0.081 0.199 0.008 0.212 0.011
5 LM5 85.000 2.49E + 05 Y 7.570 0.074 0.135 0.008 0.168 0.013
6 LM6 75.000 1.79E + 06 Y 6.488 0.071 0.126 0.008 0.165 0.008
7 LM7 150.000 1.22E + 05 Y 13.930 0.085 0.285 0.005 0.297 0.009
8 LM8 75.000 4.70E + 06 Y 6.601 0.077 0.105 0.007 0.157 0.007
9 LM9 100.000 7.31E + 05 Y 9.058 0.077 0.177 0.004 0.185 0.007
10 LM10 200.000 5.20E + 04 Y 18.903 0.089 0.402 0.004 0.407 0.005
11 LM11 85.000 3.55E + 05 Y 7.657 0.111 0.133 0.007 0.159 0.010
12 LM12 70.000 7.58E + 06 N 6.141 0.087 0.169 0.014 0.185 0.021
13 LM13 250.000 2.10E + 04 Y 21.396 2.415 0.437 0.071 0.453 0.073
14 LM14 100.000 3.90E + 05 Y 9.048 0.082 0.162 0.008 0.187 0.010
15 LM15 100.000 4.41E + 05 Y 8.997 0.073 0.185 0.007 0.189 0.007
16 LM16 300.000 1.36E + 04 Y 28.560 0.168 0.536 0.008 0.557 0.014
17 LM17 85.000 3.37E + 06 N 7.459 0.374 0.167 0.011 0.174 0.013
18 LM17 300.000 1.31E + 04 Y 28.063 0.131 0.699 0.006 0.708 0.011
Table 6b. Dynamic test results for LMK SNF rods.
TN Spec R R_std sa sa_std ea ea_std em em_std Lg2 Lg2_std dh dh_std
Nm^2 Nm^2 MPa MPa % % % % mm mm mm mm
1 LM1 31.73 0.809 385.67 0.667 0.422 0.015 0.472 0.015 43.766 0.767 0.279 0.182
2 LM2 52.59 0.891 113.86 0.691 0.124 0.004 0.128 0.005 44.250 0.634 −0.084 0.347
3 LM3 45.35 1.025 104.02 0.623 0.113 0.004 0.121 0.007 44.455 0.738 0.325 0.298
5 LM5 56.03 2.117 70.63 0.566 0.077 0.005 0.096 0.007 41.932 0.756 −1.436 0.577

CIRFT Data Update and Data Analyses for Spent Nuclear Fuel Vibration Reliability Study July 28, 2017 47
6 LM6 51.50 2.287 65.92 0.548 0.072 0.005 0.093 0.005 40.157 0.749 −1.723 0.312
7 LM7 49.00 0.586 148.53 0.656 0.162 0.003 0.169 0.005 45.455 0.565 −0.426 0.190
8 LM8 62.89 2.504 54.79 0.590 0.060 0.004 0.089 0.004 42.342 0.890 2.568 0.338
9 LM9 51.07 0.736 92.46 0.590 0.101 0.003 0.106 0.004 43.120 0.698 0.206 0.215
10 LM10 47.03 0.336 209.74 0.684 0.229 0.002 0.231 0.003 46.986 0.528 0.355 0.173
11 LM11 57.85 2.009 69.34 0.856 0.075 0.004 0.090 0.006 41.396 0.757 −1.864 0.362
12 LM12 36.44 1.859 88.18 0.665 0.096 0.008 0.106 0.012 38.475 0.965 0.732 0.683
13 LM13 49.05 0.903 228.15 18.563 0.248 0.040 0.258 0.042 47.411 0.705 −0.138 0.143
14 LM14 55.68 1.768 84.75 0.632 0.093 0.005 0.107 0.006 44.092 0.781 −1.307 0.387
15 LM15 48.79 1.219 96.31 0.561 0.105 0.004 0.107 0.004 44.196 0.698 −0.148 0.585
16 LM16 53.26 0.480 279.94 1.295 0.305 0.005 0.317 0.008 50.296 0.440 −0.435 0.153
17 LM17 44.67 1.138 87.32 2.872 0.095 0.006 0.099 0.007 44.656 0.919 −0.849 0.338
18 LM17 40.14 0.252 365.12 1.004 0.398 0.003 0.403 0.006 47.420 0.331 1.211 0.092
(a)
y = 308.34x-0.269
R² = 0.901
0
5
10
15
20
25
30
1.00E+03 1.00E+04 1.00E+05 1.00E+06 1.00E+07
Mom
ent (
N-m
)
Nf(Cycles)
LMK failedLMK Non-FailedPower (LMK failed)

CIRFT Data Update and Data Analyses for Spent Nuclear Fuel Vibration Reliability Study 48 July 28, 2017
(b)
y = 6443.6x-0.326
R² = 0.8976
0
50
100
150
200
250
300
350
400
450
1.00E+03 1.00E+04 1.00E+05 1.00E+06 1.00E+07
Stre
ss (M
Pa)
Nf(Cycles)
LMK failedLMK Non-FailedPower (LMK failed)

CIRFT Data Update and Data Analyses for Spent Nuclear Fuel Vibration Reliability Study July 28, 2017 49
(c)
(d)
Figure 23. (a) Moment amplitude, (b) stress amplitude, (c) curvature amplitude/ maximum, and (d) strain amplitude/maximum as a function of cycles or cycles to failure.
y = 12.353x-0.326
R² = 0.8974
0
0.1
0.2
0.3
0.4
0.5
0.6
0.7
0.8
1.00E+03 1.00E+04 1.00E+05 1.00E+06 1.00E+07
Curv
atur
e (m
-1)
Nf(Cycles)
LMK failedLMK Non-FailedPower (LMK failed)
y = 7.0099x-0.326
R² = 0.897
0
0.05
0.1
0.15
0.2
0.25
0.3
0.35
0.4
0.45
1.00E+03 1.00E+04 1.00E+05 1.00E+06 1.00E+07
Stra
in (%
)
Nf(Cycles)
LMK failed
LMK Non-Failed
Power (LMK failed)

CIRFT Data Update and Data Analyses for Spent Nuclear Fuel Vibration Reliability Study 50 July 28, 2017
3.3 CIRFT Evaluations of NA Fuel Rods Six dynamic tests were conducted with applied amplitudes from 5.08 to 15.24 Nm; five specimens failed, and the fatigue life ranged from 1.26 × 10⁴ to 4.27 × 10⁵ cycles. One specimen (NA5) was cycled to 5.11 × 10⁶ cycles without failure and stopped.
For each test, plots like those of LMK fuels are presented for NA fuel, including variations for curvature range, moment range, flexural rigidity, curvature peak/valley, and moment peak/valley values.
The results of the dynamic tests are summarized in Table 7. The column headings are the same as those specified in Section 3.1.
The plots based on the mean values of quantities can be found in Figure 24(a–d). There are knee points near 4 Nm and 0.05 m−1 in the moment–Nf, and curvature–Nf curve. However, the knee was not well defined because of the limited data points.
The rigidity variation was generally limited for a specified cyclic test, but abrupt variations were observed in several tests. However, the effective half gauge length was limited to a range between 40–49 mm, increasing with the amplitude of moment.
Table 7a. Dynamic test results for NA SNF rods.
TN Spec Load N
Fail ma ma_std ka ka_std km km_std
N cycles Nm Nm m^1 m^−1 m^−1 m^−1
1 NA1 125.000 1.57E + 04 Y 11.001 0.053 0.420 0.007 0.440 0.013
2 NA2 100.000 2.20E + 04 Y 8.802 0.082 0.321 0.013 0.338 0.017
4 NA4 75.000 6.10E + 04 Y 6.331 0.083 0.181 0.009 0.209 0.010
5 NA5 50.000 5.11E + 06 N 3.982 0.068 0.117 0.014 0.132 0.014
6 NA6 50.000 4.27E + 05 Y 3.986 0.090 0.099 0.010 0.134 0.009
7 NA7 150.000 1.26E + 04 Y 13.540 0.542 0.500 0.039 0.516 0.026
Table 7b. Dynamic test results for NA SNF rods.
TN Spec R R_std sa sa_std ea ea_std em em_std Lg2 Lg2_std dh dh_std
Nm^2 Nm^2 Mpa MPa % % % % mm mm mm mm
1 NA1 26.20 0.268 194.49 0.650 0.202 0.003 0.212 0.006 46.055 0.469 −0.359 0.247
2 NA2 27.45 0.695 148.53 1.017 0.153 0.006 0.162 0.008 45.473 0.670 1.271 0.371
4 NA4 34.94 0.888 83.95 1.023 0.087 0.004 0.101 0.005 45.209 0.775 1.248 0.353
5 NA5 33.96 2.764 54.32 0.842 0.057 0.007 0.064 0.007 40.101 1.533 −0.148 0.770

CIRFT Data Update and Data Analyses for Spent Nuclear Fuel Vibration Reliability Study July 28, 2017 51
6 NA6 40.17 2.801 45.96 1.113 0.048 0.005 0.064 0.004 43.153 0.968 1.745 0.404
7 NA7 27.07 1.174 231.71 6.690 0.242 0.019 0.248 0.013 49.444 1.317 0.163 0.345

CIRFT Data Update and Data Analyses for Spent Nuclear Fuel Vibration Reliability Study 52 July 28, 2017
(a)
(b)
y = 251.93x-0.325
R² = 0.9493
0
2
4
6
8
10
12
14
16
1.00E+03 1.00E+04 1.00E+05 1.00E+06 1.00E+07
Mom
ent (
N-m
)
Nf(Cycles)
NA failed
NA Non-Failed
Power (NA failed)
y = 14473x-0.451
R² = 0.9637
0
50
100
150
200
250
1.00E+03 1.00E+04 1.00E+05 1.00E+06 1.00E+07
Stre
ss (M
pa)
Nf(Cycles)
NA failedNA Non-FailedPower (NA failed)
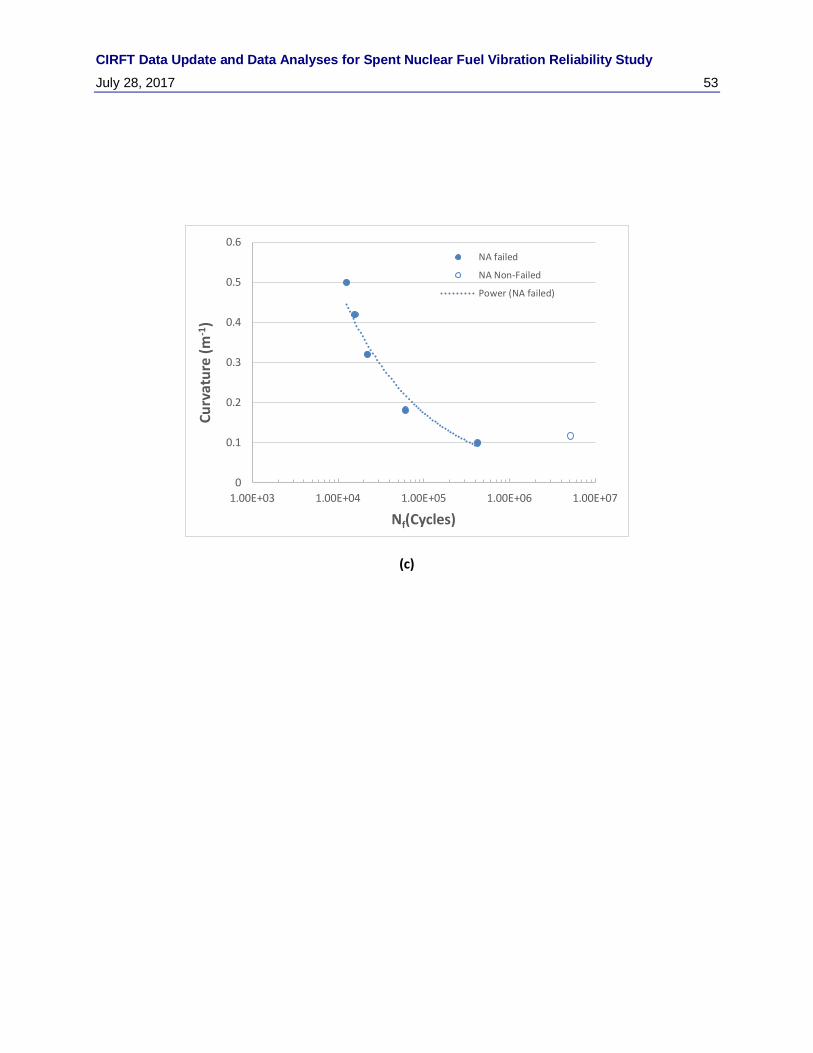
CIRFT Data Update and Data Analyses for Spent Nuclear Fuel Vibration Reliability Study July 28, 2017 53
(c)
0
0.1
0.2
0.3
0.4
0.5
0.6
1.00E+03 1.00E+04 1.00E+05 1.00E+06 1.00E+07
Curv
atur
e (m
-1)
Nf(Cycles)
NA failed
NA Non-Failed
Power (NA failed)

CIRFT Data Update and Data Analyses for Spent Nuclear Fuel Vibration Reliability Study 54 July 28, 2017
(d)
Figure 24. (a) Moment amplitude, (b) stress amplitude, (c) curvature amplitude/maximum, and (d) strain amplitude/maximum as a function of cycles or cycles to failure.
y = 15.216x-0.452
R² = 0.9625
0
0.05
0.1
0.15
0.2
0.25
0.3
1.00E+03 1.00E+04 1.00E+05 1.00E+06 1.00E+07
Stra
in (%
)
Nf(Cycles)
NA failed
NA Non-Failed
Power (NA failed)

CIRFT Data Update and Data Analyses for Spent Nuclear Fuel Vibration Reliability Study July 28, 2017 55
3.4 CIRFT Evaluations of MOX Fuel Rods Twenty-three dynamic tests were completed with the applied amplitudes from 5.08–15.24 Nm, and all specimens failed. The fatigue life ranged from 3.66 × 10³ to 2.51 × 10⁶ cycles. Six tests were conducted on the specimens that had been pretreated by dropping them from a height of 12 in. with specimen laid horizontally, and the remaining seven tests used specimens that had been subjected to two cycles of thermal treatment for 10 h at 400oC.
The results for the dynamic tests of MOX fuel are summarized in Table 8. The column headings are the same as those specified in Sect. 3.1. The plots are based on the mean values of quantities and can be found in Figure 25 (a–d). In the moment–Nf curve, there is knee point near 4 Nm. However, the variation of fatigue life in curvature–N appeared to be continuous within the tested amplitude range.
The fatigue rigidity response depended on the moment amplitudes applied. At high levels (e.g., >10.2 Nm), the rigidity was either relatively stable, or it decreased with the accumulated number of cycles. At low levels, the rigidity increased during cyclic tests, but the fatigue life of MOX fuel increased with the increasing initial rigidity.
Conversely, the effective half gauge length limited to a range between 40–52 mm, increasing with increased amplitude of moment.
Table 8a. Dynamic test results for MOX SNF rods.
TN Spec Type Load N
Fail ma ma_std ka ka_std km km_std
N cycles Nm Nm m^1 m^-1 m^-1 m^-1
2 MOX2 A 100 3.70E + 04 Y 8.480 0.103 0.349 0.010 0.358 0.012
4 MOX4 A 50 2.15E + 06 Y 3.900 0.075 0.108 0.016 0.121 0.017
5 MOX5 A 60 4.49E + 05 Y 4.794 0.061 0.147 0.009 0.153 0.010
6 MOX6 A 50 5.42E + 05 Y 3.830 0.054 0.139 0.008 0.143 0.010
7 MOX7 A 150 1.55E + 04 Y 13.857 0.127 0.516 0.008 0.525 0.009
8 MOX8 A 125 1.29E + 04 Y 11.036 0.104 0.444 0.009 0.481 0.013
9 MOX9 A 75 8.98E + 04 Y 6.294 0.084 0.262 0.009 0.289 0.015
10 MOX10 A 100 3.85E + 04 Y 8.729 0.068 0.310 0.016 0.326 0.017
11 MOX11 A 100 4.23E + 04 Y 8.662 0.047 0.308 0.008 0.340 0.011
12 MOX12 A 100 4.23E + 04 Y 8.711 0.067 0.340 0.005 0.360 0.010
13 MOX13 D 100 2.70E + 04 Y 8.725 0.059 0.369 0.007 0.382 0.011
14 MOX14 D 75 8.72E + 04 Y 6.190 0.091 0.548 0.172 1.194 1.160
15 MOX15 D 50 4.65E + 06 N 3.842 0.074 0.151 0.028 0.177 0.011
16 MOX16 D 150 3.66E + 03 Y 13.209 1.656 0.809 0.273 0.826 0.345

CIRFT Data Update and Data Analyses for Spent Nuclear Fuel Vibration Reliability Study 56 July 28, 2017
17 MOX17 D 125 1.16E + 04 Y 11.104 0.951 0.574 0.663 0.630 0.960
18 MOX15 D 100 1.95E + 04 Y 8.474 0.065 0.360 0.005 0.365 0.008
19 TH1 H 100 5.70E + 04 Y 8.770 0.065 0.441 0.007 0.462 0.009
20 TH2 H 75 3.75E + 06 N 6.234 0.107 0.289 0.009 0.312 0.013
21 TH3 H 125 1.51E + 04 Y 10.573 0.289 0.571 0.029 0.600 0.033
22 TH4 H 75 2.51E + 06 Y 6.284 0.150 0.327 0.025 0.359 0.027
23 TH5 H 125 2.76E + 04 Y 11.190 0.069 0.673 0.008 0.680 0.011
24 TH6 H 150 1.25E + 04 Y 13.391 0.157 0.666 0.014 0.682 0.018
25 TH2 H 125 5.73E + 04 Y 11.029 0.135 0.550 0.012 0.556 0.013
A= as-received sample D = sample with 12-in. drop H = sample subjected to two cycles of thermal treatment for 10 h at 400°C
Table 8b. Dynamic test results for MOX SNF rods.
TN Spec R R_std sa sa_std ea ea_std em em_std Lg2 Lg2_std dh dh_std
Nm^2 Nm^2 Mpa MPa % % % % mm mm mm mm
2 MOX2 24.33 0.533 161.34 1.274 0.167 0.005 0.172 0.006 43.811 0.621 1.243 0.291
4 MOX4 36.03 3.703 50.11 0.932 0.052 0.008 0.058 0.008 40.575 2.133 −1.512 0.927
5 MOX5 32.66 1.235 67.95 0.758 0.071 0.004 0.073 0.005 43.766 1.027 −1.178 0.684
6 MOX6 27.64 1.021 64.16 0.662 0.066 0.004 0.069 0.005 43.751 0.867 0.059 0.395
7 MOX7 26.87 0.316 238.78 1.569 0.248 0.004 0.252 0.004 48.523 0.454 0.409 0.129
8 MOX8 24.83 0.282 205.76 1.282 0.213 0.004 0.231 0.006 49.223 0.484 0.441 0.144
9 MOX9 24.06 0.470 121.10 1.041 0.125 0.004 0.139 0.007 45.835 0.536 −0.505 0.190
10 MOX10 28.16 0.855 143.50 0.840 0.148 0.008 0.156 0.008 49.626 1.075 −0.428 0.276
11 MOX11 28.17 0.534 142.36 0.585 0.148 0.004 0.163 0.005 52.390 0.622 −1.036 0.260
12 MOX12 25.60 0.242 157.54 0.825 0.163 0.002 0.173 0.005 48.820 0.550 −0.678 0.182
13 MOX13 23.64 0.268 170.83 0.734 0.177 0.003 0.184 0.005 47.339 0.524 −0.040 0.190
14 MOX14 11.30 2.432 253.59 1.122 0.263 0.083 0.573 0.557 27.459 7.996 1.240 2.671
15 MOX15 25.46 3.764 69.85 0.917 0.072 0.013 0.085 0.005 43.138 3.120 0.741 1.512
15 MOX15 22.66 0.547 78.48 0.999 0.080 0.004 0.084 0.006 41.513 0.755 0.275 0.315
16 MOX16 16.34 1.700 374.31 20.479 0.388 0.131 0.396 0.165 48.167 0.841 0.188 0.275

CIRFT Data Update and Data Analyses for Spent Nuclear Fuel Vibration Reliability Study July 28, 2017 57
17 MOX17 19.34 2.371 265.74 11.752 0.276 0.318 0.303 0.461 46.586 2.074 0.081 0.390
18 MOX15 23.54 0.165 166.65 0.804 0.173 0.002 0.175 0.004 47.594 0.516 0.170 0.192
19 TH1 19.88 0.186 204.24 0.800 0.212 0.004 0.222 0.004 49.023 0.443 0.738 0.145
20 TH2 21.54 0.350 134.01 1.322 0.139 0.004 0.149 0.006 48.349 0.802 −0.743 0.224
21 TH3 18.53 0.713 264.22 3.569 0.274 0.014 0.288 0.016 47.431 0.867 0.337 0.247
22 TH4 19.21 0.862 151.47 1.856 0.157 0.012 0.172 0.013 48.093 0.793 −0.217 0.790
23 TH5 16.62 0.151 311.67 0.847 0.323 0.004 0.326 0.005 47.979 0.372 0.297 0.136
24 TH6 20.11 0.394 308.25 1.942 0.320 0.007 0.327 0.008 49.765 0.385 −0.563 0.134
25 TH2 20.04 0.137 254.73 1.674 0.264 0.006 0.267 0.006 50.304 0.464 −0.366 0.109
The flexural rigidity of the rod specimens that were either dropped or heat-treated was lower than the as-received specimens. In most cases, the online monitoring generally demonstrated a steady or continuous variation in curvature during cyclic testing, depending on the moment amplitude and material condition. MOX14 was the exception, where a discontinuous rigidity variation was observed. Such a discontinuous response was associated with the asymmetrical curvature increase of the specimen, and an abrupt increase was seen near 104 cycles, as the specimen was approaching failure. For MOX15, a substantial negative shift in κ and a reduction in the κ range were observed after a test restart at around 3.3 × 10⁶ cycles.
Plots based on the mean values of quantities are given in Figure 25 (a–d), where MOX_A represents the as-received specimens, MOX_D represents those subjected to a drop from 12 inches, and MOX_H represents those that were thermal annealed. Fatigue life was shown to be affected by the condition of specimens. The 12 in. drop seemingly reduces the fatigue life of SNF rods. Conversely, heat-treated extends fatigue life, which can be seen from the two tests under 7.62 Nm (75 N load), as shown in Figure 25(a).

CIRFT Data Update and Data Analyses for Spent Nuclear Fuel Vibration Reliability Study 58 July 28, 2017
(a)
(b)
y = 121.65x-0.248
R² = 0.9196y = 100.44x-0.243
R² = 0.96
0
2
4
6
8
10
12
14
16
1.00E+03 1.00E+04 1.00E+05 1.00E+06 1.00E+07
Mom
ent (
N-m
)
Nf(Cycles)
MOX_A failedMOX_D FailedMOX_D Non-FailedMOX_H FailedMOX_H Non FailedPower (MOX_A failed)Power (MOX_D Failed)
y = 4008.5x-0.308
R² = 0.976
y = 1068.1x-0.154
R² = 0.2809
0
50
100
150
200
250
300
350
400
1.00E+03 1.00E+04 1.00E+05 1.00E+06 1.00E+07
Stre
ss (M
Pa)
Nf(Cycles)
MOX_A failedMOX_D FailedMOX_D Non-FailedMOX_H FailedMOX_H Non FailedPower (MOX_A failed)Power (MOX_D Failed)

CIRFT Data Update and Data Analyses for Spent Nuclear Fuel Vibration Reliability Study July 28, 2017 59
(c)
(d)
Figure 25. (a) Moment amplitude, (b) stress amplitude, (c) curvature amplitude/maximum, and (d) strain amplitude/maximum as a function of cycles or cycles to failure
(MOX_A: as-received; MOX_D: 12 in. drop; MOX_H: heat treated).
y = 8.6586x-0.308
R² = 0.976
y = 2.307x-0.154
R² = 0.2809
0.0
0.1
0.2
0.3
0.4
0.5
0.6
0.7
0.8
0.9
1.00E+03 1.00E+04 1.00E+05 1.00E+06 1.00E+07
Curv
atur
e (m
-1)
Nf(Cycles)
MOX_A failedMOX_D FailedMOX_D Non-FailedMOX_H FailedMOX_H Non FailedPower (MOX_A failed)Power (MOX_D Failed)
y = 4.1817x-0.308
R² = 0.9763
y = 1.1021x-0.154
R² = 0.2798
0.00
0.05
0.10
0.15
0.20
0.25
0.30
0.35
0.40
0.45
1.00E+03 1.00E+04 1.00E+05 1.00E+06 1.00E+07
Stra
in (%
)
Nf(Cycles)
MOX_A failedMOX_D FailedMOX_D Non-FailedMOX_H FailedMOX_H Non FailedPower (MOX_A failed)Power (MOX_D Failed)

CIRFT Data Update and Data Analyses for Spent Nuclear Fuel Vibration Reliability Study 60 July 28, 2017
3.5 CIRFT Evaluations of HBR Fuel Rods The vibration reliability study on HBU HBR rods with Zry-4 cladding was jointly funded by US Nuclear Regulatory Commission and the DOE Used Fuel Disposition Campaign (UFDC) The study is documented in NUREG/CR-7198/R1, Mechanical Fatigue Testing of High-Burnup Fuel for Transportation Applications. The plots of HBR fuels are like those of LMK fuels, including the variations of curvature range, moment range, flexural rigidity, curvature peak/valley, and moment peak/valley values. The flexural rigidity of the rod specimens treated by hydride reorientation was shown to be much lower than as-received specimens under equivalent amplitude. For example, under the same loading amplitude of 100 N, the rigidity of the radial hydride treatment (RHT) specimen (HR3) was only about 57% of the as-received specimen (DL3). The variation of rigidity during a cyclic test was continuous. In HR3, a sudden drop was observed before. The dynamic testing results for as-irradiated and hydride reorientation (HR)-treated HBR rods are summarized in Table 9.
Table 9a. Dynamic test results for HBR SNF rods.
TN Spec Load
in.
N
cycles Fail
ma
Nm
ma_std
Nm
ka
m^1
ka_std
m^−1
km
m^−1
km_std
m^−1
1 Demo1 300 3.96E+03 Y 28.504 0.131 0.944 0.008 1.123 0.024
2 S3 250 2.50E+04 Y 24.068 0.067 0.439 0.006 0.444 0.008
5 S1 300 4.60E+03 Y 28.493 0.087 0.674 0.008 0.730 0.017
6 S2 300 7.20E+03 Y 28.314 0.088 0.654 0.015 0.746 0.024
7 Dcal 300 9.60E+03 Y 28.579 0.098 0.754 0.026 0.862 0.041
9 DL1 150 1.10E+05 Y 14.107 0.069 0.215 0.007 0.240 0.01
10 DL2 50 6.40E+06 N 4.207 0.083 0.046 0.007 0.066 0.009
11 DL2H 350 1.80E+03 Y 34.087 0.077 0.747 0.006 0.765 0.013
12 DL3 100 1.00E+06 Y 9.17 0.085 0.125 0.012 0.171 0.012
13 DM2 90 2.30E+06 Y 8.201 0.070 0.114 0.007 0.122 0.009
14 DM1 75 1.10E+07 N 6.726 0.081 0.089 0.01 0.121 0.012
15 DH1 125 2.50E+05 Y 11.624 0.069 0.205 0.005 0.218 0.007
16 DH2 200 6.50E+04 Y 18.923 0.108 0.351 0.006 0.370 0.011
17 DM3 87.5 1.28E+07 N 7.747 0.134 0.105 0.018 0.117 0.035
18 DH3 350 7.10E+03 Y 33.666 0.127 0.581 0.182 0.636 0.233
19 S5 125 1.80E+05 Y 11.552 0.090 0.174 0.019 0.213 0.02
20 R1 300 5.50E+03 Y 29.021 0.074 0.469 0.043 0.563 0.035
21 R2 110 3.86E+05 Y 9.986 0.078 0.144 0.012 0.171 0.012

CIRFT Data Update and Data Analyses for Spent Nuclear Fuel Vibration Reliability Study July 28, 2017 61
22 R3 135 1.29E+05 Y 12.551 0.072 0.152 0.007 0.199 0.008
23 R4 87.5 2.74E+05 Y 7.842 0.076 0.112 0.01 0.135 0.012
24 R5 75 2.24E+07 N 6.639 0.087 0.087 0.02 0.125 0.021
25 HR1a 150 4.19E + 04 Y 15.152 0.549 0.517 0.016 0.527 0.019
26 HR2a 160 9.47E + 03 Y 14.702 0.806 0.478 0.121 0.511 0.205
27 HR3a 100 2.44E + 05 Y 8.982 0.066 0.267 0.005 0.291 0.009
28 HR4b 160 5.47E + 04 Y 14.759 0.089 0.394 0.008 0.421 0.009 a = HR- treated sample with 5 cycles of 400°C holding for 3 hours per cycle and 140MPa hoop stress pressurization b = thermal treatment sample with 400°C
Table 9b. Dynamic test results for HBR SNF rods.
TN Spec R
Nm^2
R_std
Nm^2
Sa
MPa
sa_std
MPa
ea
%
ea_std
%
em
%
em_std
%
Lg2
mm
Lg2_std
mm
dh
mm
dh_std
mm
1 Demo1 30.20 0.159 455.55 1.117 0.508 0.004 0.605 0.013 44.461 0.287 0.637 0.094
2 S3 54.86 0.47 213.75 0.576 0.235 0.003 0.239 0.005 48.761 0.498 0.276 0.335
5 S1 42.27 0.369 326.57 0.745 0.362 0.004 0.392 0.009 50.152 0.413 0.017 0.128
6 S2 43.32 0.647 318.43 0.751 0.351 0.008 0.401 0.013 50.027 0.443 0.042 0.176
7 Dcal 37.88 0.81 365.50 0.836 0.405 0.014 0.463 0.022 48.211 0.532 0.46 0.146
9 DL1 65.66 1.388 104.09 0.574 0.116 0.004 0.130 0.005 45.929 0.678 −0.443 0.693
10 DL2 91.62 10.039 22.25 0.702 0.025 0.004 0.036 0.005 34.776 2.113 −0.007 1.723
11 DL2H 45.63 0.23 361.93 0.65 0.403 0.003 0.412 0.007 46.213 0.343 0.906 0.118
12 DL3 73.57 5.173 60.39 0.725 0.067 0.007 0.092 0.007 41.048 1.048 −1.573 0.847
13 DM2 71.95 3.149 55.54 0.595 0.062 0.004 0.066 0.005 41.18 0.834 −0.736 0.461
14 DM1 75.25 6.197 43.55 0.696 0.048 0.005 0.065 0.007 39.505 0.965 −0.506 1.255
15 DH1 56.70 0.843 99.32 0.593 0.110 0.003 0.117 0.004 43.153 0.679 0.272 0.315
16 DH2 53.92 0.718 170.04 0.917 0.189 0.003 0.199 0.006 46.474 0.507 −0.285 0.196
17 DM3 73.81 9.551 50.85 1.151 0.057 0.009 0.063 0.019 43.127 2.378 0.762 1.254
18 DH3 57.91 12.993 281.67 1.087 0.312 0.098 0.342 0.125 47.827 3.03 2.341 0.865
19 S5 66.45 5.258 84.22 0.767 0.093 0.01 0.115 0.011 44.982 1.264 1.97 0.431

CIRFT Data Update and Data Analyses for Spent Nuclear Fuel Vibration Reliability Study 62 July 28, 2017
20 R1 61.87 4.029 227.25 0.618 0.254 0.023 0.306 0.019 51.603 1.61 2.242 0.723
21 R2 69.19 4.15 69.92 0.652 0.078 0.007 0.093 0.007 43.13 0.99 −1.099 0.451
22 R3 82.74 2.609 73.22 0.611 0.081 0.004 0.107 0.004 47.963 1.003 2.524 0.305
23 R4 69.81 4.492 54.22 0.648 0.061 0.006 0.073 0.006 40.344 0.962 −1.434 0.537
24 R5 76.38 10.704 41.95 0.735 0.047 0.011 0.067 0.011 38.842 1.821 1.01 1.402
25 HR1 29.329 0.775 207.06 4.666 0.278 0.009 0.284 0.010 44.733 0.565 1.329 0.197
26 HR2 31.567 3.256 191.44 6.848 0.257 0.065 0.275 0.110 50.657 1.593 −0.174 0.372
27 HR3 33.659 0.602 106.94 0.560 0.144 0.003 0.157 0.005 43.368 0.643 −1.649 0.252
28 HR4 37.497 0.593 157.80 0.755 0.212 0.004 0.227 0.005 45.977 0.578 1.206 0.201
The plots based on the mean values of quantities are given in Figure 26(a–d), where HBR represents the as-received specimen, and HBR_HR represents the specimen after RHT. It has been shown that the RHT reduces the fatigue life of SNF rods, which can be seen from the tests around 15 Nm. A fatigue life reduction was also observed for HR2, as indicated by the marker. Such reduction obviously resulted from the large-deformation static loading before the dynamic cyclic loading.
Optical microscopy was conducted on the fracture surfaces of the selected test specimens. Among the seven specimens examined, at least five failures were determined to be dominated by the PPIs. Most of the SNF rod failures initiated and propagated through the pellet-pellet clad interface region in a typical tensile failure mode except for the HR1 tested sample. The HR1 fractured sample showed crack initiated at the PPI, but the crack propagation was in a mixed-mode (tensile + shear) failure mechanism. The postmortem examination of the HR1 fractured sample also indicated that a large area of the pellet-cladding bond was disrupted, as shown in Figure 27.

CIRFT Data Update and Data Analyses for Spent Nuclear Fuel Vibration Reliability Study July 28, 2017 63
(a)
(b)
HR1
HR2
HR3
HR4
y = 228.45x-0.239
R² = 0.9271
0.0
5.0
10.0
15.0
20.0
25.0
30.0
35.0
40.0
45.0
1.00E+03 1.00E+04 1.00E+05 1.00E+06 1.00E+07 1.00E+08
Mom
ent (
N-m
)
Nf (Cycles)
HBR FailedHBR Non FailedHBR HR FailedPower (HBR Failed)
y = 5440.3x-0.333
R² = 0.901
0
50
100
150
200
250
300
350
400
450
500
1.00E+03 1.00E+04 1.00E+05 1.00E+06 1.00E+07 1.00E+08
Stre
ss (M
Pa)
Nf(Cycles)
HBR Failed
HBR Non Failed
HBR HR Failed
Power (HBR Failed)

CIRFT Data Update and Data Analyses for Spent Nuclear Fuel Vibration Reliability Study 64 July 28, 2017
(c)
(d)
Figure 26. (a) Moment amplitude, (b) stress amplitude, (c) curvature amplitude, and (d) strain amplitude rigidity as a function of cycles or cycles to failure.
y = 11.236x-0.333
R² = 0.9021
0.0
0.1
0.2
0.3
0.4
0.5
0.6
0.7
0.8
0.9
1.0
1.00E+03 1.00E+04 1.00E+05 1.00E+06 1.00E+07 1.00E+08
Curv
atur
e (m
-1)
Nf(Cycles)
HBR FailedHBR Non FailedHBR HR FailedPower (HBR Failed)
y = 6.0429x-0.333
R² = 0.9028
0.00
0.10
0.20
0.30
0.40
0.50
0.60
1.00E+03 1.00E+04 1.00E+05 1.00E+06 1.00E+07 1.00E+08
Stra
in (%
)
Nf(Cycles)
HBR FailedHBR Non FailedHBR HR FailedPower (HBR Failed)

CIRFT Data Update and Data Analyses for Spent Nuclear Fuel Vibration Reliability Study July 28, 2017 65
Figure 27. HR fractured sample HR1 revealed mixed-mode failure mechanisms [23].

CIRFT Data Update and Data Analyses for Spent Nuclear Fuel Vibration Reliability Study 66 July 28, 2017
3.5.1 Cladding Oxide Effect Study HBR CIRFT test data and the associated oxide thickness are shown in Table 10.
Table 10. HBR SNF CIRFT data with the associated tested rod’s oxide thickness.
Spec label ID
Moment amplitude
Number of cycles
Flexural rigidity κa sa εa
Oxide thickness
[1]
Hydrogen of span [20,21]
Unit N∙m # N-m² m-1 MPa % µm wppm
As-irradiated CIRFT data
DM3 7.74 >1.28E+07 72.3 0.107 50.85 0.057 70–100 550–750
R4 7.84 2.74E+05 70.0 0.112 54.22 0.06 100–110 750–800
DM2 8.20 2.30E+06 71.9 0.114 55.54 0.061 40–70 360–550
DL3 9.17 1.00E+06 73.4 0.125 60.39 0.067 70–100 550–750
R2 9.99 3.86E+05 69.4 0.144 69.92 0.078 70–100 550–750
S5 11.55 1.80E+05 66.4 0.174 84.22 0.094 70–100 550–750
DH1 11.62 2.50E+05 56.7 0.205 99.32 0.11 70–100 550–750
R3 12.55 1.29E+05 83.1 0.151 73.22 0.081 100–110 750–800
DL1 14.11 1.10E+05 65.6 0.215 104.09 0.117 70–100 550–750
DH2 18.92 6.50E+04 53.9 0.351 170.04 0.189 70–100 550–750
S3 24.07 2.50E+04 54.8 0.439 213.75 0.236 40–70 360–550
R1 29.02 5.50E+03 61.9 0.469 227.25 0.254 70–100 550–750
DH3 33.67 7.10E+03 58.5 0.576 281.67 0.31 70–100 550–750
HR CIRFT data
HR1 15.15 4.19E+04 35.7 0.424 207.06 0.228 40–44 360–400
HR3 8.98 2.44E+05 41.0 0.219 106.94 0.118 40–44 360–400
HR4 14.76 5.47E+04 45.7 0.323 157.80 0.174 40–44 360–400
With the similar loading amplitude, analysis of the CIRFT data with high oxide thickness suggests reduced fatigue life compared to CIRFT data with lower oxide thickness. For instance, the D8 sample with 70–100 µm oxide thickness and the D14 sample with 100–110 µm oxide thickness had similar loading amplitudes; the D8 sample had a much longer fatigue life at >12M cycles compared to the D14 sample at 2.74E5 cycles. The CIRFT data are shown with distinct labels for four oxide thickness ranges in Figure 28(a-d). Two trend curves shown in Figure 28(a) and (d) indicate that SNF rods with higher oxide thickness or higher hydrogen contents had lower fatigue life.
The plots of as-irradiated baseline data for moment amplitude and strain amplitude input from HBR baseline data show a self-consistent trend: as-irradiated CIRFT data with higher oxide thickness showed

CIRFT Data Update and Data Analyses for Spent Nuclear Fuel Vibration Reliability Study July 28, 2017 67
less fatigue life, while for HR data, a different trend was observed from moment amplitude and strain amplitude input plots. In the moment amplitude plot, HR data showed reduced fatigue life below the mean trend curve of 70–100 µm oxide thickness, while as in the strain amplitude, plot HR data showed increased fatigue life above the mean trend curve. The HR samples had the lowest oxide thickness, as well as the lowest flexural rigidity, as shown in Figure 28(c–d). Thus, HR data would be expected to trend above the mean fatigue strength trend curve of 70–100 µm oxide thickness in the plots. Apparently, this is the case for the strain vs. failure cycles trend, but not for the moment vs. failure cycles trend. Furthermore, HR data have the lowest flexural rigidity, so under similar loading conditions, it would have the highest strain response compared to the as-irradiated HBR data. The low flexural rigidity is the root cause of the HR data’s self-inconsistent trend, where the flexural rigidity reduction of HR data was the result of heat treatment.
(a)
HR1
HR3
HR4
y = 301.68x-0.26
R² = 0.961
0
5
10
15
20
25
30
35
40
1.00E+03 1.00E+04 1.00E+05 1.00E+06 1.00E+07
Mom
ent (
N-m
)
Nf (Cycles)
40-70µm Oxide70-100µm Oxide100-110µm Oxide40-44µm Oxide (HR data)Power (40-70µm Oxide)Power (70-100µm Oxide)

CIRFT Data Update and Data Analyses for Spent Nuclear Fuel Vibration Reliability Study 68 July 28, 2017
(b)
(c)
y = 3.7093x-0.292
R² = 0.9291
0
0.05
0.1
0.15
0.2
0.25
0.3
0.35
1.00E+03 1.00E+04 1.00E+05 1.00E+06 1.00E+07
Stra
in (%
)
Nf (Cycles)
40-70µm Oxide
70-100µm Oxide
100-110µm Oxide
40-44µm Oxide (HR data)
Power (70-100µm Oxide)
y = 48.164x-0.132
R² = 0.4871
20
30
40
50
60
70
80
90
100
0.00 0.05 0.10 0.15 0.20 0.25 0.30 0.35 0.40
Flex
ural
Rig
idity
(N-m
²)
Strain (%)
40-70µm Oxide70-100µm Oxide100-110µm Oxide40-44µm Oxide (HR data)Power (70-100µm Oxide)

CIRFT Data Update and Data Analyses for Spent Nuclear Fuel Vibration Reliability Study July 28, 2017 69
(d)
Figure 28. (a) Moment amplitude vs. number of failure cycles, (b) strain amplitude vs. number of failure
cycles, (c) flexural rigidity vs. strain as function of clad oxide thickness, and (d) moment amplitude vs. number of failure cycles as function of hydrogen of span; flexural rigidity seems to be dependent
on strain amplitude; HR4 has thermal heat treatment only without pressurization applied.
3.5.2 HR CIRFT Test Data Evaluation Reoriented hydrides can change the SNF rod system’s response. The procedure used to reorient the hydrides may result in other changes, including changes to pellet-cladding bonding efficiency or development of gaps at pellet-clad interface regions due to thermal treatment (400 °C) and clad tubing pressurization (140 MPa hoop stress) effect. The consequences of pellet-cladding interface bonding disruption [16] or increases in gap density at the interface are (1) reduction in the flexural rigidity and (2) increase in the contact load intensity of pellet-cladding mechanical interaction in HR samples. Table 10 shows that HR samples had low flexural rigidity compared to the as-irradiated samples. The reduced flexural rigidity resulted in an increase in clad strain amplitude of HR samples under similar loading amplitude compared to as-irradiated samples. Furthermore, significant reduction in flexural rigidity may indicate that the HR sample already evolved into a different composite system characteristic compared to the as-irradiated sample. Therefore, using the HR gauge strain amplitude vs. failure frequency trend to compare to that of as-irradiated samples can be misleading. The evidence of pellet-clad interface bonding disruption and gap formation in the HR rod system was further verified through PIE on HR1 sample, as shown in Figure 29; such gap formation was not observed in as-irradiated PIE.
y = 301.68x-0.26
R² = 0.961
0
5
10
15
20
25
30
35
40
1.00E+03 1.00E+04 1.00E+05 1.00E+06 1.00E+07
Mom
ent (
N-m
)
Nf (Cycles)
360-550 wppm hydrogen550-750 wppm hydrogen750-800 wppm360-400 wppm hydrogenPower (360-550 wppm hydrogen)Power (550-750 wppm hydrogen)

CIRFT Data Update and Data Analyses for Spent Nuclear Fuel Vibration Reliability Study 70 July 28, 2017
Figure 29. Metallographic examination of fuel and cladding: MET results of HR1 showing debonding
phenomenon and gap formation at pellet-clad interface and high density of radial hydride formation in HR treated rod [23].
Furthermore, the HR1 sample showed significant radial hydride populations, but HR1 data only had a marginal reduction in fatigue life compared to HR4 data with thermal treatment only (see Figure 28). It is noted that HR1 and HR4 have similar oxide thicknesses as shown in Table 10. The 400 °C thermal treatment and pressurization adopted in preparing HR samples is not likely to introduce annealing recovery on the irradiated clad or to generate new flaws into the SNF system. Therefore, the flexural rigidity difference between HR1 and HR4 shown in Table 10 was primary due to the pressurization effect. The observations above may further indicate that the net effect of the radial hydride on fatigue life reduction shown in Figure 28(a) is negligible. Furthermore, HR4 data also indicate that the adopted heat treatment of 400 °C alone had a negative effect on SNF system fatigue strength.
The rationale of the insignificant radial hydride effect on the SNF rod fatigue life is demonstrated below. The harmonic vibration load provided by CIRFT will generate the cyclic alternative principal tensile/compression stresses oriented in the rod’s axial direction, which is in parallel to both radial and circumferential hydrides in the clad structure. Thus, it is expected that the effect of harmonic vibration loading applied on radial hydrides and circumferential hydrides would be very similar or no different from the principal tensile stress perspective. Therefore, HR data may support that the HR-induced radial hydride structure under the CIRFT harmonic vibration loading condition could not effectively trigger SNF clad crack initiation and growth failure mechanism.
It is noted that CIRFT data showed very limited or no flexural rigidity reduction upon the SNF rod’s final fracture failure. The PIE data showed significant delamination near the clad hydride rim region, with no obvious beach marks or striations traced on the fractured surface that would typically show in the
Open gap at pellet-clad interface region
High ratio of radial hydrides
Pellet-clad interface
Pellet-clad interfacial bonding material

CIRFT Data Update and Data Analyses for Spent Nuclear Fuel Vibration Reliability Study July 28, 2017 71
material’s fatigue damage profile. A direct consequence of fatigue crack growth in the clad is the reduction of flexural rigidity. The HBU SNF failure phenomenon described herein indicates that no obvious crack growth occurred in SNF upon failure and that the SNF is in a brittle, sudden fracture failure mode. The key delamination driver is from the shear stress induced by material mismatch at the hydride and clad matrix interface under harmonic vibration loading. The major difference between the circumferential hydride and radial hydride effect under CIRFT loading is in the orientations of the resulting clad delamination profile: circumferential hydride induced delamination is in the circumferential direction, and radial hydride induced delamination is in the radial direction.
A recent study on the combined effect of harmonic vibration plus transient contact shock (simulated with a foot drop of CIRFT sample prior to CIRFT harmonic vibration loading) showed 75% fatigue life reduction compared to as-irradiated baseline data without the drop [24,25]. The detailed CIRFT real-time history monitoring data showed that the CIRFT test data with the drop event had a different damage mechanism compared to the as-irradiated baseline CIRFT test data. CIRFT drop impact data showed a significant decrease in flexural rigidity, indicating the fatigue crack growth in the SNF system. This was not observed from as-irradiated CIRFT data.
It is likely that transient contact shock can effectively trigger the crack initiation at the cladding’s inner wall due to SNF rod contact impact induced maximum tensile stress or the so-called fuel cladding pinching effect. This type of failure mechanism was observed from a typical ring compression test or a rod pinch effect induced by the drop impact. This is in contrast to the axial principal tensile stress induced by the CIRFT harmonic vibration load, which will induce cracks or flaws initiated at the outer clad wall due to the maximum principal tensile stress located on the clad’s outer surface.
However, due to less population in the hydride content and a lack of circumferential hydride rim reinforcement (existed near the cladding’s outer surface wall of HBU SNF) in the inner wall region, the crack initiation and growth from the cladding’s inner wall region would meet much less resistance compared to fatigue crack initiation and growth from the HBU SNF cladding’s outer wall surface. Thus, the accelerated damage mechanism with significant reduction in fatigue life can be observed in a combined harmonic vibration loading and a contact transient shock loading mode [24,25]. With one drop from 12 inches (its contact load intensity is similar to 20 g), a 75% reduction in fatigue life was observed from CIRFT test results.
Radial hydride material demonstrated from ring compression test data that normally has low ductility and low fracture resistance for clad tubing structure [26]. This will further enhance crack initiation and crack growth in the cladding’s inner wall region during the transient shock events under NCT. Therefore, when an SNF rod has radial hydride population near the cladding’s inner wall region, as shown in Figure 29, with the potential of repeated contact transient shocks, a significant reduction in fatigue life for an HR sample is expected compared to that of a baseline SNF sample. Figure 30 provides a comparison of a MOX SNF rod segment that was not impacted prior to the test (a) and a MOX SNF rod segment that received a 12-inch drop impact prior to the CIRFT test (b).
Regarding the HR effect, the potential HBU SNF accelerated aging effect of the combined harmonic vibration and transient shock loads due to SNF system contact interaction under normal conditions of SNF transport deserves special attention.

CIRFT Data Update and Data Analyses for Spent Nuclear Fuel Vibration Reliability Study 72 July 28, 2017
Figure 30. HBU MOX rod real-time dynamic monitoring data of flexural rigidity (R) under CIRFT testing,
(a) CIRFT test without drop showing no flexural rigidity reduction till failure, and (b) CIRFT test with prior 12-inch drop of CIRFT sample showing significant flexural rigidity reduction and indicating cladding crack
initiation and growth in the 12-inch drop sample during CIRFT harmonic vibration testing [24].
3.6 Discussion 3.6.1 SNF Fatigue Life Comparison The variations in fatigue life are given in Figure 31, including moment, equivalent stress, curvature, and equivalent strain for the tested SNFs. The following designations are used:
1) LMK—as-received
2) MOX_A—as-received
3) MOX_D—12 in. height drop treatment
(a) CIRFT test without impact
(b) CIRFT test with drop impact

CIRFT Data Update and Data Analyses for Spent Nuclear Fuel Vibration Reliability Study July 28, 2017 73
4) MOX_H—heat treatment
5) HBR—as-received
6) HBR_HR—hydride reorientation treatment
The equivalent stress-strain collapsed the data points of all the SNFs into a single zone. A detailed examination revealed that at the same equivalent stress or strain level, fatigue lives display a descending order, as follows: LMK, HBR, and MOX.
The apparent knee point of endurance limit in the curve of moment and curvature or equivalent quantities is more clearly defined for LMK and HBR fuels.
The test results appear to indicate that impacts and RHT have a negative effect on fatigue life. The effect of heat treatment on MOX fuel rods was smaller at higher amplitudes, but it increased in intensity at lower amplitudes of moment. Thermal heat-treatment tended to extend the fatigue life of MOX fuel rod specimens. However, for HR4 testing, heat treatment had a negative effect on fatigue life compared to the HBR rod.
The heat treated MOX samples generally show a significant reduction in flexural rigidity compared to as-received MOX samples. Furthermore, some MOX fuel pellet disintegration into powder form observed at the ends of sample rods under 400°C heat-treatment. This phenomenon could be the result of additional pellet oxidation that needs further verification from MOX specimens pending on follow-on research. The above observed phenomena are the root causes that can result in a significant reduction in the pellet-cladding interface bonding efficiency for the heat-treated MOX samples compared to that of as-received MOX samples. Thus, much less PCMI intensity from MOX_H sample is expected. This will result in a much less fatigue damage potential and longer fatigue life as indicated from MOX_H data.
(a)
0
5
10
15
20
25
30
35
40
1.00E+03 1.00E+04 1.00E+05 1.00E+06 1.00E+07
Mom
ent (
N-m
)
Nf (Cycles)
LMK MOX_A MOX_D MOX_H HBR HBR_HR

CIRFT Data Update and Data Analyses for Spent Nuclear Fuel Vibration Reliability Study 74 July 28, 2017
(b)
(c)
0
50
100
150
200
250
300
350
400
450
500
1.00E+03 1.00E+04 1.00E+05 1.00E+06 1.00E+07
Stre
ss (M
Pa)
Nf (Cycles)
LMK MOX_AMOX_D MOX_HHBR HBR_HRPower (LMK ) Power (MOX_A)Power (HBR)
0
0.1
0.2
0.3
0.4
0.5
0.6
0.7
0.8
0.9
1
1.00E+03 1.00E+04 1.00E+05 1.00E+06 1.00E+07
Curv
atur
e (M
-1)
Nf (Cycles)
LMK MOX_A MOX_D MOX_H HBR HBR_HR

CIRFT Data Update and Data Analyses for Spent Nuclear Fuel Vibration Reliability Study July 28, 2017 75
(d)
Figure 31. (a) Moment amplitude, (b) equivalent stress amplitude, (c) curvature amplitude,
and (d) equivalent strain amplitude as a function of cycles to failure.
0
0.1
0.2
0.3
0.4
0.5
0.6
1.00E+03 1.00E+04 1.00E+05 1.00E+06 1.00E+07
Stra
in (%
)
Nf (Cycles)
LMK MOX_AMOX_D MOX_HHBR HBR_HRPower (LMK ) Power (MOX_A)Power (HBR)

CIRFT Data Update and Data Analyses for Spent Nuclear Fuel Vibration Reliability Study 76 July 28, 2017
3.6.2 SNF Dynamic Deformation Simulation Assessments In FY2016, a modal analysis was performed on the SNF assembly submodel in the frequency domainThe associated FEA model is illustrated in Figure 32 [24,25]. The results provide a better understanding of the frequency characteristics of the fuel assembly submodel. The fundamental mode of the submodel has a natural frequency of 2.44 Hz, which is also the dominant mode with the highest participation factor ratio.
Figure 32. SNF assembly submodel for normal transportation evaluation.
In the time domain, the transient dynamic simulation consists of two stages: (1) an initialization stage to establish contact due to gravity, and (2) the second stage for transient dynamic loading. During the second stage, the acceleration as a sine waveform or impulse signal was used to represent normal transportation excitation or shock excitation for transient dynamic analysis. A 0.5 g sine wave acceleration excitation represents normal transportation vibration. The dynamic responses of the fuel assembly submodel show that the maximum stress occurs at the bottom Inconel spacer, where the material yields. The maximum stress in the guide tube also reached the yield strength. Yielding on the guide tube occurs at both top and bottom nozzle locations.
Results show that the guide tube and spacer grids are at the greatest risk of failure. Due to the horizontal orientation needed for transport, the guide tubes and spacer grids become the major gravity-bearing components supporting the dynamic loads of the fuel assembly. The integrity of the guide tube and spacer grids critically affects the vibration modes and the vibration intensity of fuel assembly during transport.
A 3 g impulse acceleration excitation represents transient shock during transportation. As in the dynamic response under 0.5 g sine wave acceleration excitation, yielding occurs at the bottom Inconel spacers [24,25]. The guide tube also yielded at the top and bottom nozzle locations during 3 g transient shock excitation. Thus, there were concerns for the integrity of the spacer grids and the guide tube under transient shock loading during NCT. The maximum stress level on the cladding was two times the level

CIRFT Data Update and Data Analyses for Spent Nuclear Fuel Vibration Reliability Study July 28, 2017 77
that it had been under 0.5 g sine wave acceleration excitation near yield strength. The basket, top, and bottom nozzles had reached yield strength.
To further evaluate the contact’s interaction intensity between the fuel rod and the spacer grids induced by impact loading, a 3-D finite element section model of the detailed leaf spring/dimples was developed to simulate the impact between the fuel rod and the spacer grids as induced by the cask vibration during transport [24,25]. Under the assumed 20 g transient shock at the spacer grid region, the spring and dimples severely yielded, and the cladding yielded locally during the impact. The tensile yield points are on the inner surface of the cladding wall due to impact-induced tensile flexural stress there. The contact forces on the spring/dimples estimated from the FEA were high enough to cause significant plastic deformation. The bending moment estimated from the resultant stress on the cladding under 20 g transient shock can be used to define the loading in CIRFT vibration testing for the equivalent condition.
Furthermore, CIRFT test data from a 12-inch drop shows a different damage mechanism compared to harmonic vibration loads. These data show that the crack initiated from the inner cladding wall, where the highest tensile stress resided. This results in significant fatigue life reduction from CIRFT harmonic vibration tests. This observed phenomenon from CIRFT testing is consistent with that of the FEA simulation results [24,25].
3.6.3 The Impact of the SNF Skeleton Integrity to SNF Vibration Intensity The fuel assembly skeleton, formed by guide tubes and spacer grids, is designed to constrain fuel rods in a reactor operation. In a horizontal set-up, shown in Figure 33, under SNF transport of NCT, the skeleton contains the primary load bearing members for carrying and transferring the bending vibration loads within SNF fuel assembly. The inertia-induced vibration load is carried by the skeleton throughout the SNF assembly, including contact interaction among SNF rods, spacer grids, and basket walls. Thus, the skeleton integrity can significantly affect the loading vibration intensity and frequency within an SNF system.
Figure 33. Typical fuel assembly skeleton at spacer grids region (left), and
SNF system and canister basket walls interactions (right).
Dynamic interactions within the SNF assembly involving the skeleton, fuel rods, and canister basket wall can significantly increase impact loading intensity and frequency within the fuel assembly and the basket/canister structure. The aging or fatigued skeleton system can increase the impact loading intensity between fuel rods, and it can enhance the probability of large deformation resulting from SNF resonance vibration.
The contact interactions between the fuel rods and the basket wall can also increase the intensity and frequency of transient shock loads for the fuel rods. Proper structure reinforcement of canister design is

CIRFT Data Update and Data Analyses for Spent Nuclear Fuel Vibration Reliability Study 78 July 28, 2017
warranted to overcome the static and dynamic vibration loads (external cask vibration and internal amplification from fuel assembly system vibration and its interaction transient shocks); mitigation includes increasing the cask system damping potential to reduce system vibration intensity.

CIRFT Data Update and Data Analyses for Spent Nuclear Fuel Vibration Reliability Study July 28, 2017 79
4. Applying CIRFT Data for SNF System Vibration Reliability Study
There are four major components involved in an SNF system fatigue lifetime estimate: (1) SNF rod properties, (2) material history, (3) pellet-clad interaction, and (4) environmental loading conditions, as illustrated in Figure 34. The logistics of the typical fatigue life evaluation based on the S-N approach is illustrated in Figure 35.
. Figure 34. Components of SNF system fatigue life evaluation.
Figure 35. Typical fatigue life estimate procedures based on S-N approach.

CIRFT Data Update and Data Analyses for Spent Nuclear Fuel Vibration Reliability Study 80 July 28, 2017
4.1 Methodology Used for Evaluating SNF System Dynamic Stability The three major initiatives in the DOE UFDC program developments for SNF transport reliability investigation are (1) SNF transport vehicle field vibration data collection, (2) SNF rods fatigue S-N trend development, and (3) SNF assembly dynamic response, as illustrated in Figure 36 and detailed in FCRD-UFD-2013-000325, “Used Nuclear Fuel Loading and Structural Performance Under Normal Conditions of Transport—Demonstration of Approach and Results of Used Fuel Performance Characterization.” To make a realistic SNF system fatigue life prediction, the dynamic vibration intensity or deformation amplitude of the SNF system under NCT must be estimated. This can be done in two approaches: (1) using a vibrometer sensor to collect dynamic data directly on the SNF rod system insight a transport cask, i.e., vehicle field vibration data on the SNF rod level, or (2) using the fuel assembly dynamic response scheme of the FEA approach, with the cask’s external vehicle vibration data as the input to estimate the vibration intensity and deformation amplitude at the SNF rod level. Due to a highly irradiated SNF assembly, the second option is more realistic and feasible, while the first option can also be applied in a vibration reliability investigation conducted outside the hot cell environment.
Figure 36. Core activities of DOE UFDC SNF transport vibration reliability investigation.

CIRFT Data Update and Data Analyses for Spent Nuclear Fuel Vibration Reliability Study July 28, 2017 81
4.2 Using CIRFT S-N Data and SNF System Vibration Time-History Data to Determine SNF System AD
4.2.1 CIRFT Load Determination from Random Vibration Histogram The typical random vibration history in the time domain can be transformed into the frequency domain using the Fast Fourier Series Transformation (FFT) scheme, as illustrated in Figure 37 for a vibration time-history available at the local fuel rod level. A more complex routine would be followed if only cask external vibration data are provided and if SNF system structural dynamic analyses are needed to develop localized SNF rod vibration spectrum, as illustrated in Figure 38.
Figure 37. Vibration amplitude in frequency domain chosen for CIRFT testing.

CIRFT Data Update and Data Analyses for Spent Nuclear Fuel Vibration Reliability Study 82 July 28, 2017
Figure 38. Estimating SNF system stress-strain based on cask external vibration data.
From FCRD-UFD-2013-000325 [27], the maximum cladding stress on the SNF system is estimated as 44.1 MPa, as shown Figure 39; and the corresponding equivalent bending moment for an HBU HBR rod is estimated at 8.4 N-m. A series of CIRFT testing was performed with the similar loading range, and the associated CIRFT testing results and the CIRFT specimens’ details, including oxide thickness and specimen relative physical locations, are illustrated in Figure 40. The highest oxide thickness sample of an HBR rod located at the near top of SNF rod region has shortest fatigue life compared to the others.
Figure 39. Full model stress results for the SNF rod under rail transport [26]; maximum stress of 44.1 MPa is equivalent to an 8.4 N-m bending loading on an HBU HBR rod under CIRFT testing.

CIRFT Data Update and Data Analyses for Spent Nuclear Fuel Vibration Reliability Study July 28, 2017 83
Figure 40. Weakest portion within an HBU HBR fuel assembly located at the upper region of SNF rod as indicated from CIRFT vibration test results.
4.2.2 SNF System Transport AD Evaluation Before pursuing the AD evaluation, the major damage mechanisms of an HBU SNF assembly vibration must be understood. There are two types of loading modes involved in SNF transport under NCT: (1) harmonic vibration loading modes and (2) periodic transient shocks loading mode, including SNF system contact interactions. The associated damage mechanisms are described below.
1) Harmonic vibration loading mode:
• Crack growth is likely initiated at the outer clad wall under loading based on the maximum axial tensile stress that occurred on the outer cladding wall.
• No obvious crack growth was observed in the as-irradiated CIRFT test PIE data due to circumferential hydride rim reinforcement near the outer cladding wall.
• The HBU SNF failure under harmonic vibration appears to be due to a spontaneous brittle fracture.
2) Periodic transient shocks loading mode (including SNF system components contact interactions):
• The maximum axial/hoop tensile stress which occurred at the cladding’s inner wall, the crack growth is likely initiated at the cladding’s inner wall region and then propagates toward the cladding’s outer wall under cyclic fatigue loading.
• The crack growth phenomenon was further confirmed based on the severe reduction in flexural rigidity observed from CIRFT real-time monitoring data.
The two failure damage mechanisms affecting SNF vibration stability under NCT are harmonic vibration mode and a transient shock mode. Apparently, the crack growth initiated at the cladding’s inner wall has a higher damage potential. With one 12-inch drop (contact load intensity similar to that of a 20 g transient shock at the spacer grid region), fatigue life was reduced by 75% based on CIRFT test results. Due to the potential repeated contact transient shocks, the associated fatigue life reduction potential deserves special attention and should be included in an AD evaluation.
The effective damage index concept for evaluating SNF system fatigue life using the developed CIRFT testing protocol can be described as shown below:
Effective Damage Index = Σi Weight(i) × Harmonic vibration damage index(i) + Σj Transient shocks damage index (j) (22)
where the harmonic vibration damage index can be obtained from the harmonic vibration CIRFT test result with the associated weight function at the selected frequency and load amplitude (determined from SNF assembly vibration time-history data); and the weight function is the normalized contribution ratio among different harmonic vibration loading amplitudes obtained from FFT performed on a random vibration time-history spectrum in a frequency domain; and where the transient shock damage index can be obtained from an in-house developed combined transient shock impact, CIRFT test results at the target drop impact velocity or displacement, and the harmonic vibration loading intensity.
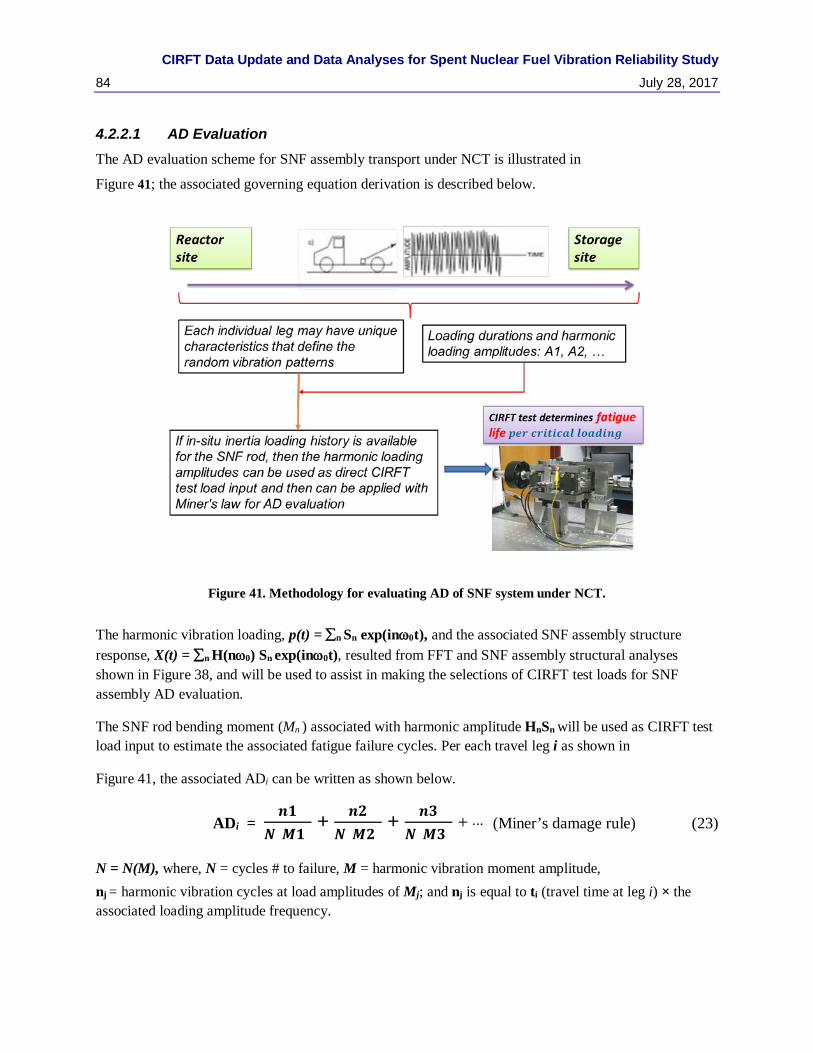
CIRFT Data Update and Data Analyses for Spent Nuclear Fuel Vibration Reliability Study 84 July 28, 2017
4.2.2.1 AD Evaluation The AD evaluation scheme for SNF assembly transport under NCT is illustrated in
Figure 41; the associated governing equation derivation is described below.
Figure 41. Methodology for evaluating AD of SNF system under NCT.
The harmonic vibration loading, p(t) = ∑n Sn exp(inω0t), and the associated SNF assembly structure response, X(t) = ∑n H(nω0) Sn exp(inω0t), resulted from FFT and SNF assembly structural analyses shown in Figure 38, and will be used to assist in making the selections of CIRFT test loads for SNF assembly AD evaluation.
The SNF rod bending moment (Mn ) associated with harmonic amplitude HnSn will be used as CIRFT test load input to estimate the associated fatigue failure cycles. Per each travel leg i as shown in
Figure 41, the associated ADi can be written as shown below.
ADi = 𝒏𝒏𝟏𝟏
𝑵𝑵(𝑴𝑴𝟏𝟏) + 𝒏𝒏𝟐𝟐
𝑵𝑵(𝑴𝑴𝟐𝟐) + 𝒏𝒏𝟑𝟑
𝑵𝑵(𝑴𝑴𝟑𝟑) + ⋅⋅⋅ (Miner’s damage rule) (23)
N = N(M), where, N = cycles # to failure, M = harmonic vibration moment amplitude, nj = harmonic vibration cycles at load amplitudes of Mj; and nj is equal to ti (travel time at leg i) × the associated loading amplitude frequency.

CIRFT Data Update and Data Analyses for Spent Nuclear Fuel Vibration Reliability Study July 28, 2017 85
AD = Σi ADi , (24)
and failure occurs when AD = 1 .
4.2.2.2 Effective Lifetime Evaluation per Specific Vibration Spectrum If the probability density function p(S) for stress amplitude S is available, then the AD can be written as.
𝑨𝑨𝑨𝑨 = ∫ 𝒏𝒏(𝑺𝑺)𝑵𝑵(𝑺𝑺)
𝒅𝒅𝑺𝑺𝒏𝒏𝟎𝟎 = 𝝎𝝎𝝎𝝎
𝟐𝟐𝝅𝝅 ∫𝒑𝒑(𝑺𝑺)𝑵𝑵(𝑺𝑺)
𝒅𝒅𝑺𝑺𝒏𝒏𝟎𝟎 , (25)
, 𝜎𝜎𝑠𝑠2 is variance of critical stress S(t), N(S) is the number cycles to where, failure, S is the harmonic stress amplitude, and n(S) is the number of
cycles at harmonic stress amplitude S.
Substitute 𝑵𝑵(𝑺𝑺) = �𝑺𝑺𝟏𝟏𝑺𝑺�𝒃𝒃𝑵𝑵𝟏𝟏 (obtained from CIRFT S-N trend curve) and p(s) into Eq. 24, then AD can
be written as below,
𝑨𝑨𝑨𝑨 = 𝝎𝝎𝝎𝝎𝟐𝟐𝝅𝝅𝑵𝑵𝟏𝟏
�𝝈𝝈𝒔𝒔𝑺𝑺𝟏𝟏�𝒃𝒃𝟐𝟐𝒃𝒃/𝟐𝟐 �𝒃𝒃
𝟐𝟐�! (26)
By setting AD = 1, the estimated SNF system failure life time, Tfailure, can be written as
𝝎𝝎𝒇𝒇𝒇𝒇𝒇𝒇𝒇𝒇𝒇𝒇𝒇𝒇𝒇𝒇 = 𝟐𝟐𝝅𝝅𝑵𝑵𝟏𝟏𝝎𝝎
�𝑺𝑺𝟏𝟏𝝈𝝈𝑺𝑺�𝒃𝒃 𝟐𝟐𝒃𝒃/𝟐𝟐
(𝒃𝒃/𝟐𝟐)! (27)

CIRFT Data Update and Data Analyses for Spent Nuclear Fuel Vibration Reliability Study 86 July 28, 2017
This page is intentionally left blank.

CIRFT Data Update and Data Analyses for Spent Nuclear Fuel Vibration Reliability Study July 28, 2017 87
5. CONCLUSIONS The CIRFT approach demonstrates the controllable fatigue fracture on HBU SNF in a normal vibration mode, which allows for examination of the underlying mechanism of the SNF system’s dynamic performance. General observations from CIRFT evaluations include the following:
• The fuel pellet provided strength (flexural rigidity) to the fuel/cladding system and also introduced cladding stress concentrations at PPIs.
• When the fuel is fatigued to failure, the failure occurs or initiates primarily at the PPI.
• Pellet and clad dimensions/properties and their interface bounding efficiency can affect SNF fatigue characteristic and flexural strength.
• The SNF rod system has significant stress concentrations and residual stress inherited from reactor operation.
• In dynamic CIRFT evaluations, fuel pellets retain their shapes (dishing and chamfering is evident) and do not become fragmented—very little residue was released from rods upon fracture.
• Considering the complexity and nonuniformity of the HBU fuel cladding system, it was significant to find that the strain or equivalent stress-to-failure data for the SNF was characterized by a curve that would be expected in standard uniform materials.
• It was significant to find that the HBU HBR exhibited an endurance limit, if an endurance limit is defined by survival of >107 cycles.
• High oxide thickness and high hydrogen concentration did affect SNF system strength and showed significant reduction in SNF rod fatigue life.
• SNF failures depend on loading intensity and loading rates; fuel assembly contact interactions induced by transient shocks under NCT can significantly reduce SNF fatigue lifetime.
• In addition to the fatigue strength data, the SNF system’s fracture toughness data are also essential for the SNF vibration reliability study, especially in a high-rate of transient shocks loading of NCT.
The more specific findings from this report are stated below.
5.1 CIRFT Data Trends The lessons learned from studying CIRFT test data and the curvature adjustment are detailed below.
• The curvature measurement data from a CIRFT test were updated with LVDTs probe spacing adjustments and LVDTs stem dynamic stability correction factor. This resulted in a reduction of over 50% in curvature measurements compared to measurements using unadjusted curvature data.
• The equivalent stress and strain collapsed all CIRFT data points from all HBU SNFs into a single zone. At the same stress or strain level, a detailed examination based on the mean trend curves of the corresponding subgroups revealed that fatigue lives display a descending order as follows: LMK, HBR, and MOX.
• The apparent knee point in the curve of moment and curvature or equivalent quantities is more clearly defined for LMK and HBR fuels.
• Both the 12-inch drop and the RHT appear to negatively impact the fatigue life of CIRFT specimens.

CIRFT Data Update and Data Analyses for Spent Nuclear Fuel Vibration Reliability Study 88 July 28, 2017
• The effect of the thermal heating treatment on a MOX fuel rod was relatively small at the higher loading amplitude, and it became more significant at the low lading amplitude. Thermal heating treatment extends the fatigue life of MOX specimens; this is primary due to a significant reduction in pellet-cladding bonding efficiency as discussed earlier. However, HR4 CIRFT testing of the heat treated HBR rod showed that heat treatments have a negative impact on the fatigue life of the HBR rod. This may indicate that the effect of heat treatment on SNF rods is likely to be dependent on the material and the SNF fuel-cladding system geometry.
• The development of the MESA enables proper translation of the global CIRFT test results of moment-curvature data into a local cladding stress-strain profile.
5.2 Damage Mechanisms Involved in SNF Vibration under NCT Based on CIRFT testing results from harmonic vibration loading and prior harmonic vibration load, the test specimen underwent a 12-inch drop, and two damage mechanisms were identified, as detailed below.
• Due to maximum axial tensile stress which occurred on the cladding outer wall under harmonic vibration loads, the crack that formed was likely initiated at the cladding’s outer wall. However, due to significant clad matrix reinforcement from the circumferential hydride rim near the cladding’s outer wall, the PIE of CIRFT tested samples only showed complex delaminate layers of the cladding without clear indication of the fatigue crack growth profile. This indicates that the hydride rim in-turn became the crack propagation barrier in the radial direction, eventually forcing the crack propagation orientation along the hydride axial and circumferential orientations.
• Due to maximum axial and hoop tensile stress which occurred on the cladding’s inner wall under transient shock loads, the crack was likely initiated at the cladding’s inner wall region and then propagated toward the cladding’s outer wall. Thus, the primary reason that the flexural rigidity vs. the number of cycles showed several abrupt drops of flexural rigidity was due to the crack growth from the cladding’s inner wall.
• There are two failure damage mechanisms observed from a harmonic vibration mode and a transient shock mode (induced by fuel assembly contact interaction; in this case a Sandia truck test of 20 g acceleration data was used for the demonstration). Apparently, the crack propagation from cladding’s inner wall has a much higher efficiency due to less resistance from the hydride composite in the cladding’s inner wall region once the radial crack was initiated.
• As the result of a12-inch drop (load intensity is equivalent to a 20 g transient shock at the spacer grid region), fatigue life was observed to be reduced by 75%.
• Due to the potential repeated contact transient shocks, the potential for reduced associated fatigue life should be investigated further.

CIRFT Data Update and Data Analyses for Spent Nuclear Fuel Vibration Reliability Study July 28, 2017 89
6. REFERENCES 1. Wang, J.-A. J, H. Wang, T. Cox, and Y. Yan (2012). Progress Letter Report on U-Frame Test
Setup and Bending Fatigue Test for Vibration Integrity Study (Out-of-Cell Fatigue Testing Development–Task 2.3). Oak Ridge, TN: Oak Ridge National Laboratory. Report No. ORNL/TM-2012/417.
2. Wang, J.-A. J, H. Wang, and T. Tan, inventors; Oak Ridge National Laboratory, assignee. Reversal Bending Fatigue Testing (2014). United States patent US 8,863,585 B2. Oct. 21, 2014.
3. Wang, H., J.-A. J. Wang, T. Tan, H. Jiang, T. S. Cox, R. L. Howard, B. B. Bevard, and M. E. Flanagan. (2013) “Development of U-frame Bending System for Studying the Vibration Integrity of Spent Nuclear Fuel,” Journal of Nuclear Materials, 440, 201–13.
4. Wang, J.-A. J., H. Wang, T. Cox, and C. Baldwin (2013). Progress Letter Report on Bending Fatigue Test System Development for Spent Nuclear Fuel Vibration Integrity Study (Out-of-Cell Fatigue Testing Development–Task 2.4). Oak Ridge, TN: Oak Ridge National Laboratory. Report No. ORNL/TM-2013/225.
5. Wang, J.-A. J., H. Wang, B. B. Bevard, R. L. Howard, and M. E. Flanagan (2013). “Reversible Bending Fatigue Test System for Investigating Vibration Integrity of Spent Nuclear Fuel During Transportation.” Paper presented at the International Symposium on the Packaging and Transportation of Radioactive Materials, San Francisco, CA, August 18–23.
6. Wang, J.-A. J. and H. Wang. (2014). The Development of Reversible Bending Fatigue Tester and Its Application to High Burn-up Spent Nuclear Fuel Integrity Study under Normal Transportation Vibration. Oak Ridge, TN: Oak Ridge National Laboratory. Report No. ORNL/TM-2013/573. http://info.ornl.gov/sites/publications/Files/Pub47469.pdf.
7. Wang, J.-A. J. and H. Wang (2014). Semi-Annual Progress Letter Report on Used Nuclear Fuel Integrity Study in Transportation Environments. Report No. ORNL/TM-2014/63. http://info.ornl.gov/sites/publications/Files/Pub48652.pdf.
8. Wang, J.-A. J., H. Wang, and H. Jiang (2014). FY14 Status Report: CIRFT Testing Results on High Burnup UNF. Oak Ridge, TN: Oak Ridge National Laboratory. Report No. ORNL/LTR-2014/310. http://info.ornl.gov/sites/publications/Files/Pub51054.pdf.
9. Wang, J.-A. J. and H. Wang (2015). Mechanical Fatigue Testing of High-Burnup Fuel for Transportation Applications. Oak Ridge, TN: Oak Ridge National Laboratory. Report Nos. ORNL/TM-2014/214 and NUREG/CR-7198.
10. Wang, J.-A. J., H. Wang, H. Jiang, Y. Yan, and B. B. Bevard (2015). CIRFT Testing of High-Burnup Used Nuclear Fuel Rods from Pressurized Water Reactor and Boiling Water Reactor Environments. Oak Ridge, TN: Oak Ridge National Laboratory. Report Nos. ORNL/SPR-2015/313 and M2-FCRD-UFD-2015-000101.
11. Wang, J.-A. J., H. Wang, Y. Yan, R. Howard, and B. B. Bevard (2011). High Burn-up Spent Fuel Vibration Integrity Study Progress Letter Report (Out-of-Cell Fatigue Testing Development–Task 2.1). Oak Ridge, TN: Oak Ridge National Laboratory. Report No. ORNL/TM-2010/288.
12. Wang, J.-A. J., H. Wang, T. Tan, H. Jiang, T. Cox, and Y. Yan (2012). Progress Letter Report on U Frame Test Setup and Bending Fatigue Test for Vibration Integrity Study (Out-of-Cell Fatigue Testing Development–Task 2.2). Oak Ridge, TN: Oak Ridge National Laboratory. Report No. ORNL/TM-2011/531.
13. Wang, J.-A. J., H. Wang, and T. Tan (2011). An Innovative Dynamic Reversal Bending Fatigue Testing System for Evaluating Spent Nuclear Fuel Rod Vibration Integrity or Other Materials Fatigue Aging Performance. Oak Ridge, TN: Oak Ridge National Laboratory. ORNL Invention Disclosure No. 201102593. DOE Report No. DOE S 124,149.
14. Wang, J.-A. J., H. Wang, B. B. Bevard, R. L. Howard, and M. E. Flanagan (2013). “SNF Test System for Bending Stiffness and Vibration Integrity” International High-Level Radioactive Waste Management Conference, Albuquerque, NM, April 28–May 2, 2013.

CIRFT Data Update and Data Analyses for Spent Nuclear Fuel Vibration Reliability Study 90 July 28, 2017
15. Wang, J.-A. J., H. Wang, T. Cox, and C. Baldwin (2013). Progress Letter Report on Bending Fatigue Test System Development for Spent Nuclear Fuel Vibration Integrity Study (Out-of-Cell Fatigue Testing Development–Task 2.4). Oak Ridge, TN: Oak Ridge National Laboratory. Report No. ORNL/TM-2013/225.
16. Jiang, H., J.-A. Wang, and H Wang (2016). “The Impact of Interface Bonding Efficiency on High-Burnup Spent Nuclear Fuel Vibration Integrity,” Journal of Nuclear Engineering and Design, 309 40–52.
17. Ruzauskas, E. J. and K. N. Fardell(2001). Design, Operation, and Performance Data for High Burnup PWR Fuel from H. B. Robinson Plant for Use in the NRC Experimental Program at Argonne National Laboratory, Electric Power Research Institute, EPRI Report 1001558.
18. Wang, J.-A. and H. Jiang (2014). Quantification of CIRFT System Biases and Uncertainties When Testing High-Burnup Spent Nuclear Fuel, ORNL/TM-2014/288, DOE FCRFD-2014-000604.
19. Wang, J.-A., H. Jiang, and H. Wang (2014). Using Finite Model Analysis and Out of Hot Cell Surrogate Rod Testing to Analyze High Burnup Used Nuclear Fuel Mechanical Properties, ORNL/TM-2014/257, DOE FCRD-UFD-2014-000603.
20. Daum, R.S., S. Majundar, and M. C. Billone (2008). “Experimental and analytical investigation of the mechanical behavior of high-burnup Zircaloy-4 fuel cladding,” J. ASTM International, 5, Paper ID JAI101209.
21. Geelhood, K. J. et al. (2008). PNNL Stress/Strain Correlation for Zircaloy, PNNL-17700, Pacific Northwest National Laboratory, Richland, Washington, July 2008.
22. Morris, R.N., C. A. Baldwin, R. Battiste, J. M. Giaquinto, I. C. Gauld, J. G. Hemrick, K. J. Leonard, H. F. Longmire, W. J. McAfee, J. K. McCoy, J. Myers, S. L. Voit, J.-A. Wang, and Y. Yan (2013). MOX PIE Fuel and Clad Examination Final Report, ORNL/MD/LTR-352 Rev 2.
23. Wang, J.-A., Wang, H., Yan, Y., “ORNL Interim Progress Report on Hydride Reorientation CIRFT Tests,” ORNL/TM-2016/660, October 2016.
24. Wang, J.-A. et al. FY 2016 Status Report: Documentation of All CIRFT Data including Hydride Reorientation Tests. ORNL/SR-2016/424, DOE M2FT-16OR080202031, Oak Ridge, TN: Oak Ridge National Laboratory, September 2016.
25. Jiang, H. and J.-A. Wang (2016). “Spent Nuclear Fuel System Dynamic Stability under Normal Conditions of Transport,” Journal of Nuclear Engineering and Design, 310, 1–14.
26. Billone, M., T. A. Burtseva, M.A. Martin-Rengel, Effects of Lower Drying-Storage Temperatures on the DBTT of High Burnup PWR Cladding, ANL-15/21, FCRD-UFD-2015-000008, Argon National laboratory, August 2015.
27. Adkins, H. E. et al., Used Nuclear Fuel Loading and Structural Performance Under Normal Conditions of Transport—Demonstration of Approach and Results of Used Fuel Performance Characterization, FCRD-UFD-2013-000325, DOE UFDC Program, September 30, 2013.