FY 2017 results - valeo.comOEM sales and order intake by destination including joint ventures out of...
79
CONFIDENTIAL February 22, 2018 2017 RESULTS JACQUES ASCHENBROICH – CHAIRMAN & CEO
Transcript of FY 2017 results - valeo.comOEM sales and order intake by destination including joint ventures out of...

CONFIDENTIALFebruary 22, 2018
2017 RESULTS
JACQUES ASCHENBROICH – CHAIRMAN & CEO

v
2017 HIGHLIGHTS P&L
2016 2017 Year-on-year
Reported Like-for-like
Sales (€bn)
OEM Sales (€bn)
OEM Sales outperformance
16.5
14.4
+8pts
18.6
16.1
+5pts
+12%
+12%
na
+7%
+7%
na
CONFIDENTIALFebruary 22, 2018
* Including joint ventures and associates (1) see glossary page 77
2
VV
Gross margin (€m)(as a % of sales)
Net R&D (€m)(as a % of sales)
Operating margin*(1) (€m)(as a % of sales)
Net income (€m) excl. a €117m non-recurring expense relating to the decline in value of deferred tax assets (as a % of sales)
Net income (€m) incl. a €117m non-recurring expense relating to the decline in value of deferred tax assets (as a % of sales)
3,02018.3%
9565.8%
1,3348.1%
9255.6%
9255.6%
3,47418.7%
1,1306.1%
1,4778.0%
1,0035.4%
8864.8%
+15%
+18%
+11%
+8%
-4%

2017 HIGHLIGHTS
2016 2017 Year-on-year
Order intake (1) (excl. Valeo Siemens eAutomotive) (€bn) 23.6 27.6 +17%
Order intake
CONFIDENTIALFebruary 22, 2018
VV
3
(1) See glossary page 77
Innovative products (in % of order intake)
Valeo Siemens eAutomotive 2017 (€bn)
Valeo Siemens eAutomotive 2017 + 2018 YTD (€bn)
50%
na
na
50%
6.1
10.0
=
na
na

2017 HIGHLIGHTS Cash
2016 2017 Year-on-year
EBITDA(1) (€m)
CAPEX (€m)
Free cash flow
2,144
1,249
661
2,436
1,745
278
+14%
+40%
-58%
CONFIDENTIALFebruary 22, 20184
(1) See glossary page 77
Free cash flow(1) (€m)
Cash conversion rate (FCF/EBITDA)
ROCE(1)
Net debt(1)(€m)
661
31%
34%
537
278
11%
30%
1,852
-58%
-20pts
-4pts
+€1,315m
Proposed 2017 dividend (in €/share)
Payout ratio
1.25
32%
1.25
34%
=
+2pts

CONFIDENTIAL
OUTLOOK
February 22, 2018

VALEO GROUP
Based on the following assumptions:
�an increase in global automotive production of 1.5% in 2018;
� raw material prices and exchange rates in line with current levels.
CONFIDENTIALFebruary 22, 20186
The Valeo Group has set the following objectives:
�nominal sales growth of around 8% for 2018;
� in 2018, like-for-like growth in original equipment sales of around 5%, accelerating in the second half ahead of expected double-digit growth in 2019;
� in 2018, operating margin excluding share in net earnings of equity-accounted companies (as a % of sales) in line with 2017, despite the recent rise in (i) raw material prices and (ii) the value of the euro against the main currencies to which the Group is exposed.

VALEO SIEMENS EAUTOMOTIVE
�as previously noted, the joint venture had a strong order intake of 6.1 billion euros in 2017 and a cumulative 10 billion euros at end-February 2018;
�accordingly, the “Share in net earnings of equity-accounted companies” caption will have an impact of around -0.2 points on Valeo’s statement of income in 2018.
CONFIDENTIALFebruary 22, 20187
Medium-term objectives:
By 2022, Valeo Siemens eAutomotive should be delivering:
� sales of more than 2 billion euros,
� a similar EBITDA margin (as a % of sales) to that of Valeo.

Ahead of mid-term plan
CONFIDENTIAL
2017 ORDER INTAKE OF:€27.6BN AT VALEO (EXCL. VALEO SIEMENS EAUTOMOTIVE), UP 17% YOY€6.1BN AT VALEO SIEMENS EAUTOMOTIVE
CONFIRMING OUR FUTURE HIGH GROWTH POTENTIAL
February 22, 2018

Order intake€bn
17.5
20.1
23.6
€27.6BN VALEO ORDER INTAKE€6.1BN VALEO SIEMENS EAUTOMOTIVE ORDER INTAKE IN 2017, A CUMULATIVE €10BN AT END-FEBRUARY
6.1***Valeo Group order intake** Valeo Siemens eAutomotive***
+17%
Valeo Group’s order intake to €27.6bn
� Up 17% year-on-year
� Up 14% CAGR since 2008
27.6
3.9**** Valeo Siemens eAutomotiveA cumulative €10bn order intake at end-February
CONFIDENTIAL
2005 2006 2007 2008 2009 2010 2011 2012 2013 2014 2015 2016 2017Average over the period
February 22, 2018
Innovation fueling future organic growthas a % of order intake**
(1) Products and technologies sold by less than 3 years excl. Valeo Siemens eAutomotive, FTE automotive & Valeo-Kapec
Innovation 50% (1)
8.8
14.7
17.5
9
*Reference 2008 (average 2005-2008) � 2017 (excluding Valeo Siemens eAutomotive)** see glossary page 77 excl. Access Mechanisms between 2005 & 2013 & Valeo Siemens eAutomotive ***Valeo Siemens eAutomotive order intake total amount registered in 2017 ****YTD 2018
CAGR*+14%
+17%yoy
11.9

SA2%
Asia excl. China16%
NA
SA2%
Asiaexcl. China
13%NA
Order intake of €27.6bn
Asia40%€11bnAsia
32%€5.3bn
€3.2bn
€4.4bn
20%
16%
OEM sales of €16.1bn
Order Intake/ annualizedOEM sales
ratio*
BOOK TO BILL AT 1.6X (EXCL. VALEO SIEMENS EAUTOMOTIVE)
CONFIDENTIALFebruary 22, 2018
16%
China16%
Europe
China27%Europe
% of 2017 order intake*% of 2017 OEM sales*
€5.3bn
€7.6bn
€3.2bn
€11.6bn
46%
42%
ratio*
AsiaOf which China
1.9x2.5x
North America 1.3x
South America 1.5x
Europe 1.5x
Group 1.6x
38%with local Chinese
OEMs
10
*OEM sales and order intake by destination including joint ventures out of Valeo Siemens eAutomotive
31%with local Chinese
OEMs

Join forces to create a global champion of innovati ve and affordable high voltage components and syste ms for Hybrid and Electric Vehicles with a world-class por tfolio, excellent customer reputation, engaged empl oyees and
solid shareholders’ return on investment by 2020
VALEO SIEMENS EAUTOMOTIVE€6.1BN OF ORDER INTAKE IN 2017, A CUMULATIVE €10BN AT END-FEBRUARY 2018
CONFIDENTIALFebruary 22, 201811

STRONG POSITIONING OF VALEO SIEMENS EAUTOMOTIVE IN THE ELECTRIC MARKET
€10bn
Electric motor51%
Inverter40%
Charger9%
CONFIDENTIAL12 February 22, 2018
€6.1bn €10bn
2017 + 2018 YTD2017
Europe49%
China51%
% of €10bn order intake

CONFIDENTIAL
H2 HIGHLIGHTS
February 22, 2018

SALES UP 12% AS REPORTED, UP 7% LIKE-FOR-LIKE
18,550
9,086
+7%+5%+9%Like-for-likeH2
CONFIDENTIALFebruary 22, 2018
9,464
18,550
H1 17 H2 17 2017
+12%FY 16 16,519
Exchange rates -1.1%
Scope +6.8%
+8%
H2 16 8,389
Exchange rates -3.5%
Scope +7.2%
€m
Reported +16%
H1 16 8,130
Exchange rates +1.3%
Scope +6.4%
14

OEM SALES UP 12% AS REPORTED, UP 7% LIKE-FOR-LIKE
OEM sales
7,885
Aftermarket
963
924
1,887
H1 17 H2 17 2017
+7%*+5%*+9%**Like-for-like
+4%*+3%*+5%*
H2
CONFIDENTIALFebruary 22, 2018
8,235 7,884
16,120
H1 17 H2 17 2017
+12%**+11%**
Miscellaneous
266 266
543
277
H1 17 H2 17 2017
**Reported +12%**
FY 16 14,403
Exchange rates -1.1%
Scope +6.1%
+8%**
H2 16 7,297
Exchange rates -3.6%
Scope +6.6%
+9%*-3%*
+14%**
+27%*
+24%**+7%**+49%**
+16%**
H1 16 7,106
Exchange rates +1.4%
Scope +5.8%
€m
15
-0.6PT IMPACT OF SOUTH KOREA IN H2

North AmericaOEM sales** +6%
Production*** +4%
H2Like-for-like
Europe*Production*** +5%
North AmericaProduction*** -7%
46% of Valeo sales**
19% of Valeo sales**OEM
sales** +1%
OEM sales** +5%
Outperf. +8pts
Outperf. 0pt
WorldProduction***+2%
Outperf. +3pts
3-POINT OEM SALES OUTPERFORMANCE, INCLUDING -0.6 PT IMPACT OF SOUTH KOREA
OEM sales** +5%
South Koreanimpact -0.6pts
CONFIDENTIAL
* Europe including Africa; Asia including Middle East
** Valeo OEM sales by destination***LMC estimates released on February 8, 2018 – light vehicle production
Asia* excl. ChinaProduction***+3%
South AmericaProduction***+22%
17% of Valeo sales**
2% of Valeo sales**
OEM sales** +3%
OEM sales** +19%
16% of Valeo sales**OEM
sales** +11%
ChinaProduction***+1%
Underperf. -3pts
Outperf. 0pt
Outperf. +10pts
16 February 22, 2018
South Koreanimpact -4.7pts

JapanProduction** +3%
24% of Asian sales*
South KoreaProduction** -4%
18% of Asian sales*
OEM sales* -3%
H2Like-for-like
Underperf. -6pts
AsiaProduction** +2%
Outperf. +5pts
33% of total sales*
5-POINT OUTPERFORMANCE IN ASIA, INCLUDING – 2.2 PT IMPACT OF SOUTH KOREA
OEM sales** +7%
South Koreanimpact -2.2pts
OEM sales*
+3%
South Koreanimpact
-10.1pts
OEM sales asreported +73%
CONFIDENTIAL
Production** -4%
IndiaProduction** +6%
3% of Asian sales*
ChinaProduction** +1%
49% of Asian sales*
OEM Sales***
+8%
*Valeo OEM sales by destination**LMC estimates released on February 8, 2018 – light vehicle production***Indian operations
Outperf. +10pts
Outperf. +2pts
Outperf. +7ptsOEM sales*
+11%
17 February 22, 2018
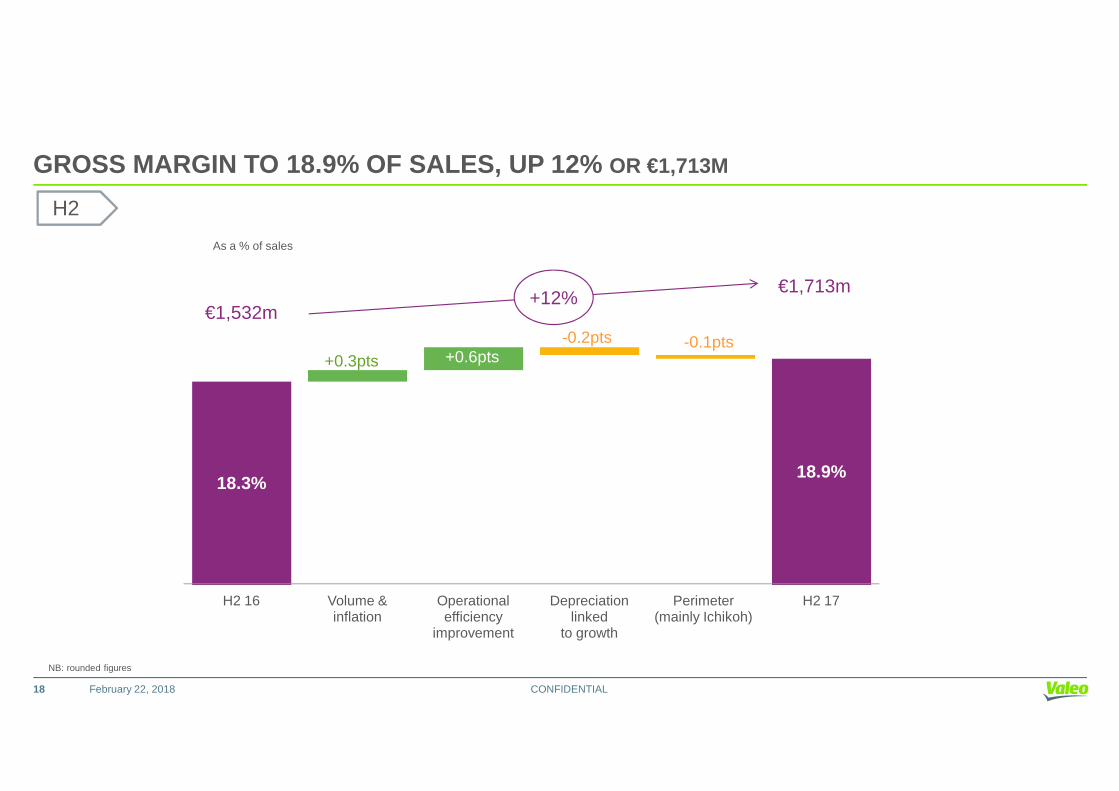
GROSS MARGIN TO 18.9% OF SALES, UP 12% OR €1,713M
+0.3pts +0.6pts-0.2pts -0.1pts
+12%€1,713m
€1,532m
As a % of sales
H2
CONFIDENTIALFebruary 22, 2018
18.3%18.9%
H2 16 Volume & inflation
Operationalefficiency
improvement
Depreciationlinked
to growth
Perimeter(mainly Ichikoh)
H2 17
NB: rounded figures
18

OPERATING MARGIN* TO 8.0% OF SALES, UP 5% OR €723M
+0.6pts+0.1pts-0.4pts
-0.5pts**
€687m
€723m+5%
As a % of sales
H2
CONFIDENTIALFebruary 22, 2018
8.2% 8.0%
H2 16 Gross margin Net R&D SG&A JV & Associates H2 17
* Including joint ventures and associates **rounded figure
19

CONFIDENTIAL
2017 SALES GROWTH WITH
February 22, 2018
SALES OF €18.6BN, UP 12% AS REPORTEDUP 7% LIKE-FOR-LIKE
OEM SALES, UP 12% AS REPORTEDUP 7% LIKE-FOR-LIKE, 5-POINT OUTPERFORMANCE, INCLUD ING SOUTH KOREAN IMPACT
AFTERMARKET SALES, UP 12% AS REPORTEDUP 4% LIKE-FOR-LIKE

SALES UP 12% AS REPORTED, UP 7% LIKE-FOR-LIKE
18,550
1,887 543
+7%+7%Like-for-like +4% +9%
2017
CONFIDENTIALFebruary 22, 2018
16,12018,550
OEM Aftermarket Miscellaneous Total sales
+12%FY 16 16,519
Exchange rates -1.1%
Scope +6.8%
+12%FY 16 14,403
Exchange rates -1.1%
Scope +6.1%
€m
Reported
21
+12%FY 16 1,679
Exchange rates -1.3%
Scope +10.1%
+24%FY 16 437
Exchange rates -0.9%
Scope +16.1%
Incl. - 0.9 pt impact of South Korea

North AmericaOEM sales** +6%
Production*** +4%
2017Like-for-like
Europe*Production*** +3%
North AmericaProduction*** -4%
47% of Valeo sales**
20% of Valeo sales**OEM
sales** +4%
OEM
OEM sales** +6%
Outperf. +8pts
Outperf. +3pts
WorldProduction***+2%
Outperf. +5pts
5-POINT OEM SALES OUTPERFORMANCE, INCLUDING - 0.9 PT IMPACT OF SOUTH KOREA
OEM sales** +7%
South Koreanimpact -0.9pts
South Korean
CONFIDENTIAL
* Europe including Africa; Asia including Middle East
** Valeo OEM sales by destination***LMC estimates released on February 8, 2018 – light vehicle production
Asia* excl. ChinaProduction***+4%
South AmericaProduction***+22%
16% of Valeo sales**
2% of Valeo sales**
OEM sales** +4%
OEM sales** +16%
15% of Valeo sales**
OEM sales** +17%
ChinaProduction***+2%
Underperf. -6pts
Outperf. 0pt
Outperf. +15pts
22 February 22, 2018
Koreanimpact-7.3pts

JapanProduction** +5%
25% of Asian sales*
South KoreaProduction** -3%
18% of Asian sales*
2017Like-for-like
Underperf. -3pts
AsiaProduction** +3%
Outperf. +7pts
31% of total sales*
7-POINT OUTPERFORMANCE IN ASIA, INCLUDING – 3.5 PT IMPACT OF SOUTH KOREA
OEM sales** +10%
OEM sales*
+1%
South Koreanimpact
-15.4pts
OEM sales* +2%South
Koreanimpact -3.5pts
OEM sales asreported +83%
CONFIDENTIAL
Production** -3%
IndiaProduction** +8%
3% of Asian sales*
ChinaProduction** +2%
48% of Asian sales*
OEM Sales***
+14%
*Valeo OEM sales by destination**LMC estimates released on February 8, 2018 – light vehicle production***Indian operations
Outperf. +15pts
Outperf. +6pts
Outperf. +4pts
OEM sales*
+17%
23 February 22, 2018

BALANCED GEOGRAPHIC POSITIONING
Eastern Europe &
Africa15%
WesternEurope
OEM sales by production region
Asia excl.
Eastern Europe &
Africa16%
WesternEurope
% of OEM sales
CONFIDENTIALFebruary 22, 2018
2017
US11%
Mexico10%
SA 2%
China15%
Asia excl. China15%
Europe32%
2016
US12%
Mexico10%
SA 2%
China14%
Asia excl. China12%
Europe34%
54% in Asia& emergingcountries
57% in Asia& emergingcountries
24

BALANCED CUSTOMER PORTFOLIO
French* 14%
Other6%
% of OEM sales
French* 15%
Other6%
German**30%
German**28%
CONFIDENTIALFebruary 22, 2018
American19%
20172016
*Including Opel**Excluding Opel
Asian33%Asian**
26%
American22%
Asian27%
25

GROWTH IN THE 4 BUSINESS GROUPS
As a % of Group sales
Total sales growth(year-on-year)
OEM sales growth (like-for-like)
2017
19% +7%** +6%
23% +7% +4%
CDA*
Powertrain
POWERTRAIN
Incl. - 4.6pt impact of
CONFIDENTIALFebruary 22, 2018
23% +7% +4%
27% +8%*** +9%
31% +25%**** +7%
100% +12% +7%
Visibility
Thermal
Powertrain
* Comfort & Driving Assistance **Including peiker ***Including Spheros *****Including Ichikoh
Group
26
Incl. - 4.6pt impact of
South Korea

OPERATING MARGIN*
UP 15% TO €3,474M OR 18.7% OF SALESGROSS MARGIN
CONFIDENTIAL
UP 11% TO €1,477M OR 8.0% OF SALESOPERATING MARGIN*
February 22, 2018
DOWN 4% TO €886M OR 4.8% OF SALES
* Including joint ventures and associates
UP 8% TO €1,003M OR 5.4% OF SALES
NET INCOME INCL. A €117M NON-RECURRING EXPENSE RELATING TO THE DECLINE IN VALUE OF DEFERRED TAX AS SETS
NET INCOME EXCL. A €117M NON-RECURRING EXPENSE RELATING TO THE DECLINE IN VALUE OF DEFERRED TAX AS SETS

GROSS MARGIN AT 18.7% OF SALES, UP 15% TO €3,474M
+0.5pts
+0.2pts -0.2pts -0.1pts
+15%€3,474m
€3,020m
As a % of sales
CONFIDENTIALFebruary 22, 2018
18.3% 18.7%
2016 Volume & inflation
Operational efficiency
improvement
Depreciationlinked
to growth
Perimeter(mainly Ichikoh)/exchange rates
2017
NB: rounded figures
28

2012-2015 average
2016-2017 average
R&D TDE* (€bn) 1.1 1.8
R&D TDE*/order intake (%) 6.6 6.8
STABLE “R&D TOTAL DEVELOPMENT EFFORT/ORDER INTAKE” RA TIO
CONFIDENTIALFebruary 22, 201829
R&D TDE*/order intake (%) 6.6 6.8
Innovation /order intake (%) 33 50
*R&D Total Development Effort
R&D TOTAL DEVELOPMENT EFFORT PROPORTIONAL TO ORDER INTAKE

NET R&D EXPENDITURE, TO 6.1% OF SALES
956
1,130+18%
Capitalized developmentexpenditureIn €m and as a % of sales
437577
2016 2017
2.6% 3.1%
Net R&DIn €m and as a % of sales
CONFIDENTIALFebruary 22, 2018
2016 2017
5.8%
6.1%+30bps
253 267
2016 2017
1.5% 1.4%
Amortization and impairment of capitalized development expenditureIn €m and as a % of sales
30
CAPITALIZED DEVELOPMENT EXPENDITURE TO 3.1% OF SALE S to sustain record high order intake with improving profitability
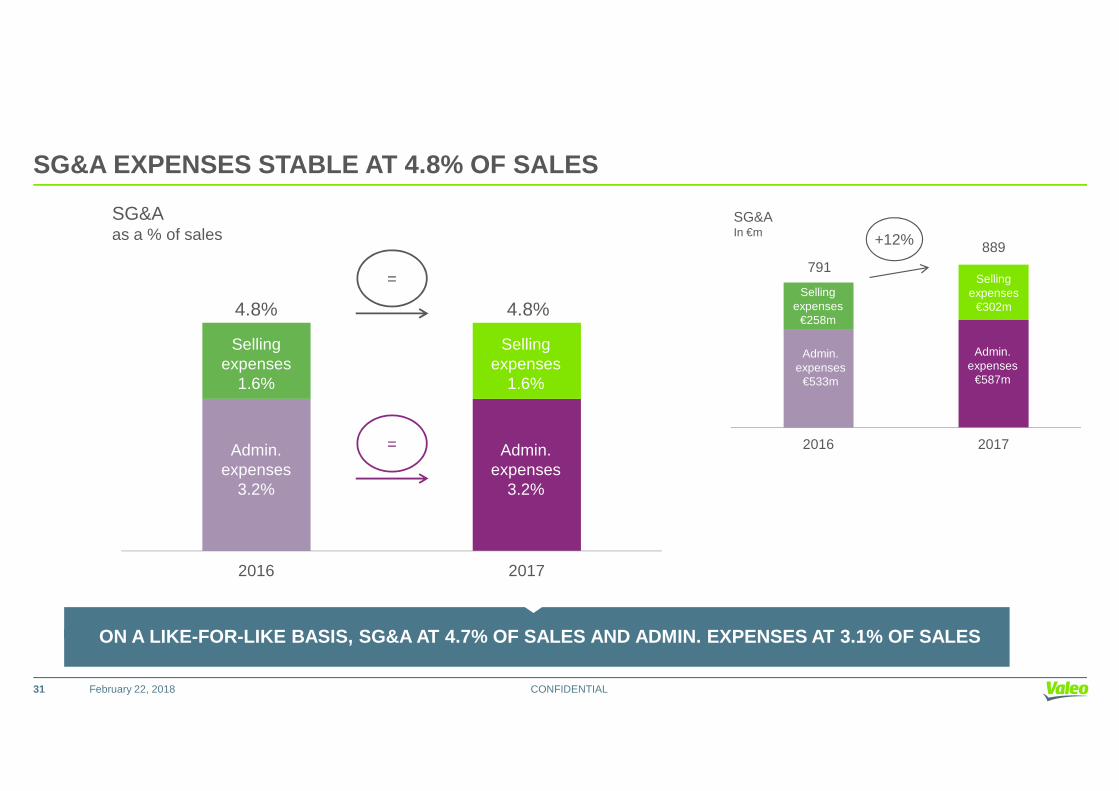
SG&A EXPENSES STABLE AT 4.8% OF SALES
SG&Aas a % of sales
Sellingexpenses
1.6%
Sellingexpenses
1.6%
4.8% 4.8%
=
SG&AIn €m
791889
Sellingexpenses
€258m
Sellingexpenses
€302m
Admin.expenses
€533m
Admin.expenses
€587m
+12%
CONFIDENTIALFebruary 22, 2018
2016 2017
Admin.expenses
3.2%
Admin.expenses
3.2%
= 2016 2017
31
ON A LIKE-FOR-LIKE BASIS, SG&A AT 4.7% OF SALES AND ADMIN. EXPENSES AT 3.1% OF SALES

+0.4pts +0.0pts-0.3pts -0.2pts
As a % of sales
OPERATING MARGIN* TO 8.0% OF SALES, UP 11% OR €1,47 7M
€1,334m
€1,477m+11%
CONFIDENTIAL22 février 2018
8.1% 8.0%
2016 Gross margin Net R&D SG&A JV & Associates 2017
* Including joint ventures and associates
32

OPERATING MARGIN* TO 8.0% OF SALES, UP 11% OR €1,47 7M
H2 16 H2 17 � 2016 2017 �
8,389 9,086 +8% Total sales (€m) 16,519 18,550 +12%
1,53218.3%
1,71318.9%
+12%+60bps
Gross margin As a % of sales
3,02018.3%
3,47418.7%
+15%+40bps
4715.6%
5486.0%
+16%+40bps
Net R&D expenditureAs a % of sales
9565.8%
1,1306.1%
+18%+30bps
407 435 +7% SG&A 791 889 +12%
CONFIDENTIALFebruary 22, 2018
4074.9%
134273
4354.8%
153282
+7%-10bps
+14%+3%
SG&A As a % of sales
Of Which:- Selling expenses- Administrative expenses
7914.8%
258533
8894.8%
302587
+12%=
+17%+10%
6547.8%
7308.0%
+12%+20bps
Operating margin excl. JV & Associates As a % of sales
1,2737.7%
1,4557.8%
+14%+10bps
330.4%
-7-0.1%
na-50bps
JV & AssociatesAs a % of sales
610.4%
220.1%
-64%-30bps
6878.2%
7238.0%
+5%-20bps
Operating margin incl. JV & AssociatesAs a % of sales
1,3348.1%
1,4778.0%
+11%-10bps
33
* Including joint ventures and associates

NET INCOME TO 4.8% OF SALES, DOWN 4% TO €886M
H2 16 H2 17 � 2016 2017 �
8,389 9,086 +8% Total sales (€m) 16,519 18,550 +12%
6878.2%
7238.0%
+5%-20bps
Operating margin incl. JV & AssociatesAs a % of sales
1,3348.1%
1,4778.0%
+11%-10bps
10.0%
(44)-0.5%
-4500%-50bps
Other income & expensesAs a % of sales
(33)-0.2%
(67)-0.4%
+103%+20bps
688 679 -1% Operating income 1,301 1,410 +8%
CONFIDENTIALFebruary 22, 201834
€117M TAX NON-RECURRING EXPENSE
relating to the decline in value of deferredtax assets following US tax reform
6888.2%
6797.5%
-1%-70bps
Operating incomeAs a % of sales
1,3017.9%
1,4107.6%
+8%-30bps
(40)(22)
(36)(22)
-10%=
Cost of net debtOther financial income & expenses
(83)(46)
(73)(47)
-12%+2%
626 621 -1% Income before taxes 1,172 1,290 +10%
(92)15.5%(31)
(195)31.1%(46)
+112%+15.6pts+48%
Income taxesEffective tax rateNon-controlling interests and other
(189)17%(58)
(325)26%(79)
+72%+11pts+36%
5036.0%
3804.2%
-24%+180bps
Net income As a % of sales
9255.6%
8864.8%
-4%-80bps
----
----
----
Net income excl. non-recurring itemsAs a % of sales
9405.7%
1,0405.6%
+11%-10bps
NET INCOME UP 8% TO €1,003M OR 5.4% OF SALES,
excl. this non-recurring charge

EXCL. NON-RECURRING ITEMS, EPS UP 10%
2016 2017 Change
Net income (€m) 925 886 -4%
EPS €3.91 €3.72 -5%
CONFIDENTIALFebruary 22, 2018
Net income (€m) (excluding non- recurring items) 940 1,040 +11%
EPS (excluding non-recurring items) €3.98 €4.37 +10%
35
EXCL. NON-RECURRING ITEMS (incl. a €117m non-recurring expense relating to the decline in value of deferred tax assets), EPS UP 10%

ROCE AT 30% AND ROA AT 19%
2016 2017
Total sales €16.5bn €18.6bn
Operating margin* 8.1% 8.0%
CONFIDENTIALFebruary 22, 2018
Operating margin* 8.1% 8.0%
ROCE(1) 34% 30%
ROA(1) 21% 19%
*incl. joint ventures & associates
36
(1) See glossary page 77

In line withInvestor Day
CONFIDENTIAL
FREE CASH FLOW GENERATION OF €278MCASH CONVERSION RATE AT 11% OF EBITDA
February 22, 2018

EBITDA TO 13.1% OF SALES, UP 14% OR +0.1 PTS
12.7%
13.0%13.1%
In €m and as a % of sales 2015 2016 2017
As a % of sales FY FY FY
CDA 14.5 14.7 14.5
Powertrain 12.8 13.3 13.2
Thermal 10.7 10.0 10.8
Visibility 12.4 13.9 13.2
Group 12.7 13.0 13.1
CONFIDENTIALFebruary 22, 2018
1,8412,144
2,436
2015 2016 2017
Group 12.7 13.0 13.1
38
7%
9%
11%
13%
15%
2014 2015 2016 2017
Comfort and Driving Assistance Systems Powertrain Systems
Thermal Systems Visibility Systems
Group

437 577
924
1,325
7.1%
8.2%
10.3%
Capex*
In €m
+210bps
As a % of sales
1,361
Capex*
Capital.R&D
1,902
+40%
RECORDED CAPEX (INCLUDING CAPITALIZED R&D) 10.3% OF SALES UP 210BPS OR €1,902M
CONFIDENTIALFebruary 22, 2018
2016 2017
2.6% 3.1%
5.6%7.1%
2016 2017
Capex*
Capitalized R&D
*excluding capitalized R&D
R&D
39
40% INCREASE IN RECORDED CAPEXsupporting record high order intake and sales growth acceleration from H2 2018

FREE CASH FLOW GENERATION OF €278M
H2 16 H2 17 2016 2017
1,097 1,221 EBITDA (€m) 2,144 2,436
40 64 Operating working capital 76 19
(34) (28) Restructuring & antitrust (52) (105)
(130)
(124)(37)
(167)
(115)(29)
Other operating items (incl. taxes)Of which:TaxesPensions
(258)
(257)(48)
(327)
(265)(27)
+14% at 13.1% of sales
CONFIDENTIALFebruary 22, 2018
*excluding sale of trade receivables
40
Out of which:� €537m relative mainly to Ichikoh, FTE Automotive & Valeo-Kapec’s acquisitions� €317m of dividends paid
(37) (29) Pensions (48) (27)
973 1,090 Cash from operating activities* (€m) 1,910 2,023
(651) (911) Capex (incl. capitalized R&D) outflow (1,249) (1,745)
322 179 Free cash flow* (€m) 661 278
(6) (2) Interest (58) (63)
(96) (562) Other financial items (992) (1,007)
220 (385) Net cash flow (€m) 389 (792)
537 1,852 Net debt (€m) 537 1,852
+40%
11% of EBITDA

CONFIDENTIAL
STRONG BALANCE SHEET
February 22, 2018

Shareholders’ equity and net debtNet financial debt over EBITDA
2,144
1,118
2,312
1,852
2,436
537
4,117
1,118
4 ,116
1,852
4,414
DEBT RATIOS
CONFIDENTIAL
Shareholders’ equity (€m)excluding minority interests
Net debt (€m)
Gearing27%
Leverage0.25x
Net debt (€m) EBITDA 12 months rolling (€m)
537
0
1,118
0Dec 31, 2016 June 30, 2017 Dec 31, 2017
Leverage0.48x
Leverage0.76x
Gearing42%
Gearing13%
537Dec 31,
2016June 30,
2017Dec 31,
2017
LT Outlook ST
Moody’s Baa2 Stable Prime-2
S&P BBB Stable A-2
Net debt / EBITDA covenant of 3.25
February 22, 201842
2000
2500
3000
3500
4000
Undrawncredit lines4.3 yearsmaturity
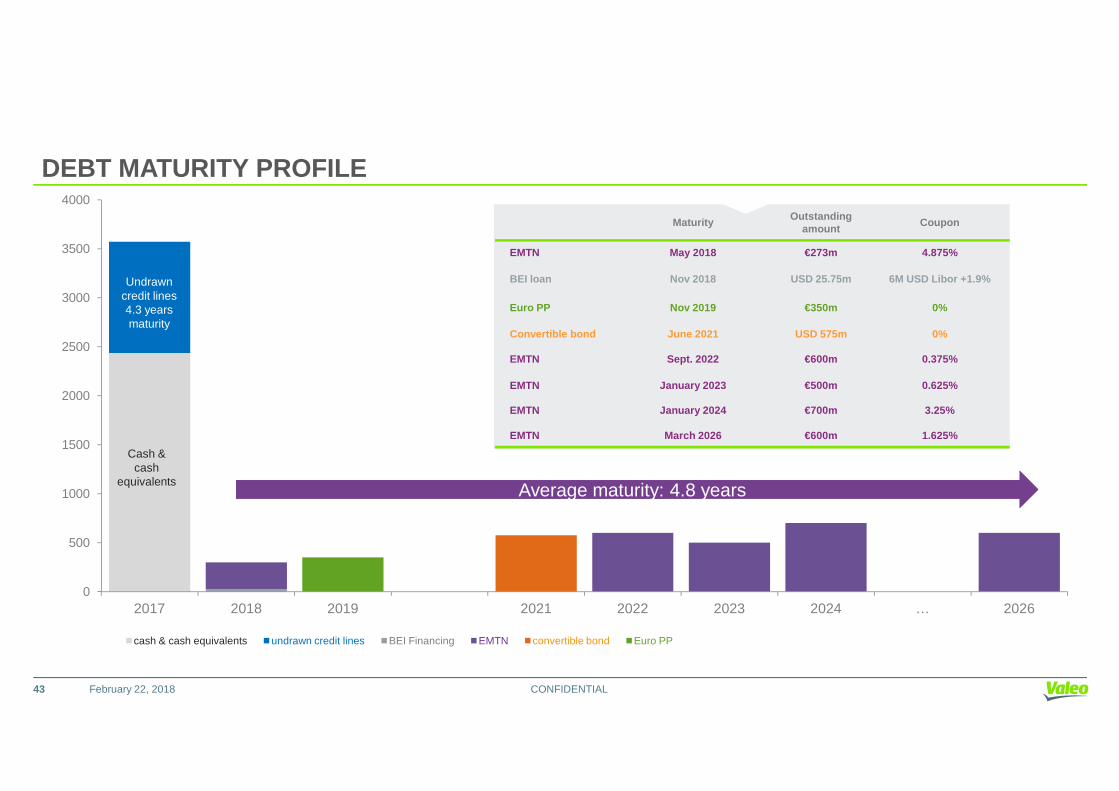
DEBT MATURITY PROFILE
Maturity Outstandingamount
Coupon
EMTN May 2018 €273m 4.875%
BEI loan Nov 2018 USD 25.75m 6M USD Libor +1.9%
Euro PP Nov 2019 €350m 0%
Convertible bond June 2021 USD 575m 0%
EMTN Sept. 2022 €600m 0.375%
EMTN January 2023 €500m 0.625%
CONFIDENTIAL
0
500
1000
1500
2000
2017 2018 2019 2021 2022 2023 2024 … 2026
cash & cash equivalents undrawn credit lines BEI Financing EMTN convertible bond Euro PP
Cash & cash
equivalentsAverage maturity: 4.8 yearsAverage maturity: 4.8 years
February 22, 201843
EMTN
EMTN
January 2024
March 2026
€700m
€600m
3.25%
1.625%

CONFIDENTIAL
DIVIDEND & OUTLOOK
February 22, 2018

2017 DIVIDEND OF €1.25/SHARE TO BE PROPOSED AT THE NEXT A GM
0.40.47 0.5
0.57
0.73
1.0
1.25 1.25Dividend (€/share)
CONFIDENTIALFebruary 22, 2018
2010 2011 2012 2013 2014 2015 2016 2017
EPS (€/share) 1.62 1.89 1.68 1.90 2.41 3.11 3.91 3.72
EPS excl. non -recurring items (€/share) 1.62 1.89 1.85 2.17 2.54 3.52 3.98 4.37
Payout ratio 25% 25% 30% 30% 30% 32% 32% 34%
45
2017 DIVIDEND OF €1.25/SHARE LEADING TO A PAYOUT RA TIO OF 34%, UP 2PTS

VALEO GROUP
Based on the following assumptions:
�an increase in global automotive production of 1.5% in 2018;
� raw material prices and exchange rates in line with current levels.
CONFIDENTIALFebruary 22, 201846
The Valeo Group has set the following objectives:
�nominal sales growth of around 8% for 2018;
� in 2018, like-for-like growth in original equipment sales of around 5%, accelerating in the second half ahead of expected double-digit growth in 2019;
� in 2018, operating margin excluding share in net earnings of equity-accounted companies (as a % of sales) in line with 2017, despite the recent rise in (i) raw material prices and (ii) the value of the euro against the main currencies to which the Group is exposed.

VALEO SIEMENS EAUTOMOTIVE
�as previously noted, the joint venture had a strong order intake of 6.1 billion euros in 2017 and a cumulative 10 billion euros at end-February 2018;
�accordingly, the “Share in net earnings of equity-accounted companies” caption will have an impact of around -0.2 points on Valeo’s statement of income in 2018.
CONFIDENTIALFebruary 22, 201847
Medium-term objectives:
By 2022, Valeo Siemens eAutomotive should be delivering:
� sales of more than 2 billion euros,
� a similar EBITDA margin (as a % of sales) to that of Valeo.

CONFIDENTIAL
BACK-UP
February 22, 2018

TABLE OF CONTENT
� Business Groups
Q4 17
CONFIDENTIAL
� Q4 17
� Statement of income
� 2021 mid-term plan
� SRI
February 22, 201849

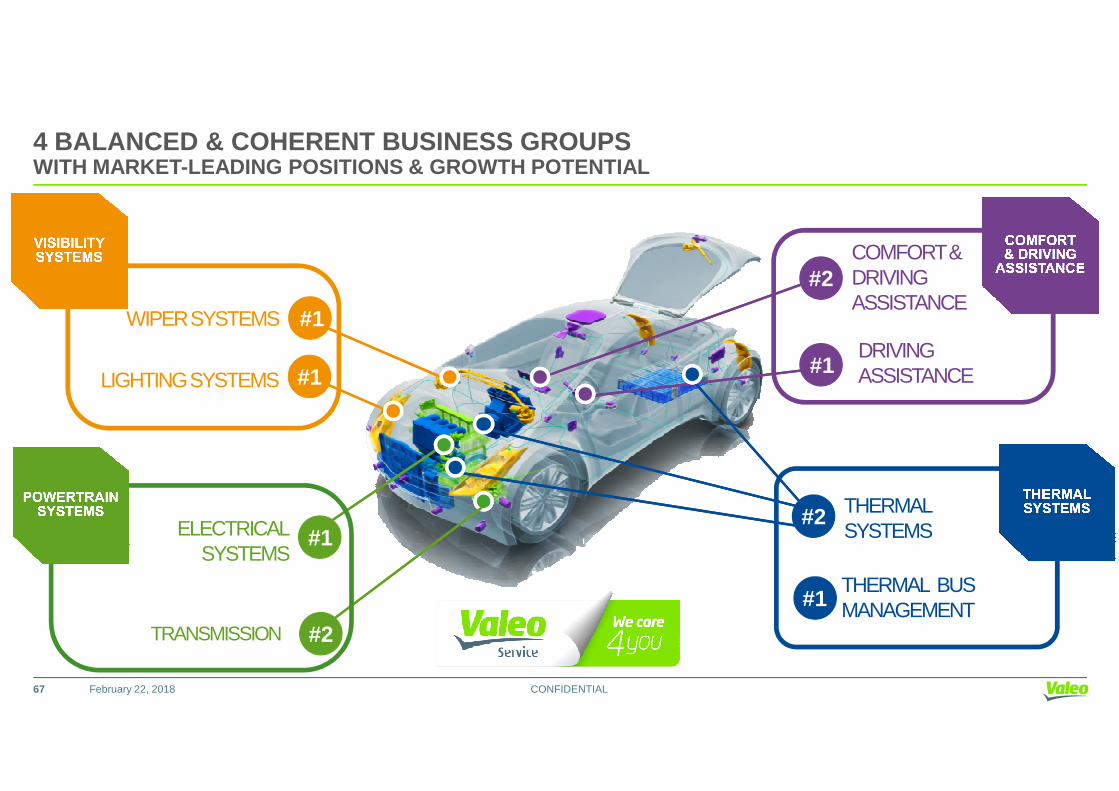
4 BALANCED & COHERENT BUSINESS GROUPSWITH MARKET-LEADING POSITIONS & GROWTH POTENTIAL
WIPER SYSTEMS #1
LIGHTING SYSTEMS #1DRIVINGASSISTANCE
COMFORT &DRIVING ASSISTANCE
#2
#1
CONFIDENTIAL
THERMAL SYSTEMS
#2ELECTRICALSYSTEMS
#1
#2
February 22, 201850
THERMAL BUSMANAGEMENT#1
TRANSMISSION

COMFORT & DRIVING ASSISTANCE
Total sales (€m)
Total sales -
OEM sales Like-for-likechange
+3% +7%
+6%
1,837 1,753
3,590
H1 17 H2 17 2017
+6%
+11%
+7%
Market share* and competitors:
-Comfort & Driving Assistance: Valeo no.2Continental + Valeo+ Bosch ~ 74%* -Driving Assistance: Valeo no.1
Valeo + Continental + Bosch ~ 47%*
2017 key figures:• Sales: €3.6bn (19% of Group sales)• EBITDA: 14.5% (21% of Group EBITDA)
• 22,900 employees• 27 production units• 10 development centers• 8 research centers
CONFIDENTIALFebruary 22, 2018
Key growth drivers:� 3 main macro-economical trends confirmed with cars more autonomous, more connected and more intuitive
� Supported by increasingly stringent regulatory and certifications environment (Euro NCAP in Europe and NTHSA in the US)
� Leading to further take increase for existing innovative products (including cameras, displays, sensors, …)
� Positive impact of full integration of peiker activities acquired in Q1 2016
Latest business developments:� Another record order intake with over 6x order intake sales ratio for active safety products, over 2x order intake sales ratio for TCU, record order intake level in China and in the US
� Safety activity order intake covering laser scanner, front camera, radar, automated parking systems and products
� Acquisition of 33% stake in Kuantic, European leading operator of mobility solutions for car fleets
� First order of MovInBlue systems with European car rentals companies
� Start of production of our laser scanner product (Scala) in H2 2017 with a major European OEM
� Acquisition of gestigon, 3D gesture monitor SW German company
* Valeo estimate
Total sales -change asreported
+3% +7%+11%
51

POWERTRAIN SYSTEMS
*Valeo estimate
+8%
+6%
Total sales (€m)
OEM sales Like-for- likechange
+6%
+3%
Total sales -change as
2,163 2,137
4,300
H1 17 H2 17 2017
+7%
+4%Market share* and competitors:
- Electrical Systems: Valeo no.1Valeo + Denso + Bosch/ZMJ ~ 70%*
- Transmission Systems: Valeo no.2Luk + Valeo + Exedy + ZF Sachs ~ 75%*
2017 key figures:• Sales: €4.3bn (23% of Group sales)• EBITDA: 13.2% (23% of Group EBITDA)
• 25,000 employees• 55 production units• 13 development centers• 7 research centers
CONFIDENTIALFebruary 22, 2018
Key growth drivers: Objective of reducing CO2 emissions and fossil fuel consumption based on 3 priorities for engines:� Downsizing/Downspeeding
� Gearbox automation
� Powertrain electrification and development of low (12V, 48V) and high voltage
Latest business developments:� Major contracts won by the Valeo Siemens eAutomotive joint venture in Europe and China for the electric and hybrid vehicles
� Significant contract for torque converters in North America and Asia
� New contracts for 48 V and Istars
� Acquisition of FTE automotive, effective November 1st 2017
� Creation of Valeo-Kapec joint venture with Korean partner PHC, effective December 1st 2017
+8% +6%change asreported
+7%
52

THERMAL SYSTEMS
*Valeo estimate
+15%
+11%
Total sales (€m)
OEM sales Like-for-likechange
+1%
+7%
Total sales -change asreported
2,594 2,409
5,003
H1 17 H2 17 2017
+8%
+9%
Market share* and competitors:
Thermal Systems: Valeo no.2Denso + Valeo + Hanon + Mahle ~ 54%*
2017 key figures:• Sales: €5.0bn (27% of Group sales)• EBITDA: 10.8% (22% of Group EBITDA)
• 24,200 employees• 62 production units• 10 development centers• 3 research centers
CONFIDENTIALFebruary 22, 2018
Key growth drivers:� Innovative solutions to comply with new regulations on gas pollutants and fuel consumption
� Thermal solutions for Electrified vehicles (PHEV/EV)
� Innovative solutions for in-vehicle air quality management
Latest business developments: New contracts with major automakers worldwide took Thermal Systems order intake for 2017 to an all-time high, above 2016 figuresEspecially in Europe and China, with several awards from German automakers
� New order for heat pump system with production in China
� New order for electrical driven compressor with production in China. With these orders, Valeo is demonstrating its capability for advanced technology in this field
� New order on HVAC for electric vehicles with Valeo brushless motor and high voltage PTC
� New orders on air quality with Chinese automakers
� First order on Valeo brushless motor for fan system
� Intensive development plans with many customers on future generations of electric vehicles, to optimize the size, performance and cost of future solutions
reported
53
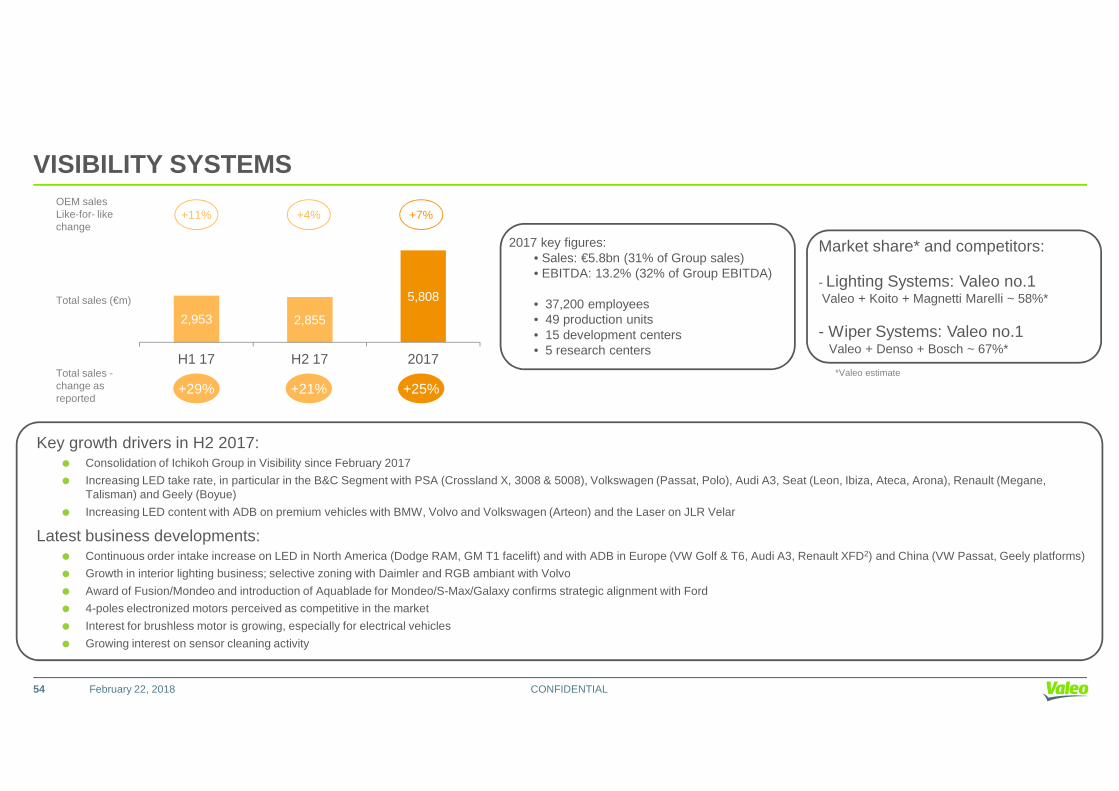
VISIBILITY SYSTEMS
*Valeo estimate
Total sales (€m)
OEM sales Like-for- likechange
+21%
+4%
Total sales -change asreported
2,953 2,855
5,808
H1 17 H2 17 2017
+29%
+11%
+25%
+7%
Market share* and competitors:
- Lighting Systems: Valeo no.1Valeo + Koito + Magnetti Marelli ~ 58%*
- Wiper Systems: Valeo no.1Valeo + Denso + Bosch ~ 67%*
2017 key figures:• Sales: €5.8bn (31% of Group sales)• EBITDA: 13.2% (32% of Group EBITDA)
• 37,200 employees• 49 production units• 15 development centers• 5 research centers
CONFIDENTIALFebruary 22, 2018
Key growth drivers in H2 2017:� Consolidation of Ichikoh Group in Visibility since February 2017
� Increasing LED take rate, in particular in the B&C Segment with PSA (Crossland X, 3008 & 5008), Volkswagen (Passat, Polo), Audi A3, Seat (Leon, Ibiza, Ateca, Arona), Renault (Megane, Talisman) and Geely (Boyue)
� Increasing LED content with ADB on premium vehicles with BMW, Volvo and Volkswagen (Arteon) and the Laser on JLR Velar
Latest business developments:� Continuous order intake increase on LED in North America (Dodge RAM, GM T1 facelift) and with ADB in Europe (VW Golf & T6, Audi A3, Renault XFD2) and China (VW Passat, Geely platforms)
� Growth in interior lighting business; selective zoning with Daimler and RGB ambiant with Volvo
� Award of Fusion/Mondeo and introduction of Aquablade for Mondeo/S-Max/Galaxy confirms strategic alignment with Ford
� 4-poles electronized motors perceived as competitive in the market
� Interest for brushless motor is growing, especially for electrical vehicles
� Growing interest on sensor cleaning activity
+21%reported
+29% +25%
54
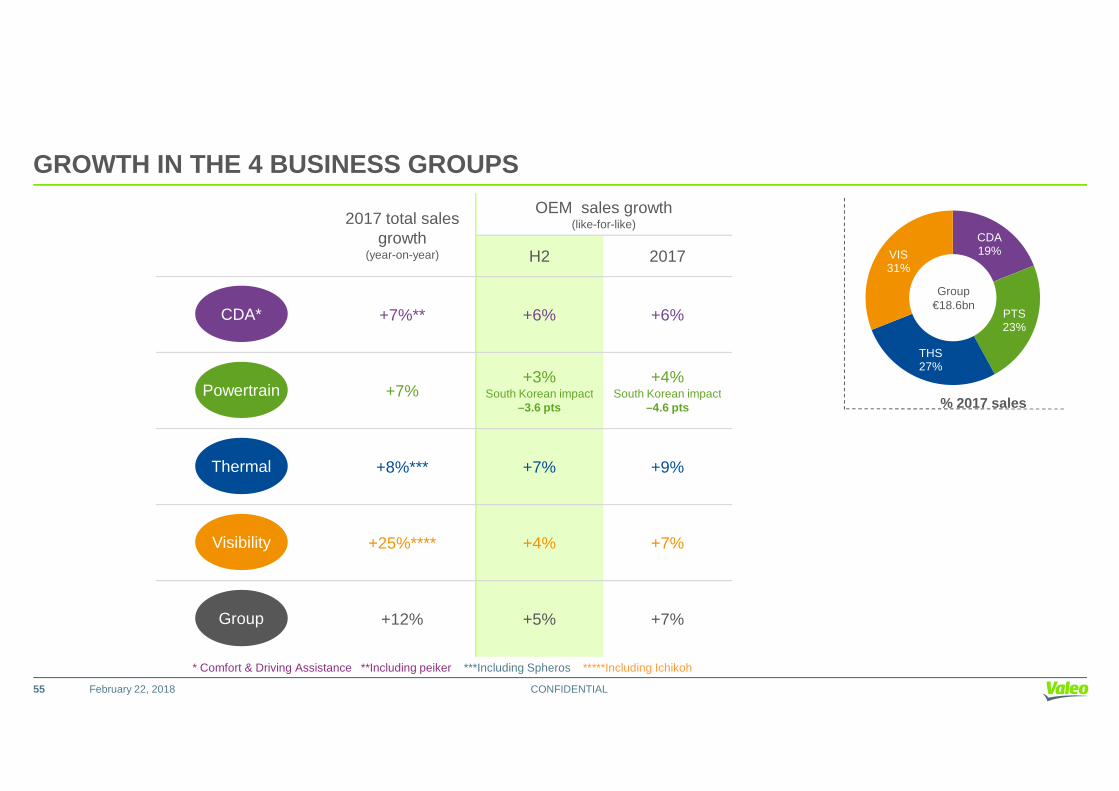
GROWTH IN THE 4 BUSINESS GROUPS
2017 total salesgrowth
(year-on-year)
OEM sales growth (like-for-like)
H2 2017
+7%** +6% +6%
+7%+3%
South Korean impact+4%
South Korean impact
CDA*
Powertrain
CDA 19%
PTS23%
THS27%
VIS31%
Group€18.6bn
% 2017 sales
CONFIDENTIALFebruary 22, 2018
+7% South Korean impact–3.6 pts
South Korean impact–4.6 pts
+8%*** +7% +9%
+25%**** +4% +7%
+12% +5% +7%
Visibility
Thermal
Powertrain
* Comfort & Driving Assistance **Including peiker ***Including Spheros *****Including Ichikoh
Group
% 2017 sales
55

EBITDA TO 13.1% OF SALES, UP 14% OR €2,436M
12.7%
13.0%13.1%
In €m and as a % of sales 2015 2016 2017
As a % of sales FY FY H1 H2 FY
CDA 14.5 14.7 14.5 14.6 14.5
Powertrain 12.8 13.3 12.8 13.6 13.2
Thermal 10.7 10.0 10.3 11.3 10.8
Visibility 12.4 13.9 13.3 13.1 13.2
Group 12.7 13.0 12.8 13.4 13.1
CONFIDENTIALFebruary 22, 2018
1,8412,144
2,436
2015 2016 2017
Group 12.7 13.0 12.8 13.4 13.1
56
7%
9%
11%
13%
15%
H1 14* H2 14 H1 15 H2 15 H1 16 H2 16 H1 17 H2 17
Comfort and Driving Assistance Systems Powertrain Systems
Thermal Systems Visibility Systems
Group

SEGMENT INFORMATION
(€m)
Comfort & Driving
Assistance Systems
PowertrainSystems
Thermal Systems
VisibilitySystems Others Total
Sales: 16,519● segment (excluding Group) 3,565 4,220 4,953 5,712 100 18,484● intersegment (Group) 25 80 50 96 (251) 66
EBITDA 522 566 539 767 42 2,436Research & Development expenditure, net (412) (212) (204) (279) (23) (1,130)Investments in property, plant & equipment & intangibleasset 537 390 430 508 37 1,902Segment assets 2,273 3,361 2,252 2,549 143 10,578
2017
CONFIDENTIAL
(€m)
Comfort & Driving
Assistance Systems
PowertrainSystems
Thermal Systems
VisibilitySystems Others Total
Sales: 16,519● segment (excluding Group) 3,343 3,975 4,622 4,545 -● intersegment (Group) 20 52 23 104 -
EBITDA 496 534 463 645 6 2,144Research & Development expenditure, net (334) (183) (184) (235) (20) (956)Investments in property, plant & equipment & intangibleasset 342 357 302 330 30 1,361Segment assets 1,981 2,107 2,024 2,028 83 8,223
February 22, 2018
2016
57

QUARTERLY INFORMATION (IN €M)
� Sales by segment
Q1-13 Q2-13 Q3-13 Q4-13 Q1-14 Q2-14 Q3-14 Q4-14 Q1-15 Q2-15 Q3-15 Q4-15 Q1-16 Q2-16 Q3-16 Q4-16 Q1-17 Q2-17 Q3-17 Q4-17
Comfort & DrivingAssistance Systems 623 569 515 531 552 572 573 614 657 679 663 721 794 866 825 877 938 899 859 894
PowertrainSystems 774 817 752 818 848 848 798 843 948 978 877 959 983 1,028 966 1,051 1,105 1,058 963 1,174
Thermal Systems 818 885 832 837 880 934 889 934 1,007 1,039 992 1,036 1,063 1,186 1,140 1,255 1,312 1,282 1,157 1,252
Visibility Systems 733 762 711 764 876 925 856 957 1,022 1,072 967 1,124 1,119 1,176 1,102 1,252 1,458 1,495 1,355 1,500
CONFIDENTIAL
� Sales by type
Q1-13 Q2-13 Q3-13 Q4-13 Q1-14 Q2-14 Q3-14 Q4-14 Q1-15 Q2-15 Q3-15 Q4-15 Q1-16 Q2-16 Q3-16 Q4-16 Q1-17 Q2-17 Q3-17 Q4-17
Original Equipment 2,470 2,567 2,348 2,449 2,677 2,755 2,6 44 2,814 3,113 3,203 2,990 3,294 3,437 3,669 3,472 3,822 4,174 4,061 3,751 4,134
Aftermarket 375 374 361 377 376 377 366 376 400 413 387 399 411 4 34 417 417 487 476 446 478
Miscellaneous 82 76 83 100 59 103 59 119 68 101 72 104 69 110 105 1 56 106 160 104 173
Total sales 2,927 3,017 2,792 2,926 3,112 3,235 3,069 3,309 3,581 3,717 3,449 3,797 3,917 4,213 3,994 4,395 4,767 4,697 4,301 4,785
Total sales 2,927 3,017 2,792 2,926 3,112 3,235 3,069 3,309 3,581 3,717 3,449 3,797 3,917 4,213 3,994 4,395 4,767 4,697 4,301 4,785
58 February 22, 2018
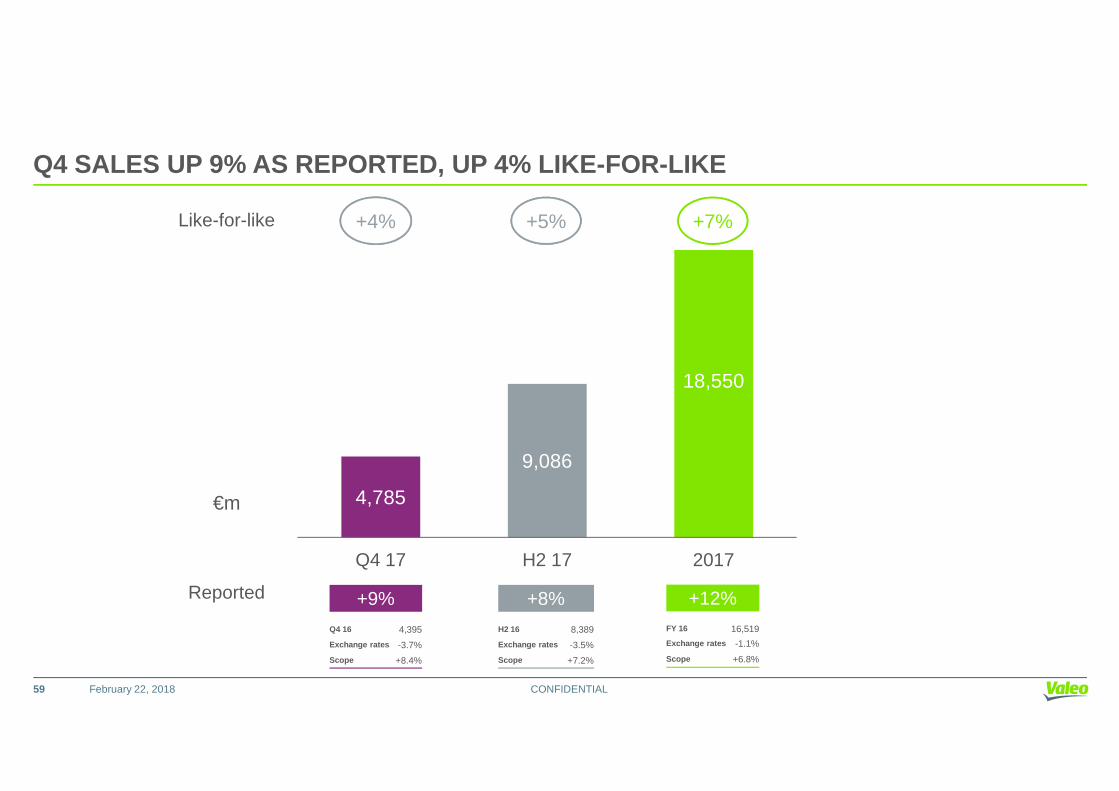
Q4 SALES UP 9% AS REPORTED, UP 4% LIKE-FOR-LIKE
18,550
+7%+5%+4%Like-for-like
CONFIDENTIALFebruary 22, 2018
4,785
9,086
Q4 17 H2 17 2017
+12%FY 16 16,519
Exchange rates -1.1%
Scope +6.8%
+8%
H2 16 8,389
Exchange rates -3.5%
Scope +7.2%
€m
Reported +9%
Q4 16 4,395
Exchange rates -3.7%
Scope +8.4%
59

Q4 OEM SALES UP 8% AS REPORTED, UP 4% LIKE-FOR-LIKE
OEM sales
Aftermarket
478924
1,887
Q4 17 H2 17 2017
+7%*+5%*+4%**Like-for-like
+4%*+3%*+4%*
CONFIDENTIALFebruary 22, 2018
4,134
7,885
16,120
Q4 17 H2 17 2017
+12%**+11%**
Miscellaneous
173277
543
Q4 17 H2 17 2017
**Reported +12%**
FY 16 14,403
Exchange rates -1.1%
Scope +6.1%
+8%**
H2 16 7,297
Exchange rates -3.6%
Scope +6.6%
+9%*-3%*
+15%**
+5%*
+24%**+7%**+13%**
+8%**
Q4 16 3,825
Exchange rates -3.8%
Scope +7.7%
€m
60

3-PT OEM SALES OUTPERFORMANCE, INCLUDING - 0.2 PT IMPACT OF SOUTH KOREA
North AmericaOEM sales** +6%
Production*** +4%
Q4Like-for-like
Europe*Production*** +6%
North AmericaProduction*** -5%
46% of Valeo sales
17% of Valeo sales
18% of Valeo salesOEM
sales** +1%
OEM sales**
OEM sales** +6%
Outperf. +6pts
Outperf. 0pt
WorldProduction***+1%
Outperf. +3pts
OEM sales** +4%
South Koreanimpact -0.2pts
South Koreanimpact
CONFIDENTIALFebruary 22, 2018
Asia* excl. ChinaProduction***-1%
South AmericaProduction***+18%
17% of Valeo sales
2% of Valeo sales
sales** -3%
OEM sales** +20%
17% of Valeo salesOEM
sales** +8%China
Production***0%Outperf. +2pts
Underperf. -2pts
Outperf. +8pts
61
* Europe including Africa; Asia including Middle East
** Valeo OEM sales by destination***LMC estimates released on February 8, 2018 – light vehicle production
impact -1.2pts

3-PT OUTPERFORMANCE IN ASIA, INCLUDING - 0.5 PT IMPACT OF SOUTH KOREA
JapanProduction** +3%
22% of Asian sales
South KoreaProduction** -21%
18% of Asian sales
Q4Like-for-like
Outperf . +16pts
Underperf. -14pts
AsiaProduction** 0%
Outperf. +3pts
34% of total salesOEM
sales** +3%
OEM sales*
-5%
South Koreanimpact -2.4pts
OEM sales* -11%South
Koreanimpact -0.5pts
OEM sales asreported +64%
CONFIDENTIALFebruary 22, 2018
IndiaProduction** +8%
3% of Asian sales
ChinaProduction** 0%
51% of Asian sales
OEM sales*
+21%Outperf. +8pts
Outperf. +18pts
Outperf . +16pts
OEM sales*
+8%
62
*Valeo OEM sales by destination**LMC estimates released on February 8, 2018– light vehicle production***Indian operations

STATEMENT OF INCOME WITH HALF YEAR BREAKDOWN
2013 2014* 2015 2016 2017In €m H1 H2 H1 H2 H1 H2 H1 H2 H1 H2
� Sales 5,944 5,718 6,347 6,378 7,298 7,246 8,130 8,389 9,464 9,086
� Gross margin 1,011 998 1,080 1,123 1,280 1,293 1,488 1,532 1,761 1,713
as a % of sales 17,0% 17.5% 17.0% 17.6% 17.5% 17.8% 18.3% 18,3% 18.6% 18.9%
R&D expenditure, net (318) (296) (350) (335) (402) (395) (485) (471) (582) (548)
Selling & administrative expenses (318) (311) (326) (330) (363) (353) (384) (407) (454) (435)
Share in net earnings of equity-accounted companies 8 18 32 19 23 33 28 33 29 (7)
� Operating margin incl. share in net earnings of equity-accounted companies 383 409 436 477 538 578 647 687 754 723
CONFIDENTIAL
as a % of sales 6.4% 7.2% 6.9% 7.5% 7.4% 8.0% 8.0% 8.2% 8.0% 8.0%
Other income & expenses (41) (26) (34) (20) (21) (96) (34) 1 (23) (44)
� Operating income 342 383 402 457 517 482 613 688 731 679
as a % of sales 5.8% 6.7% 6.3% 7.2% 7.1% 6.7% 7.5% 8.2% 7.7% 7.5%
Cost of net debt (49) (49) (47) (44) (43) (41) (43) (40) (37) (36)
Other financial income and expenses (21) (25) (20) (26) (26) (9) (24) (22) (25) (22)
� Income before income taxes 272 309 335 387 448 432 546 626 669 621
Income taxes (68) (45) (65) (64) (80) (26) (97) (92) (130) (195)
� Income from continuing operations 204 264 270 323 368 406 449 534 539 426
Non-strategic activities 0 0 0 0 0 0 0 0 0 0
� Net income for the period 204 264 270 323 368 406 449 534 539 426
Non-controlling interests (14) (15) (14) (17) (24) (21) (27) (31) (33) (46)
� Net income 190 249 256 306 344 385 422 503 506 380
63 February 22, 2018

3 REVOLUTIONS IN THE AUTOMOTIVE INDUSTRY
MOBILITY & DIGITAL
CONFIDENTIALFebruary 22, 2018
AUTONOMOUS &
CONNECTED CAR
ELECTRIFICATION &
SMART ENGINES
64

THERE IS NO SINGLE SOLUTION IN ELECTRIFICATIONEACH SOLUTION WILL ENABLE TO INCREASE THE PTS CONTENT PER CAR
LOW VOLTAGE SOLUTIONS (12V & 48V) HIGH VOLTAGE SOLUTIONS
SMALLMEDIUMLARGE PREMIUMCITY
HIGH POWER
x7x9x3x2x2
CONFIDENTIAL
• ZERO EMISSION (ZE) AREAS
• SHORT TRIPS• EASY PLUG-IN
• LOW COST• ALREADY LOW CO 2
• COMMUTERS
• ALTERNATIVE TO DIESEL
• PRICE CONSTRAINT• COMMUTERS
• LONG HAUL• HIGH EMISSIONS• HIGH PRICE• NEED TO ENTER ZE
AREAS
• PERFORMANCE• ACCELERATION• GREEN LUXURY
LOW POWER BEV (Battery Electric Vehicle)
12V MILD HYBRID
HIGH POWER BEV(Battery Electric Vehicle)
PHEV(Plug-In Hybrid Vehicle)
48V MILD HYBRID
x7x9x3x2x2
65 February 22, 2018

COMFORT & DRIVING ASSISTANCE SYSTEMS: WELL POSITIONED ONAUTONOMOUS AND CONNECTED CARS
CONFIDENTIAL66 February 22, 2018
4 BALANCED & COHERENT BUSINESS GROUPSWITH MARKET-LEADING POSITIONS & GROWTH POTENTIAL
WIPER SYSTEMS #1
LIGHTING SYSTEMS #1DRIVINGASSISTANCE
COMFORT &DRIVING ASSISTANCE
#2
#1
CONFIDENTIAL
THERMAL SYSTEMS
#2ELECTRICALSYSTEMS
#1
#2
February 22, 201867
THERMAL BUSMANAGEMENT#1
TRANSMISSION

OUR 4 BUSINESS GROUPS ARE FUELED BY SUCCESSIVE INNOV ATION WAVES
MORE INTUITIVE
MORE CONNECTED
MORE AUTOMATED
REINVENTION OF
WIPER SYSTEMS
GENERALIZATION OF
LEDs
CONFIDENTIALFebruary 22, 201868
ELECTRIFICATION
HIGH POWER
ELECTRIFICATION
MEDIUM POWER
12V & 48V
SMART ENGINES
& TRANSMISSIONS
HEALTH & WELL-
BEING
ELECTRIC VEHICLE
RANGE & RELIABILITY
INTERNAL
COMBUSTION ENGINE
EMISSIONS DECREASE

PROFITABILITY EBITDA BY BUSINESS GROUP
CONFIDENTIALFebruary 22, 201869

A WELL-BALANCED GEOGRAPHICAL PORTFOLIO*
CONFIDENTIALFebruary 22, 201870

A WELL-BALANCED CUSTOMER PORTFOLIO
CONFIDENTIALFebruary 22, 201871

VALEO’S VIRTUOUS CIRCLE
CONFIDENTIALFebruary 22, 201872

MID-TERM FINANCIAL TARGETS
2016 2017 2021
SALES (€bn) 16.5 18.5 > 27
EBITDA* (as a % of sales) 13.0% 13.1% ~15%
OPERATING MARGIN* (as a % of sales) 8.1% 8.0% ~9.0%
CONFIDENTIALFebruary 22, 201873
* Including joint Ventures and associates** ROCE, or return on capital employed, corresponds to operating margin (including share in net earnings of equity-accounted companies) divided by capital employed(including investments in equity-accounted companies) excluding goodwill.*** ROA, or return on assets, corresponds to operating income divided by capital employed (including investments in equity-accounted companies) including goodwill.
OPERATING MARGIN* (as a % of sales) 8.1% 8.0% ~9.0%
FREE CASH FLOW (€m) 0.7 0.3 3.7 over the 2017-2021 period
ROCE** 34% 30% ~30%
ROA*** 21% 19% >20%

A TRANSFORMATION ACKNOWLEDGED BY THE SUSTAINABILITY IND EXES
N°1EURONEXT
LOWCARBON100 EUROPEINDEX®
(2015)
N°1DOWJONES
SUSTAINABILITY INDEXES®MONDE
&EUROPE(2016)
ROBECOSAM’S®
BRONZECLASS&INDUSTRYMOVER
SUSTAINABILITYAWARDS(2018)
CONFIDENTIAL74
Products that directly or indirectly contribute to reducing CO2 emissionsaccounted fore more than 50% of Valeo’s original equipment sales
in 2016
February 22, 2018
(2015) (2016)
CONTACTS
Investor Relations
Valeo43, rue Bayen
CONFIDENTIAL
43, rue BayenF-75848 Paris Cedex 17France
Thierry LacorreE-mail: [email protected]: www.valeo.com
75 February 22, 2018

SHARE INFORMATION
FR FPVLOF.PAFR 0013176526239,653,121
Share Data
• Bloomberg Ticker• Reuters Ticker• ISIN Number• Shares outstanding as of December 29, 2017
CONFIDENTIALFebruary 22, 2018
ADR Data
• Ticker/trading symbol• CUSIP Number• Exchange• Ratio (ADR: ord)• Depositary Bank• Contact at J.P. Morgan – ADR
broker relationship desk
VLEEY919134304OTC1:2J.P. MorganJim Reeves+1 212-622-2710
76

GLOSSARY1) Order intake corresponds to business awarded by automakers during the period (including joint ventures accounted for based on Valeo’s share in net equity) less
any cancellations, based on Valeo’s best reasonable estimates in terms of volumes, selling prices and project lifespans. Unaudited indicator.
2) Like for like (or LFL): the currency impact is calculated by multiplying sales for the current period by the exchange rate for the previous period. The Group structure impact is calculated by (i) eliminating, for the current period, sales of companies acquired during the period, and (ii) adding to the previous period full-year sales of companies acquired in the previous period, and (iii) eliminating, for the current period and for the comparable period, sales of companies sold during the current or comparable period.
3) Operating margin including share in net earnings of equity-accounted companies corresponds to operating income before other income and expenses.
4) Net attributable income excluding non-recurring i tems corresponds to net attributable income adjusted for “other income and expenses” net of tax and non-recurring income and expenses net of tax shown in operating margin including share in net earnings of equity-accounted companies.
CONFIDENTIAL
5) ROCE, or return on capital employed, corresponds to operating margin (including share in net earnings of equity-accounted companies) divided by capital employed (including investments in equity-accounted companies) excluding goodwill.
6) ROA, or return on assets, corresponds to operating income divided by capital employed (including investments in equity-accounted companies) including goodwill.
7) EBITDA, which corresponds to (i) operating margin before depreciation, amortization and impairment losses (included in the operating margin) and the impact of government subsidies and grants on non-current assets, and (ii) net dividends received from equity-accounted companies.
8) Free cash flow corresponds to net cash from operating activities (excluding the change in non-recurring sales of receivables) after taking into account acquisitions and disposals of property, plant and equipment and intangible assets.
9) Net cash flow corresponds to free cash flow less (i) cash flows in respect of investing activities, relating to acquisitions and disposals of investments and to changes in certain items shown in non-current financial assets, (ii) cash flows in respect of financing activities, relating to dividends paid, treasury share purchases and sales, interest paid and received, and acquisitions of investments without a change in control, and (iii) changes in non-recurring sales of receivables.
10) Net debt comprises all long-term debt, liabilities associated with put options granted to holders of non-controlling interests, short-term debt and bank overdrafts, less loans and other long-term financial assets, cash and cash equivalents and the fair value of derivative instruments hedging the foreign currency and interest rate risks associated with these items.
77 February 22, 2018

SAFE HARBOR STATEMENT
Statements contained in this document, which are not historical fact, constitute “forward-looking statements”. These statements includeprojections and estimates and their underlying assumptions, statements regarding projects, objectives, intentions and expectations withrespect to future financial results, events, operations, services, product development and potential, and statements regarding futureperformance. Even though Valeo’s Management feels that the forward-looking statements are reasonable as at the date of this document,investors are put on notice that the forward-looking statements are subject to numerous factors, risks and uncertainties that are difficult topredict and generally beyond Valeo’s control, which could cause actual results and events to differ materially from those expressed orprojected in the forward-looking statements. Such factors include, among others, the Company’s ability to generate cost savings ormanufacturing efficiencies to offset or exceed contractually or competitively required price reductions. The risks and uncertainties to which
CONFIDENTIAL
manufacturing efficiencies to offset or exceed contractually or competitively required price reductions. The risks and uncertainties to whichValeo is exposed mainly comprise the risks resulting from the investigations currently being carried out by the antitrust authorities asidentified in the Registration Document, risks which relate to being a supplier in the automotive industry and to the development of newproducts and risks due to certain global and regional economic conditions. Also included are environmental and industrial risks as well asrisks and uncertainties described or identified in the public documents submitted by Valeo to the French financial markets authority (Autoritédes marchés financiers – AMF), including those set out in the “Risk Factors” section of Valeo’s 2016 Registration Document registered withthe AMF on March 24, 2017 (under no. D.17-0226).
The Company assumes no responsibility for any analyses issued by analysts and any other information prepared by third parties which maybe used in this document. Valeo does not intend or assume any obligation to review or to confirm the estimates of analysts or to update anyforward-looking statements to reflect events or circumstances which occur subsequent to the date of this document.
78 February 22, 2018