FY 2016 Quarter One Performance Report
20
FY 2016 Quarter One Performance Report July 1, 2015 through September 30, 2015 Darryl Ackley Cabinet Secretary Jacqueline Miller Deputy Secretary
Transcript of FY 2016 Quarter One Performance Report
FY 2016 Quarter One
Performance Report
July 1, 2015 through September 30, 2015
Darryl Ackley
Cabinet Secretary
Jacqueline Miller
Deputy Secretary
361 Department of Information Technology FY2016 Q1 Performance Measure Report
Page 2 of 20
Department of Information Technology - 361
The purpose of the FY2016 Quarterly, Performance Report (Report) is to apprise the Department of
Information Technology (Department) Performance Monitoring Plan (Plan) for each of the program
areas. The Department’s Plan includes the definition, source of data and methodology to capture and
analyze the data. The Plan also describes the validation and reliability process to ensure the data is
accurate and repeatable.
The Department was created by legislation enacted in the 2007 Legislative Session. The Department
began operations July 1, 2007 and as a new Department established new performance measures.
As the State of New Mexico (State)’s provider for enterprise Information Technology (IT) services, the
Department is working across the State with all executive agencies (agencies) to improve services and
better facilitate efficient and responsive government for New Mexicans. This Plan is a continuation and
progression of core IT measurement practices; balancing the cost of and demand for IT resources;
delivering enterprise services that match or beat the cost and quality of those services offered in the
open market; and investing in IT projects that enhance and support IT services.
For Fiscal Year 2016 the majority of the performance measures remain the same from the previous
year. However with the recommendation from the Department of Finance Administration (DFA) and
the Legislative Finance Committee (LFC) to reduce the amount of measures, four performance
measures were discontinued. For Program Support all the performance measures remained
unchanged; for the Compliance and Project Management Program two performances measures had a
word change and one was discontinued; and for the Enterprise Services Program three performance
measures were discontinued, two had a word changes, and two were replaced with a revised
performance measure. This Report summarizes the Department’s performance across these three
programs for Fiscal Year 2016. The annual measures included in the Plan will not be reported until the
fourth quarter.
361 Department of Information Technology FY2016 Q1 Performance Measure Report
Page 3 of 20
Performance Measure Status
For each of the performance measures, in this report, a color coded status is presented. The color
coding, green, yellow or red is based on the percentage of the target being reported on either a
quarterly or annual basis:
Green 80% to 100% of the performance target or exceeding target.
Yellow 70% to 79% of the performance target.
Red 0% to 69% of the performance target.
361 Department of Information Technology FY2016 Q1 Performance Measure Report
Page 4 of 20
Program Area: Program Support (P771)
The Program Support Division provides leadership, guidance and administrative services to the
Department in support of its mission to provide state of the art information processing, radio,
information technology contract review and telecommunication services to agencies statewide.
Program Support includes the Office of the Secretary and the Administrative Service Division. It is
responsible for the Department’s direction, administrative policies and procedures, human resources,
budget, financial management, general ledger, accounts receivable and payable, as well as purchasing
and contractual support. Additionally, the Program Support program is responsible for establishing a
cost recovery model and developing fair rates for services provided by the Department.
Program Budget and Full Time Employee (FTE):
The Program Support Program area has 34 FTE and the following budget:
Budget Category Total
(Thousands)
Salaries and Benefits $2,871.2
Contractual $40.0
Other $256.6
Other Financing Uses $0.00
Total $3,167.8
Performance Measures:
PERFORMANCE MEASURE 1 - Percent of Audit Corrective Action Plan Commitments Completed on Schedule (Annual)
This measure will be reported in FY16 Q4.
PERFORMANCE MEASURE 2 - Percent of Accounts Receivable Dollars Collected Within Sixty Days of the Invoice Due Date
The Department is the enterprise IT service provider for agencies. Invoices are generated and
delivered to agencies on a monthly basis for services rendered. This measure tracks the timeliness of
customer agency payments to the Department. Agencies bills are measured with a sixty day period for
the receipt of payment from the invoice date.
361 Department of Information Technology FY2016 Q1 Performance Measure Report
Page 5 of 20
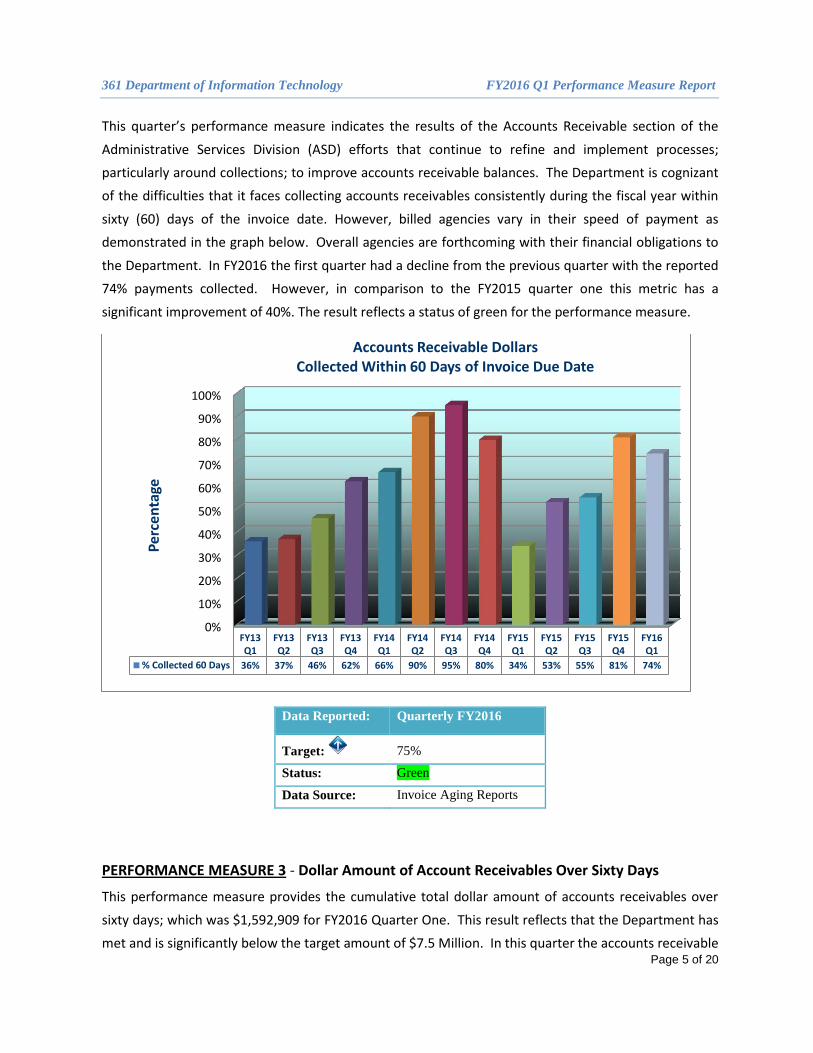
This quarter’s performance measure indicates the results of the Accounts Receivable section of the
Administrative Services Division (ASD) efforts that continue to refine and implement processes;
particularly around collections; to improve accounts receivable balances. The Department is cognizant
of the difficulties that it faces collecting accounts receivables consistently during the fiscal year within
sixty (60) days of the invoice date. However, billed agencies vary in their speed of payment as
demonstrated in the graph below. Overall agencies are forthcoming with their financial obligations to
the Department. In FY2016 the first quarter had a decline from the previous quarter with the reported
74% payments collected. However, in comparison to the FY2015 quarter one this metric has a
significant improvement of 40%. The result reflects a status of green for the performance measure.
Data Reported: Quarterly FY2016
Target: 75%
Status: Green
Data Source: Invoice Aging Reports
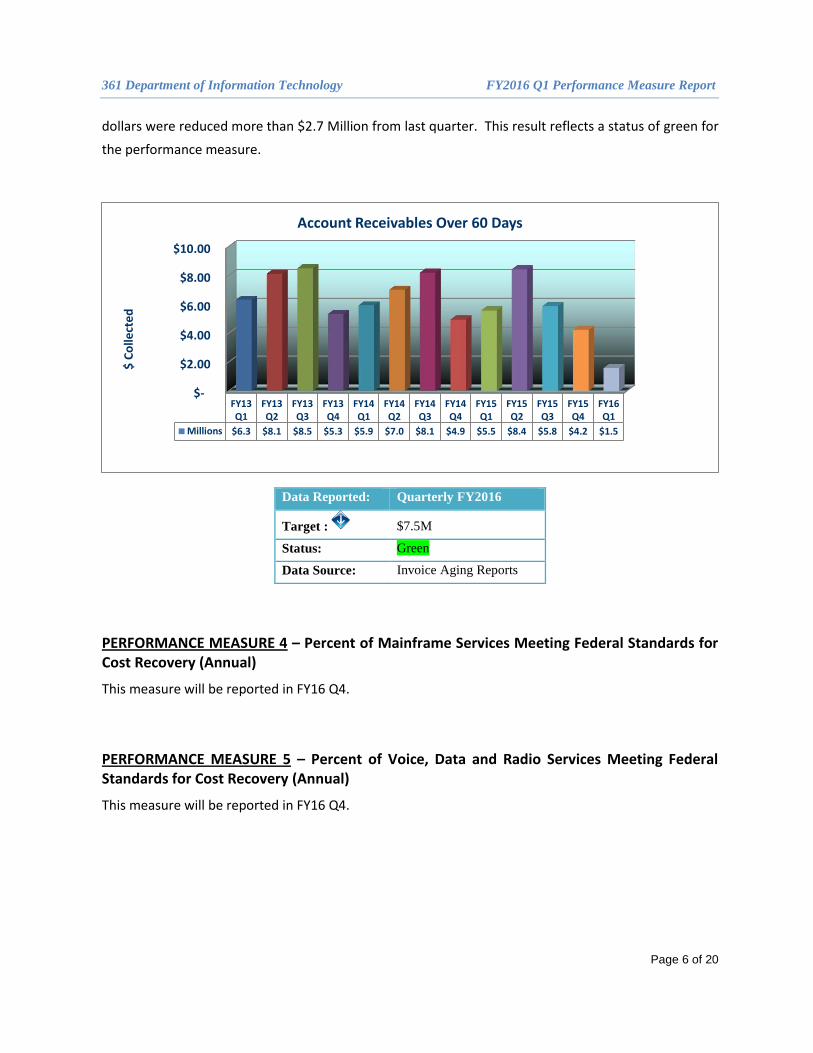
PERFORMANCE MEASURE 3 - Dollar Amount of Account Receivables Over Sixty Days
This performance measure provides the cumulative total dollar amount of accounts receivables over
sixty days; which was $1,592,909 for FY2016 Quarter One. This result reflects that the Department has
met and is significantly below the target amount of $7.5 Million. In this quarter the accounts receivable
0%
10%
20%
30%
40%
50%
60%
70%
80%
90%
100%
FY13Q1
FY13Q2
FY13Q3
FY13Q4
FY14Q1
FY14Q2
FY14Q3
FY14Q4
FY15Q1
FY15Q2
FY15Q3
FY15Q4
FY16Q1
% Collected 60 Days 36% 37% 46% 62% 66% 90% 95% 80% 34% 53% 55% 81% 74%
Per
cen
tage
Accounts Receivable Dollars Collected Within 60 Days of Invoice Due Date
361 Department of Information Technology FY2016 Q1 Performance Measure Report
Page 6 of 20
dollars were reduced more than $2.7 Million from last quarter. This result reflects a status of green for
the performance measure.
Data Reported: Quarterly FY2016
Target : $7.5M
Status: Green
Data Source: Invoice Aging Reports
PERFORMANCE MEASURE 4 – Percent of Mainframe Services Meeting Federal Standards for Cost Recovery (Annual)
This measure will be reported in FY16 Q4.
PERFORMANCE MEASURE 5 – Percent of Voice, Data and Radio Services Meeting Federal Standards for Cost Recovery (Annual)
This measure will be reported in FY16 Q4.
$-
$2.00
$4.00
$6.00
$8.00
$10.00
FY13Q1
FY13Q2
FY13Q3
FY13Q4
FY14Q1
FY14Q2
FY14Q3
FY14Q4
FY15Q1
FY15Q2
FY15Q3
FY15Q4
FY16Q1
Millions $6.3 $8.1 $8.5 $5.3 $5.9 $7.0 $8.1 $4.9 $5.5 $8.4 $5.8 $4.2 $1.5
$ C
olle
cte
d
Account Receivables Over 60 Days
361 Department of Information Technology FY2016 Q1 Performance Measure Report
Page 7 of 20
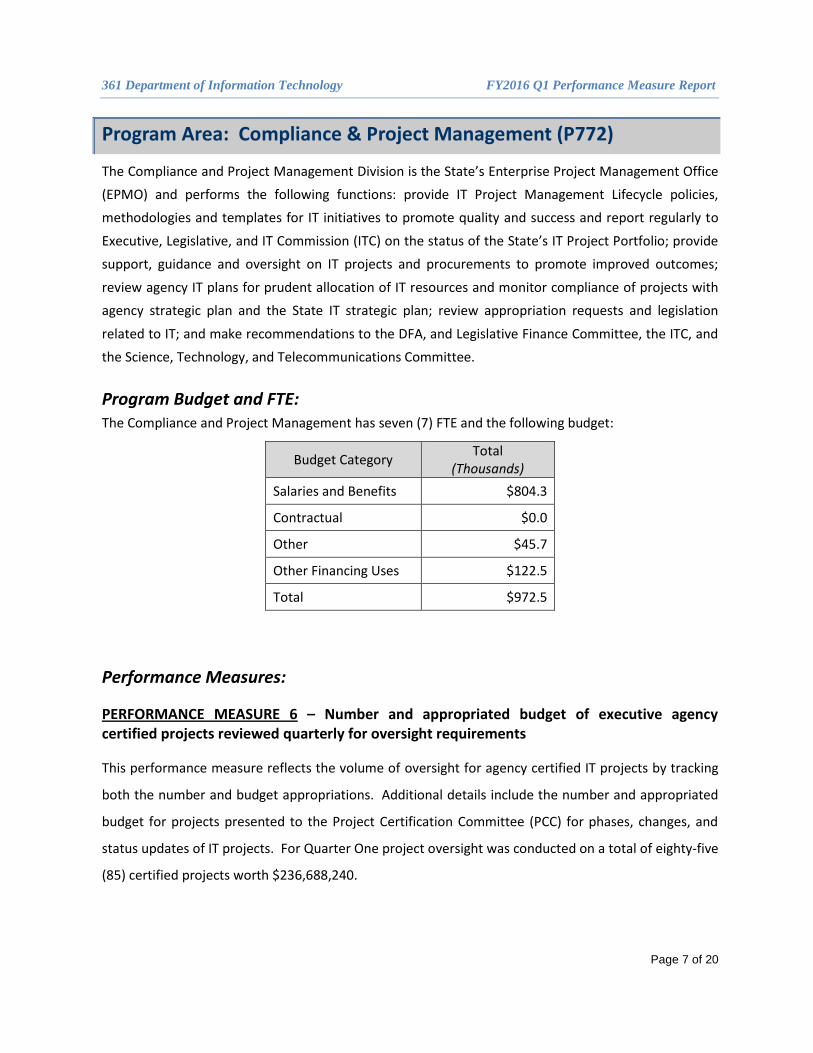
Program Area: Compliance & Project Management (P772)
The Compliance and Project Management Division is the State’s Enterprise Project Management Office
(EPMO) and performs the following functions: provide IT Project Management Lifecycle policies,
methodologies and templates for IT initiatives to promote quality and success and report regularly to
Executive, Legislative, and IT Commission (ITC) on the status of the State’s IT Project Portfolio; provide
support, guidance and oversight on IT projects and procurements to promote improved outcomes;
review agency IT plans for prudent allocation of IT resources and monitor compliance of projects with
agency strategic plan and the State IT strategic plan; review appropriation requests and legislation
related to IT; and make recommendations to the DFA, and Legislative Finance Committee, the ITC, and
the Science, Technology, and Telecommunications Committee.
Program Budget and FTE: The Compliance and Project Management has seven (7) FTE and the following budget:
Budget Category Total
(Thousands)
Salaries and Benefits $804.3
Contractual $0.0
Other $45.7
Other Financing Uses $122.5
Total $972.5
Performance Measures:
PERFORMANCE MEASURE 6 – Number and appropriated budget of executive agency certified projects reviewed quarterly for oversight requirements
This performance measure reflects the volume of oversight for agency certified IT projects by tracking
both the number and budget appropriations. Additional details include the number and appropriated
budget for projects presented to the Project Certification Committee (PCC) for phases, changes, and
status updates of IT projects. For Quarter One project oversight was conducted on a total of eighty-five
(85) certified projects worth $236,688,240.

361 Department of Information Technology FY2016 Q1 Performance Measure Report
Page 8 of 20
Data Reported: Quarterly FY2016
Target: 100%
Status: Green
Data Source: Excel Spreadsheet
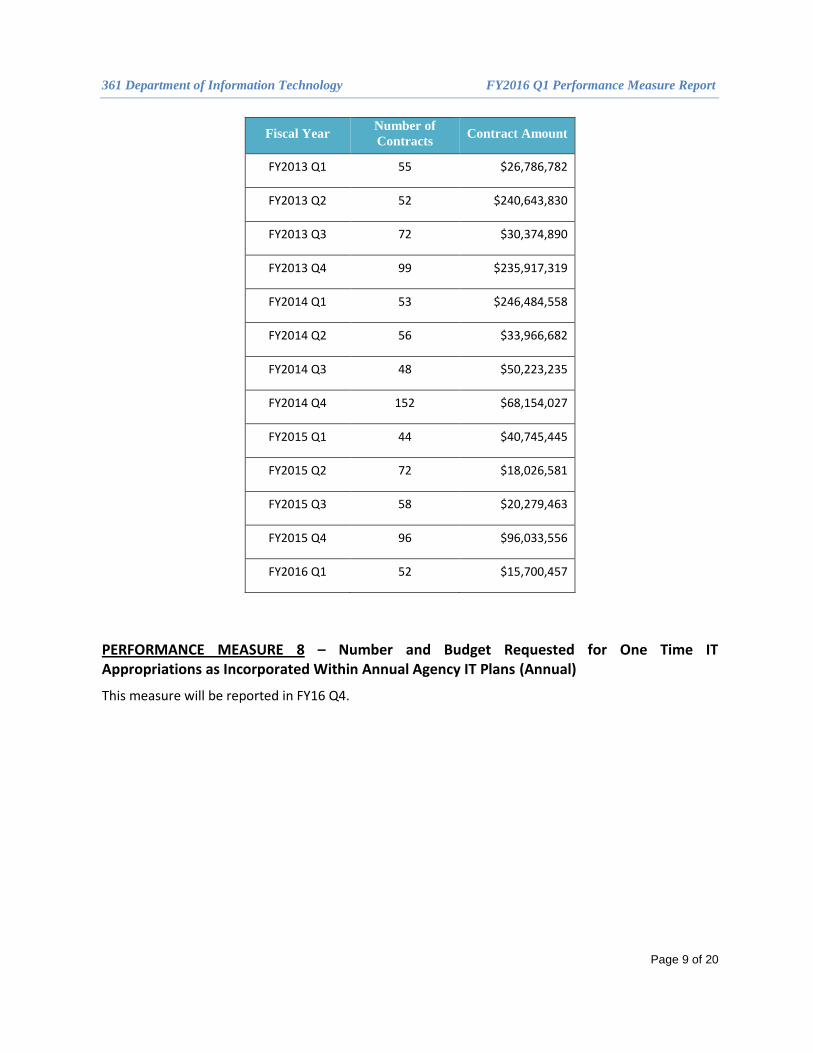
PERFORMANCE MEASURE 7 – Quarterly Number and Budget of Approved IT Professional Services Contracts and Amendments
This performance measure tracks the volume of oversight that the Department provides for statewide
IT expenditures. The performance measure reports the number of IT procurements reviewed and
compensations for IT Professional Services. EPMO performs reviews of agency IT contracts,
amendments, and Request for Proposal (RFP)s; including all procurement types such as emergencies,
sole source, agency price agreements, and state wide price agreements. The purpose of the review is
to ensure the proposed contract(s) and procurements are in accordance with State standards,
guidelines, and consistent with the State IT Strategic Plan and associated agency IT plans. For Quarter
One a total of fifty-two (52) procurements were reviewed and approved in the amount of $15,700,457.
This performance measures is an Explanatory type of measure; which does not have a target; therefore
a status is not reported.
$0
$50,000,000
$100,000,000
$150,000,000
$200,000,000
$250,000,000
FY1
3 Q
1
FY1
3 Q
2
FY1
3 Q
3
FY1
3 Q
4
FY1
4 Q
1
FY1
4 Q
2
FY1
4 Q
3
FY1
4 Q
4
FY1
5 Q
1
FY1
5 Q
2
FY1
5 Q
3
FY1
6 Q
1Co
ntr
acts
Am
ou
nt
Information Technology Professional Services Contracts and Amendments
361 Department of Information Technology FY2016 Q1 Performance Measure Report
Page 9 of 20
Fiscal Year Number of
Contracts Contract Amount
FY2013 Q1 55 $26,786,782
FY2013 Q2 52 $240,643,830
FY2013 Q3 72 $30,374,890
FY2013 Q4 99 $235,917,319
FY2014 Q1 53 $246,484,558
FY2014 Q2 56 $33,966,682
FY2014 Q3 48 $50,223,235
FY2014 Q4 152 $68,154,027
FY2015 Q1 44 $40,745,445
FY2015 Q2 72 $18,026,581
FY2015 Q3 58 $20,279,463
FY2015 Q4 96 $96,033,556
FY2016 Q1 52 $15,700,457
PERFORMANCE MEASURE 8 – Number and Budget Requested for One Time IT Appropriations as Incorporated Within Annual Agency IT Plans (Annual)
This measure will be reported in FY16 Q4.
361 Department of Information Technology FY2016 Q1 Performance Measure Report
Page 10 of 20
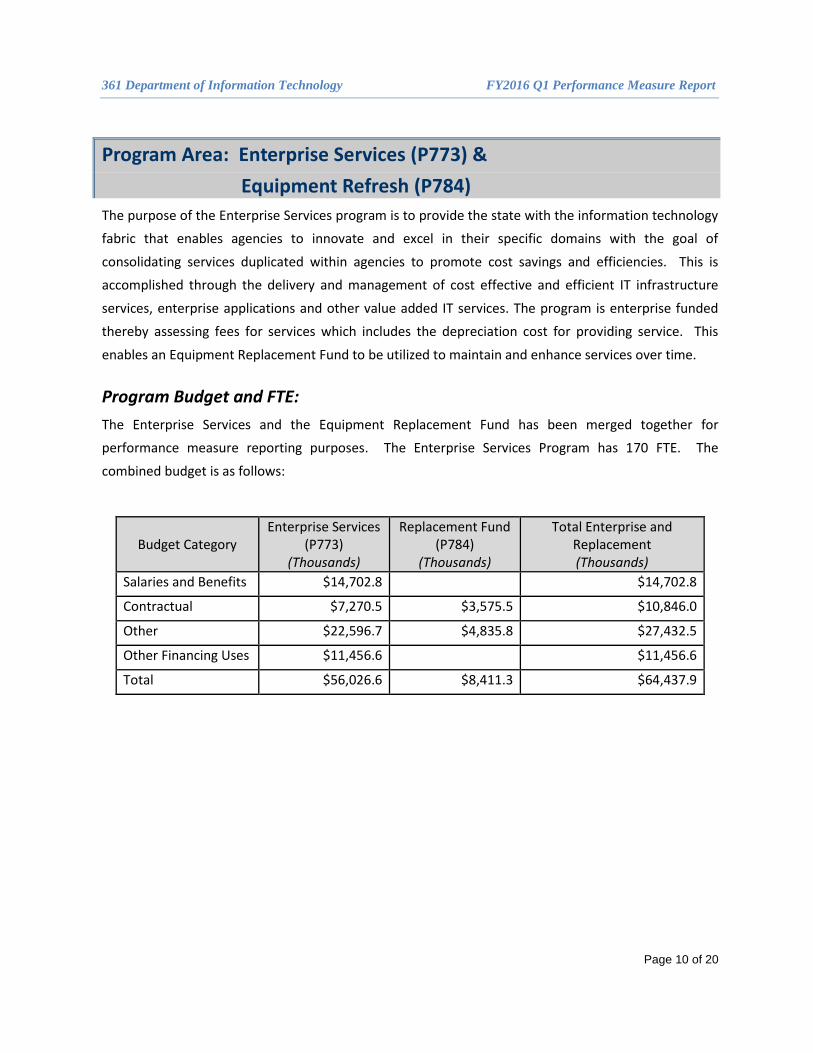
Program Area: Enterprise Services (P773) &
Equipment Refresh (P784)
The purpose of the Enterprise Services program is to provide the state with the information technology
fabric that enables agencies to innovate and excel in their specific domains with the goal of
consolidating services duplicated within agencies to promote cost savings and efficiencies. This is
accomplished through the delivery and management of cost effective and efficient IT infrastructure
services, enterprise applications and other value added IT services. The program is enterprise funded
thereby assessing fees for services which includes the depreciation cost for providing service. This
enables an Equipment Replacement Fund to be utilized to maintain and enhance services over time.
Program Budget and FTE:
The Enterprise Services and the Equipment Replacement Fund has been merged together for
performance measure reporting purposes. The Enterprise Services Program has 170 FTE. The
combined budget is as follows:
Budget Category Enterprise Services
(P773) (Thousands)
Replacement Fund (P784)
(Thousands)
Total Enterprise and Replacement (Thousands)
Salaries and Benefits $14,702.8 $14,702.8
Contractual $7,270.5 $3,575.5 $10,846.0
Other $22,596.7 $4,835.8 $27,432.5
Other Financing Uses $11,456.6 $11,456.6
Total $56,026.6 $8,411.3 $64,437.9

361 Department of Information Technology FY2016 Q1 Performance Measure Report
Page 11 of 20
Performance Measures:
PERFORMANCE MEASURE 9 – Percentage of phone systems using internet protocol or other similar technologies to achieve virtual local calling within the state enterprise (Annual)
This measure will be reported in FY16 Q4.
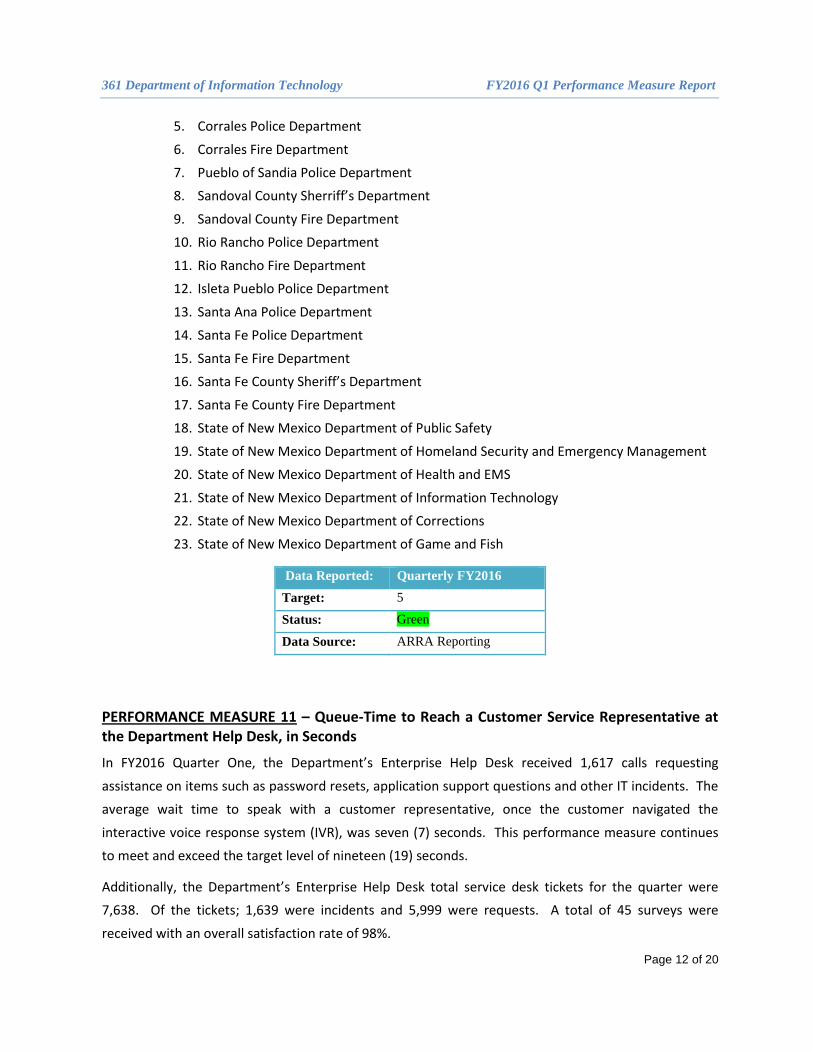
PERFORMANCE MEASURE 10 – Number of Anchor Institutions Utilizing the Forthcoming
700MHz Long Term Evolution Public Safety Network
On behalf of the State, the Department is one of five institutions nationwide to have both a waiver for
the operation of a 700 MHz public safety network, and federal funds for the initial deployment of such
a capability. This performance measure will track the number of anchor institutions, or ‘customers’
that this new technology will support. This metric is also a requirement of the federal grant awarded to
the Department but is equally as important to be established internally by the Department. As this
technology is anticipated to become a substantial portion of the Department’s radio capability over the
next five to ten years, it will be important to meter how widespread its adoption is for the purposes of
advanced planning and development of related cost models.
The Department has a signed Memorandum of Understanding (MOU) with the Department of Interior
(DOI) and Customs Border Protection (CBP). MOU negotiations are underway with White Sands Missile
Range (WSMR). The MOUs are pursuant to the FirstNet Key Learning Condition (KLC) to establish a
federal partnership. Additionally the Department has signed Inter-Local agreements with the New
Mexico counties of Dona Ana and Eddy for use of their respective towers and shelters. New Mexico
has also signed an agreement with Dona Ana County establishing them as a grant co-recipient.
All four phases of the LTE buildout were completed. A demonstration of the 700MHz LTE Public Safety
Broadband Early Builder project at the New Mexico State Fair using a contractor owned transportable
more commonly called a Cell On Wheels (COW) was completed this quarter. Reports by New Mexico
first responders (New Mexico State Police and State Fair Security) are very favorable. A follow-on
demonstration using the State owned COW is planned for the Albuquerque International Balloon Fiesta
in October. The New Mexico 700MHz LTE Public Safety Broadband Early Builder project added six (6)
fixed site collocations. At total of twenty-three (23) Community Anchor Institutions were connected
reflecting potential subscribers served:
1. Albuquerque Police Department
2. Albuquerque Fire Department
3. Bernalillo County Sheriff’s Department
4. Bernalillo County Fire Department
361 Department of Information Technology FY2016 Q1 Performance Measure Report
Page 12 of 20
5. Corrales Police Department
6. Corrales Fire Department
7. Pueblo of Sandia Police Department
8. Sandoval County Sherriff’s Department
9. Sandoval County Fire Department
10. Rio Rancho Police Department
11. Rio Rancho Fire Department
12. Isleta Pueblo Police Department
13. Santa Ana Police Department
14. Santa Fe Police Department
15. Santa Fe Fire Department
16. Santa Fe County Sheriff’s Department
17. Santa Fe County Fire Department
18. State of New Mexico Department of Public Safety
19. State of New Mexico Department of Homeland Security and Emergency Management
20. State of New Mexico Department of Health and EMS
21. State of New Mexico Department of Information Technology
22. State of New Mexico Department of Corrections
23. State of New Mexico Department of Game and Fish
Data Reported: Quarterly FY2016
Target: 5
Status: Green
Data Source: ARRA Reporting
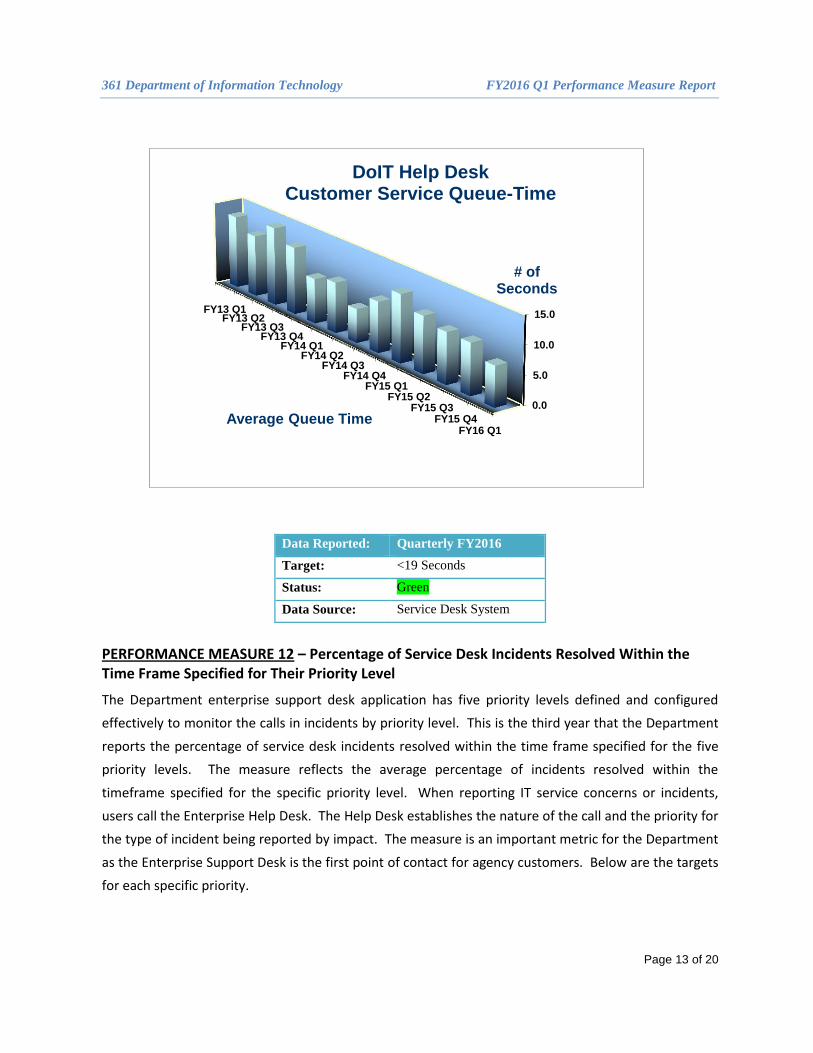
PERFORMANCE MEASURE 11 – Queue-Time to Reach a Customer Service Representative at the Department Help Desk, in Seconds
In FY2016 Quarter One, the Department’s Enterprise Help Desk received 1,617 calls requesting
assistance on items such as password resets, application support questions and other IT incidents. The
average wait time to speak with a customer representative, once the customer navigated the
interactive voice response system (IVR), was seven (7) seconds. This performance measure continues
to meet and exceed the target level of nineteen (19) seconds.
Additionally, the Department’s Enterprise Help Desk total service desk tickets for the quarter were
7,638. Of the tickets; 1,639 were incidents and 5,999 were requests. A total of 45 surveys were
received with an overall satisfaction rate of 98%.
361 Department of Information Technology FY2016 Q1 Performance Measure Report
Page 13 of 20
Data Reported: Quarterly FY2016
Target: <19 Seconds
Status: Green
Data Source: Service Desk System
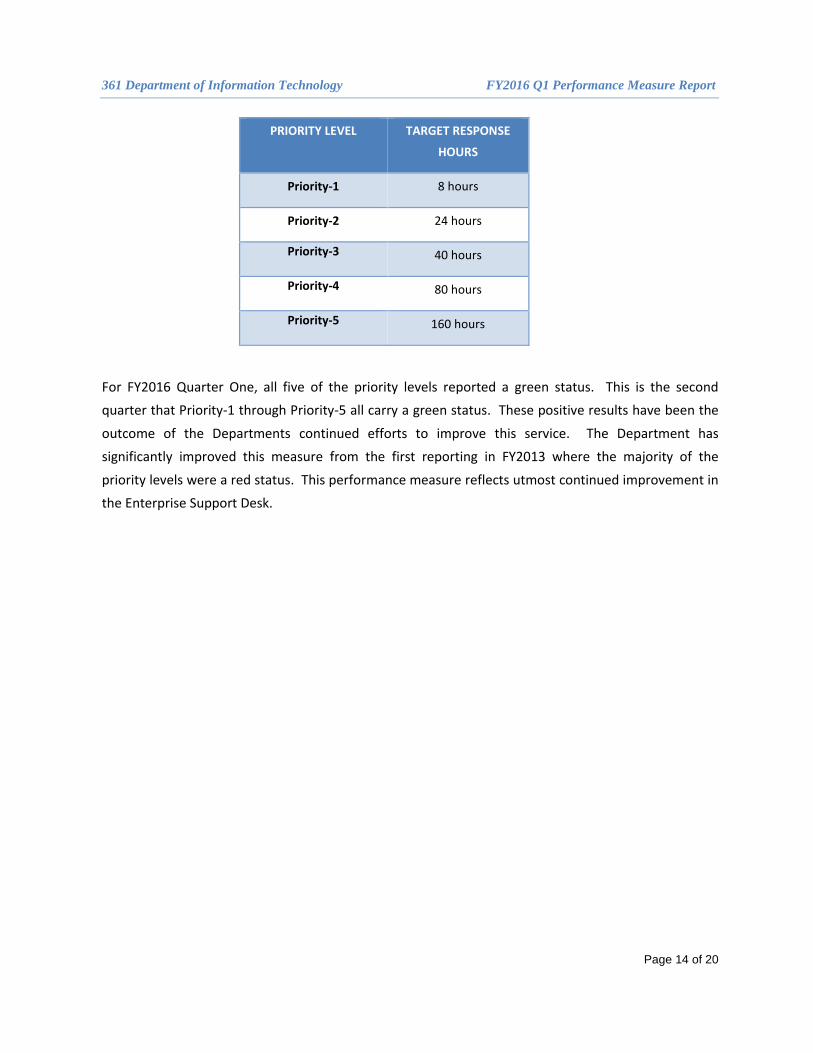
PERFORMANCE MEASURE 12 – Percentage of Service Desk Incidents Resolved Within the Time Frame Specified for Their Priority Level
The Department enterprise support desk application has five priority levels defined and configured
effectively to monitor the calls in incidents by priority level. This is the third year that the Department
reports the percentage of service desk incidents resolved within the time frame specified for the five
priority levels. The measure reflects the average percentage of incidents resolved within the
timeframe specified for the specific priority level. When reporting IT service concerns or incidents,
users call the Enterprise Help Desk. The Help Desk establishes the nature of the call and the priority for
the type of incident being reported by impact. The measure is an important metric for the Department
as the Enterprise Support Desk is the first point of contact for agency customers. Below are the targets
for each specific priority.
0.0
5.0
10.0
15.0FY13 Q1
FY13 Q2FY13 Q3
FY13 Q4FY14 Q1
FY14 Q2FY14 Q3
FY14 Q4FY15 Q1
FY15 Q2FY15 Q3
FY15 Q4FY16 Q1
# of Seconds
Average Queue Time
DoIT Help Desk Customer Service Queue-Time
361 Department of Information Technology FY2016 Q1 Performance Measure Report
Page 14 of 20
PRIORITY LEVEL TARGET RESPONSE
HOURS
Priority-1 8 hours
Priority-2 24 hours
Priority-3 40 hours
Priority-4 80 hours
Priority-5 160 hours
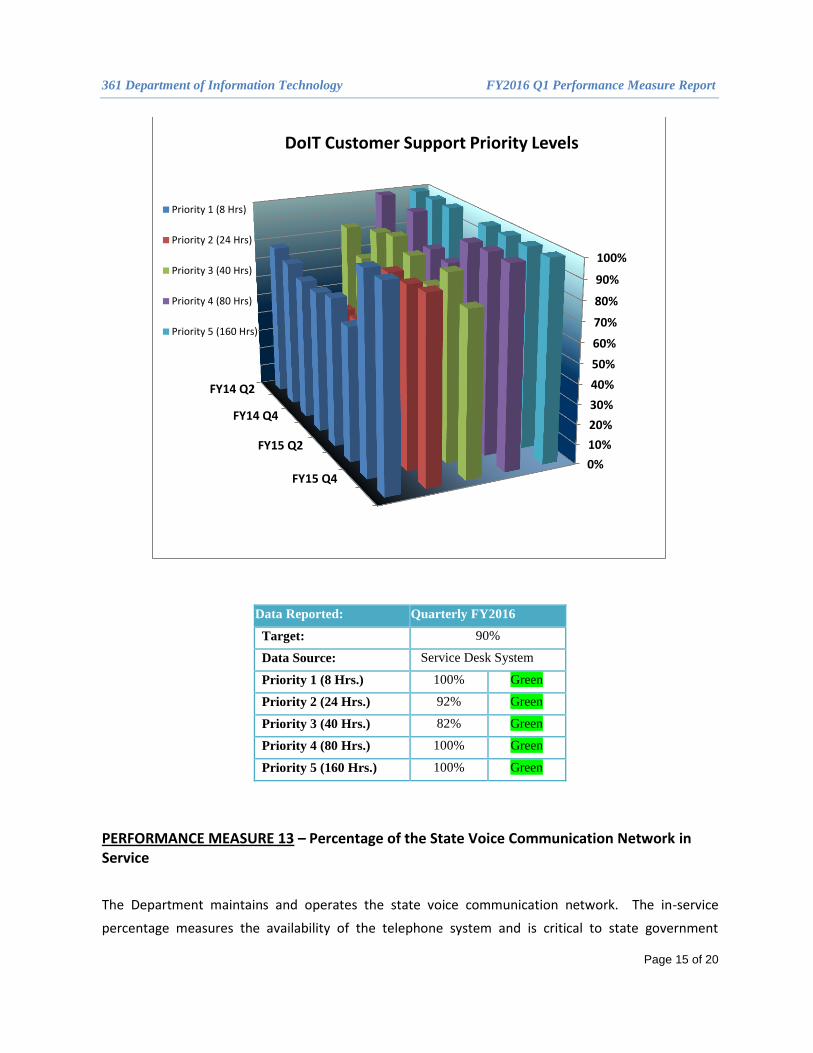
For FY2016 Quarter One, all five of the priority levels reported a green status. This is the second
quarter that Priority-1 through Priority-5 all carry a green status. These positive results have been the
outcome of the Departments continued efforts to improve this service. The Department has
significantly improved this measure from the first reporting in FY2013 where the majority of the
priority levels were a red status. This performance measure reflects utmost continued improvement in
the Enterprise Support Desk.
361 Department of Information Technology FY2016 Q1 Performance Measure Report
Page 15 of 20
Data Reported: Quarterly FY2016
Target: 90%
Data Source: Service Desk System
Priority 1 (8 Hrs.) 100% Green
Priority 2 (24 Hrs.) 92% Green
Priority 3 (40 Hrs.) 82% Green
Priority 4 (80 Hrs.) 100% Green
Priority 5 (160 Hrs.) 100% Green
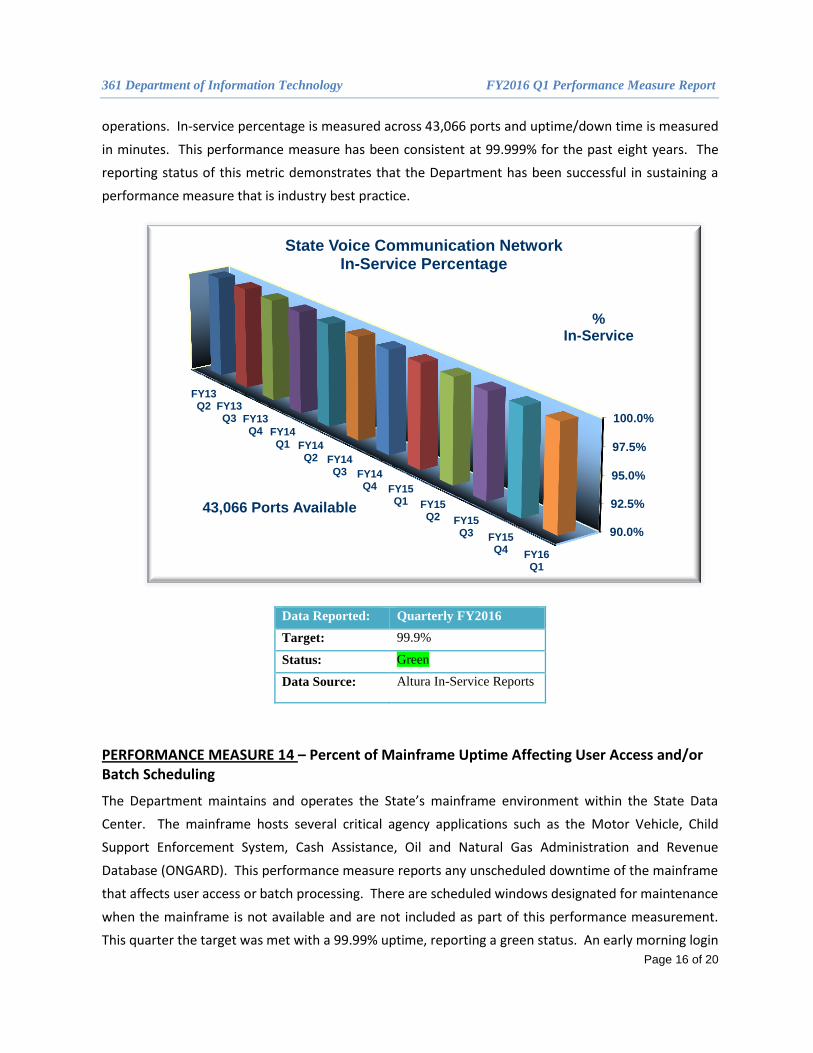
PERFORMANCE MEASURE 13 – Percentage of the State Voice Communication Network in Service
The Department maintains and operates the state voice communication network. The in-service
percentage measures the availability of the telephone system and is critical to state government
0%
10%
20%
30%
40%
50%
60%
70%
80%
90%
100%
FY14 Q2
FY14 Q4
FY15 Q2
FY15 Q4
DoIT Customer Support Priority Levels
Priority 1 (8 Hrs)
Priority 2 (24 Hrs)
Priority 3 (40 Hrs)
Priority 4 (80 Hrs)
Priority 5 (160 Hrs)
361 Department of Information Technology FY2016 Q1 Performance Measure Report
Page 16 of 20
operations. In-service percentage is measured across 43,066 ports and uptime/down time is measured
in minutes. This performance measure has been consistent at 99.999% for the past eight years. The
reporting status of this metric demonstrates that the Department has been successful in sustaining a
performance measure that is industry best practice.
Data Reported: Quarterly FY2016
Target: 99.9%
Status: Green
Data Source: Altura In-Service Reports
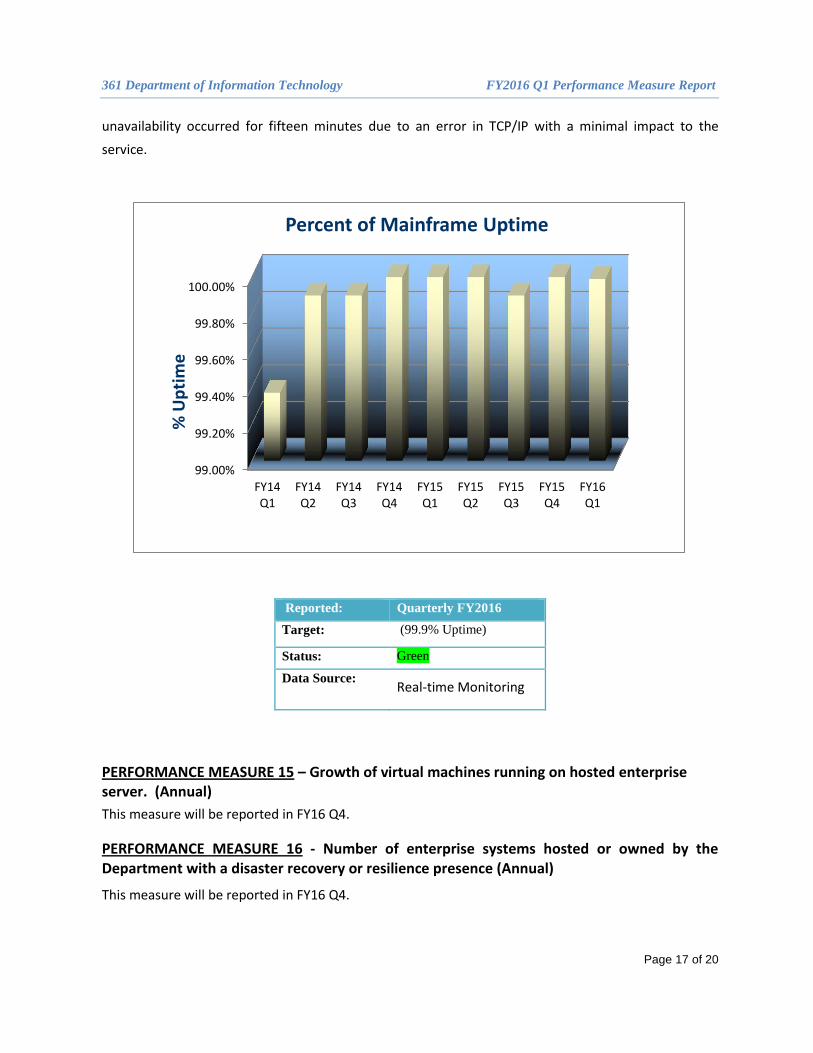
PERFORMANCE MEASURE 14 – Percent of Mainframe Uptime Affecting User Access and/or Batch Scheduling
The Department maintains and operates the State’s mainframe environment within the State Data
Center. The mainframe hosts several critical agency applications such as the Motor Vehicle, Child
Support Enforcement System, Cash Assistance, Oil and Natural Gas Administration and Revenue
Database (ONGARD). This performance measure reports any unscheduled downtime of the mainframe
that affects user access or batch processing. There are scheduled windows designated for maintenance
when the mainframe is not available and are not included as part of this performance measurement.
This quarter the target was met with a 99.99% uptime, reporting a green status. An early morning login
90.0%
92.5%
95.0%
97.5%
100.0%
FY13Q2 FY13
Q3 FY13Q4 FY14
Q1 FY14Q2 FY14
Q3 FY14Q4 FY15
Q1 FY15Q2 FY15
Q3 FY15Q4 FY16
Q1
% In-Service
43,066 Ports Available
State Voice Communication Network In-Service Percentage
361 Department of Information Technology FY2016 Q1 Performance Measure Report
Page 17 of 20
unavailability occurred for fifteen minutes due to an error in TCP/IP with a minimal impact to the
service.
Reported: Quarterly FY2016
Target: (99.9% Uptime)
Status: Green
Data Source: Real-time Monitoring
PERFORMANCE MEASURE 15 – Growth of virtual machines running on hosted enterprise server. (Annual)
This measure will be reported in FY16 Q4.
PERFORMANCE MEASURE 16 - Number of enterprise systems hosted or owned by the Department with a disaster recovery or resilience presence (Annual)
This measure will be reported in FY16 Q4.
99.00%
99.20%
99.40%
99.60%
99.80%
100.00%
FY14Q1
FY14Q2
FY14Q3
FY14Q4
FY15Q1
FY15Q2
FY15Q3
FY15Q4
FY16Q1
% U
pti
me
Percent of Mainframe Uptime
361 Department of Information Technology FY2016 Q1 Performance Measure Report
Page 18 of 20
PERFORMANCE MEASURE 17 – Percent of Co-located and Enterprise-hosted Services with Documented System Security Plans (Annual)
This measure will be reported in FY16 Q4.
PERFORMANCE MEASURE 18 – Number of Perimeter and Security-Logged Devices Reporting Security Metrics to the Network Operations Center (Annual)
This measure will be reported in FY16 Q4.
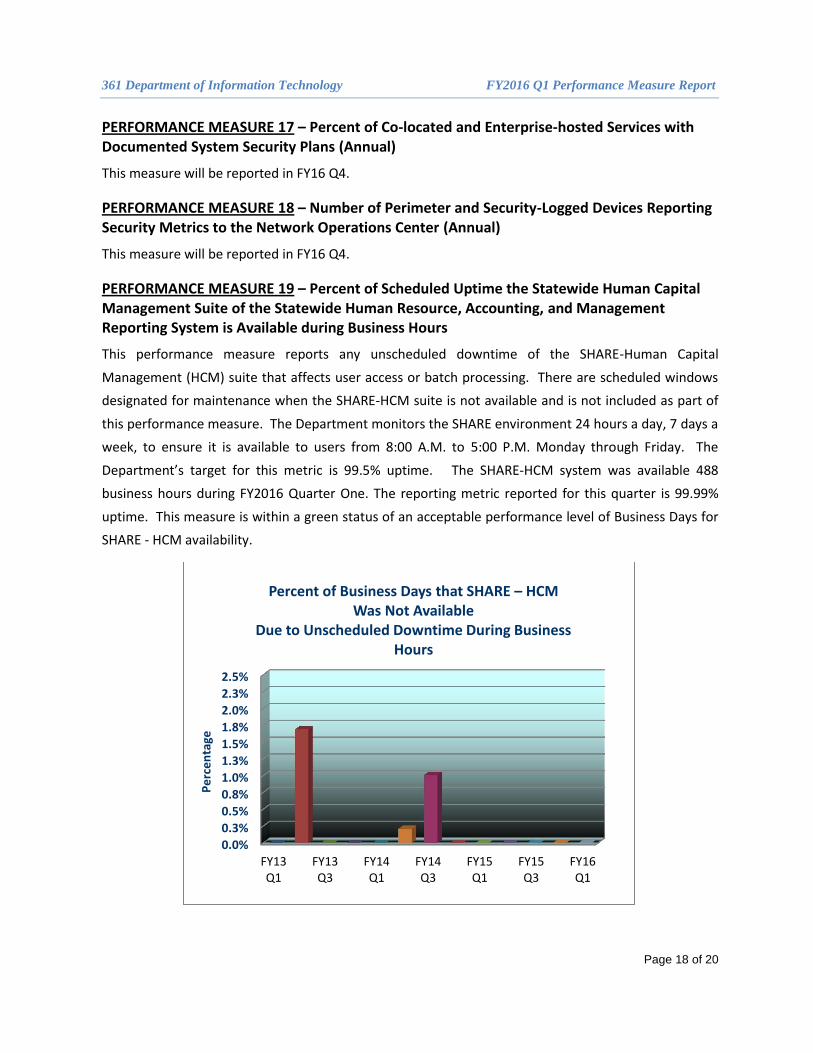
PERFORMANCE MEASURE 19 – Percent of Scheduled Uptime the Statewide Human Capital Management Suite of the Statewide Human Resource, Accounting, and Management Reporting System is Available during Business Hours
This performance measure reports any unscheduled downtime of the SHARE-Human Capital
Management (HCM) suite that affects user access or batch processing. There are scheduled windows
designated for maintenance when the SHARE-HCM suite is not available and is not included as part of
this performance measure. The Department monitors the SHARE environment 24 hours a day, 7 days a
week, to ensure it is available to users from 8:00 A.M. to 5:00 P.M. Monday through Friday. The
Department’s target for this metric is 99.5% uptime. The SHARE-HCM system was available 488
business hours during FY2016 Quarter One. The reporting metric reported for this quarter is 99.99%
uptime. This measure is within a green status of an acceptable performance level of Business Days for
SHARE - HCM availability.
0.0%
0.3%
0.5%
0.8%
1.0%
1.3%
1.5%
1.8%
2.0%
2.3%
2.5%
FY13Q1
FY13Q3
FY14Q1
FY14Q3
FY15Q1
FY15Q3
FY16Q1
Pe
rce
nta
ge
Percent of Business Days that SHARE – HCM Was Not Available
Due to Unscheduled Downtime During Business Hours
361 Department of Information Technology FY2016 Q1 Performance Measure Report
Page 19 of 20
Data Reported: Quarterly FY2016
Target: 99.5%
Status: Green
Data Source: Real-time Monitoring Reports
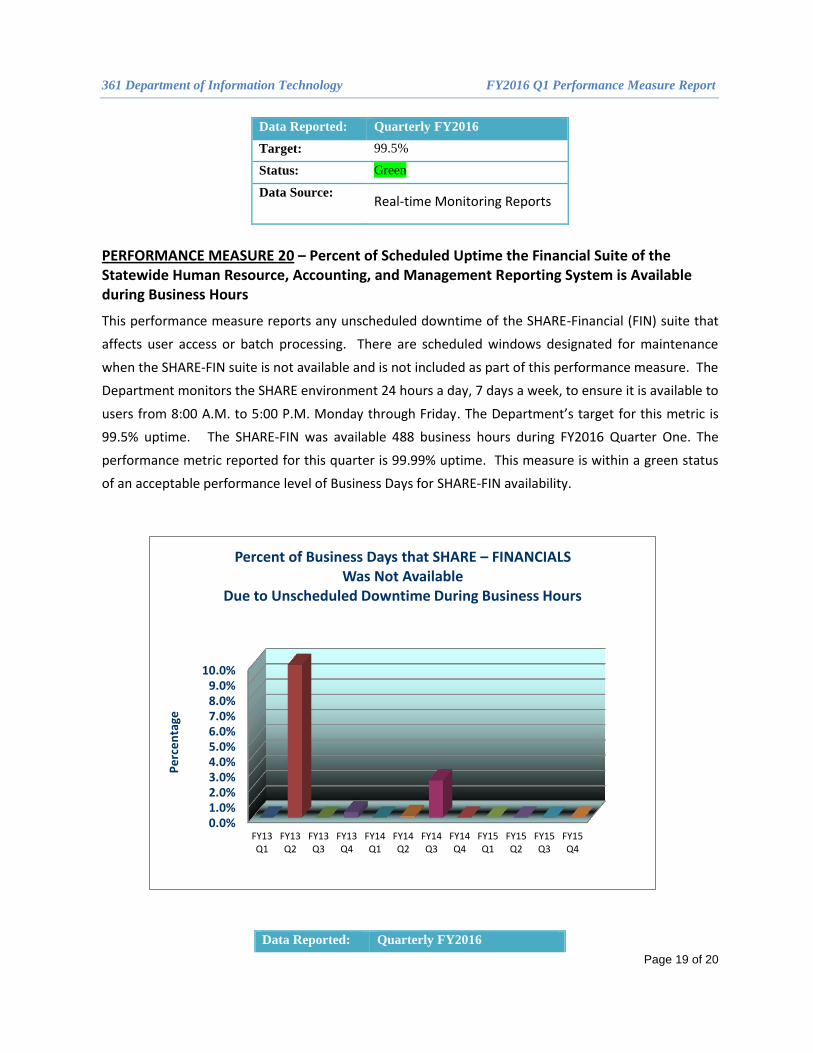
PERFORMANCE MEASURE 20 – Percent of Scheduled Uptime the Financial Suite of the Statewide Human Resource, Accounting, and Management Reporting System is Available during Business Hours
This performance measure reports any unscheduled downtime of the SHARE-Financial (FIN) suite that
affects user access or batch processing. There are scheduled windows designated for maintenance
when the SHARE-FIN suite is not available and is not included as part of this performance measure. The
Department monitors the SHARE environment 24 hours a day, 7 days a week, to ensure it is available to
users from 8:00 A.M. to 5:00 P.M. Monday through Friday. The Department’s target for this metric is
99.5% uptime. The SHARE-FIN was available 488 business hours during FY2016 Quarter One. The
performance metric reported for this quarter is 99.99% uptime. This measure is within a green status
of an acceptable performance level of Business Days for SHARE-FIN availability.
Data Reported: Quarterly FY2016
0.0%1.0%2.0%3.0%4.0%5.0%6.0%7.0%8.0%9.0%
10.0%
FY13Q1
FY13Q2
FY13Q3
FY13Q4
FY14Q1
FY14Q2
FY14Q3
FY14Q4
FY15Q1
FY15Q2
FY15Q3
FY15Q4
Pe
rce
nta
ge
Percent of Business Days that SHARE – FINANCIALS Was Not Available
Due to Unscheduled Downtime During Business Hours
361 Department of Information Technology FY2016 Q1 Performance Measure Report
Page 20 of 20
Target: 99.5%,
Status: Green
Data Source: Real-time Monitoring Reports
PERFORMANCE MEASURE 21 – Percent on time delivery of Statewide Human Resource, Accounting, and Management Reporting System approved projects to the agreed upon implementation date
This performance measure tracks the on-time delivery of approved project requests to agencies for the
Statewide Human Resource, Accounting, and Management Reporting (SHARE) enterprise system. As
different projects have different estimated durations, this performance measure will normalize the
duration differences by calculating the days missed as a percentage of the scheduled time. The
Department reporting target is 80% of on-time delivery of approved projects to the implementation
date. The reporting metrics reported this quarter is 85% of on delivery of approved projects; this is
within a green status of an acceptable performance level and an improvement from last quarter of 5%.
Data Reported: Quarterly FY2016
Target: 80%
Status: Green
Data Source: Excel spreadsheet of
accepted Project Request
PERFORMANCE MEASURE 22 - Percent of staffs that receive at minimum 24 hours of training in their specific technology field within a year (Annual)
This measure will be reported in FY16 Q4.