FY 2013 RESULTS ANALYST BRIEFING - listed company · This presentation is not and does not...
26
FY 2013 RESULTS ANALYST BRIEFING 27 February 2014
Transcript of FY 2013 RESULTS ANALYST BRIEFING - listed company · This presentation is not and does not...

FY 2013 RESULTS
ANALYST BRIEFING
27 February 2014
This presentation is not and does not constitute an offer, invitation, solicitation or recommendation to subscribe for, or purchase, any securities
and neither this presentation nor anything contained in it shall form the basis of, or be relied on in connection with any contract or commitment or
investment decision.
This presentation has been prepared solely for use at this presentation. By your continued attendance at this presentation, you are deemed to
have agreed and confirmed to Telekom Malaysia Berhad (the “Company”) that: (a) you agree not to trade in any securities of the Company or its
respective affiliates until the public disclosure of the information contained herein; and (b) you agree to maintain absolute confidentiality
regarding the information disclosed in this presentation until the public disclosure of such information, or unless you have been otherwise
notified by the Company.
Reliance should not be placed on the information or opinions contained in this presentation or on its completeness. This presentation does not
take into consideration the investment objectives, financial situation or particular needs of any particular investor.
No representation or warranty, express or implied, is made as to the fairness, accuracy, completeness or correctness of the information,
opinions and conclusions contained in this presentation. None of the Company and its affiliates and related bodies corporate, and their
respective officers, directors, employees and agents disclaim any liability (including, without limitation, any liability arising from fault or
negligence) for any loss arising from any use of this presentation or its contents or otherwise arising in connection with it.
This presentation contains projections and “forward-looking statements” relating to the Company’s business and the sectors in which the
Company operates. These forward-looking statements include statements relating to the Company’s performance. These statements reflect the
current views of the Company with respect to future events and are subject to certain risks, uncertainties and assumptions. It is important to note
that actual results could differ materially from those anticipated in these forward looking statements. The Company does not undertake to inform
you of any matters or information which may come to light or be brought to the Company’s attention after the date hereof.
The forecasts and other forward-looking statements set out in this presentation are based on a number of estimates and assumptions that are
subject to business, economic and competitive uncertainties and contingencies, with respect to future business decisions, which are subject to
change and in many cases outside the control of the Company. The directors and officers of the Company believe that they have prepared the
forecasts with due care and attention and consider all best estimates and assumptions when taken as a whole to be reasonable at the time of
preparing the presentation. However, the Company’s forecasts presented in this presentation may vary from actual financial results, and these
variations may be material and, accordingly, neither the Company nor its directors or officers can give any assurance that the forecast
performance in the forecasts or any forward-looking statement contained in this presentation will be achieved. Details of the forecasts and the
assumptions on which they are based are set out in the presentation.
This presentation may not be copied or otherwise reproduced without the written consent of TM.
Disclaimer

Performance Overview
Financial review
Operating highlights
Concluding remarks
3

Key Highlights
• Revenue growth in line with Headline KPI •Stronger Normalised EBIT Growth • Higher Customer Satisfaction Index 72
FY2013 Headline KPI
FY2013 Achievement
6%
3%
6.4%
18.2%
> 72
Broadband leadership: • 7.2% growth in total broadband customers
•41% of total customers are on high speed broadband (4Mbps and above)
•Positive growth driven by Data and Internet revenue •Normalised PATAMI grew by 17.9% to RM1.04bn • Total Capex/Revenue ratio from 25.5% to 17.5%
4
Achieved all headline KPI – 4th consecutive year
• Final dividend of 16.3 sen per share
•Total dividend payout of 26.1 sen per share or RM933.7mn

• Operating revenue growth +14.1% +6.1% +6.4%
• Normalised EBIT growth +8.5% +8.9% +18.2%
• Normalised PATAMI growth +7.2% +0.5% +17.9%
Key Operating Indicators
Key Highlights 4Q 2013 / FY2013
Financial Performance
5
• Internet revenue growth +3.5% +13.2% +12.8%
• Data revenue growth +8.1% +6.2% +13.9%
• UniFi customer growth +4.5% +31.6%
• Overall broadband customer growth +1.4% +7.2%
4Q13 vs
3Q13
4Q13 vs
4Q12
FY13 vs
FY12

Performance Overview Financial review Operating highlights
Concluding remarks
6

Group Results FY 2013 & 4Q2013
7
RMmn
Reported
4Q13 3Q13 % Change
QoQ 4Q12**
% Change YoY
FY13 FY12** % Change
FY13 vs FY12
Revenue 2,979.8 2,610.5 +14.1 2,809.3 +6.1 10,628.7 9,993.5 +6.4
Other Operating Income
35.8 32.5 +10.2 74.2 -51.8 121.5 165.4 -26.5
EBITDA 958.0 906.3 +5.7 901.8 +6.2 3,531.6 3,233.3 +9.2
Depn & Amort. 578.8 541.4 +6.9 508.0 +13.9 2,159.7 2,046.4 +5.5
EBIT 379.2 364.9 +3.9 393.8 -3.7 1,371.9 1,186.9 +15.6
Net Finance Cost* 60.8 59.5 +2.2 54.7 +11.2 226.3 191.9 +17.9
FX (Gain) / Loss 8.7 43.8 -80.1 (5.4) ->100.0 105.2 (73.4) ->100.0
Profit Before Tax (PBT) 309.7 264.9 +16.9 346.2 -10.5 1,046.0 1,069.6 -2.2
PATAMI 344.2 240.9 +42.9 363.2 -5.2 1,012.2 1,263.7 -19.9
Normalised PATAMI 289.7 270.3 +7.2 288.4 +0.5 1,038.5 881.0 +17.9
Note: For Normalised EBIT and Normalised PATAMI refer Slides 8 and 9 •Excludes FX (Gain )/Loss ** Restated due to adoption of MFRS 116 in 2013
Revenue exceeded RM10bn and Normalised PATAMI exceeded RM1bn
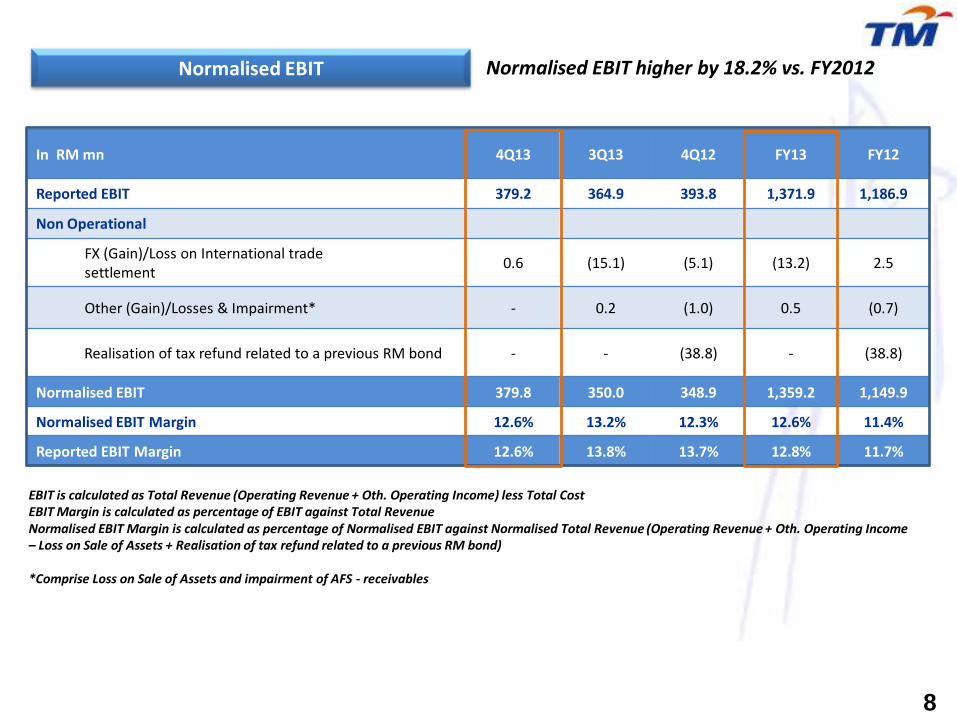
Normalised EBIT Normalised EBIT higher by 18.2% vs. FY2012
In RM mn 4Q13 3Q13 4Q12 FY13 FY12
Reported EBIT 379.2 364.9 393.8 1,371.9 1,186.9
Non Operational
FX (Gain)/Loss on International trade settlement 0.6 (15.1) (5.1) (13.2) 2.5
Other (Gain)/Losses & Impairment* - 0.2 (1.0) 0.5 (0.7)
Realisation of tax refund related to a previous RM bond - - (38.8) - (38.8)
Normalised EBIT 379.8 350.0 348.9 1,359.2 1,149.9
Normalised EBIT Margin 12.6% 13.2% 12.3% 12.6% 11.4%
Reported EBIT Margin 12.6% 13.8% 13.7% 12.8% 11.7%
EBIT is calculated as Total Revenue (Operating Revenue + Oth. Operating Income) less Total Cost EBIT Margin is calculated as percentage of EBIT against Total Revenue Normalised EBIT Margin is calculated as percentage of Normalised EBIT against Normalised Total Revenue (Operating Revenue + Oth. Operating Income – Loss on Sale of Assets + Realisation of tax refund related to a previous RM bond) *Comprise Loss on Sale of Assets and impairment of AFS - receivables
8

Normalised PATAMI
9
Normalised PATAMI 17.9% higher vs. FY2012
In RM mn 4Q13 3Q13 4Q12 FY13 FY12
Reported PATAMI 344.2 240.9 363.2 1,012.2 1,263.7
Non Operational
FX (Gain)/Loss on International trade Settlement 0.6 (15.1) (5.1) (13.2) 2.5
Realisation of tax refund related to a previous RM bond - - (38.8) - (38.8)
Other (Gain)/Losses & Impairment* 0.7 0.7 (1.5) (1.2) (1.0)
Unrealised FX (Gain)/Loss on Long Term Loans
8.7 43.8 (5.4) 105.2 (73.4)
Tax Incentives** (29.5) - (53.4) (29.5) (301.4)
S108 impact from utilisation of tax incentives - - 29.4 - 29.4
Impact of tax rate changes (35.0) - - (35.0) -
Normalised PATAMI** 289.7 270.3 288.4 1,038.5 881.0
*Comprise fair value (FV) changes of FVTPL (FV through P&L) investment gain/loss on disposal for AFS (available for sale) investments, Loss on Sale of Assets and impairment of AFS - receivables
**Current year tax incentives: FY13: RM162.8mil (HSBB), FY12: RM188.4mil [RM56.0mil (last mile), RM132.4mil (HSBB)]

Cost % of Revenue1
Note: The classification of cost is as per financial reporting
(Please refer to Appendix for quarterly details & breakdown)
Healthier total cost/revenue ratio despite higher manpower & content cost
FY 2013 vs. FY 2012 •Higher Direct cost due to higher
content cost, USP cost, leased charges and domestic outpayment •Higher Manpower cost due to higher salaries and staff benefits •Lower Maintenance cost due to lower customer projects •Lower Marketing cost due to lower A&P activities
10
20.1 20.1
17.0 17.2
19.9 21.0
11.6 10.9
8.5 7.1
6.3 6.4
4.2 3.7 0.6 0.8
FY12 FY13
Bad debt
Marketing expenses
Supplies & material
Maintenance cost
Other operating cost
Manpower cost
Direct cost
Dep & Amortisation
Revenue = Operating Revenue + Other Operating Income 1
RM mn RM mn
Total Cost / Revenue ( %)
RM8,972.0
88.3%
RM9,378.3
87.2%
% of Revenue

781 479
645
516
228
171
0
500
1000
1500
2000
FY12 FY13
Access Core Network Support System*
338 269
278
129
276
299
0
200
400
600
800
1000
FY12 FY13 Access Core Network Support System*
1,119 748
923
645
504
470
0
500
1,000
1,500
2,000
2,500
3,000
FY12 FY13
Access Core Network Support System*
Lower capex/revenue ratio Group Capital Expenditure
** Gross capex to be shared with Government equally up to RM4.8bn (fully paid as at July 2012) Note: Government coinvestment treated as deferred income, to be amortised progressively to match against the depreciation of assets
*Include Application, Support System & Others (building, land improvement, moveable plants, application & other assets)
HSBB Capex**
Note : BAU – Business As Usual
RM mn
2,546
1,654
25.5
BAU Capex
892
8.9
Capex / Revenue ( %)
1,166
697
6.6
1,863
17.5
11.0 16.6
Total Capex
11
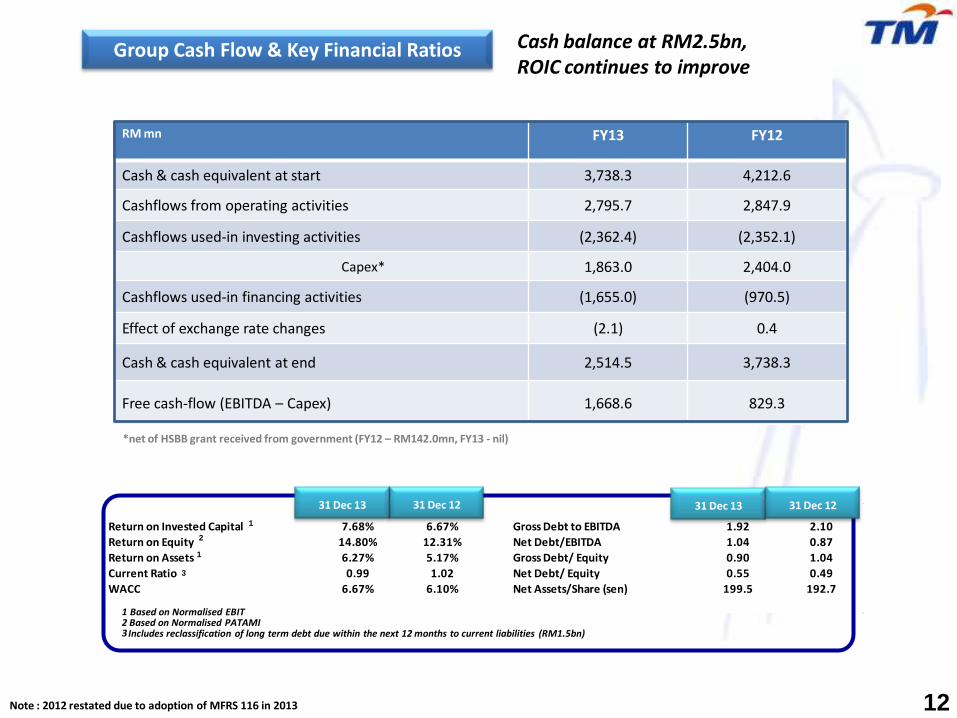
Group Cash Flow & Key Financial Ratios
12
Cash balance at RM2.5bn, ROIC continues to improve
31 Dec 13 31 Dec 12 31 Dec 13 31 Dec 12Return on Invested Capital 7.68% 6.67% Gross Debt to EBITDA 1.92 2.10
Return on Equity 14.80% 12.31% Net Debt/EBITDA 1.04 0.87
Return on Assets 6.27% 5.17% Gross Debt/ Equity 0.90 1.04
Current Ratio 0.99 1.02 Net Debt/ Equity 0.55 0.49
WACC 6.67% 6.10% Net Assets/Share (sen) 199.5 192.7
31 Dec 13 31 Dec 12
RM mn FY13 FY12
Cash & cash equivalent at start 3,738.3 4,212.6
Cashflows from operating activities 2,795.7 2,847.9
Cashflows used-in investing activities (2,362.4) (2,352.1)
Capex* 1,863.0 2,404.0
Cashflows used-in financing activities (1,655.0) (970.5)
Effect of exchange rate changes (2.1) 0.4
Cash & cash equivalent at end 2,514.5 3,738.3
Free cash-flow (EBITDA – Capex) 1,668.6 829.3
31 Dec 12 31 Dec 13
*net of HSBB grant received from government (FY12 – RM142.0mn, FY13 - nil)
3
3 Includes reclassification of long term debt due within the next 12 months to current liabilities (RM1.5bn)
Based on Normalised EBIT Based on Normalised PATAMI
1
1
2
2 1
Note : 2012 restated due to adoption of MFRS 116 in 2013

Performance Overview
Financial review
Operating highlights
Concluding remarks
13

Voice 37%
Data 22%
Internet 24%
Other 17%
Voice 34%
Data 24%
Internet 25%
Other 17%
630 398
673 1,711 1,823
4Q12 3Q13 4Q13 FY12 FY13
626 686 709 2,372 2,676
4Q12 3Q13 4Q13 FY12 FY13
907 892 911 3,706 3,618
4Q12 3Q13 4Q13 FY12 FY13
Group Total Revenue by Product
Data
RM mn
RM mn RM mn
Voice*
Others**
Internet* FY13
FY12
RM mn RM mn
RM mn
RM10,629mn
RM9,994mn
* Reclassification between Voice and Internet of RM30mn in 2Q13 **Others comprise other telco and non-telco services (i.e ICT-BPO, MMU tuition fees, customer projects)
+0.5%
+2.1%
Revenue growth driven by Internet and Data
-2.4% +13.2%
+3.5%
+12.8%
+6.2%
+8.1%
+13.9% +6.7%
+69.2%
+6.5%
14
646 635 687 2,205 2,512
4Q12 3Q13 4Q13 FY12 FY13

Positive growth across all segments
15
Group Total Revenue by Line of Business
* Others comprise revenue from VADS, Property Development, TM R&D, TMIM, UTSB and MKL
2,035 1,947 2,207
7,454 7,965
4Q12 3Q13 4Q13 FY12 FY13
Global & Wholesale
FY13 FY12 RM10,629mn RM9,994mn
Retail
RM mn RM mn RM mn
Others*
Retail (C+S+E+G): 75% Retail (C+S+E+G): 74%
+8.5%
+13.4%
+6.9% +4.6%
+8.1%
+3.4% -7.5%
+32.4%
+7.6%
318 222
294
890 958
4Q12 3Q13 4Q13 FY12 FY13
457 442 478
1,650 1,706
4Q12 3Q13 4Q13 FY12 FY13
Retail 75%
Global & Wholesale
16%
Others 9%
Retail 74%
Global & Wholesale
17%
Others 9%

2,390 2,364 2,337 2,317 2,296
1,486 1,474 1,463 1,453 1,442
483 532 577 607 635
4Q12 1Q13 2Q13 3Q13 4Q13
Fixed Line Residential Fixed Line Business UniFi
406 448 484 509 530
77 84
93 98 105
4Q12 1Q13 2Q13 3Q13 4Q13
UniFi Residential UniFi Business
1,296 1,292 1,291 1,290 1,292
287 285 285 287 288
483 532 577 607 635
4Q12 1Q13 2Q13 3Q13 4Q13
Streamyx Residential Streamyx Business UniFi
Net adds (in thousand)
In thousand
In thousand
+7.2%
+1.4%
Physical Highlights
Broadband Customer Growth
Fixed Line Customer Growth
+43
4,370
2,109
Net adds (in thousand)
532
UniFi
+49
Healthy broadband growth and higher ARPU across products
2,066
483
4,359
16
*Call Usage Only ** Streamyx Net ARPU *** Blended ARPU
ARPU (RM) 4Q12 1Q13 2Q13 3Q13 4Q13
Fixed Line (DEL)* 32 31 32 31 33
Streamyx Broadband** 81 80 82 83 85
UniFi*** 181 178 180 183 185
ARPU
577
+45
+44
2,153
4,377
In thousand
+30
607 2,184
+31
4,377
2,215
+31 +28
635
4,373
+31.6%
+4.5%
+0.3%
-0.1%

Performance Overview
Financial review
Operating highlights
Concluding remarks
17

Key Takeaways
Financial Performance
Broadband Champion
• Achieved all Headline KPI’s 6.4% revenue growth, driven by Internet and Data Normalised EBIT growth 18.2%
• Normalised PATAMI grew by 17.9% • Sustained capital and cost efficiency: Cost/Revenue ratio
improved to 87.2%
• Total broadband customer base grown to 2.2mn • Increasing number of customers on high speed broadband
41% of total broadband customers on 4Mbps and above >650,000 Unifi customers to date; 43% takeup rate
Shareholder Value
Customer-centricity
• Commitment to create shareholder value • Total dividend payout of 26.1 sen per share or RM933.7mn
(including interim dividend of 9.8 sen per share or RM350.6mn paid in September 2013)
• Successful implementation of improvement initiatives • Achieved TRI*M Index score of >72
18

Outlook 2014
19
MALAYSIA’S BROADBAND CHAMPION
Enabling a digital lifestyle – Life Made Easier, Business Made Easier Innovative offerings across segments with enhanced customer service Expansion of broadband services in under-served areas Complement TM’s existing suite of fixed broadband services
INFORMATION & INNOVATION EXCHANGE
Integrated ICT player for Managed Accounts Beyond Connectivity - providing more end-to-end
and value-added services, Managed Services, cloud services and BPO
Content and Applications Drive
PERFORMANCE IMPROVEMENT PROGRAM 3.0
Continued growth Fundamental productivity shift Institutional health drivers

20
Headline KPI
2014 2016
Revenue Growth
EBIT Growth
Customer Satisfaction Measure
5.0-5.5% 6%
5% 8%
72 72
1 Using TRiM index measuring end to end customer experience at all touch points. TRiM (Measuring, Managing and Monitoring) is a standardized indicator system. It analyzes, measures and portrays stakeholder relationships on the basis of standardized indicators. The TRI*M Index is an indicator of the status quo of a particular relationship. The index is made up of four points of view on the stakeholder relationship, e.g. for customer loyalty: overall rating, recommendation, repeat purchasing of product/services, and a company's competitive advantage. The information is based on surveys/interviews on a sample customer base.”

Appendices

Normalised EBITDA Normalised EBITDA higher by 10.1% vs. FY2012
22
In RM mn 4Q13 3Q13 4Q12 FY13 FY12
Reported EBITDA 958.0 906.3 901.8 3,531.6 3,233.3
Non Operational
FX (Gain)/Loss on International trade settlement 0.6 (15.1) (5.1) (13.2) 2.5
Other (Gain)/Losses & Impairment* - 0.2 (1.0) 0.5 (0.7)
Realisation of tax refund related to a previous RM bond - - (38.8) - (38.8)
Normalised EBITDA 958.6 891.4 856.9 3,518.9 3,196.3
Normalised EBITDA Margin 31.8% 33.7% 30.1% 32.7% 31.6%
Reported EBITDA Margin 31.8% 34.3% 31.3% 32.9% 31.8%
EBITDA is calculated as Total Revenue (Operating Revenue + Oth. Operating Income) less Operating Cost (Exc. Depreciation, Amortisation & Impairment). EBITDA Margin is calculated as percentage of EBITDA against Total Revenue Normalised EBITDA Margin is calculated as percentage of Normalised EBITDA against Normalised Total Revenue (Operating Revenue + Oth. Operating Income – Loss on Sale of Assets + Realisation of tax refund related to a previous bond) *Comprise Loss on Sale of Assets and impairment of AFS - receivables

Cost % of Revenue
23
4Q13 3Q13 4Q12 FY13 FY12
Comments (FY2013 vs. FY2012)
Operating Revenue (RM mil) 2,979.8 2,610.5 2,809.3 10,628.7 9,993.5 -
Other Operating Income (RM mil)
35.8 32.5 74.2 121.5 165.4 -
Direct Costs % 17.1 18.4 15.5 17.2 17.0 Higher due to content cost, leased charges and USP cost RM mil. 516.9 485.5 447.4 1,850.3 1,729.7
Manpower % 20.4 20.3 21.0 21.0 19.9 Higher due to salaries and staff benefits RM mil. 614.3 536.7 604.7 2,260.3 2,024.5
Supplies & Materials % 7.0 6.3 6.8 6.4 6.3 Higher due to customer projects
RM mil. 211.9 167.5 195.9 692.8 644.6
Bad & Doubtful Debts % 0.9 0.8 (0.1) 0.8 0.6 Higher due to impairment of trade receivables RM mil. 27.2 21.6 (4.0) 89.9 63.7
Marketing Expenses % 4.2 3.2 3.9 3.7 4.2 Lower A&P activities
RM mil. 125.7 84.4 112.3 394.1 422.3
Maintenance Cost % 8.4 6.5 9.3 7.1 8.5 Lower customer projects at TM Government RM mil. 254.8 172.6 266.9 763.4 860.6
Other Operating Costs % 10.2 10.2 12.4 10.9 11.6 Lower property development cost
RM mil. 306.8 268.4 358.5 1,167.8 1,180.2
Depreciation & Amortisation % 19.2 20.5 17.6 20.1 20.1 Higher absolute cost due to accelerated depreciation of CDMA and USP assets RM mil. 578.8 541.4 508.0 2,159.7 2,046.4
Total (RM mil) 2,636.4 2,278.1 2,489.7 9,378.3 8,972.0 -
Total (%) 87.4 86.2 86.3 87.2 88.3 -

Group Balance Sheet
24
6,894.8
165.2
8,513.7
5,130.2
1,202.6
2,129.4
51.5
-
15,573.7
6,724.7
1,740.9
466.1
3,738.7
779.0
6,622.2
3,545.5
2,010.2
1,066.5
102.5
14,721.7
749.5
15,573.7
As at 31 Dec 2012**
7,136.7
162.6
8,076.7
4,865.0
1,151.0
1,999.5
51.4
9.8
15,376.0
5,722.2
1,847.7
440.9
2,514.9
918.7
5,770.5
3,172.8
1,590.2
1,007.5
(48.3)
14,572.0
852.3
15,376.0
Shareholders’ Funds
Non-Controlling Interests
Deferred & Long Term Liabilities
Long Term Borrowings
Deferred Tax
Deferred Income
Derivative financial liabilities
Long Term Employee Benefit
Current Assets
Trade Receivables
Other Receivables
Cash & Bank Balances
Others
Current Liabilities
Trade and Other Payables
Short Term Borrowings
Others
Net Current (Liabilities)/Assets*
Property Plant & Equipment
Other Non-Current Assets
RM Million As at 31 Dec 2013
*Due to reclassification of long term debt due within the next 12 months to current liability (RM1.5bn) **Restated due to adoption of MFRS 116 in 2013

RETAIL
25
737 730 754 3,010 2,985 392 385 390
1,356 1,546 625 684 706
2,359 2,671
286 156 373
765 808
4Q12 3Q13 4Q13 FY12 FY13
Others
Internet
Data
Voice
RM mn +13.4%
+8.5%
2,207 1,947 2,035
Revenue by Product
7,965 7,454
+6.9%
RM mn
Revenue by Product
182 164 155 719 636
311 307 340
1,048 1,160 22 28 29
91 108
4Q12 3Q13 4Q13 FY12 FY13
Others
Data
Voice
Others : Include internet
Note: Total revenue is after inter-co elimination. Revenue of product is before inter-co elimination
457 442 478
1,649 1,706
+8.1%
+4.6% +3.5%
GLOBAL & WHOLESALE

THANK YOU Any queries please email to : [email protected]
•Investor Relations • Level 11 (South Wing) •Menara TM •JlnPantaiBharu •50672 Kuala Lumpur, Malaysia • Tel (603) 2240 4848/ 7366 / 7388