FY 2012 MFO BUDGET By MFO/By Expense Class · PDF fileFY 2012 MFO BUDGET By MFO/By Expense...
15
FY 2012 MFO BUDGET By MFO/By Expense Class (In Thousand Pesos) Particulars PS MOOE CO Total % Share MFO 1 Public Pre-Elem and Elementary Education Services 126,665,092 11,235,266 13,896,672 151,797,030 66.03% MFO 2 Public Secondary Education Services 54,067,281 5,583,373 7,395,424 67,046,078 29.16% MFO 3 Alternative Learning System 15,740 616,642 102,019 734,401 0.32% MFO 4 Basic Education Sector Management Services 861,295 2,543,428 288,616 3,693,339 1.61% MFO 5 Regulatory and Development Services - 35,025 - 35,025 0.03% MFO 6 Gov’t Assistance to Students & Teachers in Private Education (GASTPE) Services - 6,286,387 6,286,387 2.73% MFO 7 Informal Education Services 82,569 95,691 256,838 0.11% MFO 8 Book Industry Development Services 10,546 11,537 22,083 0.01% TOTAL 181,702,523 26,390,236 21,778,422 229,871,181 100% % Share 79.05% 11.48% 9.47% 100% By MFO (Total Budget =, P229,871,181,000)* *Includes DepEd – Educatiional Facilities Fund MFO 1 66.03% MFO 2 29.16% MFO 3 0.32% MFO 4 1.61% MFO 5 0.03% MFO 6 2.73% MFO 7 0.11% MFO 8 0.01%
Transcript of FY 2012 MFO BUDGET By MFO/By Expense Class · PDF fileFY 2012 MFO BUDGET By MFO/By Expense...

FY 2012 MFO BUDGET
By MFO/By Expense Class (In Thousand Pesos)
Particulars PS MOOE CO Total % Share
MFO 1 Public Pre-Elem and Elementary Education Services
126,665,092
11,235,266
13,896,672
151,797,030
66.03%
MFO 2 Public Secondary Education Services
54,067,281
5,583,373
7,395,424
67,046,078
29.16%
MFO 3 Alternative Learning System
15,740
616,642
102,019
734,401
0.32%
MFO 4 Basic Education Sector Management Services
861,295
2,543,428
288,616
3,693,339
1.61%
MFO 5 Regulatory and Development Services
-
35,025
-
35,025
0.03%
MFO 6 Gov’t Assistance to Students & Teachers in Private Education (GASTPE) Services
-
6,286,387
6,286,387
2.73%
MFO 7 Informal Education Services
82,569
95,691
256,838
0.11%
MFO 8 Book Industry Development Services
10,546
11,537
22,083
0.01%
TOTAL 181,702,523 26,390,236 21,778,422 229,871,181 100%
% Share 79.05% 11.48% 9.47% 100%
By MFO
(Total Budget =, P229,871,181,000)*
*Includes DepEd – Educatiional Facilities Fund
MFO 1 66.03%
MFO 2 29.16%
MFO 3 0.32%
MFO 4 1.61%
MFO 5 0.03%
MFO 6 2.73%
MFO 7 0.11%
MFO 8 0.01%
By Agency/By MFO (In Thousand Pesos)
Particulars
MFO1 MFO2 MFO3 MFO4 MFO5 MFO6 MFO7 MFO8 Total % share Public Pre-
Elem & Elem Educ.
Services
Pubic Secondary Education Services
Alternative Learning System Services
Basic Education
Sector Management
Services
Regulatory & Dev’t
Services
GASTPE Services
Informal Education Services
Book Industry
Development Services
National Book Development Board
22,083
22,083
0.011%
National Council for Children’s Television
6,605
6,605
0.003%
National Mesuem 244,666 244,666 0.067
Philippine HS for the Arts
53,970
5,567
59,537
0.023%
OSEC 151,797,030 66,992,108 734,401 3,693,339 35,025 6,286,387 - - 229,538,290 99.896%
Total 151,797,030 67,046,078 734,401 3,693,339 35,025 6,286,387 256,838 22,083 229,871,181 100%
% Share 66.04% 29.17% 0.32% 1.61% 0.03% 2.73% 0.11% 0.01% 100.00%
By Agency/By Expense Class (In Thousand Pesos)
Particulars PS MOOE CO TOTAL % SHARE
National Book Development Board 10,546 11,537 - 22,083 0.010%
National Council for Children’s Television 2,021 4,384 200 6,605 0.003%
National Mesum 78,053 71,122 95,491 244,666 0.106%
Philippine High School for the Arts 12,473 45,864 1,200 59,537 0.026%
DepEd – OSEC 181,599,430 26,257,329 21,681,531 229,538,290 99.854%
TOTAL 181,702,523 26,390,236 21,778,422 229,871,181 100.00%
% Share 79.05% 11.48% 9.47% 100.00%
By Expense Class (Total Budget = P 229,871,181)*
*Indicated DepEd – Educational Facilities Fund
PS 79.05%
MOOE 11.48%
CO 9.47%
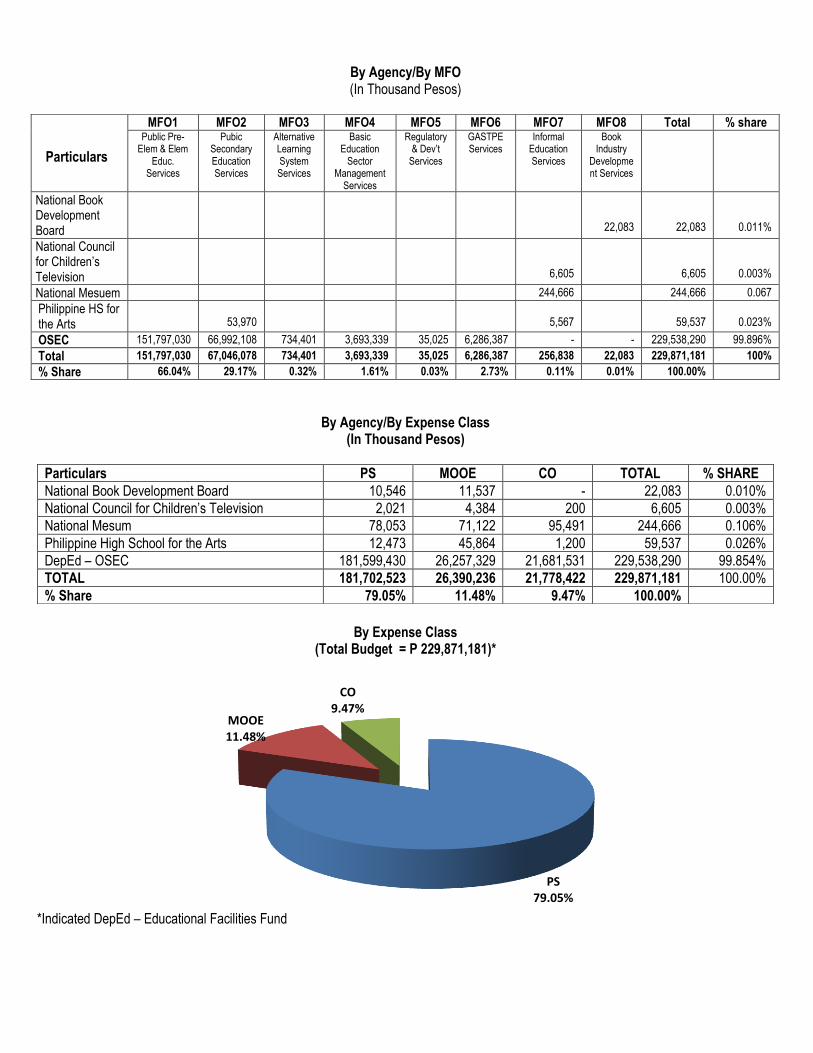
Department of Education – Office of the Secretary PERFORMANCE MEASURES AND TARGETS
(Amounts in Thousand Pesos)
Particulars FY 2010 FY 2011 FY 2012
Target/ Amount
Actual/ Amount
Target/ Amount
Target/ Amount
MFO 1 Public Pre-Elementary and Elementary Education Services Public Pre-Elementary and Elementary Education Services
Enrolment in DepEd & DepEd-contracted pre-schools
Enroment in Summer Preschool
No. of public pre-school completers
No. Of public pre-school children who passed Grade 1 (G1) readiness test administered
% of underweight preschool children Public Elementary Education Services
Enrolment in public elementary schools
Participation rate
Completion rate
MPS of Grade 3 readers English Filipino
MPS in NAT, Grade 6 Total Test English Science Math Filipino HeKaSi
% of underweight children to the total no. Of G1-G6 enrolees
115,079,554
126,661,605
136,206,724
151,797,030
2,320,000 1,580,000
740,000 1,472,500
740,816
13.00%
13,607,517 79.65% 72.76%
64.91% 68.92%
71.21 70.51 66.24 67.15 77.50 74.67
16.00%
1,726,079 1,224,475
501,604 1,093,639 1,047,591
16.23%
13,003,238 82.11% 70.74%
56.13% 62.06%
69.51 65.98 61.77 70.59 77.00 72.23
15.54%
1,808,464 1,308,464
500,000 1,808,464 1,446,771
14,251,498 82.43% 75.16%
67.91% 73.92%
73.21 72.51 68.24 69.15 79.50 76.67
16.00%
1,711,683 1,386,683
325,000 1,711,683 1,369,346
6.70%
14,196,864 84.27% 76.83%
70.91% 76.92%
75.21 74.51 70.24 71.15 81.50 78.67 15%
MFO 2 Public Secondary Education Services
Enrolment in public secondary schools
Participation rate
Completion rate
MPS in NAT of Year II (Y-II) students in public secondary schools
Total Test English Science Math Filipino Araling Panlipunan
MPs in National Career Assessment Exam (NCAE) of Year IV (Y-IV) students in public secondary schools
Gen. Scholastic Aptitude Tech. Voc. Aptitude Non-Verbal Ability Enterpreneurial Skills
51,132,003
52,950,608
59,079,123
66,992,109
5,600,228
50.00% 78.46%
50.80 55.00 46.00 43.00 60.00 50.00
50.00 60.00 50.00 80.00
5,530,431
48.11% 71.16%
48.78 46.12 40.82 43.51 58.66 53.72
42.57 66.62 62.18 50.98
5,690,901
51.98% 72.19%
55.60 57.00 48.00 48.00 65.00 60.00
50.00 68.00 54.00 89.00
5,846,681
55.40% 74.48%
58.00 60.00 50.00 50.00 67.00 62.00
54.00 70.00 56.00 93.00

Particulars FY 2010 FY 2011 FY 2012
Target/ Amount
Actual/ Amount
Target/ Amount
Target/ Amount
MFO 3 Alternative Learning System (ALS) Services
Ratio of completers to total no. of learners in DepEd-delivered ALS programs
Ratio of completers to total no. of learners in DepEd-procured ALS progams
Ratio of test passers to total no. of test takers of Accreditation and Equivalency (A& E) Test
468,627
443,188
452,079
734,400
75:100
75:100
22:100
76:100
76:100
22:100
75:100
75:100
22:100
75:100
75:100
22:100
MFO 4 Basic Education Sector Management Services
No. of policies to be reviewed, assessed and formulated for the current year
% of basic education sector policies and standards adopted by Teacher Education Council (TEC), TESDA, CHED, PRC adn Civil Service Commission to total no. of policies for formulated
4,095,879
6,781,622
4,450,560
3,693,339
16
60%
16
60%
16
65%
16
70%
MFO 5 Regulatory and Development Services
Ratio of private elementary schools with permit to operate to the total number of private elementary schools
27,700
49,754
19,100
35,025
MFO 6 Government Assistance to Students and Teachers in Private Education (GASTPE) Services
Ratio of Education Service Contracting (ESC) completers to ESC grantees
Ratio of Education Voucher System (EVS) completers to EVS grantees
MPS in NCAE ESC grantees
EVS grantees
3,939,560
3,985,940
5,829,884
6,286,387
100:100
100:100
43.00 42.00
78:100
76:100
45.20 44.40
100:100
100:100
46.00 43.00
100:00
100:00
47:00
TOTAL 174,743,323 190,872,717 206,037,470 229,538,290
Note: No explanation/justification submitted for variances

FY 2012 MFO BUDGET
By MFO/By Expense Class (In Thousand Pesos)
Particulars PS MOOE CO TOTAL % Share MFO 1 Public Pre-Elementary and Elementary Education Services MFO 2 Public Secondary Education Services MFO 3 Alternative Learning System (ALS) Services MFO 4 Basic Education Sector Management Services MFO 5 Regulatory and Development Services MFO 6 Government Assistance to Students and Teachers in Private Education (GASTPE) Services
126,665,092
54,057,303
15,740
861,295
-
-
11,235,266
5,540,581
616,642
2,543,428
35,025
6,286,387
13,896,672
7,394,224
102,019
288,616
-
151,797,030
66,992,108
734,401
3,693,339
35,025
6,286,387
66.12%
29.19%
0.32%
1.61%
0.02%
2.74%
TOTAL 181,599,430 26,257,329 21,681,531 229,538,290* 100.00% % Share 79.11% 11.44% 9.45% 100.00%
*Including Specila Purpose Fund-DepEd School Building Program, and RLIP
By MFO (Total Budget = P 207,057,195,000)
By Expense Class (Total Budget = 207,057,195,000)
MFO 1 66.12%
MFO 2 29.19%
MFO 3 0.32%
MFO 4 1.61%
MFO 5 0.02%
MFO 6 2.74%
PS 30.60%
MOOE 66.37%
CO 3.03%
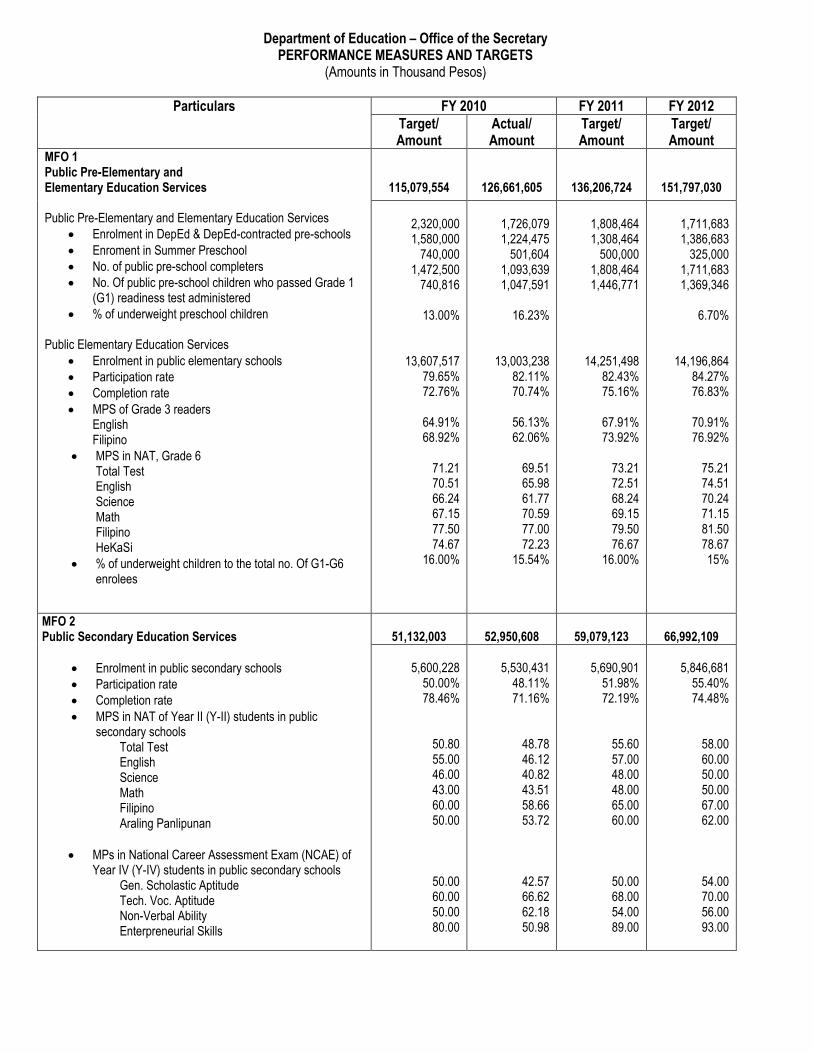
National Book Development Board
PERFROMANCE MEASURES AND TARGETS (Amounts in Thousand Pesos)
Particulars 2010 2011 2012
Target/ Amount
Actual/ Amount
Target/ Amount
Target/ Amount
MFO 1 Capability Building Services Seminars on the latest printing/publishing technologies
Number of seminars/training courses conductes Number of participants to seminars/training courses
Seminars for Authors, Translators, Illustrators, Publishers Number of seminars/training courses conducted Number of participants to seminars/training courses
Story telling Skills Development Program Number of seminars/training courses conducted Number of participants to seminars/training courses
Updating/Rewriting of the national Book Development Plan Number of consultations conducted Number of sectors which participated
2,522
4,472
4,264
3,456
2
30
2 30
5
30
1 9
3 1/
100 1/
2 100 2/
3 3/
30
3 4/
9
2
30
2 30
5
30 - -
2
30
2 30
5
30 - -
MFO 2 Investment Promotion and Market Development Services Intellectual Property Rights Education for Industry Stakeholders
Number of seminars on Intellectual Property Rights Number of participants
Conduct of Philippine Book Development Month through Festival, Lecture, Workshop, Literary Performances, and other events
Number of activities/events conducted Number of participants per activity
9,321
13,622
13,622
13,251
9 50
6 40
9 50
19 5/
100 5/
5 20
6 40
5 20
5 40
Notes: 1/ demand for an additional seminar 2/ increase in interested stakeholders 3/ had difficulty in finding partners to financially support the undertaking 4/ need for follow-up discussions on current issues 5/ topics broken down into several sub-topics resulting to several events
Particulars 2010 2011 2012
Target/ Amount
Actual/ Amount
Target/ Amount
Actual/ Amount
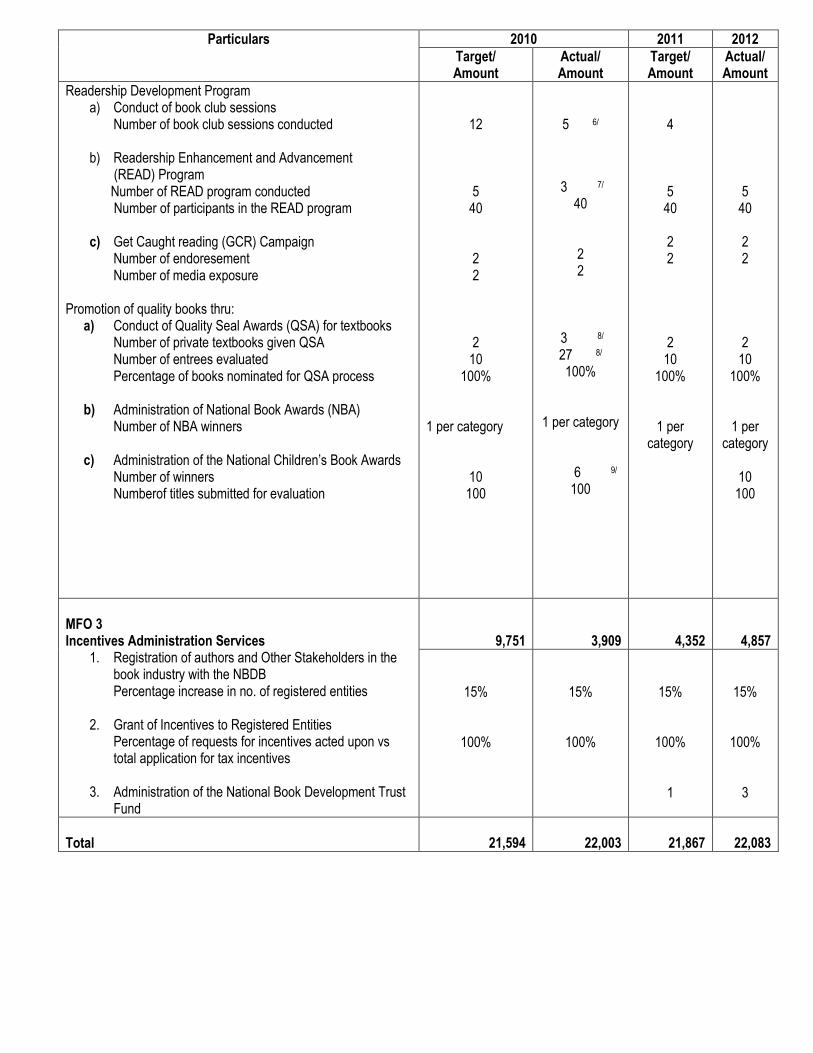
Readership Development Program a) Conduct of book club sessions
Number of book club sessions conducted
b) Readership Enhancement and Advancement (READ) Program Number of READ program conducted Number of participants in the READ program
c) Get Caught reading (GCR) Campaign Number of endoresement Number of media exposure
Promotion of quality books thru: a) Conduct of Quality Seal Awards (QSA) for textbooks
Number of private textbooks given QSA Number of entrees evaluated Percentage of books nominated for QSA process
b) Administration of National Book Awards (NBA) Number of NBA winners
c) Administration of the National Children’s Book Awards Number of winners Numberof titles submitted for evaluation
12
5 40
2 2
2 10
100%
1 per category
10 100
5 6/
3 7/
40
2 2
3 8/
27 8/
100%
1 per category
6 9/
100
4
5 40
2 2
2 10
100%
1 per category
5 40
2 2
2 10
100%
1 per category
10
100
MFO 3 Incentives Administration Services
1. Registration of authors and Other Stakeholders in the book industry with the NBDB Percentage increase in no. of registered entities
2. Grant of Incentives to Registered Entities Percentage of requests for incentives acted upon vs total application for tax incentives
3. Administration of the National Book Development Trust Fund
9,751
3,909
4,352
4,857
15%
100%
15%
100%
15%
100%
1
15%
100%
3
Total
21,594
22,003
21,867
22,083

FY 2012 MFO BUDGET
By MFO/By Expenses Class (In Thousand Pesos)
Particulars PS MOOE CO Total % Share
MFO 1 Capability Buidling Services
1,554
1,902
0
3,456
15.65%
MFO 2 Investment Promotion and Market Development Services
4,984
8,786
0
13,770
62.36%
MFO 3 Incentives Administration Services
4,008
849
4,857
21.99%
Total
10,546
11,537
0
22,083
100.00%
Share
47.76%
52.24%
0.00%
100.00%
By MFO
(Total Budget = 22,803,000)
By Expense Class (Total Budget = 22,803,000)
MFO 1 21.39%
MFO 2 9.67%
MFO 3 68.93%
PS 47.76%
MOOE 52.24%

National Council for Children’s Television PERFORMANCE MEASURES AND TARGETS
(Amounts in Thousand Pesos)
Particulars FY 2010 FY 2011 FY 2012
Target/ Amount
Actual/ Amount
Target/ Amount
Target/ Amount
MFO1 Policy Formulation and Implementation, Standard Setting, Plan Development and Research Activities and Orientation Services No. of policies formulated No. of workshop conducted No. of conferences conducted No. of advocacy collateral produced
No. of newslatter published No. of website hits No. of infomercial airing No. of IEC materials published and disseminated
14,805
1 33 2
4 1800 200
3
10,608
0 1/ 34
4 2/
4
332 3/ 230 4/ 2 5/
6,343
1 26 5
4 2000 300 4
6,605
1 24 5
4 2000 330 4
Total 14,805 10,608 6,343 6,605 Notes: 1/ Policy formulation on-going 2/ Requested follow-up conferences by the stakeholders 3/ Social Media Plan not yet implemented 4/ Free slots were given for airing 5/ Combined 2 materials into 1

FY 2012 MFO Budget
By MFO/By Expense Class (In thousand pesos)
Particulars PS MOOE CO Total % Share
MFO1 Policy Formulation and Implementation, Standard Setting, Plan Development and Research Activities and Orientation Services
2,021
4,384
200
6,605
100.00%
Total 2,021 4,384 200 6,605 100.00%
% Share 30.60% 66.37% 3.03% 100.00%
By Expense Class (Total Budget = P 6,605,000)
PS 30.60%
MOOE 66.37%
CO 3.03%
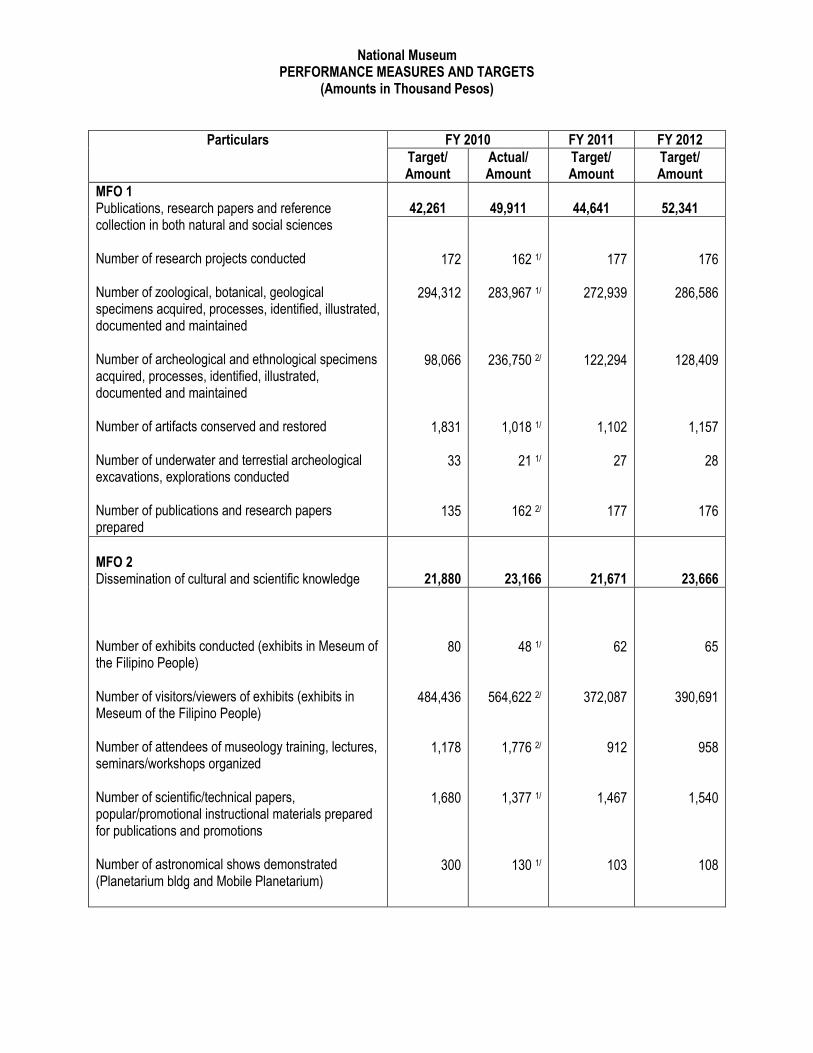
National Museum
PERFORMANCE MEASURES AND TARGETS (Amounts in Thousand Pesos)
Particulars FY 2010 FY 2011 FY 2012
Target/ Amount
Actual/ Amount
Target/ Amount
Target/ Amount
MFO 1 Publications, research papers and reference collection in both natural and social sciences Number of research projects conducted Number of zoological, botanical, geological specimens acquired, processes, identified, illustrated, documented and maintained Number of archeological and ethnological specimens acquired, processes, identified, illustrated, documented and maintained Number of artifacts conserved and restored Number of underwater and terrestial archeological excavations, explorations conducted Number of publications and research papers prepared
42,261
49,911
44,641
52,341
172
294,312
98,066
1,831
33
135
162 1/
283,967 1/
236,750 2/
1,018 1/
21 1/
162 2/
177
272,939
122,294
1,102
27
177
176
286,586
128,409
1,157
28
176
MFO 2 Dissemination of cultural and scientific knowledge Number of exhibits conducted (exhibits in Meseum of the Filipino People) Number of visitors/viewers of exhibits (exhibits in Meseum of the Filipino People) Number of attendees of museology training, lectures, seminars/workshops organized Number of scientific/technical papers, popular/promotional instructional materials prepared for publications and promotions Number of astronomical shows demonstrated (Planetarium bldg and Mobile Planetarium)
21,880
23,166
21,671
23,666
80
484,436
1,178
1,680
300
48 1/
564,622 2/
1,776 2/
1,377 1/
130 1/
62
372,087
912
1,467
103
65
390,691
958
1,540
108
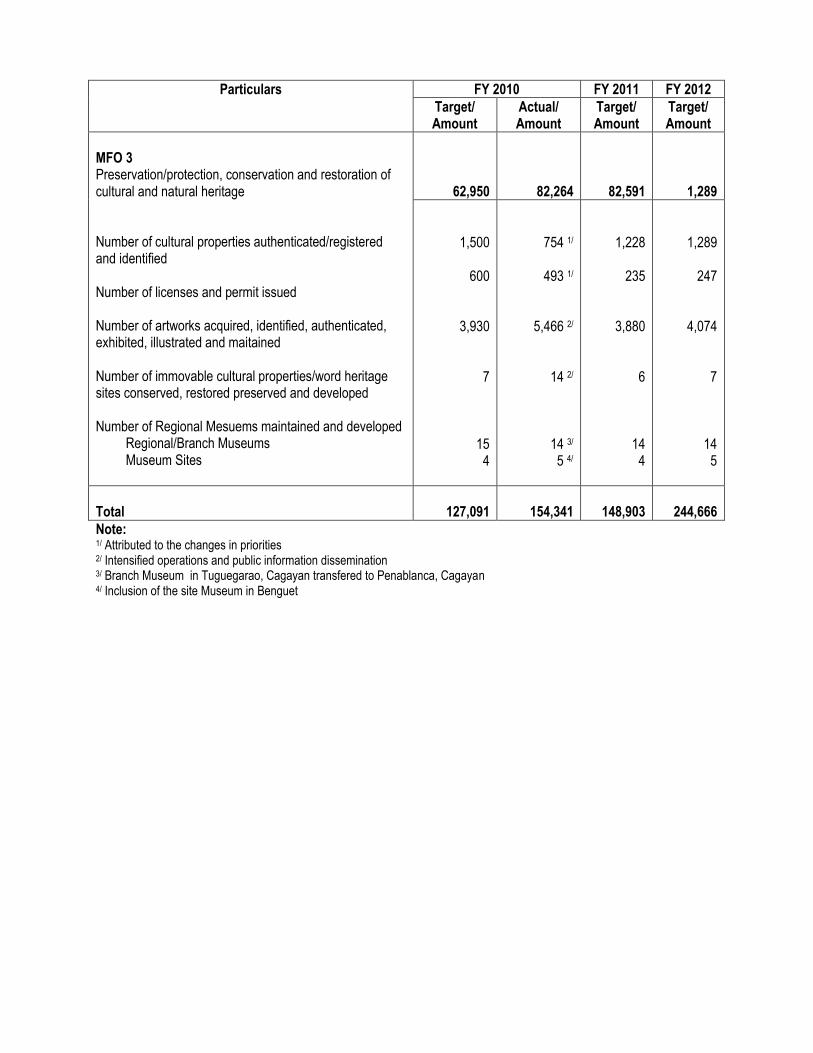
Particulars FY 2010 FY 2011 FY 2012
Target/ Amount
Actual/ Amount
Target/ Amount
Target/ Amount
MFO 3 Preservation/protection, conservation and restoration of cultural and natural heritage Number of cultural properties authenticated/registered and identified Number of licenses and permit issued Number of artworks acquired, identified, authenticated, exhibited, illustrated and maitained Number of immovable cultural properties/word heritage sites conserved, restored preserved and developed Number of Regional Mesuems maintained and developed
Regional/Branch Museums Museum Sites
62,950
82,264
82,591
1,289
1,500
600
3,930
7
15 4
754 1/
493 1/
5,466 2/
14 2/
14 3/ 5 4/
1,228
235
3,880
6
14 4
1,289
247
4,074
7
14 5
Total
127,091
154,341
148,903
244,666
Note: 1/ Attributed to the changes in priorities 2/ Intensified operations and public information dissemination 3/ Branch Museum in Tuguegarao, Cagayan transfered to Penablanca, Cagayan 4/ Inclusion of the site Museum in Benguet
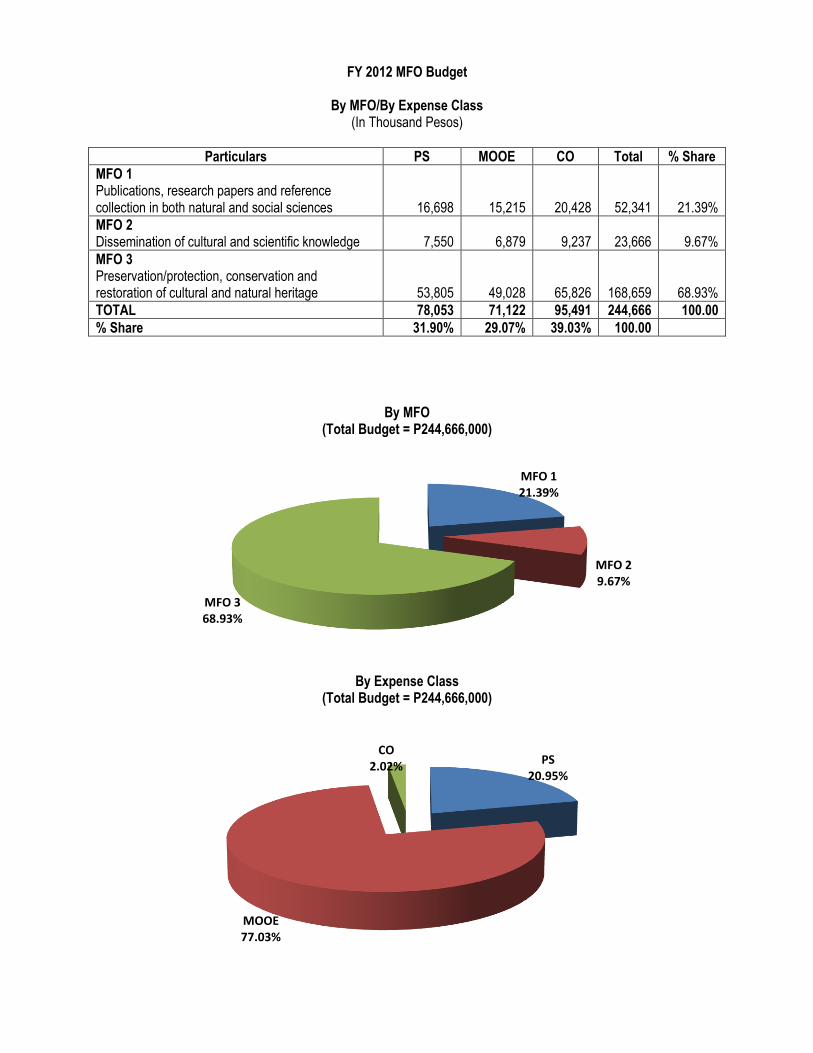
FY 2012 MFO Budget
By MFO/By Expense Class (In Thousand Pesos)
Particulars PS MOOE CO Total % Share
MFO 1 Publications, research papers and reference collection in both natural and social sciences
16,698
15,215
20,428
52,341
21.39%
MFO 2 Dissemination of cultural and scientific knowledge
7,550
6,879
9,237
23,666
9.67%
MFO 3 Preservation/protection, conservation and restoration of cultural and natural heritage
53,805
49,028
65,826
168,659
68.93%
TOTAL 78,053 71,122 95,491 244,666 100.00
% Share 31.90% 29.07% 39.03% 100.00
By MFO (Total Budget = P244,666,000)
By Expense Class (Total Budget = P244,666,000)
MFO 1 21.39%
MFO 2 9.67%
MFO 3 68.93%
PS 20.95%
MOOE 77.03%
CO 2.02%

Philippine High School for the Arts PERFORMANCE MEASURES AND TARGETS
(Amounts in Thousand Pesos)
Particulars 2010 2011 2012
Actual/ Amount
Target/ Amount
Target/ Amount
Target/ Amount
MFO 1 Special Public Secondary Education Services Oriented to the Arts
Number of applicants received for assessment Number of applicants screened and identified for scholarship Mean percentage performance in Center for Education
Measurement accross levels Mean percentage score in the National achievement Test
(NAT) Mean percentage Score in National Career Assessment
Exam (NCAE)
47,713
41,292
51,557
53,970
1,100 50
85%
61%
90%
901 1/ 53 2/ 85%
54% 3/
95% 3/
1,000 32
85%
61%
90%
1,100 30
85%
50%
90%
MFO 2 Cultural Conservation and Promotion Services
Number of research-based artworks published, staged and/or exhibited
Number of schools assisted in initiating own and/or maintaining existing Special Arts Programs
Number of persons attending cultural activities Outside PHSA Within PHSA
10,991
4,878
4,878
5,567
20
10
5,300
32 4/
10
5,076 1/
25
10
6,000
27
12
6,500
Total 58,704 58,704 56,435 59,537
By 2012 MFO Budget
By MFO/By Expense Class (In Thousand Pesos)
Particulars PS MOOE CO Total % Share
MFO 1 Special public secondary education services oriented to the arts
9,978
42,792
1,200
53,970
90.65%
MFO 2 Cultural conseravtion and promotion services
2,495
3,072
-
5,567
9.35%
Total
12,473
45,864
1,200
59,537
100.00%
% Share
20.95%
77,03%
2.02%
100.00%
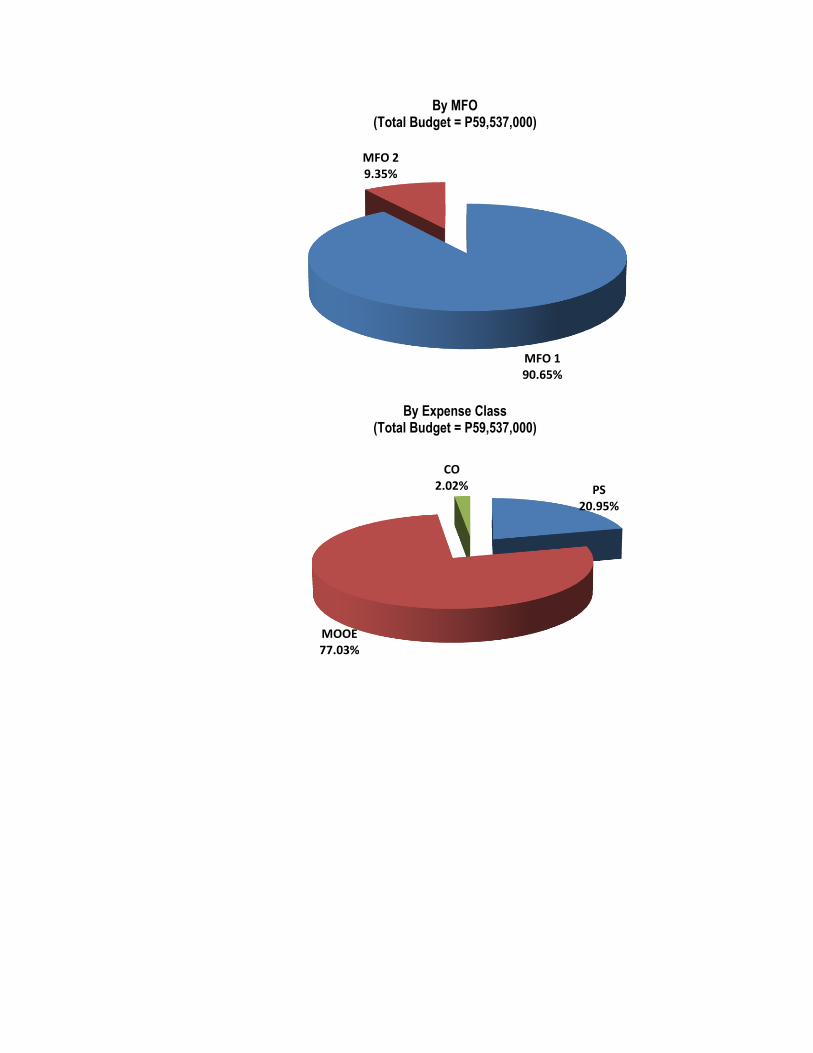
By MFO (Total Budget = P59,537,000)
By Expense Class (Total Budget = P59,537,000)
MFO 1 90.65%
MFO 2 9.35%
PS 20.95%
MOOE 77.03%
CO 2.02%


![· Gift]Awards/MemoriaIs Expense Legal Services Food/Beverage Expense Polling Expense Printing Expense Salaries/Wages/Contract Labor Solicitation/Fundraising Expense](https://static.fdocuments.us/doc/165x107/5c5ef74209d3f2515c8cf3a9/-giftawardsmemoriais-expense-legal-services-foodbeverage-expense-polling-expense.jpg)