Fuzzy Approach to Detection of Emergent Herd Formations in Multi
15
Fuzzy Approach to Detection of Emergent Herd Formations in Multi-Agent Simulation Ognen Paunovski 1 , George Eleftherakis 2 , and Tony Cowling 3 1 South East European Research Centre (SEERC), 17, Mitropoleos str., 54624 Thessaloniki, Greece [email protected] 2 City College, 13, Tsimiski str., 54624 Thessaloniki, Greece [email protected] 3 University of Sheffield, Regent Court, 211 Portobello str., Sheffield, S1 4DP. UK. [email protected] Abstract. In recent years multi-agent modelling and simulation has been suggested as an approach to exploring emergent phenomena exhib- ited by a variety of systems. A vital part of such an effort is the abil- ity to detect and quantify the particular emergent manifestation under study. As part of a larger study in exploring causal relations in emer- gent formations, this paper investigates the issue of automated detection of herds in a multi-agent model of large bodied animal dynamics. The proposed solution is based on a fuzzy reasoning approach which incorpo- rates bottom-up and top-down phases as part of the reasoning process. The evaluation of the proposed reasoning method showed that it can be successfully applied for automated detection of herds in multi-agent simulation. 1 Introduction Group formation is a common characteristic for many social animals. Shaw [1] examined the grouping in fish, where numerous individuals form a social aggre- gation known as a school. Similar aggregations can be found in birds forming flocks [2], as well as various species of mammals which form herds [3]. Most observations made towards understanding the herd dynamics suggest that both small and large groups rely on local coordination between the individuals to form a herd [4]. Close examination of the behaviour of an individual animal does not suggest that it will join a herd, thus the herd is a novel pattern with respect to the individual animals which comprise it. In addition the herd has functional significance: it decreases the risk of predators and increases the possibility for mating [5]. Therefore given the introduction of novelty and the functional sig- nificance, one could argue that the herd is an emergent phenomenon. The basic idea behind emergence was popularized by Anderson in [6], where he elaborated how global features may arise (emerge) as a property of a system and at the same time be novel to the constitutive components of the system. Emergence can be identified in a variety of systems and processes: from chemical reactions and large scale swarms of social insects to weather patterns and the
Transcript of Fuzzy Approach to Detection of Emergent Herd Formations in Multi

Fuzzy Approach to Detection of Emergent Herd
Formations in Multi-Agent Simulation
Ognen Paunovski1, George Eleftherakis2, and Tony Cowling3
1 South East European Research Centre (SEERC), 17, Mitropoleos str., 54624Thessaloniki, Greece [email protected]
2 City College, 13, Tsimiski str., 54624 Thessaloniki, [email protected]
3 University of Sheffield, Regent Court, 211 Portobello str., Sheffield, S1 4DP. [email protected]
Abstract. In recent years multi-agent modelling and simulation hasbeen suggested as an approach to exploring emergent phenomena exhib-ited by a variety of systems. A vital part of such an effort is the abil-ity to detect and quantify the particular emergent manifestation understudy. As part of a larger study in exploring causal relations in emer-gent formations, this paper investigates the issue of automated detectionof herds in a multi-agent model of large bodied animal dynamics. Theproposed solution is based on a fuzzy reasoning approach which incorpo-rates bottom-up and top-down phases as part of the reasoning process.The evaluation of the proposed reasoning method showed that it canbe successfully applied for automated detection of herds in multi-agentsimulation.
1 Introduction
Group formation is a common characteristic for many social animals. Shaw [1]examined the grouping in fish, where numerous individuals form a social aggre-gation known as a school. Similar aggregations can be found in birds formingflocks [2], as well as various species of mammals which form herds [3]. Mostobservations made towards understanding the herd dynamics suggest that bothsmall and large groups rely on local coordination between the individuals to forma herd [4]. Close examination of the behaviour of an individual animal does notsuggest that it will join a herd, thus the herd is a novel pattern with respectto the individual animals which comprise it. In addition the herd has functionalsignificance: it decreases the risk of predators and increases the possibility formating [5]. Therefore given the introduction of novelty and the functional sig-nificance, one could argue that the herd is an emergent phenomenon.
The basic idea behind emergence was popularized by Anderson in [6], wherehe elaborated how global features may arise (emerge) as a property of a systemand at the same time be novel to the constitutive components of the system.Emergence can be identified in a variety of systems and processes: from chemicalreactions and large scale swarms of social insects to weather patterns and the

inner workings of the human brain. In addition emergence is associated withsocial phenomena like culture, patterns in the news, fashion cycles, stock mar-ket exchange crashes and so on. Due to its ubiquity and versatility, the conceptof emergence has captured considerable attention in the scientific community.There has been a variety of attempts in different scientific disciplines to ob-serve, predict, control and understand emergent phenomena. Nevertheless dueto its intrinsic complexity and unpredictability, emergence is still a scientific un-known. Therefore in recent years, multi-agent systems have been proposed asan approach which could shed light in the process of exploring emergence. Themain idea is to use iterative agent-oriented modelling and simulation in order togradually increase the understanding of a specific emergent manifestation.
In this context the work presented in this paper is a part of a larger effort [7]aimed at the exploration of causal relations between the micro and macro levels,taking herd formation as a particular example. However in order to correlatethe emergent behaviour at the macro level with events taking place at the microlevel in this example there is a need for a mechanism which would be able toautomatically detect groups of animals forming herds. Towards this end we ex-amine different pattern recognition techniques with respect to the requirementsand constraints imposed in the study, and we develop a solution to the prob-lem by incorporating both bottom-up and top-down phases as part of a fuzzyreasoning algorithm.
The rest of the paper is structured as follows. Section 2 discusses severalissues related to pattern recognition and their relevance to herd detection. Thesimulation model is presented in section 3, while section 4 presents the design ofthe proposed fuzzy reasoning mechanism. The performance and the evaluationof the proposed solution is discussed in section 5. Finally section 6 concludes thepaper with a brief summary and discussion on the future work.
2 Identification of Herd Formations
Humans can easily detect herds, however teaching a machine to do so is not assimple. The main problem is the inability to arrive at a formally quantifiabledefinition of a herd which will be generally accepted in different contexts byall possible observers. Nevertheless the field of pattern recognition in the lasthalf a century has come a long way in addressing problems such as this one.The sections that follow contain a brief overview of pattern recognition withemphasis on clustering through statistical analysis. In addition, the applicabilityof different techniques is discussed in relation to the requirements and constraintsimposed by the objectives of our study.
2.1 Overview of different approaches to pattern recognition
In Watanabe’s view [8], a pattern is an entity, possibly vaguely defined, that canbe distinguished from the chaos. Consequently pattern recognition is essentially aclassification (clustering) process. The methods dealing with the identification of

patterns can be divided into two main categories: supervised and unsupervisedpattern recognition. The supervised methods rely on a predefined (described)set of classes, or already existing set of patterns, which have been classifiedprior to the recognition process. On the other hand an unsupervised recognitionmethod does not utilize any a priori classification data and establishes the set ofclasses during the recognition process. According to Jain et al. [9] there are fourbasic approaches in pattern recognition: template matching, syntactic matching,neural networks and statistical analysis.
Template matching is essentially a procedure where a pattern is comparedagainst a prototype (template) pattern which should be available prior to therecognition process. Although template matching algorithms can allow certaindeviations in the pattern from the prototype, they are not suitable for recognizingmore substantial variations in the patterns. This is in fact the main problem inapplying this approach to herd detection, since the herd pattern exhibits widevariation in shape, size and density.
Syntactic approaches on the other hand rely on a primitive sets of sub-patterns and a set of rules which define how to compose (or decompose) morecomplex patterns. While this approach is very useful in language recognition, incomplex problem domains it requires extremely large training set and computa-tional power [10]. This approach is also not suitable for herd detection becauseit is impossible to define a limited set of sub-patterns or clear composition rules.
Neural networks offer a rather different approach to pattern recognition. Theyadopt ideas from biological systems in order to resolve complex non-linear prob-lems. This is achieved through a learning process in which the architecture andthe connections between the neurons are updated in order to perform a spe-cific classification task. The main advantage of this approach is efficient andsuccessful classification/clustering of patterns regardless of the problem domain.Therefore given a well established training set, a neural network could be suc-cessfully applied to herd detection. However this approach is unsuitable for thepurpose of this study, since a neural network does not provide any informationon the reasoning process or statistical data on the decision, as suggested in [11].
The opposite is true in statistical analysis for pattern recognition. The recog-nition methods following this approach conceptualize a “pattern” in terms ofmultidimensional spatial measures representing the features of an entity to beclassified. Consequently the goal in the recognition process is to cluster similarentities together by creating disjoint compact groups [9]. This is the most appro-priate approach for addressing the herd recognition problem. Different statisticalclustering algorithms are described in more detail in the next section.
2.2 Herd detection as a statistical clustering problem
A general division of the clustering algorithms based on statistical analysis elabo-rated in [12] suggests four main classes: partitioning methods, hierarchical meth-ods, density based methods and grid based methods. Partitioning algorithms,like k-means (also known as HCM) [13, 14] and EM clustering algorithm [15],cluster the object set for k input parameters into k clusters in such manner as to

minimize the cluster distribution based on a selected mean point. An interestingapproach is followed in the EM clustering algorithm where, instead of assigningeach object to a cluster, a probabilistic membership is computed based on thedistance of the object from the mean point. However this method, as well as therest of these partitioning methods, tends to find clusters of spherical shape withsimilar size, which do not necessarily represent correctly the natural distributionof objects [13].
Unlike the partitioning methods, the hierarchical methods, like AGNES andDIANA [16], CHAMELEON [17], are based on hierarchical (tree like) decom-position of the object set into smaller sub-sets. While this process is clearly atop-down approach, hierarchical methods can also be applied in a bottom-upway (also called “agglomerative”) by starting with each object as a separategroup and joining them during the clustering process. The algorithms followingthis clustering approach do not fall into the same trap as partitioning methods,but they tend to make errors in the assignment of objects to clusters, usuallydue to the over-simplistic splitting and merging techniques.
By contrast with the previous methods, the density methods are specificallydesigned to avoid spherical shape clustering and are best suited to discoveringarbitrary shaped clusters. This is achieved by treating a cluster as a dense re-gion of objects. The most famous algorithms in this class are DBSCAN [18] andOPTICS [19]. The major problem of density based methods is a significantlylower efficiency especially in the cases when multiple parameters are taken intoaccount. To resolve this problem grid based methods quantize the space into afinite number of cells, forming a grid structure where the clustering operationsare performed. The most famous algorithms in this class are STING [20] andCLIQUE [21]. While these methods perform quite efficiently (in terms of clus-tering speed and time) they tend to be increasingly error prone with the increasein the number of clustering parameters.
In addition to the discussed approaches, some methods combine classicalclustering algorithms with fuzzy set theory. Perhaps the most famous and mostheavily studied fuzzy clustering algorithm is fuzzy c-means (FCM ) [22], basedon the k-means partitioning algorithm. The main idea followed in FCM andsimilar approaches is that a single entity can belong to more than one cluster.Thus it avoids assigning a particular entity to a single cluster, but rather definesa membership level of the entity to a particular cluster. This approach is par-ticularly useful in problem domains where the boundary between the clusterscannot be clearly determined, like in the case of biochemical analysis of cancercells [23]. More recent development in the utilization of fuzzy rule based systemsfor the purpose of data clustering has been done in combination with neural net-works. The synthesis of the two approaches has led to the creation of neurofuzzysystems which manage to add readability to the operation of a neural network.For more information on neurofuzzy systems consult [24, 25].
According to Han et al. [12], the selection of an appropriate clustering algo-rithm depends on several factors including application goals, trade-off betweenquality and speed and characteristics of the data. Here it has to be noted that
herd formation is a special case in the more general context of the study, henceit imposes several requirements for the clustering process:
– it should be done continuously during the model execution, utilizing as lesstime as possible (preferable maximum around 2 seconds), in order to give tothe investigator “real time” visualisation about the model dynamics;
– it should avoid circular shapes and focus on discovery of arbitrary shapes;– it should process a wide range of densities;– it needs to evaluate the state of the cluster in relation to a “desired state”
defined by the observer (examined in more details in section 2.3).
Given these requirements none of the reviewed spatial data-mining algo-rithms was found to fulfil completely the requirements. Consequently we movedtowards the development of a hybrid approach by incorporating ideas from thedata-mining algorithms with other practices in order to match the imposed re-quirements. The result was a two-way fuzzy reasoning classification algorithmwhich is described in the next section.
2.3 The role of the observer in detecting herd formations
The emergent behaviour relies on stochastic runtime interactions between theelementary components of the system. The process and effects of emergence canonly be observed during system’s operation (at runtime) and therefore can notbe captured with a model of the system. This creates a fundamental difficulty indevising a criteria or metric for identifying and quantifying emergent formation.Thus the identification of an emergent property or pattern is open to differentinterpretations. Consequently one can argue that identifying an emergent forma-tion is significantly influenced by the nature of the observer, their capabilities,knowledge and judgement.
This argument also applies in the case of herd detection. On the one hand,herds with strong coherence or extremely loose configurations (which do not forma herd) are immediately distinguishable and clearly identified by most observers.On the other hand, aggregations on the border between an actual herd and asimple collection of single animals are difficult to judge. Thus different observerscan have different views whether the same aggregation of animals forms a herd ornot. Thus it can be argued that the judgement of the observer directly influencesthe criteria for detection of herd formations. This is in fact the main reason whythe herd recognition algorithm needs to evaluate a particular group of animalsin relation to the observer’s view of a herd.
In order to resolve this issue, we decided to incorporate the observer’s viewas part of the reasoning process. The idea is to interpret the results throughcut-off threshold boundaries. For example, consider the output variable of thereasoner, called “herd cohesion”, which denotes the strength of group. The de-cision whether this group will be interpreted as a herd or not depends whetherthe value of the output variable is above the threshold defined by the investi-gator. The same principle was applied for other input/output variables in theprocess. Consequently by modifying the boundary values, the investigator canincorporate their own personal judgement into the reasoning process.

3 Overview of the simulation model
The main goal of the herd formation study is to provide insight into how in-teraction between neighbouring animals translate into observable changes in theglobal herd pattern. The sections which follow examine the description and spec-ification of the model as well the simulation environment where the model isexecuted.
3.1 Model Description and Specification
The herd formation model was developed on the basis of the work done byGueron et al. [4]. The model follows a Lagrangian approach to herd formation,which avoids continuum constraints in favour of discrete individual based mod-elling. The basic idea behind this approach is that group formation and dynamicsis a result of a sequence of decisions made by individual entities. This kind ofapproach is more appropriate when dealing with large bodied animals [26], com-pared to Eulerian models where the individuals are expressed through units ofvolume. Furthermore an individual based modelling approach is more suitablefor studying emergent behaviour, due to the fact that it gives an opportunity tocorrelate the collective behaviour to the individual decisions.
An animal in the model is represented by an agent with two main parameters:movement speed and movement direction. While having the same general direc-tion, the animals have the ability to move laterally left or right. Additionally itis assumed that the model is composed out of homogeneous entities with equalbody sizes and movement speeds. Therefore the movement speed and directionat time t for animal A are dependent on A’s speed, direction and the positionof A’s neighbours at time t-1. While there is no explicit message exchange be-
Attraction
Neutral
Stress
zone
zone
zone
front rear
right
left
Fig. 1. Overview of the neighbour influence zones, based on [4]

tween the animals, they do interact with each other through modification of theenvironment by means of spatial repositioning. At the particular time instanceonly one agent can occupy a particular space in the grid. Therefore based on theposition of the neighbours an animal is faced with a set of constraints on whereit is able to move. Furthermore the position of the neighbouring animals is vitalfor the animal’s decision where to move next.
The approach followed in [4] defines the decision making process through anevaluation of influence zones. An influence zone is a spatial area on a predefineddistance relative to the individual in question. This approach assumes threezones (stress, neutral and attraction), which are depicted in figure 1. A briefexplanation of the zones follows:
– Stress or personal zone has the highest importance (compared to the otherzones) and it is the primary factor which determines the actions taken by ananimal. The need for individual space causes individuals to be repelled bytheir neighbours when their personal space is invaded [27]. Thus dependingon the position of the neighbours in the stress zone the animal moves inopposite direction or increases/decreases its speed.
– Neutral zone is an intermediate zone which has lower priority than thestress zone. Furthermore, unlike the stress zone, the neutral zone has norear dimension. This means that the animal does not perceive neighbours inthis zone positioned directly behind it. As far as the interaction is concerned,if the neighbours are in the neutral zone the animal does not react and itmaintains the same speed and direction. However when all of the neighboursare on the same side, the animal moves toward them. This behaviour ac-cording to Hamilton [5] is a display of “selfishness” as the animal is movingtowards the centre of the herd in order to reduce the chance of being attackedby predators.
– Attraction zone has the lowest priority, it is evaluated only in the casewhen the stress and neutral zones are empty. Similarly to the neutral zone,it does not have a rear dimension. Neighbouring animals positioned in theattraction zone influence a change in the agent’s direction and speed. Thepresence of neighbours in the attraction zone means that an animal is notpart of the herd. Consequently the instinctive response for an animal is tomove towards the identified neighbours.
3.2 Model of the individual animal and the simulation environment
Based on the description elaborated in the previous section, the model of an in-dividual animal was developed using X-machine formal notation. An X-machineis a general computational machine introduced by Eilenberg [28] and extendedby Holcombe [29]. In many ways it looks like a Finite State Machine (FSM),however it is extended with memory.
A diagrammatic representation of the X-machine model of an individual an-imal is presented in figure 2. The model does not focus directly on the influencezones, but rather captures the internal decision making structure of the animal.

HighSpeed
Low Speed
No change
Laterally Left Laterally
Right
moveLeft
increaseSpeed
increaseSpeed
moveLeftmoveRight
decreaseSpeed
decreaseSpeed
moveRight
moveLeft
decreaseSpeed
moveRight
High SpeedRight
High SpeedLeft
increaseSpeed
increaseSpeedLeft increaseSpeedRight
increaseSpeedLeft increaseSpeedRight
M=(x_cor, y_cor, speed, lateral_movement, neighbourhood)
move
moveNormalmoveNormal
Fig. 2. Diagrammatic representation of the X-machine model of an individual animal.“M” denotes the memory, functions denote transitions between states.
The states represent the movement direction and speed at a particular timeinstance. While on the other hand the transitions represent a change in theanimal’s movement speed and/or direction.
Although X-machines are useful and intuitive for modelling an individualanimal, a complete computational multi-agent model will need too many states,making the entire model incomprehensible. Furthermore, depending on the com-plexity, in some cases the task of developing such a model seems nearly impos-sible. Therefore for the purpose of modelling the multi-agent system as wellas execution of the simulation experiments, NetLogo [30] was selected as themost appropriate platform. NetLogo allows modelling and animation of agentlike entities in a simulation environment supported by a scripting language, vi-sual animator and data output mechanisms. In addition to the visual animator,which is an excellent tool for observation of the model behaviour (especially inthis case, when dealing with herd formation) perhaps the strongest argumentfor choosing this platform is the correspondence between the X-Machines modelencoded in XMDL [31] and the NetLogo scripting language.
4 Fuzzy Reasoning approach to herd detection
In order to address all of the identified requirements (see the last part of section2.2) for the automated detection of herd formations, we have developed a super-vised fuzzy reasoning mechanism. The main reason for adopting this direction

was the need to incorporate the observer’s judgement as part of the process andvaguely defined classification criteria at the same time. Consequently we tookadvantage of the fuzzy set theory in order to utilize inherently inexact conceptsas part of the reasoning process. For example, using a fuzzy approach one mightexpress the following criteria: in order for a group of animals to form a herd,the members of the group need to be “very close” and the group should havea “sufficient” number of members. Furthermore this tolerance for imprecisioncan be exploited to achieve tractability, robustness and better human-computerinteraction [32].
It has to be noted that our approach is quite different from the fuzzy clus-tering paradigm. We apply concepts from fuzzy set theory to deal with theimprecise nature of the herd clustering criteria rather than using it to expressfuzzy membership functions. Thus, in the developed recognition scheme eachentity is assigned to a single cluster and does not possess membership levelsto multiple clusters. Furthermore, since in our study the emphasis is on herdformation as an emergent phenomenon, our approach combines bottom-up andtop-down directions as part of a two-way reasoning process, in accordance tothe arguments put forward by Conte and Castelfranchi in [33]. A brief overviewof the developed reasoning algorithm is presented in figure 3. Although the op-erations in the reasoning process are sequentially interconnected, they can belogically divided into three major phases.
1. Determine relevant parameters for an arbitrary single individual (A).a. Find the all of A’s neighbours (number of neighbours).b. Find the average distance to A’s neighbour.
a. Identify a group (Bset) of B’s strong neighbours (neighbours with high HBV).b. Find all neighbours of the identified group and add them to Bset.
a. Find the number of animals in Bset (herd size).b. Find the average herd belonging value for animals in Bset.c. Find the spatial area occupied by the animals in Bset.
2. Use fuzzy reasoning to determine the Herd Belonging Value (HBV) for A.3. Repeat steps one (1) and two (2) to determine the HBV for all animals.
5. Repeat step four (4) to allocate all animals with high HBV to a group (Bset).
6. Determine parameters relevant for fuzzy reasoning for an arbitrary Bset group.
7. Use fuzzy reasoning in order to determine the Herd Cohesion Value for Bset.8. Repeat steps six (6) and seven (7) for all identified groups.
4. Identify an individual (B) with high HBV which has not been allocated to a group.
BOTTOM-UP PHASE
TOP-DOWNPHASE
TRANSITIONPHASE
I
II
III
Fig. 3. The developed reasoning algorithm for automated herd detection
The initial stage in the process is the bottom-up reasoning phase. It is de-picted by steps 1 through 3 in figure 3. The goal of this phase is to evaluatethe preference of an individual animal to be part of a herd. Towards this end,two major factors (properties) of an animal are taken into account. The aver-

age neighbour distance represents the average spatial distance to all neighboursof a given animal, while the second parameter is the number of neighbours. Inthis context, a neighbour of an animal A are all animals which are located ei-ther in the stress or neutral zone of animal A. The attraction zone is not takeninto account since there is an obvious spatial gap between the animals. Thesetwo parameters represent the input fuzzy variables in the bottom-up reasoningphase. The output variable, called “Herd Belonging Value” (HBV), denotes thepreference for a particular animal to be a part of a herd. There is a total of 54reasoning rules which assign a single fuzzy set for each of the two input vari-ables with a corresponding fuzzy set in the output variable. Figure 4 shows themapping for the input variables and the corresponding fuzzy set in the inputvariable. As can be seen from the figure, the value represented by the outputfuzzy set has forward correlation with the increase in the number of neighbours(from weak low to strong high) and reverse correlation with the increase of aver-age neighbour distance (from strong high to weak low). In other words the HBVincreases with the increase in the number of neighbours and decreases with theincrease of the average neighbour distance.
weak_low
medium_low
strong_low
weak_high
medium_high
strong_high
weak_low
medium_low
strong_low
weak_avg
medium_avg
strong_avg
weak_high
medium_high
strong_high
AVG(Distance)
# o
f N
eigh
bou
rs
Herd BelongingValue
Fig. 4. Rule mapping of the fuzzy sets for the input variables (Average NeighbourDistance and Number of Neighbours) on the fuzzy sets of the output variable (HerdBelonging Value).
The second phase, depicted by steps 4 and 5 in figure 3, is the transitionfrom the evaluation of an individual animal towards reasoning about a groupof animals. In this phase the crucial point is the identification of groups ofanimals which could potentially form a herd. The identification of the group isprimarily depended on the animal’s preference to be part of the herd which wasevaluated in the bottom-up phase. The HBV is used to determine a set of animalswhich are called “strong neighbours”. A strong neighbours group represents aset of neighbouring animals with an HBV above the threshold defined by the

investigator. The group of strong neighbours forms the skeleton of the possibleherd. The process continues with the expansion of the group by adding animals(with low HBV) which are neighbours to the animals in this group. The rationaleis that the strong neighbours form the core of the herd while the animals withlow HBV form the edge of the herd. In this manner the final result of the processis a group of spatially connected animals. The phase completes when all animalswith HBV are allocated.
Once the groups of animals are identified the process continues with the top-down reasoning phase. This phase is captured by steps 6, 7 and 8 in figure 3. Thegoal of this reasoning phase is to evaluate the coherence of each group of animals.The decision whether a particular group forms a herd or not is determined by thevalue of the output variable (“herd cohesion”) and the thresholds defined by theinvestigator. In addition to the average HBV of the group, also the group sizeand the occupied spatial area are used as input variables in the reasoning process.Herd size denotes the number of animals in the group. Herd area denotes thesize of the spatial area that is occupied by the animals in the group. A decreasein the group’s area implies an increase in the herd cohesion of the group. Thereasoning rules which determine the mapping between the fuzzy sets for theinput variables and output variable follow the similar gradation as in the caseof the bottom-up phase but with one extra dimension.
5 Evaluation and Discussion
The discussed design of the fuzzy reasoner was implemented as a Java-basedextension to the Netlogo simulation model. It uses the FuzzyJ libraries [21] inorder to support the fuzzy reasoning process. The evaluation of the reasoner wasdone in two steps. First of all the implementation of the reasoner was tested usingunit tests which evaluated the influence of a single input variable on the outputvariable. The results of this testing led to revisions in the fuzzy set distributionfor certain input variables.
The second step of the evaluation was focused on the reasoner’s ability todetect herd formations during the execution of the model. A major constraintin this process was the fact that clear-cut “correct” output could not be de-termined due to the nature of the herd detection problem. Consequently theintuition of the investigation team on herd formation patterns was used as basisfor comparison. Thus the process was based on an estimate of how closely thedeveloped reasoner matched what the investigators considered to be a herd in agiven context.
In simulation scenarios with near optimal values the reasoner performed verywell. It managed to clearly differentiate between loose groups and herd forma-tions, as can be seen in the screen capture examples in figure 5. In regards tothe computational time required, it needed on average about 0.7 to 1 second toanimate the model and detect the herds for population of 200 and about 3 to4 seconds for population of 400 animals. Consequently it fulfilled the imposedrequirement by allowing the investigator to observe in “real time” the model
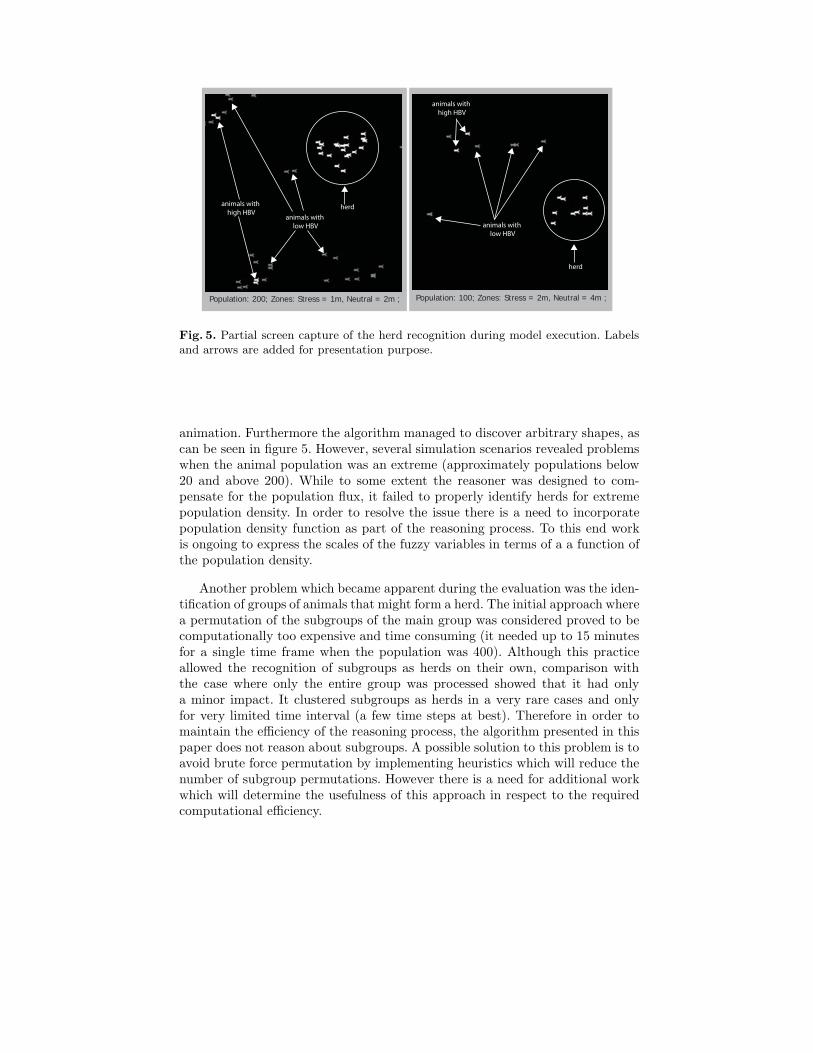
Population: 200; Zones: Stress = 1m, Neutral = 2m ; Population: 100; Zones: Stress = 2m, Neutral = 4m ;
herd
herd
animals with high HBV
animals with high HBV
animals with low HBV animals with
low HBV
Fig. 5. Partial screen capture of the herd recognition during model execution. Labelsand arrows are added for presentation purpose.
animation. Furthermore the algorithm managed to discover arbitrary shapes, ascan be seen in figure 5. However, several simulation scenarios revealed problemswhen the animal population was an extreme (approximately populations below20 and above 200). While to some extent the reasoner was designed to com-pensate for the population flux, it failed to properly identify herds for extremepopulation density. In order to resolve the issue there is a need to incorporatepopulation density function as part of the reasoning process. To this end workis ongoing to express the scales of the fuzzy variables in terms of a a function ofthe population density.
Another problem which became apparent during the evaluation was the iden-tification of groups of animals that might form a herd. The initial approach wherea permutation of the subgroups of the main group was considered proved to becomputationally too expensive and time consuming (it needed up to 15 minutesfor a single time frame when the population was 400). Although this practiceallowed the recognition of subgroups as herds on their own, comparison withthe case where only the entire group was processed showed that it had onlya minor impact. It clustered subgroups as herds in a very rare cases and onlyfor very limited time interval (a few time steps at best). Therefore in order tomaintain the efficiency of the reasoning process, the algorithm presented in thispaper does not reason about subgroups. A possible solution to this problem is toavoid brute force permutation by implementing heuristics which will reduce thenumber of subgroup permutations. However there is a need for additional workwhich will determine the usefulness of this approach in respect to the requiredcomputational efficiency.

6 Conclusions and Future Work
Emergence is one of the most intriguing and at the same time least understoodphenomena of complex systems. However since it is visible only at runtime, de-tecting and quantifying emergent manifestations is a vital part in any attempt toexplore and analyse emergence. In this context, the work presented in this paperexamined issues related to the automatic detection of emergent herd formationsin a multi-agent simulation. Detection of herd formations is essentially a pat-tern recognition problem, however none of the generic recognition approachesmanaged to match completely the specific set of requirements imposed in thestudy.
Consequently we developed a supervised two-way fuzzy reasoning mecha-nism, by utilizing both bottom-up and top-down processes in order to detectherd formations. Our method differs from fuzzy clustering approaches in thesense that it uses fuzzy concepts in order to deal with vague clustering criteriarather than expressing fuzzy membership to a cluster. Furthermore our approachincorporates the observer’s view as an important part of the reasoning process,which to the best of our knowledge is a novel way of dealing with a clusteringproblem. The evaluation of the reasoner showed that it can be applied success-fully for automated detection of the herd pattern in a multi-agent simulation ofanimal dynamics. Nevertheless in some cases, where the population density wasextreme, it failed to produce the desired results.
Although the solution we have presented in this paper is by no means ageneric clustering mechanism nor a general solution to recognition of emergentmanifestations, it can be utilized to solve similar problems in detecting emergentcluster formations in distributed agent based systems. In a more general view,our approach to clustering can be beneficial in detection of clusters in a vari-ety of networks exhibiting small-world characteristics like in a number of socialnetworks, gene networks, telephone call graphs and so on.
The resolution of the problems identified during the evaluation (see section5) is planned as an initial step of the future work. The main idea is to expressthe fuzzy variables through a function of the population density. Additionallywe plan to investigate the possibility of implementing heuristics for subgroupidentification. Once this work is completed, the herd pattern classifier will beused as part of an experimental investigation of causal relations in the study ofherd formation and dynamics.
References
1. Shaw E., Schooling fish, American Scientist, 1978; 66:166-175.2. Lack D., Ecological Adaptations for Breeding in Birds, Chapman and Hall, London,
1968.3. Underwood R., Vigilance Behaviour in Grazing African Ungulates, Animal Be-
haviour, 1982; 79:82-107.4. Gueron S., Levin A. and Rubenstein D. I., The Dynamics of Herds: From Individ-
uals to Aggregations, Journal Theoretical Biology, 1996; 182:85-98.

5. Hamilton W. D., Geometry for the Selfish Herd, Journal of Theoretical Biology,1971; 31:295-31.
6. Anderson P. W., More is Different, Science New Series, 1972; 177(4047):393-396.7. Paunovski O., Eleftherakis G. and Cowling T., Framework for Empirical Explo-
ration of Emergence within Complex Systems, In the proceedings of 2nd AnnualSEERC Doctoral Student Conference (DSC2007), SEERC, Thessaloniki, Greece,2007; p. 176-188.
8. Watanabe S., Pattern Recognition: Human and Mechanical, Wiley, New York,1985.
9. Jain A., Duin P. and Mao J., Statistical Pattern Recognition: A Review, IEEETransactions on PAMI 2000; 22(1):4-37.
10. Perlovsky L. I., Conundrum of Combinatorial Complexity, IEEE Transactions onPattern Analysis and Machine Intelligence, 1998; 20(6):666-670.
11. Anderson J., Pellionisz A. and Rosenfeld E., Neurocomputing 2: Directions forResearch, Cambridge Mass, MIT Press, 1990.
12. Han J., Kamber M. and Tung A. K. H., Geographic Data Mining and KnowledgeDiscovery, In: Spatial Clustering Methods in Data Mining: A Survey. Taylor andFrancis, 2001; p. 1-29.
13. MacQueen J., Some Methods for Classification and Analysis of Multivariate Ob-servations, In the proceedings of Berkly symposium on Mthematical Statistics andProbability, Berkeley, University of California Press, 1967; 1:281-297.
14. Hartigan A. and Wong M. A., A K-Means Clustering Algorithm, Applied Statistics,1979; 28(1): 100108.
15. Bradley P. S., Fayyad U. M. and Reina C. A., Scaling EM (Expectation Max-imization) Clustering to Large Databases, Tech. rep. MSR-TR-98-35, MicrosoftResearch, 1990; p. 98-35.
16. Kaufman L. and Rousseeuw PJ., Finding Groups in Data: an Introduction toCluster Analysis, John Wiley & Sons, 1990.
17. Karypis G., Han E. H. and Kumar V., CHAMELEON: A Hierarchical ClusteringAlgorithm Using Dynamic Modeling, COMPUTER, 1999; 32:68-75.
18. Ester M., Kriegel H. P., Sander J. and Xu X., A Density-Based Algorithm for Dis-covering Clusters in Large Spatial Databases, In the proceedings of InternationalConference on Knowledge Discovery and Data mining (KDD’96), 1996; p. 226-231.
19. Ankerst M., Breunig M., Kriegel H. P. and Sander J., OPTICS: Ordering Points toIdentify the Clustering Structure. In the proceedings of International Conferenceon Management of Data (SIGMOD’99), 1999; p. 49-60.
20. Wang W., Yung J. and Munts R., STING: A statistical Information Grid Approachto Spatial Data Mining, In the proceedings of International Conference on VeryLarge Data Bases (VLDB’97), 1997; p. 186-195.
21. Agrawal R., Gherke J., Gunopulos D. and Raghavan P., Automatic Subspace Clus-tering of High Dimensional Data for Data Mining Applications, In the proceedingsof International Conference on Management of Data (SIGMOD’98), 1998; p. 94-105.
22. Bezdek J., Pattern Recognition with Fuzzy Objective Function Algorithms, PlenumPress, 1981.
23. Wang X.Y., Garibaldi J.M., Bird B., and George, M. W., Fuzzy Clustering inBiochemical Analysis of Cancer Cells, In the proceedings of Fourth Conference ofthe European Society for Fuzzy Logic and Technology (EUSFLAT 2005), 2005; p.1118-1123.
24. Babuka R., Fuzzy Modeling For Control, Kluwer Academic Publishers, 1998.

25. Mitra S., Pal S. K. and Mitra P., Data Mining in Soft Computing Framework: ASurvey, IEEE Transactions on Neural Networks, 2002; 13(1):3-14.
26. Okubo A., Dynamical Aspects of Animal Grouping: Swarms, Schools, Flocks andHerds, Advanced Biophysics, 1986; p. 221-4.
27. Hediger H., Wild Animals in Captivity, Butterworth, London, 1950.28. Eilenberg S., Automata, Machines and Languages, Academic Press, New York,
1974.29. Holcombe M., X-machines as a Basis for Dynamic System Specification, Software
Engineering Journal, 1988; 3(2): 69-76.30. National Research Council of Canada’s Institute for Information Technology, Java
library for Building Fuzzy Systems (FuzzyJ Toolkit), Available online at: http://iit-iti.nrc-cnrc.gc.ca/projects-projets/fuzzyj_e.html
31. Kefalas P., XMDL User Manual: version 1.6., Tech. rep. TR-CS07/00, Departmentof Computer Science at CITY College, 2000.
32. Zadeh L. A., From Computing with Numbers to Computing with Words - FromManipulation of Measurements to Manipulation of Perceptions, IEEE Transactionson Circuits and Systems, 1999; 45(1):105-119.
33. Conte R. and Castelfranchi C., Simulating Multi-agent Interdependencies: A Two-Way Approach to the Micro-Macro Link, In the proceedings of Social ScienceMicrosimulation, 1995; p. 394-415.