Futures Trading Strategies on SGX - India chapter in AFACT in Singapore
35
AFACT Workshop: Futures Trading Strategies on SGX QuantInsti Nitesh Khandelwal May 23, 2015
-
Upload
quantinsti -
Category
Economy & Finance
-
view
170 -
download
0
Transcript of Futures Trading Strategies on SGX - India chapter in AFACT in Singapore
AFACT Workshop:Futures Trading Strategies on SGX
QuantInstiNitesh KhandelwalMay 23, 2015

2Definitions Statistics Strategies Stat Arb
Agenda
Definition
StatisticalConcepts
TradingStrategies
Stat Arbitrage

3
Quantitative Trading
• Using quantitative techniques to build the tradingmodel and execution. Statistical methods andmathematical computations are extensively used whilecreating the trading model as well as the during theimplementation.
Definitions Statistics Strategies Stat Arb
Quantitative Trading
• Using quantitative techniques to build the tradingmodel and execution. Statistical methods andmathematical computations are extensively used whilecreating the trading model as well as the during theimplementation.
4
Statistical Concepts
• Stationarity• Cointegration• Dickey Fuller test
Definitions Statistics Strategies Stat Arb
Statistical Concepts
• Stationarity• Cointegration• Dickey Fuller test

5
Statistical Concepts: Stationarity
• A stationary time series is one whose statistical properties such as mean,variance, autocorrelation, etc. are all constant over time. Most statisticalforecasting methods are based on the assumption that the time series canbe rendered approximately stationary (i.e., "stationarized") through the useof mathematical transformations.
• A stationarized series is relatively easy to predict: you simply predict that itsstatistical properties will be the same in the future as they have been in thepast! The predictions for the stationarized series can then be"untransformed," by reversing whatever mathematical transformations werepreviously used, to obtain predictions for the original series.
Definitions Statistics Strategies Stat Arb
Statistical Concepts: Stationarity
• A stationary time series is one whose statistical properties such as mean,variance, autocorrelation, etc. are all constant over time. Most statisticalforecasting methods are based on the assumption that the time series canbe rendered approximately stationary (i.e., "stationarized") through the useof mathematical transformations.
• A stationarized series is relatively easy to predict: you simply predict that itsstatistical properties will be the same in the future as they have been in thepast! The predictions for the stationarized series can then be"untransformed," by reversing whatever mathematical transformations werepreviously used, to obtain predictions for the original series.
6
Statistical Concepts: Cointegration
• Two time series are cointegrated if they have a commonstochastic drift*. Typically you can determine this by checking if:For two individually non stationary time series, there exists alinear combination of the two time series that is stationary.Example: Walking man and his dog.
Definitions Statistics Strategies Stat Arb
*Stochastic Drift: Change of the average value of a stochastic process. Example: Stock prices

7
Statistical Concepts: DF Test
It test for the unit root in an autoregressive model.
yt = ρ yt-1 + ut
If |ρ| >= 1, then a unit root is present and the series is nonstationary
Definitions Statistics Strategies Stat Arb
Statistical Concepts: DF Test
It test for the unit root in an autoregressive model.
yt = ρ yt-1 + ut
If |ρ| >= 1, then a unit root is present and the series is nonstationary

8
ETF/Cash - Future Arbitrage:
• Long Cash (or ETF)/ Short Future• Short Cash (or ETF)/ Long Future
• Strategy Notes:– When shorting Cash/ETF, ensure its allowed for Short
selling– Pick stocks with liquid cash market– Spreads become more volatile when close to expiry– Higher interest rates typically indicate higher spreads– Market Sentiment
Futures Trading Strategies
Cash Future
Stat Arbitrage
Definitions Statistics Strategies Stat Arb
ETF/Cash - Future Arbitrage:
• Long Cash (or ETF)/ Short Future• Short Cash (or ETF)/ Long Future
• Strategy Notes:– When shorting Cash/ETF, ensure its allowed for Short
selling– Pick stocks with liquid cash market– Spreads become more volatile when close to expiry– Higher interest rates typically indicate higher spreads– Market Sentiment
Index Arbitrage
Directional

9
Calendar Spreads:• INR May 2015 Vs INR June 2015
Inter Product Spreads:• SGX Nifty Vs SGX MSCI India Futures• SGX Nifty Vs SGX INR Futures
Inter Destinations Spreads:• SGX INR Vs INR NDF• SGX JPY Vs Spot JPY
Futures Trading Strategies
Cash Future
Stat Arbitrage
Definitions Statistics Strategies Stat Arb
Calendar Spreads:• INR May 2015 Vs INR June 2015
Inter Product Spreads:• SGX Nifty Vs SGX MSCI India Futures• SGX Nifty Vs SGX INR Futures
Inter Destinations Spreads:• SGX INR Vs INR NDF• SGX JPY Vs Spot JPY
Index Arbitrage
Directional

10
Futures Trading Strategies
SGX NIFTY MSCI India Future Strategy notes
Product 50 stocks 64 stocks Highly correlated pair (99%correlation)
Lot size 2 times the index 50 times the index MSCI contract size is approx 3.1times the Nifty contract
Tick Size 0.5 index points (USD 1) 0.2 index points (USD 10) Correct rounding
Daily Price Range 10/15/20% 10/15/20% Same ‘mostly’
Definitions Statistics Strategies Stat Arb
Contract Months 2 nearest months and 4quarterly months
2 nearest months and 4months on yearly cycle
Near month is most liquid
Trading Hours 9am to 6:10pm, 7:15pmto 2am
9am to 6:10pm, 7:15pm to2am
Same
Last Trading Day Last Thursday of themonth
Last Thursday of themonth
They expire at their respectiveindex values
Settlement Cash Cash Same
11
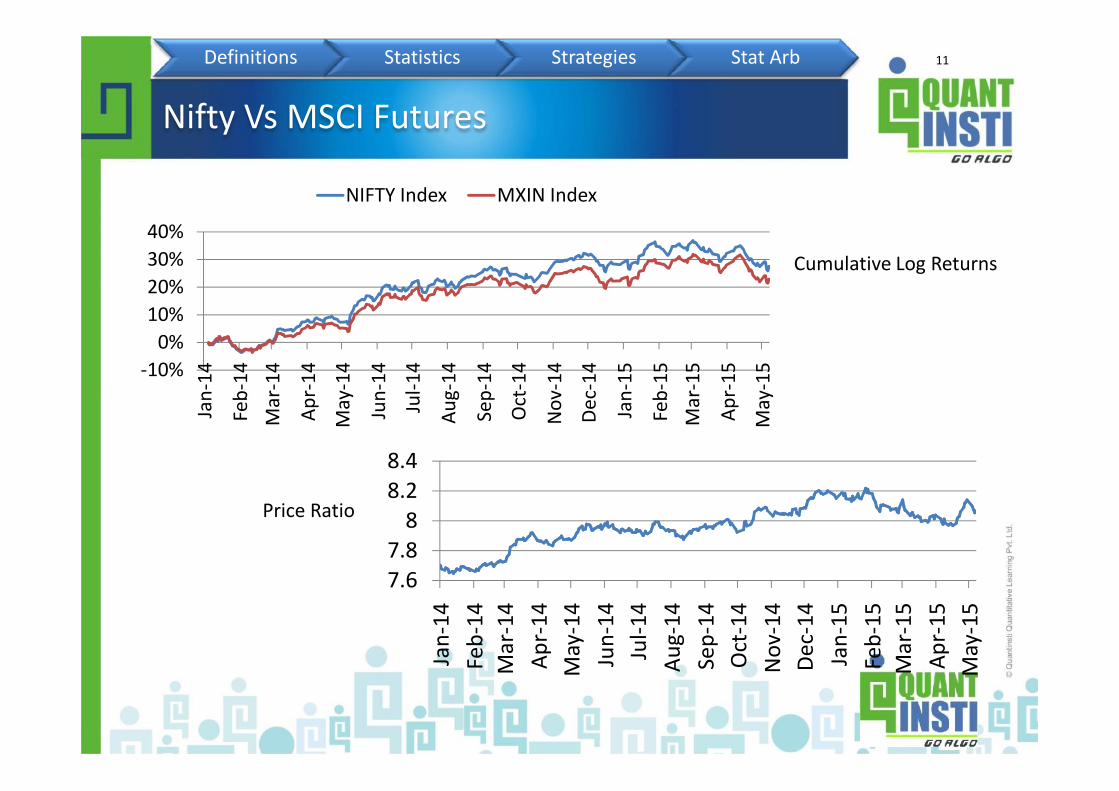
Nifty Vs MSCI Futures
-10%0%
10%20%30%40%
Jan-
14
Feb-
14M
ar-1
4
Apr-
14
May
-14
Jun-
14
Jul-1
4
Aug-
14
Sep-
14
Oct
-14
Nov
-14
Dec-
14
Jan-
15
Feb-
15M
ar-1
5
Apr-
15
May
-15
NIFTY Index MXIN Index
Cumulative Log Returns
Definitions Statistics Strategies Stat Arb
Jan-
14
Feb-
14M
ar-1
4
Apr-
14
May
-14
Jun-
14
Jul-1
4
Aug-
14
Sep-
14
Oct
-14
Nov
-14
Dec-
14
Jan-
15
Feb-
15M
ar-1
5
Apr-
15
May
-15
7.67.8
88.28.4
Jan-
14Fe
b-14
Mar
-14
Apr-
14M
ay-1
4Ju
n-14
Jul-1
4Au
g-14
Sep-
14O
ct-1
4N
ov-1
4De
c-14
Jan-
15Fe
b-15
Mar
-15
Apr-
15M
ay-1
5
Price Ratio

12
Correlation• 99% correlation
– More importantly, they are cointegrated!
Spread Margin Benefit• 70% margin credit for 3 lots of Nifty against
1 lot of MSCI India Future
Nifty Vs MSCI Futures
Cash Future
Stat Arbitrage
Definitions Statistics Strategies Stat Arb
Correlation• 99% correlation
– More importantly, they are cointegrated!
Spread Margin Benefit• 70% margin credit for 3 lots of Nifty against
1 lot of MSCI India FutureIndex Arbitrage
Directional

13
Futures Trading Strategies
Cash Future
Stat Arbitrage
Index Arbitrage:
• Long Nifty Future/ Short ConstituentStocks/Futures
• Short Nifty Future/ Long ConstituentStocks/Futures
• Strategy Notes:– When shorting Cash, ensure its allowed for Short selling– Approximate Index replication– Trade Size– Transaction Cost
– Index Future with Cash Stock + Stock Future
Definitions Statistics Strategies Stat Arb
Index Arbitrage
Directional
Index Arbitrage:
• Long Nifty Future/ Short ConstituentStocks/Futures
• Short Nifty Future/ Long ConstituentStocks/Futures
• Strategy Notes:– When shorting Cash, ensure its allowed for Short selling– Approximate Index replication– Trade Size– Transaction Cost
– Index Future with Cash Stock + Stock Future
14
Futures Trading Strategies
Cash Future
Stat Arbitrage
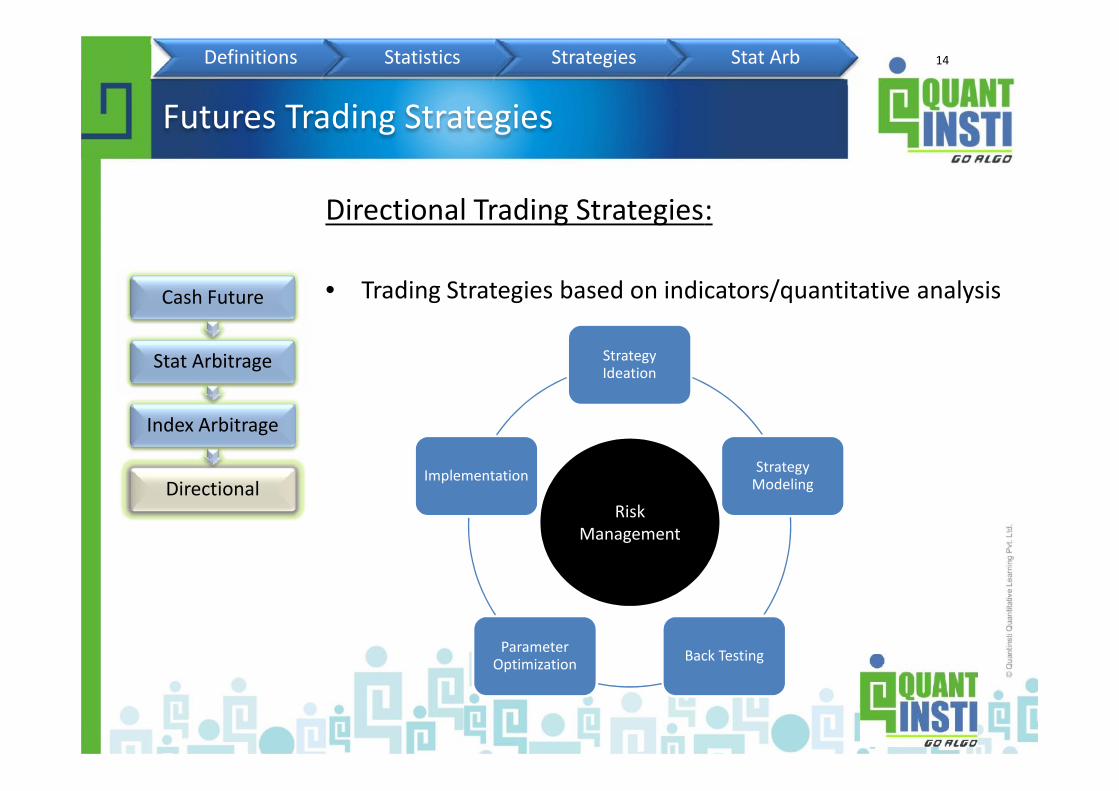
Directional Trading Strategies:
• Trading Strategies based on indicators/quantitative analysis
StrategyIdeation
Definitions Statistics Strategies Stat Arb
Index Arbitrage
Directional
Directional Trading Strategies:
• Trading Strategies based on indicators/quantitative analysis
StrategyModeling
Back TestingParameterOptimization
Implementation
RiskManagement

15
Ideation & Validation• Check for cointegration
Modeling• Create a mean reverting index and model the strategy
– Key inputs: Signal generation parameters, SL, TP, Order quantity
Back-testing• Calculate the key outputs
– Net profit, average profit, drawdown, returns, ratios
Implementation• Causality & exceptions
Stat Arb Example: Strategy Building Process
Definitions Statistics Strategies Stat Arb
Ideation & Validation• Check for cointegration
Modeling• Create a mean reverting index and model the strategy
– Key inputs: Signal generation parameters, SL, TP, Order quantity
Back-testing• Calculate the key outputs
– Net profit, average profit, drawdown, returns, ratios
Implementation• Causality & exceptions
16
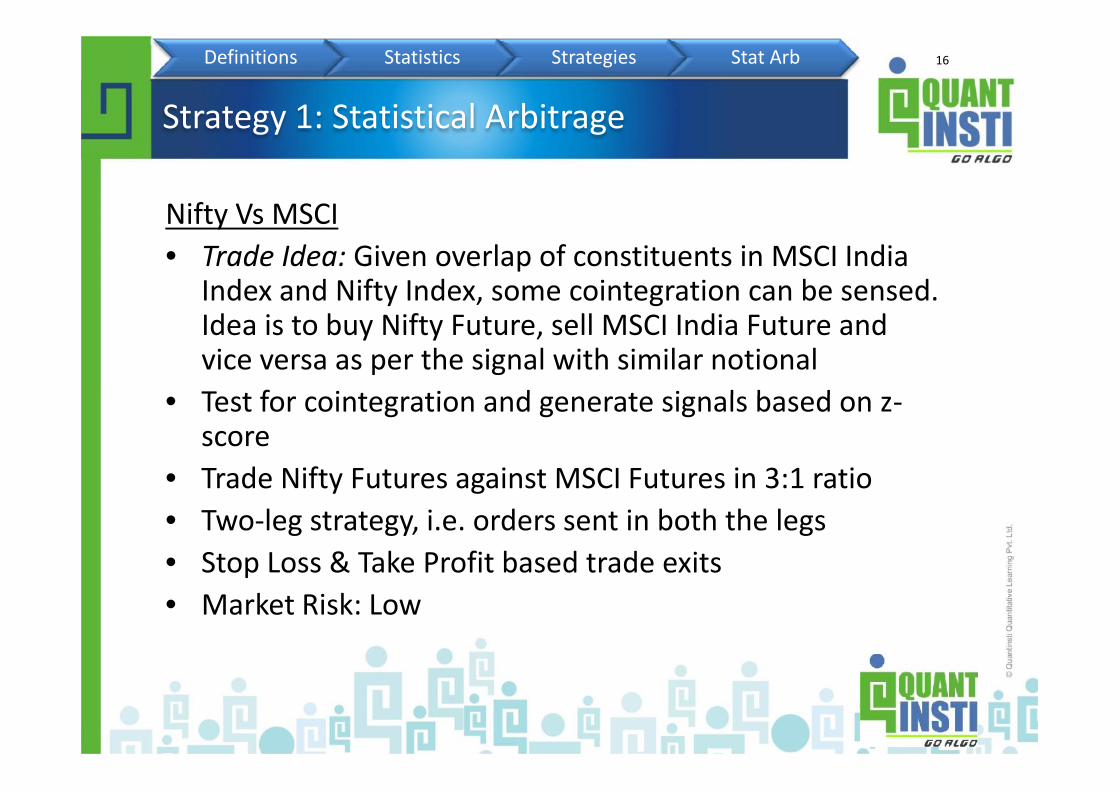
Nifty Vs MSCI• Trade Idea: Given overlap of constituents in MSCI India
Index and Nifty Index, some cointegration can be sensed.Idea is to buy Nifty Future, sell MSCI India Future andvice versa as per the signal with similar notional
• Test for cointegration and generate signals based on z-score
• Trade Nifty Futures against MSCI Futures in 3:1 ratio• Two-leg strategy, i.e. orders sent in both the legs• Stop Loss & Take Profit based trade exits• Market Risk: Low
Strategy 1: Statistical Arbitrage
Definitions Statistics Strategies Stat Arb
Nifty Vs MSCI• Trade Idea: Given overlap of constituents in MSCI India
Index and Nifty Index, some cointegration can be sensed.Idea is to buy Nifty Future, sell MSCI India Future andvice versa as per the signal with similar notional
• Test for cointegration and generate signals based on z-score
• Trade Nifty Futures against MSCI Futures in 3:1 ratio• Two-leg strategy, i.e. orders sent in both the legs• Stop Loss & Take Profit based trade exits• Market Risk: Low

17
MSCI ETF Vs MSCI Future• Trade Idea: ETF assumed as the lead indicator (ideally to
be tested through Granger Causality or other Causalitymodels). If the ETF returns are exceeding Future’sreturn, take a short term naked position in MSCI Future.
• Trade MSCI Futures based on ETF Returns• Single leg strategy, i.e. orders sent only in MSCI Futues
but ETF data used as well.• Trade exit: When signal on the opposite side is
generated• Market Risk: Medium
Strategy 2: Trading Causality
Definitions Statistics Strategies Stat Arb
MSCI ETF Vs MSCI Future• Trade Idea: ETF assumed as the lead indicator (ideally to
be tested through Granger Causality or other Causalitymodels). If the ETF returns are exceeding Future’sreturn, take a short term naked position in MSCI Future.
• Trade MSCI Futures based on ETF Returns• Single leg strategy, i.e. orders sent only in MSCI Futues
but ETF data used as well.• Trade exit: When signal on the opposite side is
generated• Market Risk: Medium

18
INR Futures• Trade Idea: To ride on the short term trend of the INR
futures with exits based on Stop Loss and Take Profit.• Trend Following model• Trading signal generated when current closing price goes
above or below (buy or sell respectively) max/min ofprevious ‘x’ days closing price
• Single leg strategy, i.e. orders sent only in INR Futures• Trade exit: When Stop Loss or Take Profit is triggered.• Market Risk: High
Strategy 3: Trend Following Strategy
Definitions Statistics Strategies Stat Arb
INR Futures• Trade Idea: To ride on the short term trend of the INR
futures with exits based on Stop Loss and Take Profit.• Trend Following model• Trading signal generated when current closing price goes
above or below (buy or sell respectively) max/min ofprevious ‘x’ days closing price
• Single leg strategy, i.e. orders sent only in INR Futures• Trade exit: When Stop Loss or Take Profit is triggered.• Market Risk: High

19
Thank YouMerci
DankeGracias
TerimaKasihXieXie
GraziShukriya
[email protected]/ +91–9920–44-88–77 / +65–6221–3654
GoAlgo! Join QI’s E-PAT (Executive Program on Algorithmic Trading)
Next batch starts: June 20, 2015. Visitwww.quantinsti.comfor more information
Question & Answers
Definitions Statistics Strategies Stat Arb
Thank YouMerci
DankeGracias
TerimaKasihXieXie
GraziShukriya
[email protected]/ +91–9920–44-88–77 / +65–6221–3654
GoAlgo! Join QI’s E-PAT (Executive Program on Algorithmic Trading)
Next batch starts: June 20, 2015. Visitwww.quantinsti.comfor more information

20
APPENDIXAPPENDIX

21
Definitions
• Financial Derivative is a financial instrument whose price isderived from the price of some other financial instrument.
• Futures & Forwards:– Future: Standardized contracts for the purchase and sale of financial
instruments or physical commodities for future delivery on a regulatedexchange.
– Forward: A private over the counter (OTC) agreement between abuyer and seller for the future delivery of a commodity or a financialinstrument, at an agreed upon price. In contrast to futurescontracts, forward contracts are not standardized and are non-transferable.
Definitions Fundaments Pricing
Definitions
• Financial Derivative is a financial instrument whose price isderived from the price of some other financial instrument.
• Futures & Forwards:– Future: Standardized contracts for the purchase and sale of financial
instruments or physical commodities for future delivery on a regulatedexchange.
– Forward: A private over the counter (OTC) agreement between abuyer and seller for the future delivery of a commodity or a financialinstrument, at an agreed upon price. In contrast to futurescontracts, forward contracts are not standardized and are non-transferable.
22
Futures
• Financial Derivative is a financial instrument whose price isderived from the price of some other financial instrument.
• Futures & Forwards:– Future: Standardized contracts for the purchase and sale of financial
instruments or physical commodities for future delivery on a regulatedexchange.
– Forward: A private over the counter (OTC) agreement between abuyer and seller for the future delivery of a commodity or a financialinstrument, at an agreed upon price. In contrast to futurescontracts, forward contracts are not standardized and are non-transferable.
Definitions Fundaments Pricing
Futures
• Financial Derivative is a financial instrument whose price isderived from the price of some other financial instrument.
• Futures & Forwards:– Future: Standardized contracts for the purchase and sale of financial
instruments or physical commodities for future delivery on a regulatedexchange.
– Forward: A private over the counter (OTC) agreement between abuyer and seller for the future delivery of a commodity or a financialinstrument, at an agreed upon price. In contrast to futurescontracts, forward contracts are not standardized and are non-transferable.

23
Market Participants
• Hedgers: Use futures to manage the price risk• Arbitrageurs: Profit from pricing mismatch• Speculators: Take price risk to generate profits
Definitions Fundaments Pricing
24
Key Characteristics
• Spot Price• Contract/Lot Size• Expiry Date• Margin• Settlement• Delivery
Definitions Fundaments Pricing
Key Characteristics
• Spot Price• Contract/Lot Size• Expiry Date• Margin• Settlement• Delivery

25
Benefits of Trading Futures
• Capital efficiency: Higher leverage• More strategies: Different instrument from Cash• Better liquidity: Bigger notional values• Price Discovery: Fair and Transparent Price Discovery
Definitions Fundaments Pricing
Benefits of Trading Futures
• Capital efficiency: Higher leverage• More strategies: Different instrument from Cash• Better liquidity: Bigger notional values• Price Discovery: Fair and Transparent Price Discovery
26
Futures Pricing
• Pricing depends on key characteristics of instrument– Spot Price– Date of Expiry– Risk free rate of return– Storage & Delivery Cost– Convenience Yield
Definitions Fundaments Pricing
Futures Pricing
• Pricing depends on key characteristics of instrument– Spot Price– Date of Expiry– Risk free rate of return– Storage & Delivery Cost– Convenience Yield

27
Futures Pricing: The Math
• For Equity Futures:
F(t, T) = S(t)*er(T-t)
where:– F (t, T) = Price of the future at time t with expiry on time T– S(t) = Spot Price at time T– r = Risk free rate of return– T = Expiry date– t = Current date
Definitions Fundaments Pricing
Futures Pricing: The Math
• For Equity Futures:
F(t, T) = S(t)*er(T-t)
where:– F (t, T) = Price of the future at time t with expiry on time T– S(t) = Spot Price at time T– r = Risk free rate of return– T = Expiry date– t = Current date

28
Futures Pricing: The Math
• For Commodity Futures:
F(t, T) = S(t)*e(r+s-c)(T-t)
where:– F = Price of the future– S = Spot Price– R = Risk free rate of return– T = Expiry date– t = Current date– s = Storage cost– c = Convenience Yield
Definitions Fundaments Pricing
Futures Pricing: The Math
• For Commodity Futures:
F(t, T) = S(t)*e(r+s-c)(T-t)
where:– F = Price of the future– S = Spot Price– R = Risk free rate of return– T = Expiry date– t = Current date– s = Storage cost– c = Convenience Yield

29
Executive Programme in AlgorithmicTrading (E-PAT)
Executive Programme in AlgorithmicTrading (E-PAT)

30
E-PAT
Statistics andEconometrics
Financial Computing &Technology
QI’s E-PAT course
E-PAT Financial Computing &Technology
Algorithmic &Quantitative Trading

31
E-PAT
Statistics andEconometrics
Financial Computing &Technology
E-PAT course structure - module I
Basic Statistics
Advanced Statistics
Probability and Distribution Statistical Inference Linear Regression
Correlation vs. Co-integration ARIMA, ARCH-GARCH Models Multiple Regression
E-PAT Financial Computing &Technology
Algorithmic &Quantitative Trading Time Series Analysis
Correlation vs. Co-integration ARIMA, ARCH-GARCH Models Multiple Regression
Stochastic Math Causality Forecasting

32
E-PAT
Statistics andEconometrics
Financial Computing &Technology
E-PAT course structure - module II
Programming
Technology for AlgorithmicTrading
Intro to ProgrammingLanguage(s)
Programming on AlgorithmicTrading Platforms
System Architecture Understanding an Algorithmic
Trading Platform Handling HFT Data
E-PAT Financial Computing &Technology
Algorithmic &Quantitative Trading Statistical Tools
System Architecture Understanding an Algorithmic
Trading Platform Handling HFT Data
Excel & VBA Financial Modeling using R Using R & Excel for Back-testing

33
E-PAT
Statistics andEconometrics
Financial Computing &Technology
E-PAT course structure - module IIITrading Strategies
Derivatives & MarketMicrostructure
Statistical Arbitrage Market Making Strategies Execution Strategies Forecasting & AI Based Strategies Pair Trading Strategies Trend following Strategies
Option Pricing Model Dispersion Trading Risk Management using Higher
Order Greeks Option Portfolio Management Order Book Dynamics Market Microstructure
Algorithmic &Quantitative Trading
Managing Algo Operations
Option Pricing Model Dispersion Trading Risk Management using Higher
Order Greeks Option Portfolio Management Order Book Dynamics Market Microstructure
Hardware & Network Regulatory Framework Exchange Infrastructure &
Financial Planning (Costing) Risk Management in Automated
systems Performance Evaluation &
Portfolio Management
34
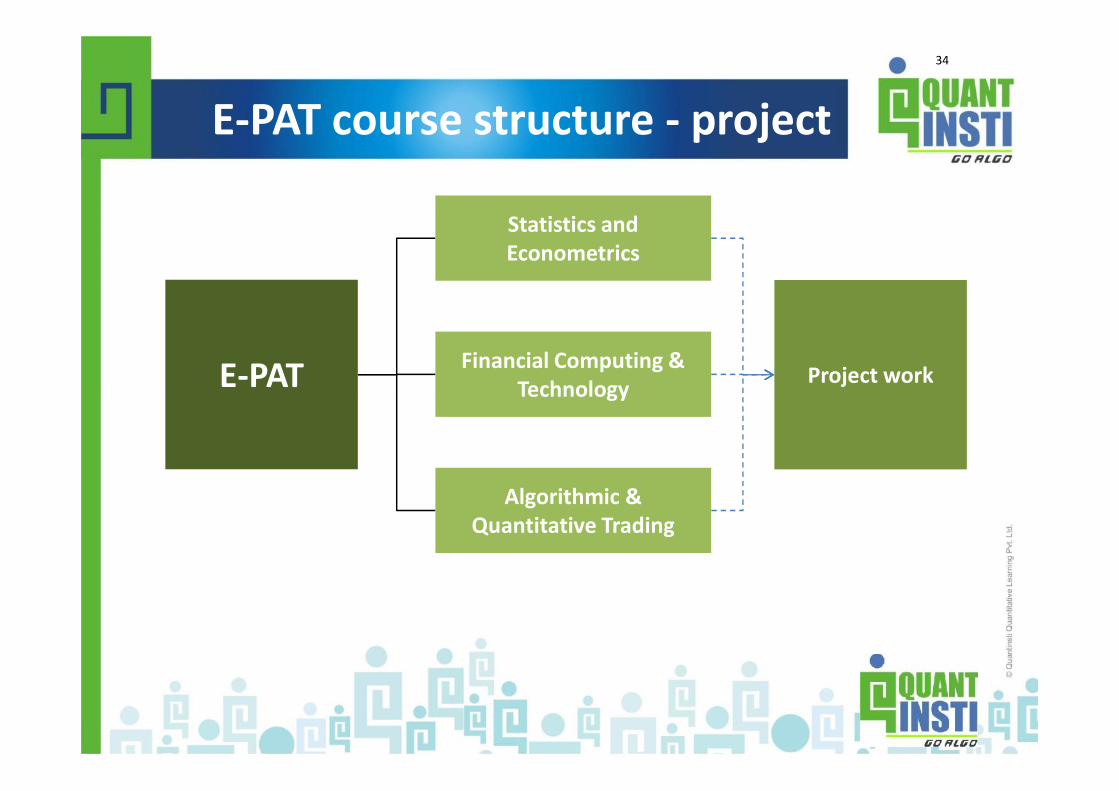
E-PAT
Statistics andEconometrics
Financial Computing &Technology Project work
E-PAT course structure - project
E-PAT Financial Computing &Technology
Algorithmic &Quantitative Trading

35
Thank YouMerci
DankeGracias
TerimaKasihXieXie
GraziShukriya
[email protected]/ +91–9920–44-88–77 / +65–6221–3654
GoAlgo! Join QI’s E-PAT (Executive Program on Algorithmic Trading)
Next batch starts: June 20, 2015. Visitwww.quantinsti.comfor more information
Question & Answers
Thank YouMerci
DankeGracias
TerimaKasihXieXie
GraziShukriya
[email protected]/ +91–9920–44-88–77 / +65–6221–3654
GoAlgo! Join QI’s E-PAT (Executive Program on Algorithmic Trading)
Next batch starts: June 20, 2015. Visitwww.quantinsti.comfor more information