
Future Trade Policy Scenarios Group 3 - GTAP · 2019-04-14 · Center for Global Trade Analysis...
33
Center for Global Trade Analysis Department of Agricultural Economics, Purdue University 403 West State Street, West Lafayette, IN 47907-2056 USA Global Trade Analysis Project Stay Connected with GTAP! www.gtap.agecon.purdue.edu Future Trade Policy Scenarios Group 3
Transcript of Future Trade Policy Scenarios Group 3 - GTAP · 2019-04-14 · Center for Global Trade Analysis...

Center for Global Trade AnalysisDepartment of Agricultural Economics, Purdue University403 West State Street, West Lafayette, IN 47907-2056 USA
Global Trade Analysis Project
Stay Connected with GTAP!www.gtap.agecon.purdue.edu
Future Trade Policy ScenariosGroup 3

Center for Global Trade AnalysisDepartment of Agricultural Economics, Purdue University403 West State Street, West Lafayette, IN 47907-2056 USA
Global Trade Analysis Project
Stay Connected with GTAP!www.gtap.agecon.purdue.edu
Joining Uncle-Sam in a very different kind of war
Disclaimer: The views represented in this presentation do not represent official positions or policy of any presenter’s respective university, agency, or government.

Let us imagine the (scary) world where the USA convinces its major allies to join the trade war with China…!
The battleThe provocation The allies increase tariffs by 10ppt on all Chinese goodsThe response China matches the tariffs on each ally
Fortifying their positionsThe sweetener Allies reduce NTMs within their bloc (based on empirical FTA estimates) Scenario 1 & 2The defense China puts in place internal measures to keep investment high Scenario 2
Four considerations• What happens for North America• What happens for east Asia• What happens for the rest of OECD• Who are the big winners & losers in the developing world
SYNTHESIS
3

Who joins the war USA | Mex & Can | EU & UK | Aus & NZ | Japan
Our implementationBaseline: exogenous = SSP2 assumptions for population, GDP growth & labour supply
closure = CPTPP closure
Policy shock (S1): exogenous = SSP2 population closure = CP-TPP closure, with GDP endogenous
Policy shock (S2): exogenous = as per Scenario 1closure = exogenise total Chinese investment (qinv)
by freeing up Chinese rate of return (cgdslack)
Timeframe2011 no difference to 2018
trade measures introduced gradually from 2019 over 5yr simulation to 2026
SYNTHESIS
4Disclaimer: {Optional -Use this text box to absolve your home institution of any attachment to the views and findings of your presentation}

Commodities affected by the tariffs (allies vs. China) Oilseed crops | Wheat | other agriculture, Forestry & Fishing Energy resources | other resource extraction Energy products | Iron & Steel | Other metals | Non-metal minerals
| Chemicals | other heavy manuf Textiles | Vehicles | Electronics | Machinery | Other light manufacturing
Services affected by the NTM reductions (within the block of allies) Power & Utilities | Transport | Communications | Financial services | Other services
Regional aggregation no change to WTO scenarios
SYNTHESIS
5Disclaimer: {Optional -Use this text box to absolve your home institution of any attachment to the views and findings of your presentation}

Global Macroeconomic Results
6
globalcgds
pcgdswld
pxwwld
qxwwld
-3
-2
-1
0
1
2
3
2017 2018 2019 2020 2021 2022 2023 2024 2025 2026
Perc
enta
ge D
evia
tion
from
Bas
elin
e

Impact on China: GDP & Investment
7
-2.5
-2
-1.5
-1
-0.5
02019 2020 2021 2022 2023 2024 2025 2026
China-S1 China-S2
• China’s reaction offset the negative effects of GDP on 0.02~1.24 percentage point from 2019-2026.
-8
-7
-6
-5
-4
-3
-2
-1
02019 2020 2021 2022 2023 2024 2025 2026
China-Inv-S1 China-Inv-S2
• Investment 1.2~6.82 ppt.

Impact on China: rate of return
8
(5.00)
(4.00)
(3.00)
(2.00)
(1.00)
-2019 2020 2021 2022 2023 2024 2025 2026
Current rate of return
China-S1 China-S2
(5.00) (4.00) (3.00) (2.00) (1.00)
- 1.00 2.00 3.00
2019 2020 2021 2022 2023 2024 2025 2026
Expected rate of return
China-S1 China-S2

Impact on China: GDP expenditures
9
• China’s reaction offset the negative effects:• Priv. Cons. 0.13~1.18 ppt.• Gov. Cons. 0.11~1.22 ppt.
-2.5
-2
-1.5
-1
-0.5
02019 2020 2021 2022 2023 2024 2025 2026
China-Gov-S1 China-Gov-S2
-3
-2.5
-2
-1.5
-1
-0.5
02019 2020 2021 2022 2023 2024 2025 2026
China-Hou-S1 China-Hou-S2
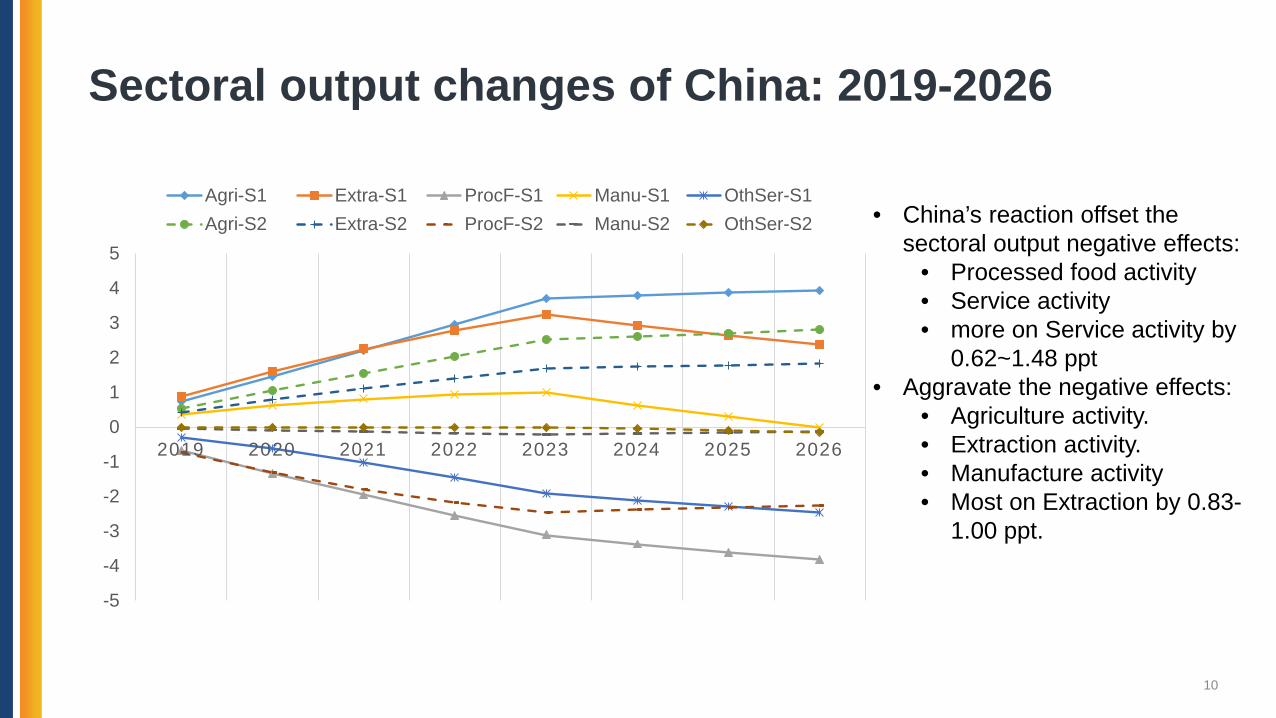
Sectoral output changes of China: 2019-2026
10
• China’s reaction offset the sectoral output negative effects:
• Processed food activity• Service activity• more on Service activity by
0.62~1.48 ppt• Aggravate the negative effects:
• Agriculture activity.• Extraction activity.• Manufacture activity• Most on Extraction by 0.83-
1.00 ppt.
-5
-4
-3
-2
-1
0
1
2
3
4
5
2019 2020 2021 2022 2023 2024 2025 2026
Agri-S1 Extra-S1 ProcF-S1 Manu-S1 OthSer-S1Agri-S2 Extra-S2 ProcF-S2 Manu-S2 OthSer-S2

China import from others: 2019-2026
11
• China’s reaction offset the negative effects on import:
• Import increase especially from neutral regions, i.e. which don’t isolation China
• Korea: 0.67~3.5 ppt• US: 0.82~2.34 ppt• World: 0.47~2.26 ppt
-60.00%
-50.00%
-40.00%
-30.00%
-20.00%
-10.00%
0.00%
10.00%
2019 2020 2021 2022 2023 2024 2025 2026
Korea-S1 JPN-S1 USA-S1 EU27-S1 World-S1Korea-S2 JPN-S2 USA-S2 EU27-S2 World-S2

China export to others: 2019-2026
12
• China’s reaction aggravate the negative effects on export, export decrease:
• World: 1.29~5.38~3.73 ppt• Korea: 1.05~4.6~3.01 ppt• US: 1.26~4.74~3.27 ppt
-40.00%
-30.00%
-20.00%
-10.00%
0.00%
10.00%
20.00%
2019 2020 2021 2022 2023 2024 2025 2026
Korea-S1 JPN-S1 USA-S1 EU27-S1 World-S1Korea-S2 JPN-S2 USA-S2 EU27-S2 World-S2

• China’s reaction• Decreases China’s total trade surplus: $554.18bn~$2671.12bn• Increases China’s trade deficit with Korea: $30.33bn~$161.03bn• Decrease China’s trade surplus with Japan : $46.55bn~$161.05bn• Decrease China’s trade surplus with US : $109.45bn~$397.74bn• Decrease China’s trade surplus with EU : $107.12bn~$402.4bn
Impact on China: Trade balance
13

Impact on North America:GDP & Investment
14
USA
Canada
Mexico
0
0.5
1
1.5
2
2.5
3
3.5
4
2017 2018 2019 2020 2021 2022 2023 2024 2025 2026
Perc
enta
ge D
evia
tion
from
Bas
elin
e
GDP
USA
Canada
Mexico
0
1
2
3
4
5
6
7
2017 2018 2019 2020 2021 2022 2023 2024 2025 2026
Perc
enta
ge D
evia
tion
from
Bas
elin
e
Investment

Impact on North America:Trade
15
USA
Canada
Mexico
0
2
4
6
8
10
12
2017 2018 2019 2020 2021 2022 2023 2024 2025 2026Pe
rcen
tage
Dev
iatio
n fro
m B
asel
ine
Imports
USA
Canada
Mexico
0
2
4
6
8
10
12
2017 2018 2019 2020 2021 2022 2023 2024 2025 2026
Perc
enta
ge D
evia
tion
from
Bas
elin
e
Exports

• Positive GDP and investment impacts – becomes muted when China reacts (particularly investment)
• U.S. manufacturing and agriculture sectors adversely impacted• U.S. services sectors expand
• U.S. exports increase, imports increase even more• Reduced U.S.-China exports down 38% (36%), imports down 20% (24%)• Increased Intra-North America trade
• US exports up 10% (10-11%) with Canada & Mexico• US imports up 14%-16% (14-17%) with Canada & Mexico
• U.S. Trade Deficit – gets even worse
16
Impact on North America:Summary

-2
-1
0
1
2
3
4
5
2019 2020 2021 2022 2023 2024 2025 2026
2 China 3 Korea5 BRN 6 MYS7 SGP 8 VNM9 REA 10 India14 Argentina 15 Brazil18 TUR 19 RUS21 CHL 22 PER23 ROW
% (Cumulative, difference from base case)
17
Expected GDP Change(difference from base case)
-2
-1
0
1
2
3
4
5
2019 2020 2021 2022 2023 2024 2025 2026
1 AUS 4 JPN 11 USA12 CAN 13 MEX 16 EU2717 GBR 20 NZL
% (Cumulative, difference from base case)
allied countries other countries
Japan

-4
-2
0
2
4
6
8
10
12
14
16
2019 2020 2021 2022 2023 2024 2025 2026
2 China 3 Korea5 BRN 6 MYS7 SGP 8 VNM9 REA 10 India14 Argentina 15 Brazil18 TUR 19 RUS
% (Cumulative, difference from base case)
-4
-2
0
2
4
6
8
10
12
14
16
2019 2020 2021 2022 2023 2024 2025 2026
1 AUS 4 JPN 11 USA
12 CAN 13 MEX 16 EU27
17 GBR 20 NZL
% (Cumulative, difference from base case)
18
Expected Export Change(difference from base case)
allied countries other countries

-15
-10
-5
0
5
10
15
2019 2020 2021 2022 2023 2024 2025 2026
2 China 3 Korea 5 BRN6 MYS 7 SGP 8 VNM9 REA 10 India 14 Argentina15 Brazil 18 TUR 19 RUS21 CHL 22 PER 23 ROW
% (Cumulative, difference from base case)
-15
-10
-5
0
5
10
15
2019 2020 2021 2022 2023 2024 2025 2026
1 AUS 4 JPN11 USA 12 CAN13 MEX 16 EU2717 GBR 20 NZL
% (Cumulative, difference from base case)
19
Expected Import Change(difference from base case)
allied countries other countries

-15
-10
-5
0
5
10
15
2019 2020 2021 2022 2023 2024 2025 2026
1 AUS 4 JPN11 USA 12 CAN13 MEX 16 EU2717 GBR 20 NZL
% (Cumulative, difference from base case)
-15
-10
-5
0
5
10
15
2019 2020 2021 2022 2023 2024 2025 2026
2 China 3 Korea 5 BRN6 MYS 7 SGP 8 VNM9 REA 10 India 14 Argentina15 Brazil 18 TUR 19 RUS21 CHL 22 PER 23 ROW
% (Cumulative, difference from base case)
20
Expected Investment Change(difference from base case)
allied countries other countries

21
Expected Export Change from Japan by Countries(difference from base case)
-1200
-1000
-800
-600
-400
-200
0
2019 2020 2021 2022 2023 2024 2025 2026
2 China 3 Korea 5 BRN6 MYS 7 SGP 8 VNM9 REA 10 India 14 Argentina15 Brazil 18 TUR 19 RUS21 CHL 22 PER 23 ROW
% (Cumulative, difference from base case)
allied countries other countries

(40)
(20)
0
20
40
60
80
100
120
140
2019 2020 2021 2022 2023 2024 2025 20261 OtherAgri 2 Wheat 3 OilSeeds4 EnergyExt 5 OtherExt 6 TextWapp7 LightMnfc 8 PetroCoalPro 9 Chemicals10 MineralPro 11 IronSteel 12 OtherMetals13 MetalPro 14 Motor 15 OtherTrans16 Elecronics 17 Machinery 18 Util_Cons19 Transport 20 Communicate 21 Financial22 OthServices
(20)
(10)
0
10
20
30
40
50
2019 2020 2021 2022 2023 2024 2025 2026
Agriculture MiningLight Manu PetroChemiIron/Metals Motor/TransportMachinery/Electronics Service
22
Expected Export Change from Japan by Commodities(difference from base case)
Goods classified in the model Composite Goods
% %

0% 10% 20% 30% 40% 50% 60% 70% 80% 90% 100%
2019
2020
2021
2022
2023
2024
2025
2026
1 AUS 2 China 3 Korea 4 JPN 5 BRN6 MYS 7 SGP 8 VNM 9 REA 10 India11 USA 12 CAN 13 MEX 14 Argentina 15 Brazil16 EU27 17 GBR 18 TUR 19 RUS 20 NZL21 CHL 22 PER 23 ROW
23
Share by partner countries of Metal Products Export from Japan (difference from base case)

Impact on Korea:GDP & Investment
24
Korea
China
Japan
-8
-7
-6
-5
-4
-3
-2
-1
0
1
2
Perc
enta
ge D
evia
tion
from
Bas
elin
e
GDP
Korea
China
Japan
-8
-7
-6
-5
-4
-3
-2
-1
0
1Investment

Impact on Korea:Trade
25
Korea
China
Japan
-10
-8
-6
-4
-2
0
2
4Exports
Korea
China
Japan
-20
-15
-10
-5
0
5
10
Imports

Impact on Korea:Trade
26
Korea
China
Japan
-150000
-100000
-50000
0
50000
100000
150000
200000
Trade Balance

• Negative GDP and investment impacts• GDP impact becomes muted, but investment impact becomes
worse when China reacts• Korea’s agriculture and manufacturing sectors adversely impacted• Korea’s electronics, machinery and services sectors expand
• Korea’s exports increase, no change in imports, imports but increase a lot when China reacts
• Korea’s trade surplus increase, but trade surplus in recession
27
Impact on Korea:Summary

The Impact of EU GDP
28
EU
00.5
11.5
22.5
33.5
44.5
5
2017 2018 2019 2020 2021 2022 2023 2024 2025 2026
GDP
China isolation has resulted in the increase of EU GDP, but the reaction from China will reduce somewhat the amount of GDP increase in EU

EU: Investment is declining, when China reacts to the isolation
29
EU
0123456789
2017 2018 2019 2020 2021 2022 2023 2024 2025 2026
InvestmentAs global capital inflows will come into China, as the returns in China is increasing

EU: Trade of EU is increasing
30
EU
0
1
2
3
4
5
6
7
8
9
10
2017 2018 2019 2020 2021 2022 2023 2024 2025 2026
Exports
EU
0123456789
10
2017 2018 2019 2020 2021 2022 2023 2024 2025 2026
Imports

Trade Balance of EU is decreasing due to Trade Creation and Diversion Effects
31
-350000
-300000
-250000
-200000
-150000
-100000
-50000
0
50000
100000
2019 2020 2021 2022 2023 2024 2025 2026

Sectoral Output is declining, but some promising to textile and light manufacturing
32-14
-12
-10
-8
-6
-4
-2
0
2
4
6
1 O
ther
Agr
i
2 W
heat
3 O
ilSee
ds
4 En
ergy
Ext
5 O
ther
Ext
6 Te
xtW
app
7 Li
ghtM
nfc
8 Pe
troC
oalP
ro
9 C
hem
ical
s
10 M
iner
alPr
o
11 Ir
onSt
eel
12 O
ther
Met
als
13 M
etal
Pro
14 M
otor
15 O
ther
Tran
s
16 E
lecr
onic
s
17 M
achi
nery
18 U
til_C
ons
19 T
rans
port
20 C
omm
unic
ate
21 F
inan
cial
22 O
thSe
rvic
es
23 o
sg
24 d
we
EU

Center for Global Trade AnalysisDepartment of Agricultural Economics, Purdue University403 West State Street, West Lafayette, IN 47907-2056 USA
Global Trade Analysis Project
Stay Connected with GTAP!www.gtap.agecon.purdue.edu
Questions?


