Future First Technologies Ltd Positioning Paper
26
12 th April 2021 Future First Technologies is a research client of RaaS Advisory Pty Ltd, trading as Research as a Service. This report should be read in conjunction with the disclaimers & FSG on pgs 24-26. Business model FFT generates its revenue from its fully-consolidated entities, Asset Vision and farmbuy.com. In the near term, Asset Vision’s revenues and earnings will be the key driver of earnings and profitability. Asset Vision operates a SaaS model, generating enterprise contracts with corporates and government to digitally manage assets. Its contracts are usually 3-5 years in duration. Asset Vision’s business began with state- and local government-responsible road authorities and their road maintenance contractors, with its cloud-based asset management platform delivering a simpler way to manage road inspections, schedule maintenance and capital works and optimising the authorities’ asset register. The platform now spans assets across rail, buildings, utilities and parks and open spaces. Asset Vision is profitable, generating around $1.6m in revenue and $0.4m in NPAT in FY20. Farmbuy.com delivers an online marketplace for rural property agencies, buyers and sellers. It is relatively early stage but now has more than 380 rural property agents using its portal and is securing more than 200,000 user sessions per month. Asset Vision is the key near-term earnings driver FFT’s historical earnings will largely be irrelevant for investors. With the transition to SaaS businesses, the focus will be on the delivery of consistent recurring revenues, the ability to scale, and at maturity, EBITDA margins in the 50-70% range. Asset Vision is still early in its lifecycle so the ability to convert its contract pipeline into annual recurring revenues will be a key feature of its near term earnings outlook. More mature online marketplaces or classifieds platforms such as farmbuy.com generate EBITDA margins of 40-60% and we consider this to be a long term target range for this business. Base case DCF valuation is $0.17/share We have used the discounted cashflow methodology to value FFT using a WACC of 14.5% (beta 1.9, terminal growth rate of 2.2%) and this derives an equity value of $0.17/share. Our model incorporates earnings forecasts for both Asset Vision and farmbuy.com with the investment in 1derful at face value. Future First Technologies Ltd Positioning Paper Transitioned to a SaaS revenue base Share details ASX Code FFT Share Price (9 April 2021) $0.07 Market Capitalisation $27.2M Shares on issue 400.4M Net Cash Dec 31 $9.3M Free float ~68% Share performance (12 months) Upside Case Transitioned to SaaS businesses with growth leverage Clean balance sheet, debt free Board has demonstrated commitment to delivering shareholder returns Downside Case Little history on continuing businesses Farmbuy.com is still early stage and may require additional capital Asset Vision’s enterprise clients have longer lead times (9-12 months) in making decisions Catalysts Expansion of Farmbuy into additional agents, other business lines Conversion of Asset Vision pipeline into contracts Further evidence of operational momentum Board of directors Renata Sguario Non-Executive Chair Keith Falconer Managing Director/CEO Nicole Ferro Non-Executive Director Nicholas Chan Non-Executive Director Company contacts Keith Falconer (MD/CEO)/ Vesna Jelesic (CFO/Co Sec) +61 3 9682 2699 [email protected] RaaS Advisory contacts Finola Burke +61 414 354 712 [email protected] Software & Services Future First Technologies Limited (ASX:FFT), formerly known as PS&C Limited, is building a portfolio of digital assets that seek to make life simpler and safer. The company owns two key businesses, farmbuy.com and Asset Vision, which it respectively acquired in April and November 2020, and convertible notes in a third business, 1derful.com.au. These acquisitions came amidst the divestment of the company’s previously held assets, several companies operating under its Melbourne Consulting business banner and a cybersecurity business. The sale of these businesses netted FFT more than $39m which allowed the company to pay down debt, provide capital for future acquisitions and working capital, and undertake a share buyback as a capital return to shareholders. The company completed the $0.05/share buyback of 147.72m shares in December 2020, at a total consideration of $7.38m, leaving it with $9.3m in the bank at period end. Having switched from IT & security consulting services into high growth technology companies, FFT is well positioned to benefit from the market’s appetite for exposure to SaaS-style revenues. We initiate coverage with a base case DCF valuation of $0.17/share which incorporates modelling for both farmbuy.com and Asset Vision. Historical earnings and RaaS forecasts Year end Total Revenue (A$m) Gross Profit (A$m) EBITDA (A$m) NPAT (A$m) EPS (c) EV/Sales (x) 06/20a 51.1 51.1 5.2 3.8 0.61 0.7 06/21e 1.2 1.1 (3.2) (4.6) (1.69) 17.5 06/22e 2.6 2.4 (3.2) (3.6) (0.90) 9.2 06/23e 4.3 3.7 (2.3) (2.4) (0.59) 7.0 Source: Company data for historical earnings, RaaS estimates for FY21e, FY22e and FY23e $- $0.01 $0.02 $0.03 $0.04 $0.05 $0.06 $0.07 $0.08 $0.09 $0.10
Transcript of Future First Technologies Ltd Positioning Paper

12th April 2021
Future First Technologies is a research client of RaaS Advisory Pty Ltd, trading as Research as a Service. This report should be read in conjunction with the disclaimers & FSG on pgs 24-26.
Business model FFT generates its revenue from its fully-consolidated entities, Asset Vision and farmbuy.com. In the near term, Asset Vision’s revenues and earnings will be the key driver of earnings and profitability. Asset Vision operates a SaaS model, generating enterprise contracts with corporates and government to digitally manage assets. Its contracts are usually 3-5 years in duration. Asset Vision’s business began with state- and local government-responsible road authorities and their road maintenance contractors, with its cloud-based asset management platform delivering a simpler way to manage road inspections, schedule maintenance and capital works and optimising the authorities’ asset register. The platform now spans assets across rail, buildings, utilities and parks and open spaces. Asset Vision is profitable, generating around $1.6m in revenue and $0.4m in NPAT in FY20. Farmbuy.com delivers an online marketplace for rural property agencies, buyers and sellers. It is relatively early stage but now has more than 380 rural property agents using its portal and is securing more than 200,000 user sessions per month.
Asset Vision is the key near-term earnings driver FFT’s historical earnings will largely be irrelevant for investors. With the transition to SaaS businesses, the focus will be on the delivery of consistent recurring revenues, the ability to scale, and at maturity, EBITDA margins in the 50-70% range. Asset Vision is still early in its lifecycle so the ability to convert its contract pipeline into annual recurring revenues will be a key feature of its near term earnings outlook. More mature online marketplaces or classifieds platforms such as farmbuy.com generate EBITDA margins of 40-60% and we consider this to be a long term target range for this business.
Base case DCF valuation is $0.17/share We have used the discounted cashflow methodology to value FFT using a WACC of 14.5% (beta 1.9, terminal growth rate of 2.2%) and this derives an equity value of $0.17/share. Our model incorporates earnings forecasts for both Asset Vision and farmbuy.com with the investment in 1derful at face value.
Future First Technologies Ltd Positioning Paper
Transitioned to a SaaS revenue base
Share details
ASX Code FFT
Share Price (9 April 2021) $0.07
Market Capitalisation $27.2M
Shares on issue 400.4M
Net Cash Dec 31 $9.3M
Free float ~68%
Share performance (12 months)
Upside Case
Transitioned to SaaS businesses with growth leverage
Clean balance sheet, debt free
Board has demonstrated commitment to delivering shareholder returns
Downside Case
Little history on continuing businesses
Farmbuy.com is still early stage and may require additional capital
Asset Vision’s enterprise clients have longer lead times (9-12 months) in making decisions
Catalysts
Expansion of Farmbuy into additional agents, other business lines
Conversion of Asset Vision pipeline into contracts
Further evidence of operational momentum
Board of directors
Renata Sguario Non-Executive Chair
Keith Falconer Managing Director/CEO
Nicole Ferro Non-Executive Director
Nicholas Chan Non-Executive Director
Company contacts
Keith Falconer (MD/CEO)/ Vesna Jelesic (CFO/Co Sec)
+61 3 9682 2699
RaaS Advisory contacts
Finola Burke +61 414 354 712 [email protected]
Software & Services
Future First Technologies Limited (ASX:FFT), formerly known as PS&C Limited, is
building a portfolio of digital assets that seek to make life simpler and safer. The
company owns two key businesses, farmbuy.com and Asset Vision, which it
respectively acquired in April and November 2020, and convertible notes in a third
business, 1derful.com.au. These acquisitions came amidst the divestment of the
company’s previously held assets, several companies operating under its Melbourne
Consulting business banner and a cybersecurity business. The sale of these
businesses netted FFT more than $39m which allowed the company to pay down debt,
provide capital for future acquisitions and working capital, and undertake a share
buyback as a capital return to shareholders. The company completed the $0.05/share
buyback of 147.72m shares in December 2020, at a total consideration of $7.38m,
leaving it with $9.3m in the bank at period end. Having switched from IT & security
consulting services into high growth technology companies, FFT is well positioned to
benefit from the market’s appetite for exposure to SaaS-style revenues. We initiate
coverage with a base case DCF valuation of $0.17/share which incorporates modelling
for both farmbuy.com and Asset Vision.
Historical earnings and RaaS forecasts
Year end
Total Revenue
(A$m)
Gross Profit (A$m)
EBITDA
(A$m)
NPAT
(A$m)
EPS
(c)
EV/Sales
(x)
06/20a 51.1 51.1 5.2 3.8 0.61 0.7
06/21e 1.2 1.1 (3.2) (4.6) (1.69) 17.5
06/22e 2.6 2.4 (3.2) (3.6) (0.90) 9.2
06/23e 4.3 3.7 (2.3) (2.4) (0.59) 7.0
Source: Company data for historical earnings, RaaS estimates for FY21e, FY22e and FY23e
$- $0.01 $0.02 $0.03 $0.04 $0.05 $0.06 $0.07 $0.08 $0.09 $0.10

Future First Technologies Ltd | 12th April 2021 2
Table of contents Business model ................................................................................................................................. 1
Transitioning earnings profile ........................................................................................................... 1
Base case DCF valuation is $0.17/share ............................................................................................ 1
Future First Technologies Ltd ............................................................................................................ 3
Investment case ................................................................................................................................ 3
DCF valuation of $0.17/share ........................................................................................................... 3
Business Model ................................................................................................................................. 4
Corporate history .............................................................................................................................. 4
Asset Vision ...................................................................................................................................... 5
Farmbuy.com .................................................................................................................................. 13
1derful ........................................................................................................................................... 17
Group earnings forecasts ................................................................................................................ 17
SWOT analysis ................................................................................................................................. 18
Sensitivities ..................................................................................................................................... 18
Board and management ................................................................................................................. 19
DCF valuation .................................................................................................................................. 21
Scenario Analysis ............................................................................................................................ 21
Look to SaaS companies for peer comparison ................................................................................ 22
Financial Summary ......................................................................................................................... 23
Financial Services Guide ................................................................................................................. 24
Disclaimers and Disclosures ............................................................................................................ 26

Future First Technologies Ltd | 12th April 2021 3
Future First Technologies Ltd
Future First Technologies has transitioned into a SaaS company from a “people exertion”
business following the sale of its Melbourne Consulting operations and cyber security business
and adjacent acquisitions of its two wholly owned SaaS enterprises, Asset Vision, and
farmbuy.com. Future First began life as PS&C which listed on the ASX in 2013 after raising
$25m at $1.00/share for a market capitalisation at listing of $50.6m. Around $20m of the
proceeds raised went towards acquiring four ICT businesses. The company subsequently
acquired seven firms, spending approximately $25.7m ($7.75m cash and $18.0m in shares) to
round out its People and Security segments. These businesses have since been sold with the
Security segment acquired by Tesserent (ASX: TNT) for $14m ($9m cash and $5m in TNT shares
which were passed through to PS&C shareholders by way of in specie distribution); and the
People segment sold to LVP Technology for $23m. The company used the proceeds from its
People and Security segments to pay down debt, undertake an $7.38m selective share
buyback at $0.05/share, and provide a cash pile ($9m) for future acquisitions and working
capital.
Investment case
In our view, Future First Technologies has the opportunity to achieve success for the following reasons:
The company has switched out of people exertion, low operating margin businesses into SaaS-focused
businesses which have leverage to higher growth prospects and higher margins;
The board and senior management team are highly experienced in building SaaS businesses. Much of the
senior management team worked together previously to build and sell MethodGroup, a private business,
to RXP Services (ASX:RXP) or at Bauer Media’s trader group building online marketplaces;
FFT’s acquisition of Asset Vision ($10m total price on an EV/sales multiple 6.25x) has delivered a
profitable, SaaS business with a solid array of long-contracted government and enterprise clients and a
growth pipeline of new clients;
The acquisition of Respring Pty Ltd in April 2020 for $4.5m delivered 100% ownership of farmbuy.com,
an early stage real estate portal for rural and lifestyle properties. Respring’s senior executive team, Keith
Falconer and Lucas Murtagh have respectively become Chief Executive Officer/Executive Director and
Chief Operations Officer for the group. Mr Falconer and Mr Murtagh have considerable experience in
building and selling subscription style businesses;
The company has adopted a conservative approach with its investment in “banking infrastructure as a
service fintech” 1derful, investing initially in a $1.25m convertible note and a follow-up second
convertible note of the same amount, while getting to understand the business;
FFT has a clean balance sheet, no debt, and a cash balance of $9m to put towards potential acquisitions
and/or building its existing businesses.
DCF valuation of $0.17/share
Valuing early stage companies is always a subjective exercise, particularly when considering the rollout of new
opportunities, the timing of takeup and success. FFT’s two segments are at different stages in their lifecycle
with farmbuy.com still loss-making and Asset Vision cashflow positive but still early stage. For this reason we
have applied a relatively high discount rate of 14.5% (beta 1.9, terminal growth rate of 2.2%). This derives an
equity valuation of $0.17/share. We have dimensioned an upside case ($0.45/share) and downside case
($0.02/share) and discuss these on page 21 of our report.

Future First Technologies Ltd | 12th April 2021 4
Business Model
Future First Technologies is building a portfolio of digital assets which have a predominantly subscription
model focus. The company’s senior management team is actively involved in developing these assets, having
vended their businesses into FFT. The shift to subscription models away from people exertion businesses re-
positions FFT as a SaaS business, which by and large generate higher operating margins and are leveraged to
scale. Currently FFT has two fully consolidated operating segments:
Farmbuy.com, an online portal for Australia’s rural and lifestyle real estate, delivering digital
advertising and marketing services to the agricultural and real estate companies operating in that
sector. Farmbuy.com is wholly owned by Respring Pty Ltd which FFT acquired in April 2020.
Respring is a digital technology company that invests in and advises other digital companies in
growing markets, assisting them to reach their full potential.
Asset Vision, a proprietary cloud and mobile-based platform providing a unified approach to asset
management, inspections, maintenance and work schedules operating in the Enterprise Asset
Management software market.
The company has also invested $2.5m in two convertible note series for emerging fintech, 1derful, which is
seeking to create a disruptive banking infrastructure as a service solution to consumers. FFT owns 100% of
its two core assets and therefore fully consolidates their earnings. These earnings are reported segmentally,
giving a good insight into each individual business’ performance and the overarching corporate expenditure.
Given both investments have a subscription focus (and therefore the opportunity to gain scale leverage off a
relatively fixed cost base), we expect the market will price Future First as a SaaS company rather than the
consulting services business it was previously.
Corporate history
In its 7+ years as a listed entity, the company has been an active acquirer of businesses. Under the current
board, the transition away from People and Security accelerated with the sale of all these businesses and
the acquisition of two subscription/SaaS businesses, farmbuy.com and Asset Vision.
Exhibit 1: Historical timeline of events
Year Event
Dec-13 Listed on the ASX as PS&C (ASX:PSZ), raising $25m at $1.00/share, for a total market cap of $50.57m; acquires four businesses, Systems and People Ltd, Securus Global Consulting, Hacklabs Ltd, Allcom Networks and Allcom Consulting Services, as part of the raise for $20m combined
Aug-14 PS&C acquires Sydney based cyber security company, Pure Hacking for $8.3M - $4.15 in cash and $4.15 in scrip Oct-15 Purchased Bexton IT services for an initial $2.9M and future payments contingent on EBIT in 2018. It was a 50:50 split of cash and share capital. Jan-16 Acquires Melbourne based governance and risk company Certitude for an initial payment of $2.1M in a 50:50 split of cash and share capital. May-17 Appoints Glenn Fielding as Managing Director Jun-17 Acquires cloud services provider Sacon and Salesforce consulting company Coroma Consulting Jul-17 Establishes Glass (QLD) under its People Division - a company focussed on innovation and machine learning Oct-17 Jeff Bennett appointed CFO Dec-17 Terry Benfold retires as director, Nigel Warren appointed as director, Kevin McLaine (a director since July 2013) appointed non-executive chairman. Dec-17 Acquires business and technology consulting company Seisma with a mix of scrip and cash May-18 Acquires NTH Consulting providing the company with Tier 1 government coverage for a 4x EBIT totalling $1m plus earnout using a mix of scrip/cash Nov-18 Sells Allcom Network business division to Crosspoint Telecommunications for $3.2M cash Feb-19 Acquires Salesforce solutions business Artisan Consulting for $1.64m ($0.24m cash, $0.92m shares, $0.48m deferred consideration) Jun-19 Established a new $15m debtor finance facility with Scottish Pacific & renegotiates senior debt facility from ANZ, reducing i t to $5.05M Aug-19 Nigel Warren resigns as director Sep-19 Glenn Fielding steps down from his role as CEO to be replaced by an interim CEO Robert Hogeland. Renata Sguario appointed non-executive director Oct-19 Sells its Security Segment to Tesserent Ltd (ASX:TNT) for $14m ($9m cash/$5m scrip (100m shares @ $0.05) which is distributed to shareholders. Nov-19 Kevin McLaine resigns as chairman, Renata Sguario becomes non-executive chairman Dec-19 Sells Glass & Co, to Vitrics for $1.6m cash. Vitrics is controlled by Glenn Fielding, Jeff Bennett, and Glass executives Erin Brown & Wayne Custodio. Jan-20 Glenn Fielding resigns from board, Nicole Ferro appointed to board Feb-20 Jeff Bennett resigns as CFO Apr-20 Acquires Respring through the issue of 150m shares at $0.03/shares. Acquisition includes rural & lifestyle property portal farmbuy.com. Vesna Jelesic appointed CFO. Jun-20 Debt repaid in full, deferred consideration reduced to less than $0.7m Jul-20 Respring wins advisory role with fintech start up The 1derful Group, invests $1.25m in 1derful through convertible note with a face value of $1.00/note. Aug-20 Nicholas Chan appointed as director
Oct-20 PS&C changes its name to Future First Technologies (ASX:FFT); FFT completes the sale of Melbourne consulting business to LVP Technology Services for $23M in cash. Robert Hogeland remains CEO of the Melbourne Consulting Business and steps down as a director and CEO of FFT.
Nov-20
FFT acquires Asset Vision for a total of $10m ($5m in cash/$1.0m scrip @ $0.042/share upfront and $4m on the first anniversary of the transaction). Keith Falconer, founder of Respring, is appointed Executive Director and CEO of FFT. Senior management team put in place with the appointment of Lucas Murtagh from Respring/farmbuy.com as Head of Operations, Damien Smith, Managing Director of Asset Vision as Chief Product Officer, Paul Fielding as Head of Mergers and Acquisitions, Chris Wignall as Head of Sales and Distribution and Robyn Murphy as Chief Information Officer.
Feb-21 FFT invests a further $1.25m into 1derful through convertible notes at a face value of $1.00/note.
Source: Company announcements

Future First Technologies Ltd | 12th April 2021 5
Asset Vision
Future First Technologies acquired Asset Vision in November 2020 for $10m, which includes a deferred
payment of $4m payable on the first anniversary of the acquisition. Asset Vision has created a platform to
deliver asset owners and their contractors a unified approach to asset inspections, maintenance and
operations management. In the 10 years since the company was created, Asset Vision has completed more
than 2.5m inspections, its system has overseen more than 100,000 kms of road maintenance and it has
under management more than 300,000 civil and transport infrastructure assets on its platform.
The platform has several key functions including:
Asset Register which provides a comprehensive dynamic overview of the client’s built, fixed and
mobile assets and helps maximise asset life cycles through effective decision making;
Asset Inventory and Condition which captures in the field the individual asset’s condition and
identifies that it is safe and available for public usage; provides mobile functionality to capture new
assets in the field and update attributes on existing assets; enables work orders to be raised and
assigned to assets;
Asset Maintenance which manages asset inspection compliance by bringing together the client
and contractor to collaborate in the same environment, optimises inspections and works
schedules, mobile inspection and defect capture, and delivers workflow efficiency from task
creation to completion;
Risk and Compliance generates site risk documentation such as traffic management plans, work
permits, safety, environmental and quality management plans at the site, and provides risk
reporting tools both spatially and via data export and dashboards to deliver a live overview of the
current state and health of each project;
Operations which is a planning tool designed to manage the project budgets and actual costs,
provides documentation and reporting functions for up to the minute efficiency of resources and
delivery of projects; extracts timesheets and resource allocations;
Asset CoPilot is a hands free capture of asset defects in the field using mobile devices by recording
defect images and automatically linking defects into an existing inspection.
The following exhibits demonstrate how Asset Vision’s platform is presented across web and mobile devices
Exhibit 2: Web Application Exhibit 3: Mobile Application
Source: Company data Source: Company data
The business has adopted all the relevant policies and procedures to ensure that it aligns with international
protocols for quality, integrity and safe handling of information including:
An Information Security Management System (IMS) and related Information Security
Processes/Procedures that align to the requirements of ISO/IEC 27001:2013;

Future First Technologies Ltd | 12th April 2021 6
An Integrated Quality, Environmental and Occupational Health & Safety Management System,
which uses ISO 9001:2015, ISO 14001:2015 and ISO 45001:2018;
The platform complies with the Australian Government Information Security Manual (Feb 2021)
“Guidelines for Database Systems Security Controls”;
Asset Vision also applies the privacy principles set out in the Australian Privacy Act 1988 (Cth),
which guide how it collects and manages personal information.
Asset Vision’s History
Asset Vision was founded by Damian Smith (Chief Product Officer for FFT and Asset Vision) and Lincoln
Portbury in 2011 on the back of more than a decade of real world accumulated knowledge in designing and
building road asset maintenance management systems for asset owners and contractors. In 2013, Asset
Vision was awarded a seven-year contract (5 years + 2 year extension) with Vic Roads (the Victorian State
Government’s road authority). Asset Vision created its Android version of its platform after securing this
contract.
This sparked an uptick in new contracts with both Municipal Councils and large contractors such as Fulton
Hogan and Downer EDI (ASX:DOW) to support their road management contracts. From 2013 to 2016, Asset
Vision’s platform was adopted Downer EDI, Fulton Hogan and a growing number of councils.
In 2017, Asset Vision undertook a significant overhaul of the platform, creating a fully configurable,
hierarchical Asset Register, updated User Interface and additional features set to open up new markets and
opportunities including data analytics capability. Until this point, the platform was predominantly being used
for road management and maintenance. The upgrade was designed to enable Asset Register to be extended
to property managers, open spaces, rail, utilities, and ports and maritime.
Since the upgrade, Asset Vision has signed a 5-year (3+2) contract with Transport for NSW and has
negotiated a further 5-year extension with Vic Roads. The platform is now being utilised by the two largest
State road authorities in Australia, several municipal councils, major Australian civil construction companies
and, in May 2020, was contracted by ASX-listed Atlas Artera (ASX:ALX) to manage the Asset Register,
Inspections and Maintenance of all infrastructure assets on the 14-mile Dulles Greenway toll road in Virginia
USA. The Dulles Greenway connects Washington Dulles International Airport with Leesburg Virginia.
Client base
Asset Vision counts Australia’s two largest State road authorities as its clients as well as the contractors that
service these authorities and the municipal councils that manage projects in their local areas. The company
is seeking to create an ecosystem for asset management with a growing number of sub-contractors also
using the platform. The company has by no means exhausted the road asset management opportunity in
Australia or offshore and has made only small inroads into other adjacent asset management opportunities.
We set out in the following exhibit the company’s current clients.

Future First Technologies Ltd | 12th April 2021 7
Exhibit 4: Asset Vision’s clients
Source: Company data
Business model
Asset Vision operates as a SaaS company. SaaS stands for software-as-service and it defined as a software
licensing and distribution model whereby software is centrally hosted and delivered to licenced users on a
subscription basis over the internet. Users log onto Asset Vision’s platform via a web browser or mobile app
and interact with the Asset Vision platform via the cloud. Asset Vision’s platform is hosted in the cloud via a
secure Tier IV Australian data centre.
Asset Vision’s revenues are derived from enterprise licence contracts, typically of 3-5 years duration. The
contracts have two components: software licence fees which are charged on a per user per month basis and
professional services revenues which are generated on new client implementations and enhancement
requests. Clients pay licence fees according to the number of licences with discounts provided for scale.
The Global Enterprise Asset Management Software market
Asset Vision operates in the global Enterprise Asset Management (EAM) Software market, which includes
intelligent asset management. EAM is the process of managing the lifecycle of physical assets to:
Maximise and maintain their use;
Maximise their economic return;
Safeguard health, safety and environment;
Improve the quality and efficiency of business operations and
Minimise risks and costs by ensuring the most efficient manner in which to deliver maintenance
and surveillance.
Research group Prescient & Strategic Intelligence estimated that the Global Enterprise Asset Management
market stood at US$5.5b in 2019, and that it is expected to reach US$25.9b by 2030, a CAGR of 17% from
2020-20301. Prescient & Strategic Intelligence expects the Asia Pacific region to exhibit the fastest growth in
this period, driven by the manufacturing, telecoms, banking and transport sectors. Prescient & Strategic
Intelligence cites IBM as the global market leader ahead of Oracle, SAP SE, ABB Ltd, Industrial and Financial
Systems (IFS) AB, Ramco Systems and Infor.
1 https://www.psmarketresearch.com/market-analysis/enterprise-asset-management-market

Future First Technologies Ltd | 12th April 2021 8
Separately another industry forecaster, MarketsandMarkets is forecasting that the global EAM Software
market will reach US$5.5b by 2026, up from US$3.3b in 2020, a compound annual growth rate of 8.7%.
Major growth factors cited by ResearchandMarkets.com are the rising popularity of SaaS-based EAM
solutions, the growing requirement for gaining a 360-degree view of assets, an increase in mobility usage by
end users and the increased usage of internet of things (IoT) platforms and devices to manage enterprise
assets2. COVID-19 lockdowns have also hastened the uptake, with enterprises opting for cloud-based EAM
systems to manage assets remotely.
Exhibit 5: Enterprise Asset Management Value Chain
Source: MarketsandMarkets.com, RaaS analysis
Frost & Sullivan estimates that the global workplace management solutions market (which includes asset
management, human services management, workplace management and onboarding, access control and
learning management) was worth approximately US$15.6b in 20183 and that it will grow at a CAGR of 6.7%
to reach US$20.2b in 2022. Frost and Sullivan estimates that the asset management component was
US$2.85b in 2018, rising to US$3.75b in 2022 while workplace management and onboarding would reach
US$4.36b by 2022 from US$3.81b in 2018. North America represents the largest market, estimated by Frost
and Sullivan at US$6.7b in 2018 while Asia Pacific was estimated at US$0.6b in the same year.
Getting an accurate addressable market in Australia is challenging. It is clearly a subset of Asia which Frost &
Sullivan estimated was US$0.6b in 2018. We have attempted to backsolve the Australian market from
revenues generated by other players. One of the market leaders in delivering EAM solutions to local
governments is Technology One (ASX:TNE). Technology One delivers an Enterprise Resource Planning (ERP)
platform which encompasses corporate performance management, enterprise asset management, human
resources and payroll and supply chain management, which is broader than the space that Asset Vision plays
in. That said, Technology One services around 50% of Australia’s 540 councils around Australia and in FY20
generated $270m in revenues of which $135m were SaaS recurring revenues. If we assume that enterprise
asset management is one-fifth of this solution, the annual opportunity among local councils in Australia is in
the order of A$110m. Add to this State Road and Rail Authorities, other asset heavy government entities
such as Education and Health, utilities and building managers and the total Australian EAM market could be
upwards of A$500m.
2 https://www.businesswire.com/news/home/20210312005243/en/Global-Enterprise-Asset-Management-Market-2020-to-2026---Data-Driven-Asset-Management-Presents-Opportunities---ResearchAndMarkets.com/
3 Damstra Corporation Prospectus, Industry Overview, pages 30-34
Vendors Applications Verticals End Users
• Oracle• IFS• Infor• IBM• SAP• ABB• IPS• Maintenance
Connection• AVEVA• Aptean• CGI
• Asset Life Cycle Management
• Inventory Management
• Labor Management
• Predictive Maintenance
• Facilities Management
• Otherapplications
• Manufacturing• Energy &
Utilities• Healthcare &
Life Sciences• Transportation
and Logistics• IT & Telecoms• Government &
Public Sector• Education• Other Verticals
• Government• Semi-
government enterprises
• Large Enterprises
• Small tomediumenterprises

Future First Technologies Ltd | 12th April 2021 9
State of the Assets – Australia
Since 2012, the Australian Local Government Association (ALGA) has compiled a self-assessment survey of
local government infrastructure performance and management practices4. The last survey was undertaken
in 2018 and there is now one currently underway. Around 75% or 408 local governments across Australia
participated in the 2018 survey which identified that the need for investment in infrastructure exceeds
A$30b and is likely to continue to grow to meet productivity and safety requirements. The survey found that
the replacement cost of these assets is estimated to be A$426b with roads by far the biggest category at
A$136b to replace. It also found that asset and risk management plans are an essential for local
governments to achieve their productivity and risk targets, but unlike New Zealand, Australian local
governments are not mandatorily required to have an asset management plan in place. As the following
exhibit from the survey report demonstrates, each asset class has varying degrees of asset management
plans in place.
Exhibit 6: Asset Management Plans in place by asset class
Asset Class Yes No Out of Date Not Applicable Response
Roads 82% 13% 5% - 80% Building & Facilities 70% 23% 8% - 66% Parks & Recreation 61% 34% 5% - 64% Stormwater 64% 31% 4% 1% 64% Water & Wastewater 31% 53% 2% 14% 59% Airports & Aerodromes 15% 66% 2% 17% 58%
Source: 2018 National State of the Assets report, Australian Local Government Association
As the two exhibits following show, despite a slight increase in 2015, the proportion of Road Asset
Management Plans in place is the same as it was in 2012 at 82%. So 18% of local governments do not have
an asset management plan in place for roads, or they are out of date. The proportion of Parks and
Recreation Asset Management Plans in place has declined from 72% in 2015 to 61% in 2017 and 39% state
they do not have a Parks and Recreation asset management plan in place or they are out of date. This
represents a significant opportunity for companies like Asset Vision to provide the systems to track and
manage these assets.
Exhibit 7: Asset Management Plans in place for roads Exhibit 8: Asset Management Plans in place for parks and recreation
Source: 2018 National State of the Assets report, Australian Local Government Association
Source: 2018 National State of the Assets report, Australian Local Government Association
Competitive landscape
Asset Vision sits across both asset and field service management solutions and as a consequence is
competing with both global players such as Oracle, Salesforce, IBM and SAP and listed and unlisted local
players. The market appears to be highly fragmented with online marketplace vendor Capterra listing more
than 100 enterprise asset management software solutions. Some of these solutions are from Asset Panda,
Maintenance Connection, Smartsheet and Upkeep. Then there are local players such as Damstra (ASX:DTC),
Cosol (ASX:COS), and TechnologyOne (ASX:TNE) in asset management and/or field service management
solutions.
4 National State of the Assets, 2018, Australian Local Government Association

Future First Technologies Ltd | 12th April 2021 10
There has been some consolidation in the sector over the past two years with companies such as Salesforce
and Oracle respectively acquiring Click (US$1.35b) and Aconex ($1.6b). Oracle paid 9.7x revenue for Aconex.
Other recent acquisitions include Assetic by Dude Solutions, Asset Edge by Civica and RAMM Software by
Think Project. Asset Edge was a privately owned Melbourne based asset management solutions provider to
local councils. Asset Vision recently replaced Asset Edge at Transport for NSW. Ventia Services Group has
started using Asset Vision, having previously been a user of Pitney Bowes’ Confirm EAM platform.
Peer Comparison
We see Damstra Holdings (ASX:DTC), Technology One (ASX:TNE), Cosol (ASX:COS) and SenSen Networks
(ASX:SNS) as the closest Australian listed peers to Asset Vision. We discuss these below.
Damstra
Damstra is an Australian-based provider of integrated workplace management solutions including asset
management solutions covering multiple industry segments. The company has its origins in the mining
contracting sector where it created a field service management solution. Damstra sells integrated hardware
and software as a service (SaaS) solutions in industries where compliance and safety across workforce and
assets is paramount. In June 2020, Damstra acquired Smart Asset Software, which has developed a suite of
enterprise asset management solutions across web browser and mobile applications. These solutions
integrate with Microsoft Office to plan maintenance schedules for field services. Smart Asset’s clients
include the ACT Emergency Services Agency, TasPorts, Forico Future Fibre (Tasmania’s largest private forestry
management company) and Antartica New Zealand.
We have set out in the following exhibit, Damstra’s historical earnings profile to provide some insight into
the leverage that a SaaS company in this space. Damstra listed on the ASX in October 2019. Note that while
the gross profit margin has declined from the levels achieved in FY17 and FY18 (due mainly to acquisitions)
the EBITDA margin has improved over the past three years.
Exhibit 9: Damstra Holdings historical earnings (in A$m unless otherwise stated)
Year ending June 30 FY17 FY18 FY19 FY20*
Licence fees 5.8 7.9 11.8 15.2 Hardware 1.2 1.4 2.0 4.4 Other 1.3 1.2 1.5 1.0 Total Revenue 8.3 10.5 15.3 20.6 Gross Profit 6.4 7.4 8.9 14.1 GP margin 77% 70% 58% 68% EBITDA 3.0 2.4 1.8 6.8 EBITDA margin 36% 23% 12% 33%
Source: Damstra prospectus, annual reports *Pro forma result
Cosol
Brisbane-based Cosol is a global enterprise asset management software solution focused on energy &
utilities, mining & minerals processing, defence, oil, gas & petrochemical and public infrastructure. The
company also has operations in Denver, Colorado. Cosol services its 68 corporate and government clients
using both proprietary technology and EAM-industry recognised solution providers such as Ellipse ABB, SAP,
IFS, Microsoft and IBM. Its clients include Energy Queensland, Transgrid, Queensland Urban Utilities, the
Australian Government Departments of Defence and Finance, Glencore, Anglo American, Newcrest Mining,
Ok Tedi Mining, Oz Minerals and St Barbara. The company listed in January 2020, and has subsequently
delivered better than forecast group EBIT of $3.93m (versus prospectus of $3.72). Again the exhibit below
shows the operating leverage that this sort of business has as revenues grow.
Exhibit 10: Cosol’s revenue and EBIT performance FY18-FY20 (in A$m)
Year ending June 30 FY18 FY19 FY20
Revenue 7.4 13.5 22.2 EBIT 0.7 2.8 3.9 EBIT margin 10% 20% 18%
Source: Cosol Annual Reports/Prospectus, RaaS analysis

Future First Technologies Ltd | 12th April 2021 11
TechnologyOne
Brisbane-based TechnologyOne is a global Enterprise Resource Planning (ERP) software platform which
encompasses asset management as part of its overall offering. TechnologyOne has been listed on the ASX
since 1999 and has locations across Australia, the UK, New Zealand, South Pacific and Asia. It services around
540 customers, with many of these in local government, State Governments, health and community
services, educational institutions and corporations. A big driver of the company’s success has been its
growing SaaS business, which has doubled every five years. SaaS ARR grew 32% in FY20 to $134.6m and the
company has a stated aim to grow this to $200m by FY26. As the following exhibit demonstrates,
TechnologyOne’s Gross profit margin has consistently been in the high 80% and EBITDA has been growing
consistently over the past three financial years, despite the relative maturity of the business.
Exhibit 11: TechnologyOne historical earnings (in A$m unless otherwise stated)
Year ending September 30 FY17 FY18 FY19 FY20
SaaS and Consulting Revenue 231.2 221.1 241.8 269.8 Other Revenue 42.1 33.4 44.4 29.2 Total Revenue 273.3 254.5 286.2 299.0 Gross Profit 237.2 216.6 246.0 259.7 GP % Margin 87% 85% 86% 87% EBITDA 61.1 31.0 81.1 101.8 EBITDA % 22% 12% 28% 34%
Source: Company Reports, Refinitiv Eikon, RaaS Analysis
SenSen Networks
Melbourne-based SenSen Networks delivers AI-powered asset monitoring, productivity and safety solutions
to governments and corporates. The multi-patented SenDISA platform gathers data from multiple live
camera feeds as well as data from disparate sensors such as GPS, Lidar and other IoT devices in real time and
then analyses the data to find patterns and trends. The company is focused on two market segments: roads
and parking with customers in city councils, toll companies and parking management operators; and
buildings and spaces with customers in casinos, airports, retail stores and shopping centres. Its client base
spans councils such as Brisbane City and Logan City councils in Queensland, Hills Shire and City of Port
Stephens in New South Wales; corporates such as Crown Casino in Melbourne and airport operators such as
Changi in Singapore.
Peer Comps
We have examined a range of Australian listed SaaS companies delivering asset management/field services
solutions to get a sense of the EV/Revenue multiples, revenue growth rates and EBITDA margins these
companies deliver. In additions to the EAM companies discussed above, we have included SaaS companies
Class and Elmo as they deliver elements of asset management and /or field service solutions in their
platforms. These companies are further along in their lifecycle than Asset Vision and with maturity are
delivering EBITDA margins ranging from 25-41%. Some observations: Damstra also provides hardware as
part of its solution, which has a lower margin than the traditional SaaS business; Cosol is earlier stage and
less mature than the other peers and therefore its EBITDA margin is reflective of an earlier stage company.
Exhibit 11: Asset Vision peer comparison
Company Code Market cap
(A$m)
Enterprise Value (A$m)
EV/Revenue
(x)
EV/Revenue fwd
(x)
Revenue CAGR 4 years
EBITDA margin
(last yr)
Class Ltd CL1.AX 209 204 4.6 3.8 10.8% 41.2% Cosol Ltd COS.AX 94 88 7.2 na 31.0% 25.1% Damstra Holdings Ltd DTC.AX 215 211 10.2 7.0 20.5% 33.0% ELMO Software Ltd ELO.AX 463 342 6.8 0.1 31.8% na SenSen Networks SNS.AX 98 97 25.7 na 157.6% na TechnologyOne Ltd TNE.AX 3,057 2,961 9.9 9.3 2.4% 34.1% Median
210 205 8.6 5.4 25.75% 33.6%
Source: Refinitiv Eikon Prices at 9th April 2021

Future First Technologies Ltd | 12th April 2021 12
The opportunity
Asset Vision’s clients currently are predominantly Australian government authority owners and their
contractors overseeing road assets. It is a fragmented market in terms of EAM software suppliers and the
opportunity for Asset Vision is to pick up more local government clients and contractors from recently
acquired competitors such as Asset Edge (which has more than 130 local councils on its books paying around
$40k a year in licence fees). There is also an opportunity for Asset Vision to secure additional State
government contracts in other Australian states and territories. For example, Queensland’s road asset
maintenance contract which includes road network stewardship, road maintenance and construction, and
road and pavement design, was awarded to Fulton Hogan and RoadTek (a division of the Queensland
Department of Transport & Main Roads) in April 2019. This contract is a 5year +1 +1 +1 arrangement. Fulton
Hogan is already a client of Asset Vision and this may be of assistance in the future.
Roads, however, this is just one asset class owned by government authorities. The company has ambitions to
expand into Parks and Open Spaces, Rail, Utilities, and Buildings asset management and will seek to do this
by leveraging its current government and contractor relationships.
RaaS’s earnings forecasts for Asset Vision
We set out our earnings forecasts for Asset Vision in the following exhibit. Key assumptions in our modelling
include:
We have estimated a potential SaaS contract pipeline of $0.13m in FY21, $0.48m in FY22 and
$1.2m in FY23, $2.03m in FY24 and $2.69m in FY25 with a 30% win rate on this pipeline;
The professional services pipeline (which is tied to the SaaS customers) is estimated to be $0.12m
in FY21, $0.42m in FY22, $1.05m in FY23, $1.77m in FY24 and $2.35m in FY25 with a 30% win rate
on this pipeline;
We assume an 8% churn rate, although to date Asset Vision’s customers have been sticky;
COGS is mostly IT hosting and development which we estimate at 3% of sales;
Employee costs are forecast to grow at a CAGR of 16% from FY21-FY30, with a significant uplift in
employees in FY21;
Operating costs are forecast to grow at a CAGR of 9% from FY21-FY30.
Exhibit 13: RaaS earnings estimates for Asset Vision FY20a FY21f* FY22f FY23f FY24f FY25f
Contracted revenue 1.349 1.404 1.488 1.856 2.663 3.981 Professional services income 0.243 0.245 0.377 0.771 1.545 2.760 Other income 0.017 0.008 0.018 0.020 0.022 0.024 Total Revenue 1.609 1.657 1.883 2.647 4.230 6.765 Gross profit 1.565 1.609 1.829 2.571 4.108 6.570 GP margin 97.3% 97.1% 97.1% 97.1% 97.1% 97.1% Employee costs 0.964 1.366 1.851 2.091 2.530 3.061 Other operating costs 0.173 0.186 0.205 0.226 0.250 0.275 EBITDA 0.429 0.057 (0.227) 0.254 1.328 3.234 EBITDA Margin 26.6% 3.4% (12.1%) 9.6% 31.4% 47.8%
Source: RaaS estimates *Pro Forma forecast assuming ownership for full year

Future First Technologies Ltd | 12th April 2021 13
Farmbuy.com
Future First Technologies acquired the rural and lifestyle property portal in April 2020 as part of the $4.5m
Respring acquisition. Farmbuy.com was created to be a dedicated, specialist portal for buying and selling
rural property. This was expanded to lifestyle properties as a result of agent demand.
History
Farmbuy.com was founded in October 2009 by Philip Sondhu, a farmer and tech innovator, and is a
dedicated rural property real-estate web portal. The site delivered a number of rural specific features
including the ability to search by weather district and land size and farm income/production calculations to
help work out the production and income capability of the property. The portal was designed to
complement and enhance agents’ rural property marketing, deliver a qualified audience to agents, vendors
and advertises keen to access people seeking to buy rural properties. In 2016, Mr Sondhu sold the site to
Bauer Media Group which owns some complementary trader publications including Farms & Farm
Machinery. Respring Pty Ltd acquired farmbuy.com from Bauer Media in 2018.
Business model
Farmbuy.com generates revenue from listing fees from agents and advertising. It currently has more than
380 agencies (with around 1,270 agents) actively listing rural and lifestyle properties, and there are around
3,000 listings on the site at any given time with a listing value of around $1b. With an estimated 1,400 real
estate agencies selling rural and lifestyle properties, farmbuy’s current penetration rate is around 30%.
Agencies pay a monthly subscription fee to list their properties, we estimate the average fee per month is
$200 per agency. Agencies also have the option of paying extra to upgrade the placement of a particular
property listing, and we estimate an average upgrade cost of $150 per listing. The company also generates
revenue from advertising, charging a cost per thousand impressions (CPM) of $20 per ad. Currently user
sessions are around 200k per month and page views are at 600k per month, suggesting at least 3 pageviews
per session. Farmbuy.com also can generate revenue from financial partnerships with lending institutions.
Competitive landscape
Farmbuy.com competes against the broader real estate portals, commercialrealestate.com.au,
domain.com.au and realestate.com.au for listing fees. Domain carries the most rural and lifestyle properties
at around 17,000 currently, while realestate.com.au has around 8,500 listings and
commercialrealestate.com.au just over 4,700 listings. We observed a fair bit of crossover amongst these
listings and it looks like Domain’s listings capture residential houses as well. Rural listings on
realestate.com.au are simply included in its broader buy category. The opportunity for farmbuy use its
categorisation of farm type and size to capture a greater share of agencies and listings.
Exhibit 14: Rural Property Listings by portal
Property portal Number of rural property listings
commercialrealestate.com.au 4,700 domain.com.au 17,000 farmbuy.com 3,000 realestate.com.au 8,500
Source: RaaS analysis, listings as at 19 March 2021
Broader Opportunity
Farmbuy has ambitions to develop adjacent verticals relevant to farm purchases. These verticals have the
potential to deepen farmbuy’s relationship with the rural property purchaser, which ultimately should
attract more agencies, more listings and more, and potentially returning, buyers. These verticals include
livestock sales, agricultural machinery, agricultural supplies and clearance sales. Ultimately, farmbuy plans to
Future First Technologies Ltd | 12th April 2021 14
become an end to end rural marketplace, something which does not exist in Australia today. We have not
captured this in our current forecasts, but to give a sense of the scale of the opportunity:
Around $55m was generated in cattle and lamb livestock auction sales in FY20 with just under 15%
(and growing) generated online from non-commission related selling fees. This was from 4.5m
animals. A $5 online listing fee equates to a $2.2m a year revenue opportunity;
Australia’s new agricultural machinery market was US$1.27b in 2018 and is forecast to grow at
5.8% a year to 20235 and there are more than 100,000 second-hand machines listed for sale each
year with an average listing costs of $50 which equates to at least a $5m revenue opportunity;
Australia has more than 1,500 farm clearing sales a year with an average value of $200,000 and an
average buyers’ premium of 7.5%, this is an estimated total market opportunity of $22.5m.
It should be noted that there are a number of players already competing for farm clearing sales and
machinery and farm equipment sales so it may be logical for farmbuy.com to acquire one or more existing
operators to create its end to end rural marketplace.
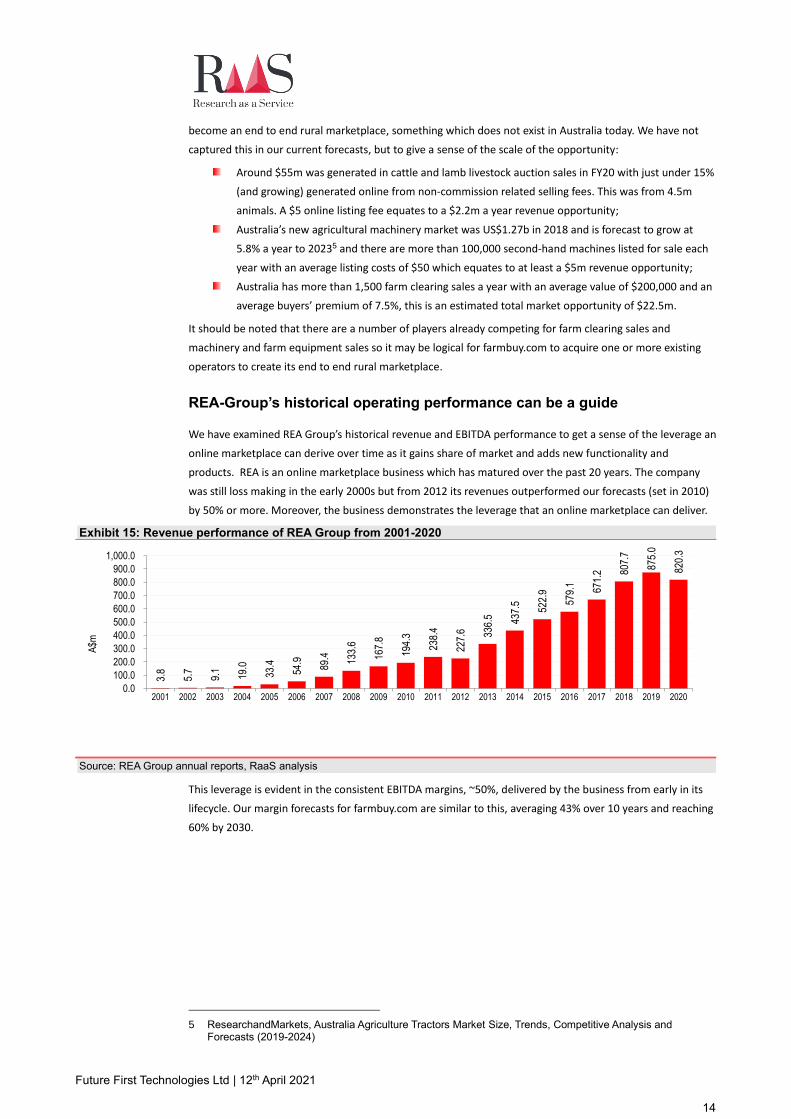
REA-Group’s historical operating performance can be a guide
We have examined REA Group’s historical revenue and EBITDA performance to get a sense of the leverage an
online marketplace can derive over time as it gains share of market and adds new functionality and
products. REA is an online marketplace business which has matured over the past 20 years. The company
was still loss making in the early 2000s but from 2012 its revenues outperformed our forecasts (set in 2010)
by 50% or more. Moreover, the business demonstrates the leverage that an online marketplace can deliver.
Exhibit 15: Revenue performance of REA Group from 2001-2020
Source: REA Group annual reports, RaaS analysis
This leverage is evident in the consistent EBITDA margins, ~50%, delivered by the business from early in its
lifecycle. Our margin forecasts for farmbuy.com are similar to this, averaging 43% over 10 years and reaching
60% by 2030.
5 ResearchandMarkets, Australia Agriculture Tractors Market Size, Trends, Competitive Analysis and Forecasts (2019-2024)
3.8
5.7
9.1
19.0
33.4
54.9
89.4
133.
6
167.
8
194.
3
238.
4
227.
6 336.
5 437.
5
522.
9
579.
1
671.
2 807.
7
875.
0
820.
30.0
100.0
200.0
300.0
400.0
500.0
600.0
700.0
800.0
900.0
1,000.0
2001 2002 2003 2004 2005 2006 2007 2008 2009 2010 2011 2012 2013 2014 2015 2016 2017 2018 2019 2020
A$m

Future First Technologies Ltd | 12th April 2021 15
Exhibit 16: REA Group’s EBITDA and EBITDA Margins from 2001-2020
Source: REA Group, RaaS estimates
Interestingly, REA Group added financial services to its offering in September 2017. This business, Smartline,
which is now 100% owned by the company, delivered revenue of $25.7m in FY20 and EBITDA of $10.05m.
This business generated an EBITDA margin of 39.1% respectively in FY18 and FY19 and 35.6% in FY19.
Rival Domain Group launched Domain Loan Finder in FY19. Reporting under Consumer Solutions, revenue
from this division increased 83% in FY20 to $5.6m due to the strong growth in Domain Loan Finder from
both refinancing and new home loans, and the EBITDA loss reduced to $3.6m from $8.6m the year before.
Online search/marketplace companies
We have examined four Australian online marketplaces as guides for farmbuy’s operating metrics. We
include carsales and icarAsia as both are focused on automobile sales, and REA and Domain.
Carsales.com Ltd is Australia’s dominant online auto (automotive, motorcycle and marine) classifieds
business with operations across the Asia Pacific and interests in online automotive classified businesses in
Brazil, South Korea, Malaysia, Indonesia, Thailand and Mexico. It generates revenue from online display and
classifieds (listings) advertising in Australia and internationally as well as from data and research services.
Data, Research and Services-Australia, International Segments, Latin America (LATAM) and Asia.
Domain Holdings Australia Limited (Domain) is a real estate technology and services business focused on
the Australian property market. Domain offers residential and commercial property marketing services via its
listing portals on desktop and mobile, and via social media and print magazines. In addition to operating
residential and commercial real estate portals, Domain provides data and technology services to real estate
agencies through customer relationship management (CRM) services, property data and research
subscriptions, and property inspection management tools. The print segment includes real estate newspaper
and magazine publishing.
iCarAsia, is an Australian listed but ASEAN focused network of automotive classifieds portals with operations
in Malaysia, Indonesia and Thailand. The company allows both motor vehicle dealers and private individuals
to list cars for sale. The company’s online properties currently reach more than 4.8m car buyers and sellers a
month.
REA-Group Ltd is a leading global digital business specialising in property. The company owns the leading
residential property portal in Australia, realestate.com.au, and commercial property portal,
realcommercial.com.au, as well as the leading share property site, flatmates.com.au. The company also
-2.8 -0.8
1.1 2.7 6.5 16.0 30.3 46.6 62.5 78.0103.2
126.0163.9
225.1
285.8
347.5385.3
471.5515.3
492.1
-80%
-60%
-40%
-20%
0%
20%
40%
60%
80%
-100.0
0.0
100.0
200.0
300.0
400.0
500.0
600.0
2001 2002 2003 2004 2005 2006 2007 2008 2009 2010 2011 2012 2013 2014 2015 2016 2017 2018 2019 2020
% E
BIT
DA
MarginA
$M
EBITDA EBITDA Margin %

Future First Technologies Ltd | 12th April 2021 16
owns property portals in Malaysia, iproperty.com.my, in Hong Kong, squarefoot.com.hk, in China,
myfun.com, and in Thailand, thinkofliving.com. The company has also expanded into transactional services,
with the ownership of Smartline Home Loans, a mortgage broking franchise group, and Hometrack Australia,
a provider of property data services. REA also owns holdings in several property websites in other markets.
As the following exhibit shows, this peer group is currently trading on a median forward EV/Rev of 10.9x,
forward EV/EBITDA of 28.1x and forward PER of 62.6, high multiples considering the established position of
these companies and the relatively modest revenue growth they have delivered over the past five years.
Exhibit 17: Online search/marketplace portals
Company Name Code Market Cap
(A$m)
EV (A$m) EV/Rev last
(x)
EV/Rev Fwd (x)
EV/
EBITDA last (x)
EV/
EBITDA Fwd (x)
PER Last
(x)
PER Fwd
(x)
5 Year Rev
growth
5 year EBITDA margin
Carsales.Com CAR.AX 4,629 5,054 12.8 11.8 23.9 20.6 33.5 32.5 3% 52% Domain Hlgs DHG.AX 2,721 2,876 10.8 10.1 33.7 29.9 126.5 91.0 18% 31% Icar Asia ICQ.AX 135 136 9.7 6.2 na na na na 16% na REA-Group REA.AX 20,179 20,284 23.0 22.8 41.3 37.5 75.2 62.6 9% 55% Median
3,675 3,965 11.8 10.9 33.7 29.9 75.2 62.6 12% 52%
Source: Refinitiv Eikon, RaaS analysis, prices at 9 April 2021. “Last” refers to the last reported, Fwd refers to consensus forward estimates *based on 4 years
RaaS’ earnings estimates for farmbuy.com
Our earnings estimates for farmbuy.com are set out in the following exhibit. Key parameters that we have
applied include:
Penetration rate of agencies to grow from 20% to 65% (910 agencies) by FY25;
Listings to increase to 16,000 by FY25 from 3,000 currently;
Ad inventory utilisation rate of 80%;
$11 CPM, 30% payable to advertising agency, 3 ads per page;
User sessions increase from 200k per month to 310k per month by FY25;
Pageviews per user remain at 3 per session;
Agencies subscriptions per month grow at 10% a year;
Percentage of listings upgrading grow from 2% to 18% by FY23;
Farmbuy generates partnership revenue of $2,000 per lead
Our forecasts for the next three financial years are set out below.
Exhibit 18: Earnings estimates for farmbuy.com FY21f FY22f FY23f FY24f FY25f
Advertising revenue 0.05 0.15 0.17 0.18 0.20 Listings revenue 0.01 0.31 0.71 0.97 1.27 Upgrade revenue 0.02 0.28 0.73 1.42 2.44 Partnership revenue 0.01 0.02 0.02 0.02 0.02 Total Sales Revenue 0.09 0.76 1.63 2.60 3.93 Gross profit 0.06 0.53 1.14 1.82 2.75 GP margin 70% 70% 70% 70% 70% Employee costs 0.56 1.18 1.25 1.32 1.40 Marketing costs 0.05 0.12 0.13 0.14 0.15 Other operating costs 0.11 0.23 0.24 0.25 0.27 EBITDA (0.66) (0.98) (0.47) 0.11 0.93 EBITDA margin
4% 24%
Source: RaaS estimates

Future First Technologies Ltd | 12th April 2021 17
1derful
Future First Technologies has invested $2.75m in two convertible note series raised by fintech start up
1derful. We incorporate these notes at face value in our valuation.
1derful is a fintech aiming to deliver radical change to consumer banking by bringing everything financial
into one single, controllable, on-demand ledger. With open-banking at its core, 1derful is leveraging the
emerging “as a service” infrastructure to build a lean, scalable, global banking system. Founded by Luke
Bunbury and Katarina Novakovic, 1derful has brought together some of the most experienced finance and
digital venture executives to create this new platform and we are of the view that it is worth setting out their
experience.
Luke Bunbury’s career has spanned banking (Citibank, St George and Challenger Bank) and tech startups
(PlayUp, MyEmergencyDoctor and Volt Bank). Katarina Novakovic is an experienced lawyer, advising several
digital fintech startups and banking institutions, in a career that has spanned roles at Deloitte, DLA Piper and
PwC. 1derful’s finance lead Craig Williams was one of Australia’s leading equity analysts with Citigroup and
before that Merrill Lynch specialising in the Banking and Financial Services sectors while product &
partnerships lead Zoran Novakovic brings domestic and global financial banking experience from a multi-
decade career in financial services at both Citigroup and Morgan Stanley.
Tech and engineering lead Jeeva Suresh has worked with more than 20 ventures in their formative years
including Google, Canva, Qwir, and Linesoft. Credit and financial risk lead Tim Dickson brings several years’
experience in senior roles at Experian, EY, Teradata and Westpac while product/marketing lead George
Tomeski has founded and led two multi-national ad agencies as well as several technology ventures.
Group earnings forecasts
At this point, our forecasts only include the fully consolidated businesses, Asset Vision and farmbuy.com, and
our assumptions for corporate costs. We estimate these to be currently just under $2m a year and have
assumed that they will increase by 6% a year. The following exhibit sets out our forecasts for the full group.
We have included FY25 forecasts to demonstrate that it is our expectation that the group as a whole will be
profitable that year.
Exhibit 19: Breakdown of RaaS assumptions and forecasts (in A$m unless otherwise stated)
Year ending June 30 FY21 FY22 FY23 FY24 FY25
Revenue 1.19 2.65 4.27 6.83 10.70 Gross Profit 1.14 2.36 3.71 5.93 9.32 Other income 0.78 - - - - EBITDA (3.24) (3.25) (2.38) (0.86) 1.73 EBIT (3.98) (3.67) (2.76) (1.21) 1.41 NPAT Adj (4.66) (3.66) (2.43) (0.89) 0.95 NPAT Reported (10.22) (3.66) (2.43) (0.89) 0.95 EPS Adj (1.70) (0.91) (0.61) (0.28) 0.21
Source: RaaS estimates

Future First Technologies Ltd | 12th April 2021 18
SWOT analysis
In our view the strengths and opportunities for Future First Technologies outweigh the weaknesses and
threats.
Exhibit 20: SWOT Analysis
Strengths Opportunities
Board and management team are experienced at building and successfully selling businesses
Opportunity to expand the ownership of 1derful either through additional convertible notes or acquisition
Core businesses, Asset Vision and farmbuy.com, are both highly scalable businesses with predominantly fixed cost base
Opportunity to leverage farmbuy.com’s audience into new verticals including other rural transactions
(livestock, farm machinery, clearing sales)
Clean balance sheet, no debt Opportunity to expand Asset Vision’s platform into other jurisdictions
Demonstrated focus on delivering shareholder returns (share buyback) Asset Vision’s platform can be adapted to new industries ie open spaces, rail, utilities, building
management
Asset Vision’s customers, once secured, are sticky Balance capacity to acquire other SaaS opportunities
GP margins for both Asset Vision and farmbuy.com are 90%+
New management team and board, no legacy issues
Acquisitions have retained and re-engaged the founders
Weaknesses Threats
Acquisitions invariably result in deferred consideration liabilities REA Group and Domain could increase their focus on
rural/lifestyle properties
Long lead times for contracts from Asset Vision’s target market Asset Vision’s biggest competitors are global players such as Oracle and Salesforce and larger ASX-listed
companies such as Damstra and Cosol
Possibility that the market will apply a holding company discount
Source: RaaS Analysis
Sensitivities
We highlight several sensitivities to Future First Technologies’ business:
Execution risk: Our forecasts and valuation are predicated on the management team’s ability to build to
two very different SaaS businesses.
Acquisition risk: Investors are dependent on management and the board’s ability to identify and
acquire businesses without overpaying for the businesses.
Key person risk: We see the senior management team as crucial to the success outcome of the
company’s strategy. Loss of the CEO, CFO, COO and CPO would impact on Future First’s ability to
execute the business plan.

Future First Technologies Ltd | 12th April 2021 19
Board and management Directors Renata Sguario , Non-Executive Chairman, became a director in September 2019 and chair in November
2019. Ms Sguario is an experienced senior executive with almost three decades specialising in customer
centred, technology-led, business transformation at leading companies in Australia and offshore. She has
held operational leadership roles at British Airways, Telstra, EDS Australia, NAB, and Latitude Financial
Services where she has been responsible for delivering large scale business and IT change, process
optimisation, productivity lifts while navigating strategic and operational risks in highly regulated
environments. Ms Sguario holds a Bachelor of Computer Science and Information Management from the
University of Melbourne and holds a Level 1 & 2 certificate from the Institute of Executive Coaching. She is
also the founder and CEO of MaxMe, a company she founded in June 2019 to solve the skills gap between
students and young people starting their career.
Nicole Ferro, Non-Executive Director was appointed director in January 2020. Ms Ferro brings a wealth of
experience across the telecommunications, technology, supply chain logistics and transport industries having
held change leadership roles at Toll Group, Telstra, and Aconex, She has a Master of Business (Management
Practice, Change Management & Organisation Development) from Victoria University.
Nicholas Chan, Non-Executive Director, became a director in August 2020. Mr Chan is currently Non-
Executive Chairman of ASX-listed BetMakers Technology Group (ASX:BET), a global SaaS wagering platform.
He has more than 30 years’ experience in senior leadership and operational roles in media across Australia
and New Zealand including Group Chief Operating Officer for Seven West Media (ASX:SWM) where he also
previously served as CEO of Pacific Magazines. At Seven, he was a director of the Yahoo7! Joint venture, and
a director of its healthengine.com.au start up. Mr Chan was CEO of ASX-listed Text Media Group which was
acquired by Fairfax Media in 2006. He began his media career at ACP Publishing (owned by Publishing and
Broadcasting) where he rose to become Group Publisher and Group Chief Operating Officer. He holds a
Bachelor of Business (Commerce) from University of NSW.
Keith Falconer, Managing Director and Chief Executive Officer, was appointed Group CEO in November
2020. Mr Falconer was a director of Respring Pty Ltd which FFT acquired in April 2020. He brings more than
30 years’ experience in print and digital media, in particular special interest, B2B and classifieds markets and
has a proven track record of developing digital assets for a successful sale. Mr Falconer was previously CEO
of Bauer Trader Media and before that Trader Classified Media which Bauer Media acquired. He oversaw the
sale of the PBL Motoring and Classifieds products to Carsales.com.au and Bauer RV and travel assets to
Adventure Group Holdings.
Management Keith Falconer, Chief Executive Officer, (see above).
Vesna Jelesic, Chief Financial Officer/Company Secretary, joined FFT (then PS&C) in 2016 as General
Manager – Finance and Administration and was appointed Chief Financial Officer in April 2020. Ms Jelesic
has an extensive background in all facets of finance and administration having held senior positions at Bank
Australia, NAB, ANZ, and KPMG. She is a Certified Practising Accountant and holds a Bachelor of Commerce
with majors in Accounting, Finance and Commercial Law from Deakin University.
Lucas Murtagh, Head of Operations, was appointed to his position in November 2020; he is also the Head of
Operations for both Asset Vision (since November 2020) and farmbuy.com (since March 2018). Mr Murtagh
is a co-founder of Respring, now wholly owned by FFT. He brings more than 15 years’ experience in digital
transformation across large enterprises including Sensis, ANZ, Telstra, NAB, AXA and Ventia. Mr Murtagh was
the founding partner of MethodGroup, an IT professional services firm, which was listed as a BRW Fast
Starter in 2013 and subsequently acquired by RXP Services Ltd (ASX:RXP) in September of that year. Prior to

Future First Technologies Ltd | 12th April 2021 20
this Mr Murtagh was responsible for both strategic planning and delivery of transformation initiatives at
Trader Media from 2005 to 2008.
Paul Fielding, Head of Mergers & Acquisitions took on his role in November 2020. He previously was the
General Manager of Operations at RXP Services a position he held for seven years, CEO of Ingena Group for
almost five years and Regional Manager of CPT Global for three years. Within these roles Mr Fielding was
responsible for the creation and implementation of the overall business plan as well as driving strategy for
these businesses.
Damien Smith, Chief Product Officer, Future First Technologies, was appointed to his role in November
2020 after the acquisition of Asset Vision, the company he founded. Mr Smith brings more than two decades
of managing and operating enterprise-focused SaaS companies. He established SyncIT Development in early
2002 and this company became the precursor to Asset Vision which was founded in 2013.
Robyn Murphy, Chief Information Officer, Future First Technologies, joined the company in November 2020
and is also CIO for Asset Vision. Ms Murphy holds a Masters in Business (Sports) and brings almost 20 years’
experience as an ICT strategy leader in enterprise and government across a number of sectors. She has held
senior consulting positions at KPMG, Sonic Healthcare, Telstra, Pacific National, and through MethodGroup
and RXP Services, was lead consultant on a range of projects spanning utilities, banking and healthcare. Ms
Murphy also had a long stint at VicRoads where she was Director of ICT Strategy and acted in the role of CIO.
Most recently she was a Director at data cloud company purplefish.com.au.
Chris Wignall, Head of Sales and Distribution, joined the company in November 2020. He is a highly skilled
sales leader with over 20 years’ experience in sales, account management and digital solutions. He has a
proven track record of building strong relationships with multinational clients, generating new sources of
profitable revenue with an enviable track record of exceeding KPIs across the Software and Digital Consulting
industries. Chris joined FFT from RXP Services Ltd (ASX:RXP) where he was responsible for growing digital
revenue across multiple industries and is responsible for driving revenue in the Asset Vision business both
locally and internationally.
Royce Zygarlicki, Head of Sales, farmbuy.com, commenced his role in February 2021 and brings more than
20 years’ experience in agency and direct sales, having previously held senior positions at Network Ten
where he was General Sales Manager and Newscorp Australia, where he was General Manager, Agency Sales
– Melbourne and WA. Mr Zygarlicki also previously held the position of Managing Director at Wavemaker.

Future First Technologies Ltd | 12th April 2021 21
DCF Valuation
We have used the discounted cashflow methodology to value Future First Technologies arriving at a base
case valuation of $69.2m or $0.17/share on the current share count. Our terminal value accounts for
$0.14/share in the valuation. The valuation captures a CAGR in revenues of 46% from FY21-FY30.
Exhibit 21: DCF valuation
DCF valuation Parameters
Discount Rate / WACC 13.4% Beta 1.8 Equity Risk Premium 6.5% Risk Free Rate 2.0% Terminal growth rate 2.2%
Sum of PV (A$M) 10.5 PV of terminal Value (A$m) 46.7 PV of Enterprise 57.1 Net cash at 31 December 2020 (9.3) Convertible note in 1derful 2.8 Net Value - Shareholder 69.2 No of shares on issue 400.4 NPV in A$ $0.17
Source: RaaS Analysis
Scenario analyses
We have explored a number of scenarios in our modelling, all of them subject to performance by Future First
as is our base case valuation. These scenarios are set out below:
A Downside case ($0.02/share):
Asset Vision converts only 20% of its professional services pipeline and 20% of its licencing
pipeline; the growth rate in the contract pipeline averages 24% to FY25; annual churn rate (the
number of contracts not renewing) is 10%; COGS are higher at 3.6%;
Farmbuy.com’s penetration rate of rural agents is 35% in FY25, return visitors are lower at 1.1x
user growth is lower at an average of 2%; inventory utilisation is 50%; on average only 10% of
listings upgrade; COGS are higher at 32%
An Upside case ($0.45/share):
Asset Vision converts 40% of its pipeline of professional services and licences into clients, the
growth rate in the value of these contracts averages 48% to FY25, annual churn rate is 6%; COGS
are 2.5%, employee and operating costs grow at an average of 12% a year to accommodate the
higher revenue growth;
Farmbuy’s penetration rate of rural agents is 72% in FY25, return visitors are higher at 1.3x,
inventory utilisation is 90%; on average 28% of listings upgrade, COGs are lower at 28%.
Exhibit 22: Base case valuation, revenue and EBITDA forecasts versus downside/upside projections Base A Downside Case An Upside Case
DCF valuation/share $0.17 $0.02 $0.45 DCF valuation A$M 69.2 8.4 180.5 IRR% 32% Na 64%
Source: RaaS estimates

Future First Technologies Ltd | 12th April 2021 22
Look to SaaS companies for peer group
Future First Technologies’ revenues are now predominantly SaaS-generated and therefore, its comparable
peer group is SaaS companies. We have set out a number of Australian-listed SaaS companies in exhibit 23.
These companies are at varying points in their lifecycles, hence, the broad range of EV/Revenue and
EV/EBITDA multiples (where the company is profitable). Because of this variability we have included some
larger companies such as engineering design software group Altium and AI and machine learning company
Appen to give a sense of the multiples, margins and growth rates that these sorts of businesses can
generate. More mature SaaS companies such as Class and Infomedia are delivering consistent EBITDA
margins respectively of 45% and 39%, although revenue and EBITDA growth is lower than some of the
earlier stage peers, hence their lower EV multiples. These businesses however deliver substantially higher
EBITDA margins that the people exertion business that FFT has transitioned away from.
Exhibit 23: Australian SaaS peers
Company Code Market Cap ($m) Enterprise value ($m)
EV/
Revenue (x)
EV/
EBITDA ($m)
5 year EBITDA margin
3 year revenue
CAGR
3 year EBITDA
CAGR
Altium ALU.AX 3,583 3,503 18.4 48.5 35% 15.2% 20.0% Appen APX.AX 2,032 1,978 3.3 20.1 16% 40.1% 41.0% Betmakers Technology Group^ BET.AX 880 849 98.9 nm na 24.4% na Bigtincan Holdings BTH.AX 423 354 11.4 nm na 34.6% 9.1% Class CL1.AX 209 204 4.6 11.2 45% 14.1% 12.1% Damstra Holdings DTC.AX 215 211 10.2 171.0 8% 20.5% na Frontier Digital Ventures* FDV.AX 486 427 20.5 -99.1 na 58.2% na Icar Asia ICQ.AX 135 136 9.7 nm na 16.1% na Infomedia IFM.AX 616 518 5.5 11.5 39% 6.8% 15.1% Pointerra ^ 3DP.AX 390 388 315.4 nm na 115.9% 24.5% rhipe RHP.AX 296 238 4.3 19.0 19% 16.2% na Median
423 388 10.2 19.0 27.2% 20.5% 17.5%
Source: Refinitiv Eikon, RaaS analysis *adjusted for 100% of investee company revenues ^RaaS client
If we look at US SaaS companies, the multiples being paid there are substantially higher. The Software Equity
Group’s 3Q 2020 Snapshot estimated the SaaS sector was trading on an 11.2x EV/Sales multiple, which was
31% higher than the sector’s three-year average of the 8.5x. The US SaaS universe is substantially deeper
than Australia’s and the majority of the companies (54%) still lossmaking. Fewer than 8% of US SaaS
companies are delivering EBITDA margins of 30% and above. Gross profit margins however are consistently
above 71% which is where we see the target for Australian SaaS companies, FFT included.

Future First Technologies Ltd | 12th April 2021 23
Exhibit 24: Financial Summary
Source: RaaS Advisory
Future First Technologies (FFT) Share price (9 April 2021) A$ 0.07
Profit and Loss (A$m) Interim (A$m) H121F H221F H122F H222F H123F H223F
Y/E 30 June FY20A FY21F FY22F FY23F FY24F Revenue 1.0 0.9 1.1 1.5 1.9 2.4
Sales revenue 51.1 1.2 2.6 4.3 6.8 EBITDA (1.5) (1.7) (1.7) (1.5) (1.3) (1.0)
Total Revenue 54.5 2.0 2.6 4.3 6.8 EBIT (4.9) (2.0) (1.9) (1.7) (1.5) (1.2)
Gross Profit 51.1 1.1 2.4 3.7 5.9 NPAT (normalised) (5.6) (1.9) (1.9) (1.7) (1.5) (0.9)
EBITDA 5.2 (3.2) (3.2) (2.3) (0.8) Minorities 0.0 0.0 0.0 0.0 0.0 0.0
Depn (0.1) (0.0) (0.0) (0.0) (0.0) NPAT (reported) (11.2) (1.9) (1.9) (1.7) (1.5) (0.9)
Amort (0.4) (0.7) (0.4) (0.4) (0.3) EPS (normalised) (2.4) (0.5) (0.5) (0.4) (0.4) (0.2)
EBIT 4.6 (4.0) (3.6) (2.7) (1.2) EPS (reported) (2.4) (0.5) (0.5) (0.4) (0.4) (0.2)
Interest (1.1) (0.2) 0.0 (0.0) (0.1) Div idend (cps) 0.0 0.0 0.0 0.0 0.0 0.0
Tax 0.4 (0.5) 0.0 0.4 0.4 Imputation 0.0 0.0 0.0 0.0 0.0 0.0
Minorities 0.0 0.0 0.0 0.0 0.0 Operating cash flow (0.7) (2.1) (1.8) (1.6) (1.4) (1.2)
Equity accounted assoc 0.0 0.0 0.0 0.0 0.0 Free Cash flow (0.7) (2.1) (1.9) (1.6) (1.5) (1.2)
NPAT pre significant items 3.8 (4.6) (3.6) (2.4) (0.8) Divisions H121F H221F H122F H222F H123F H223F
Significant items (0.8) (5.6) 0.0 0.0 0.0 Asset Vision
NPAT (reported) 3.0 (10.2) (3.6) (2.4) (0.8) Revenue 0.2 0.9 0.9 1.0 1.2 1.5
Cash flow (A$m) Gross Profit na 0.8 0.9 1.0 1.1 1.4
Y/E 30 June FY20A FY21F FY22F FY23F FY24F EBITDA (0.0) (0.1) (0.1) (0.1) 0.0 0.2
EBITDA 5.2 (3.2) (3.2) (2.3) (0.8)
Interest (1.1) (0.2) 0.0 (0.0) (0.1) farmbuy
Tax 0.6 (0.1) 0.0 0.0 0.0 Revenue 0.0 0.1 0.2 0.5 0.7 0.9
Working capital changes (5.5) 0.7 (0.2) (0.2) (0.4) Gross Profit na 0.1 0.2 0.4 0.5 0.6
Operating cash flow (0.9) (2.8) (3.4) (2.6) (1.3) EBITDA (0.5) (0.7) (0.6) (0.4) (0.3) (0.2)
Mtce capex (0.1) (0.0) (0.1) (0.1) (0.1)
Free cash flow (1.0) (2.9) (3.5) (2.7) (1.3) Corporate costs (0.7) (1.0) (1.0) (1.0) (1.0) (1.1)
Growth capex (0.1) (0.0) (0.0) (0.0) (0.0) Group EBITDA (1.2) (1.7) (1.7) (1.5) (1.3) (1.0)
Acquisitions/Disposals 6.8 19.4 0.0 0.0 0.0
Other (0.1) (4.4) 0.0 0.0 0.0 Note that Asset Vision was only included from 2 November 2020
Cash flow pre financing 5.6 12.2 (3.5) (2.7) (1.4)
Equity 2.5 (6.3) 0.0 0.0 2.7 Margins, Leverage, Returns FY20A FY21F FY22F FY23F FY24F
Debt (10.3) 0.0 0.0 0.0 0.0 EBITDA 9.5% (162.7% ) (120.8% ) (54.5% ) (11.8% )
Div idends paid (0.5) (0.1) 0.0 0.0 0.0 EBIT 8.5% (200.3% ) (136.6% ) (63.4% ) (16.9% )
Net cash flow for year (2.6) 5.7 (3.5) (2.7) 1.3 NPAT pre significant items 7.0% (234.6% ) (136.4% ) (55.7% ) (12.4% )
Balance sheet (A$m) Net Debt (Cash) 0.5 6.3 2.8 0.2 1.6
Y/E 30 June FY20A FY21F FY22F FY23F FY24F Net debt/EBITDA (x) (x) 0.101 n/a n/a n/a n/a
Cash 1.5 7.2 3.7 1.0 2.4 ND/ND+Equity (% ) (% ) (1.4% ) (51.8% ) (23.6% ) (1.3% ) (12.1% )
Accounts receivable 7.1 0.2 0.4 0.7 1.1 EBIT interest cover (x) (x) 0.2 n/a n/a n/a n/a
Inventory 0.0 0.0 0.0 0.0 0.0 ROA nm (11.4% ) (16.4% ) (14.2% ) (6.1% )
Other current assets 2.5 0.1 0.1 0.1 0.1 ROE nm (36.7% ) (21.6% ) (17.4% ) (6.3% )
Total current assets 11.1 7.5 4.3 1.9 3.7 ROIC nm (34.8% ) (24.3% ) (45.1% ) (17.2% )
PPE 0.2 0.2 0.3 0.3 0.4 NTA (per share) 0.01 0.02 0.01 0.01 0.01
Intangibles inc Goodwill 31.5 9.9 9.9 9.9 9.9 Working capital 4.8 0.2 0.4 0.6 1.0
Investments 0.0 1.3 1.3 1.3 1.3 WC/Sales (%) 8.9% 9.6% 14.8% 14.4% 14.4%
Deferred tax asset 0.0 0.0 0.0 0.4 0.8 Revenue growth nm (96.4% ) 34.0% 61.5% 59.7%
Other assets 2.6 5.0 4.6 4.2 3.9 EBIT growth pa nm n/a n/a n/a n/a
Total non current assets 34.3 16.4 16.0 16.1 16.2 Pricing FY20A FY21F FY22F FY23F FY24F
Total Assets 45.4 23.9 20.3 18.0 19.9 No of shares (y /e) (m) 501 400 400 443 443
Accounts payable 2.3 0.0 0.0 0.1 0.1 Weighted Av Dil Shares (m) 340 400 400 400 443
Short term debt 0.5 0.5 0.5 0.5 0.5
Tax payable 0.0 0.1 0.1 0.1 0.1 EPS Reported cps 0.76 (2.88) (0.90) (0.59) (0.27)
Other current liabilities 4.8 4.1 4.1 4.1 4.1 EPS Normalised/Diluted cps 0.61 (1.69) (0.90) (0.59) (0.27)
Total current liabilities 7.60 4.67 4.71 4.76 4.81 EPS growth (norm/dil) n/a n/a n/a n/a n/a
Long term debt 0.4 0.4 0.4 0.4 0.4 DPS cps - - - - -
Other non current liabs 0.3 0.3 0.3 0.3 0.3 DPS Growth n/a n/a n/a n/a n/a
Total long term liabilities 0.69 0.71 0.71 0.71 0.71 Div idend y ield 0.0% 0.0% 0.0% 0.0% 0.0%
Total Liabilities 8.3 5.4 5.4 5.5 5.5 Div idend imputation 0 0 0 0 0
Net Assets 37.1 18.5 14.9 12.5 14.4 PE (x) 9.0 - - - -
PE market 18.4 18.4 18.4 18.4 18.4
Share capital 90.4 85.0 85.0 85.0 87.7 Premium/(discount) (51.3% ) (100.0% ) (100.0% ) (100.0% ) (100.0% )
Accumulated profits/losses (54.8) (68.0) (71.6) (74.0) (74.9) EV/EBITDA 6.5 (6.5) (7.6) 0.0 0.0
Reserves 1.5 1.5 1.5 1.5 1.5 FCF/Share cps (0.2) (0.7) (0.8) (0.6) (0.3)
Minorities 0.0 0.0 0.0 0.0 0.0 Price/FCF share (44.9) (9.9) (8.1) (11.8) (24.8)
Total Shareholder funds 37.1 18.5 14.9 12.5 14.4 Free Cash flow Yield (2.2% ) (10.1% ) (12.3% ) (8.5% ) (4.0% )

Future First Technologies Ltd | 12th April 2021 24
FINANCIAL SERVICES GUIDE
RaaS Advisory Pty Ltd
ABN 99 614 783 363
Corporate Authorised Representative, number 1248415
of
BR SECURITIES AUSTRALIA PTY LTD
ABN 92 168 734 530
AFSL 456663
Effective Date: 26th November 2018

Future First Technologies Ltd | 12th April 2021 25
About Us
BR Securities Australia Pty Ltd (BR) is the holder of Australian Financial Services License (“AFSL”) number
456663. RaaS Advisory Pty Ltd (RaaS) is an Authorised Representative (number 1248415) of BR.
This Financial Service Guide (FSG) is designed to assist you in deciding whether to use RaaS’s services and
includes such things as
- who we are
- our services
- how we transact with you
- how we are paid, and
- complaint processes
Contact Details, BR and RaaS
BR Head Office: Level 14, 344 Queen Street, Brisbane, QLD, 4000
RaaS. 20 Halls Road Arcadia, NSW 2159
P: +61 414 354712
RaaS is the entity providing the authorised AFSL services to you as a retail or wholesale client.
What Financial Services are we authorised to provide? RaaS is
authorised to
- provide general advice to retail and wholesale clients in relation to
- Securities
- deal on behalf of retail and wholesale clients in relation to
- Securities
The distribution of this FSG by RaaS is authorized by BR.
Our general advice service
Please note that any advice given by RaaS is general advice, as the information or advice given will not take
into account your particular objectives, financial situation or needs. You should, before acting on the advice,
consider the appropriateness of the advice, having regard to your objectives, financial situation and needs. If
our advice relates to the acquisition, or possible acquisition, of a particular financial product you should read any
relevant Prospectus, Product Disclosure Statement or like instrument. As we only provide general advice we
will not be providing a Statement of Advice. We will provide you with recommendations on securities
Our dealing service
RaaS can arrange for you to invest in securities issued under a prospectus by firstly sending you the offer
document and then assisting you fill out the application from if needed.
How are we paid?
RaaS earns fees for producing research reports. Sometimes these fees are from companies for producing
research reports and/or a financial model. When the fee is derived from a company, this is clearly highlighted on
the front page of the report and in the disclaimers and disclosures section of the report.
We may also receive a fee for our dealing service, from the company issuing the securities.
Associations and Relationships
BR, RaaS, its directors and related parties have no associations or relationships with any product issuers other
than when advising retail clients to invest in managed funds when the managers of these funds may also be
clients of BR. RaaS’s representatives may from time to time deal in or otherwise have a financial interest in
financial products recommended to you but any material ownership will be disclosed to you when relevant
advice is provided.
Complaints
If you have a complaint about our service you should contact your representative and tell them about your complaint. The representative will follow BR’s internal dispute resolution policy, which includes sending you a copy of the policy when required to. If you aren’t satisfied with an outcome, you may contact AFCA, see below. BR is a member of the Australian Financial Complaints Authority (AFCA). AFCA provide fair and independent financial services complaint resolution that is free to consumers. Website: www.afca.org.au; Email: [email protected]; Telephone: 1800931678 (free call)
In writing to: Australian Financial Complaints Authority, GPO Box 3, Melbourne, VIC, 3001.
Professional Indemnity Insurance
BR has in place Professional Indemnity Insurance which satisfies the requirements for compensation under
s912B of the Corporations Act and that covers our authorized representatives.

Future First Technologies Ltd | 12th April 2021 26
DISCLAIMERS and DISCLOSURES
This report has been commissioned by Future First Technologies Ltd prepared and issued by RaaS Advisory Pty Ltd. RaaS Advisory
has been paid a fee to prepare this report. RaaS Advisory’s principals, employees and associates may hold shares in companies that
are covered and, if so, this will be clearly stated on the front page of each report. This research is issued in Australia by RaaS Advisory
and any access to it should be read in conjunction with the Financial Services Guide on the preceding two pages. All information used
in the publication of this report has been compiled from publicly available sources that are believed to be reliable. Opinions contained
in this report represent those of the principals of RaaS Advisory at the time of publication. RaaS Advisory provides this financial advice
as an honest and reasonable opinion held at a point in time about an investment’s risk profile and merit and the information is provided
by the RaaS Advisory in good faith. The views of the adviser(s) do not necessarily reflect the views of the AFS Licensee. RaaS
Advisory has no obligation to update the opinion unless RaaS Advisory is currently contracted to provide such an updated opinion.
RaaS Advisory does not warrant the accuracy of any information it sources from others. All statements as to future matters are not
guaranteed to be accurate and any statements as to past performance do not represent future performance.
Assessment of risk can be subjective. Portfolios of equity investments need to be well diversified and the risk appropriate for the
investor. Equity investments in listed or unlisted companies yet to achieve a profit or with an equity value less than $50 million should
collectively be a small component of a balanced portfolio, with smaller individual investment sizes than otherwise.
The science of climate change is common knowledge and its impacts may damage the global economy. Mitigating climate change
may also disrupt the global economy. Investors need to make their own assessments and we disclaim any liability for the impact of
either climate change or mitigating strategies on any investment we recommend.
Investors are responsible for their own investment decisions, unless a contract stipulates otherwise. RaaS Advisory does not stand
behind the capital value or performance of any investment. Subject to any terms implied by law and which cannot be excluded, RaaS
Advisory shall not be liable for any errors, omissions, defects or misrepresentations in the information (including by reasons of
negligence, negligent misstatement or otherwise) or for any loss or damage (whether direct or indirect) suffered by persons who use or
rely on the information. If any law prohibits the exclusion of such liability, RaaS Advisory limits its liability to the re-supply of the
Information, provided that such limitation is permitted by law and is fair and reasonable. Copyright 2021 RaaS Advisory Pty Ltd (A.B.N.
99 614 783 363). All rights reserved.