Further Raising Awareness of Survey Practitioners on the ...
13
1 Further Raising Awareness of Survey Practitioners on the Usefulness of the Total Survey Error Paradigm Claude Girard, Senior Methodologist Statistics Canada 1. Introduction Over the last two decades or so, a lot of statistical research has gone into further developing the Total Survey Error (TSE) paradigm. This can be readily seen from the numerous TSE-related papers published in peer-reviewed journals during that period, and the International Total Survey Error Workshop (ITSEW) quickly becoming an annual and important event after first being held in 2005. Yet, in the author’s experience, TSE is neither as well-known nor as well understood by survey practitioners as members of the TSE community might think. Indeed, while most methodologists and survey managers can be expected to define the acronym “TSE”, most would be hard pressed to provide a simple explanation of what sets apart its two main error branches Representation and Measurement. In this paper, we raise the issue of the gap that exists in the understanding of TSE between specialists and survey practitioners which, to our knowledge, has not been an official topic for discussion within the ITSEW forum before. We will discuss some of the factors responsible for creating a divide between the communities of TSE researchers and survey practitioners, and present some of the initiatives undertaken at Statistics Canada to fill the gap noted. There are three main sections to this paper about the pedagogy surrounding TSE, one for each of the following questions: How can more information about the TSE be communicated to practitioners? What does the TSE currently accomplish that is useful to practitioners? What else could TSE be made to do that would increase its usefulness? Each section concludes with a series of questions intended to further stimulate floor discussions. By exchanging on the best practices adopted and initiatives currently in the works in our respective institutions, all of us in the TSE community are effectively working to further raise the awareness of survey practitioners on the usefulness of the TSE paradigm. 2. Minding the Gap Groves (2016) retraced part of the long and rich history of classifying survey errors leading to the Total Survey Error (TSE) paradigm as we know it today. Over the years, errors have been classified in various different ways, each reflecting a certain perspective of the survey process in vogue at the time.
Transcript of Further Raising Awareness of Survey Practitioners on the ...
1
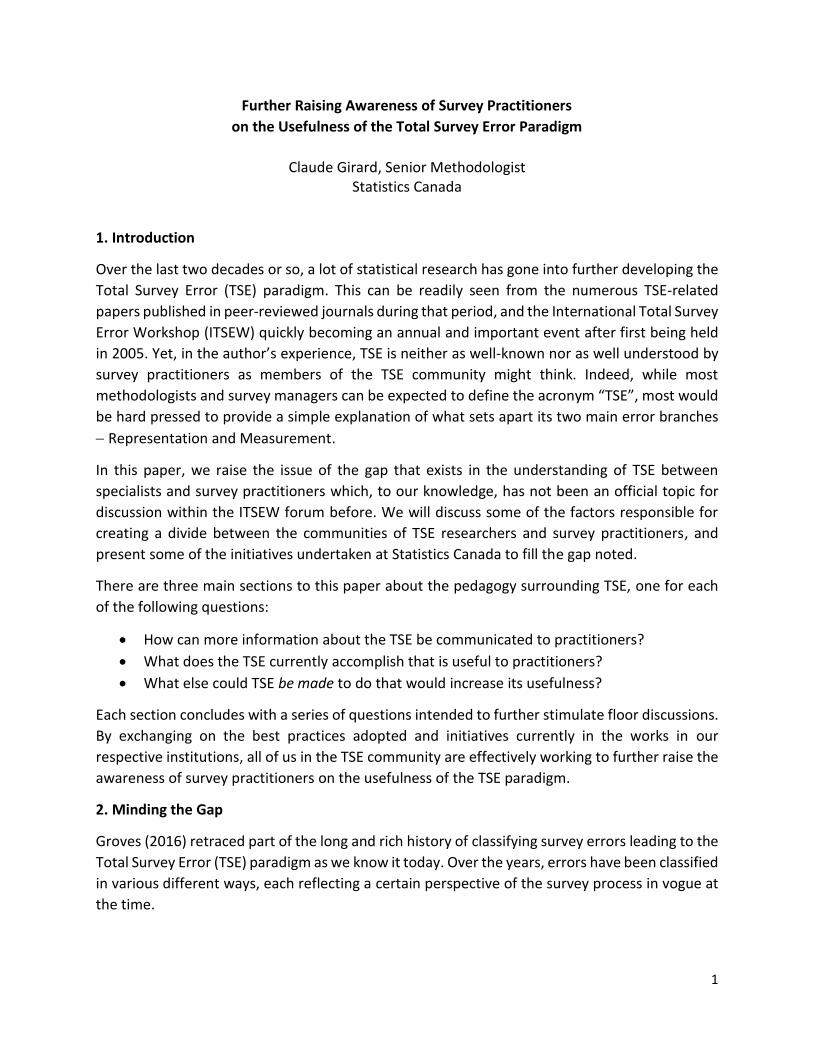
Further Raising Awareness of Survey Practitioners
on the Usefulness of the Total Survey Error Paradigm
Claude Girard, Senior Methodologist
Statistics Canada
1. Introduction
Over the last two decades or so, a lot of statistical research has gone into further developing the
Total Survey Error (TSE) paradigm. This can be readily seen from the numerous TSE-related
papers published in peer-reviewed journals during that period, and the International Total Survey
Error Workshop (ITSEW) quickly becoming an annual and important event after first being held
in 2005. Yet, in the author’s experience, TSE is neither as well-known nor as well understood by
survey practitioners as members of the TSE community might think. Indeed, while most
methodologists and survey managers can be expected to define the acronym “TSE”, most would
be hard pressed to provide a simple explanation of what sets apart its two main error branches
Representation and Measurement.
In this paper, we raise the issue of the gap that exists in the understanding of TSE between
specialists and survey practitioners which, to our knowledge, has not been an official topic for
discussion within the ITSEW forum before. We will discuss some of the factors responsible for
creating a divide between the communities of TSE researchers and survey practitioners, and
present some of the initiatives undertaken at Statistics Canada to fill the gap noted.
There are three main sections to this paper about the pedagogy surrounding TSE, one for each
of the following questions:
How can more information about the TSE be communicated to practitioners?
What does the TSE currently accomplish that is useful to practitioners?
What else could TSE be made to do that would increase its usefulness?
Each section concludes with a series of questions intended to further stimulate floor discussions.
By exchanging on the best practices adopted and initiatives currently in the works in our
respective institutions, all of us in the TSE community are effectively working to further raise the
awareness of survey practitioners on the usefulness of the TSE paradigm.
2. Minding the Gap
Groves (2016) retraced part of the long and rich history of classifying survey errors leading to the
Total Survey Error (TSE) paradigm as we know it today. Over the years, errors have been classified
in various different ways, each reflecting a certain perspective of the survey process in vogue at
the time.

2
Fast-forwarding to 2018, TSE appears well-established because TSE-related papers abound, and
most survey practitioners from methodologists to subject matter experts know the acronym.
But looks are deceiving here, since in our experience the very same practitioners would find it
difficult to describe TSE’s two error branches, Representation and Measurement, in terms similar
to those given in Figure 2.1.
Figure 2.1: A simple description of TSE’s two main error branches, Measurement and Representation, which we claim
most practitioners aware of TSE would not be in a position to provide
While practitioners are familiar with many of the individual puzzle pieces shown in Figure 2.1, it
is important that they understand how they all fit together to form TSE, and this is what the two
TSE branches are about. Without a proper understanding of TSE, the more recent and technical
advances are at risk of not making it to mainstream surveying activities, which can result in a gap
of knowledge developing itself between TSE specialists and practitioners.
2.1 Questions
How well do you think practitioners know TSE? How do you measure their understanding
of TSE?
Do you feel it is important that practitioners distinguish the Measurement and
Representation branches to make effective use of TSE? If so, do you feel practitioners are
making that distinction? If not, what are the essential things practitioners ought to know
about TSE?
3. Bridging the Gap between TSE and All of its Users
At Statistics Canada we have identified certain factors that have prevented TSE from becoming
widely known within the Agency. In this section we present the actions taken to try and address
the situation.
3.1 On New Ways of Showcasing TSE
While by definition the TSE paradigm exists in conceptual form, it must also give rise in practice
to something of a companion, a practitioner-friendly tool whose usefulness speaks more for
itself. At Statistics Canada we have introduced two courses showcasing the TSE paradigm as a
tool in an attempt to further raise its profile with practitioners. The first course is geared to survey
managers and uses TSE to examine the Agency’s collection processes. The second targets

3
methodologists and draws a parallel between the various sources of errors and the many reasons
why a given population may be hard to survey following Tourangeau et al. Eds. (2014).
3.1.1 Collection through the TSE lens
Since the course on collection is primarily intended for a non-technical audience, it presents TSE
by likening the nature of survey error to communicating vessels. First, the error arising in a given
part of the survey process is represented as fluid in a reservoir as shown in Figure 3.1.1 (a).
(a)
(b)
(c)
(d)
Figure 3.1.1 Survey error as fluid in a system of inter-connected reservoirs
Then, it is natural enough to take action and apply pressure – the red arrow – to reduce the fluid
level in the reservoir as depicted in Figure 3.1.1 (b). Where has the error gone? It would leave the
system – the survey process – if it consisted only of this one reservoir. But what if instead the
system consists of five inter-connected reservoirs? Does it necessarily follow, as implied by Figure
3.1.1 (c), that the pressure applied forces the error out of the system? It is more realistic to think
that local measures, those conceived without looking at the whole picture, will not chase the
error out of the system but only redirect it to other reservoirs as illustrated in Figure 3.1.1 (d).
By alerting practitioners to the inter-connectedness nature of survey error, TSE promotes
effective communication between all involved throughout the surveying process. More
specifically, TSE encourages everyone involved to adopt an all-encompassing view of the survey
process when addressing “local” issues to ensure that the measures adopted will benefit the
survey as a whole.
Part of the feedback from course participants is that they saw in TSE a useful way of arguing in
favour of (or against, depending on the context) certain initiatives; they felt it gave them the
means to voice the merit they saw (or concerns they might have), consolidating arguments that
would otherwise be based on intuitive grounds only.
3.1.2 Marrying Hard-to-Survey populations to TSE
In 2017, the time was ripe for the Agency to redesign its course titled Indirect Sampling and
Difficult-to-Reach populations and extend its reach to other hard-to-survey (H2S) populations.

4
Since the material originally covered corresponded roughly to Chapter 21 of Tourangeau et al.
Eds. (2014), it was only fitting to include other topics from that same excellent reference as well.
But, following a suggestion of Tom Smith’s in Chapter 2 of Tourangeau et al. Eds (2014), we
introduced additional material into the course with a twist: We attempted to draw a close parallel
between H2S populations and the TSE paradigm. The basic premise is that a population may very
well be H2S precisely because a certain type of survey error proves difficult to address, and vice-
versa.
To illustrate the parallel, consider a hard-to-sample population. As Graham Kalton notes in
Chapter 19 of Tourangeau et al. Eds (2014), most probability sample designs used to survey hard-
to-sample populations incorporate one form or another of screening. Among these, the following
option is textbook: first, contact by telephone a vast portion of the survey universe to ask a simple
question and then send by mail a detailed and/or more technical questionnaire to the screened-
in units. However, as we have learned at Statistics Canada, devising simple yet effective screening
questions can be quite challenging when it comes to a technical subject. In one example, an
environmental business survey was targeting establishments involved in “green” industrial
activities, an attribute which could not be identified beforehand using the information contained
in the Agency’s central Business Register (BR). A small set of screening questions were devised
and asked to a large sample of businesses. While they were deemed broad and simple enough to
be answered directly over the phone, in many cases the contact people familiar with the Agency’s
traditional financial surveys insisted on having the questions faxed to them for their expert to
answer. As a result, what was set to be a light collection process turned into a burdensome one
for everyone involved.
Through the feedback we received from participants, we know that people find the parallels
drawn between TSE and H2S populations enlightening. (And who can resist a two-for-one
combo?) On the one hand, H2S provides the TSE paradigm with some of the contextual
information it is lacking, bringing greater relevance. On the other hand, the communicating-
vessels feature of the error revealed by TSE proves very useful in alerting the survey team to the
detrimental effects that “quick fixes” to H2S-type issues might have on the whole survey process.
3.1.3 From Concepts to Practice: Data Visualization
One challenge methodologists are facing is finding a suitable way of communicating their results
about survey errors to survey partners. Indeed, in multidisciplinary teams, analytics are not the
language of choice. As part of its collection course and internal seminar series, Statistics Canada
has promoted the use of visual analytics to explore issues such as straight-lining and to convey
findings such as classification errors for a discrete variable with numerous categories. As shown
in Figure 3.1.3, we are encouraging practitioners to consider different graphical options,
depending on the nature of the error under scrutiny.

5
Figure 3.1.3: Different graphical options for different types of error
3.2 Reaching Out to All Involved
Groves and Lyberg (2010) discuss some of the weaknesses of the TSE paradigm that researchers
have since been working hard to overcome. But have all the fruits of these efforts made their
way back to practitioners, those working deep in survey trenches?
Beyond the claim we make above that practitioners do not know well enough the TSE paradigm
and its usefulness, there is a gap that has developed between what researchers know and what
practitioners use. Following a presentation given by the author in which he spoke of the necessity
to bridge a similar gap that has arisen in the context of the Bootstrap method, Professor J.N.K.
Rao supported that view with the following comment1:
Adapting theory to practical situations is a challenge often overlooked by researchers. A successful
implementation of the Bootstrap method, or any other method for that matter, requires people
with a special set of skills, one that combines sound technical capacities with an ability to explain
issues in a simple yet faithful way. In essence, these people must speak both languages: the
technical and the layman one.
Similar echoes can be heard in van Buuren (2012), a book that reaches out to practitioners on
the subject of Donald Rubin’s Multiple Imputation (MI) method. First, one reads in the foreword
written by Donald Rubin (emphasis in italics is mine):
[…] First, to me at least, having another book devoted to multiple imputation marks the maturing
of the topic after an admittedly somewhat shaky initiation. […] I remember how this idea of multiple
imputation was even ridiculed by some more traditional statisticians […] Multiple imputation’s early
survival was clearly due to the insight of a younger generation of statisticians […] who realized
future possibilities. […] I particularly like (the author’s) use of graphical displays, which are badly
needed in practice to supplement the more theoretical discussions […].
1 The presentation titled A Brewer’s Perspective onto Some Key Contributions of Prof. Rao to Surveys was given at Statistics Canada in December 2017. Professor Rao’s comment is reproduced here with his kind permission.

6
And then, in the preface of van Buuren (2012), the author comments on the situation in the
following way (again, emphasis in italics is mine):
Over the last 20 years, I have applied multiple imputation in a wide variety of projects. I believe the
time is ripe for multiple imputation to enter mainstream statistics. […] What is still missing is a book
that explains the basic ideas and that shows how these ideas can be put into practice. […] In writing
this text, I have tried to avoid mathematical formulas and technical details as much as possible.
Formulas are accompanied by a verbal statement that explain the formula in layperson terms.
Finally, in Kott et al. (2005) the authors of Särndal et al. (1992) note that:
Regrettably, we cannot seem to distinguish “a promising trend” that could, in the near future, yield
“a clean attitude to surveys.” The Yellow Book and comparable modern texts have little direct
impact in that regard. They are directed to and read by a select few, a kind of “special echelon” of
the wide survey community, notably those called “survey methodologists.” A thorough assimilation
of the material in the Yellow Book requires a certain maturity and familiarity with mathematical
and analytical reasoning. Out of the thousands of persons who make their living in the survey
business, working in government or in private survey organizations or elsewhere, a fairly small
percentage find the book easy reading, or ‘must reading.’ Still, many of these other persons are
highly competent statisticians, experts perhaps in some other aspect of statistics production.
All of these argue for the same thing: the necessity for people with various backgrounds,
objectives and aptitudes to work together for a certain theoretical or conceptual development
to make it successfully to practice. Beyond a plea for better cooperation, it calls for people to
develop a deep appreciation of just how much everyone’s contributions and talents are needed
for an implementation to succeed. But who are these key contributors exactly, and what are their
roles? A thought-provoking answer comes from Simon Wardley’s tale of pioneers, settlers and
town planners which describes the unique set of circumstances needed to bring products and
services to life2:
Pioneers are brilliant people. They are able to explore never before discovered concepts, the
uncharted land. They show you wonder but they fail a lot. Half the time the thing doesn't work
properly. You wouldn't trust what they build. They create 'crazy' ideas. Their type of innovation is
what we call core research. They make future success possible. Most of the time we look at them
and go "what?", "I don't understand?" and "is that magic?". In the past, we often burnt them at
the stake. They built the first ever electric source (the Parthian Battery, 400AD) and the first ever
digital computer (Z3, 1943).
Settlers are brilliant people. They can turn the half baked thing into something useful for a larger
audience. They build trust. They build understanding. They make the possible future actually
happen. They turn the prototype into a product, make it manufacturable, listen to customers and
turn it profitable. Their innovation is what we tend to think of as applied research and
differentiation. They built the first ever computer products (e.g. IBM 650 and onwards), the first
generators (Hippolyte Pixii, Siemens Generators).
2 http://blog.gardeviance.org/2015/03/on-pioneers-settlers-town-planners-and.html

7
Town Planners are brilliant people. They are able to take something and industrialise it taking
advantage of economies of scale. This requires immense skill. You trust what they build. They find
ways to make things faster, better, smaller, more efficient, more economic and good enough. They
build the services that pioneers build upon. Their type of innovation is industrial research. They take
something that exists and turn it into a commodity or a utility (e.g. with Electricity, then Edison,
Tesla and Westinghouse). They are the industrial giants we depend upon.
What you want is brilliant people in each of these roles.
We propose to adapt Wardley’s tale to the TSE community through the following mapping of
characters:
Pioneers ↔ Researchers (from academia or a national statistical agency’s research unit)
Settlers ↔ Survey practitioners, methodologists and subject matter experts alike
Town planners ↔ (More senior) Managers
Wardley’s analogy promotes adopting an all-inclusive view for the TSE community, in which every
character’s unique set of abilities is valued and recognized. The notion that “Everyone involved
has to be brilliant people” goes against “unilateral” views according to which some are more
brilliant than others because they score better on a given scale e.g., technical thinking. More
specifically, it is important in Wardley’s view that researchers explore new avenues with much
freedom, without fear that the boldness needed for such initiatives be dismissed by survey
practitioners and managers as idealistic. But, at the same time, managers and practitioners must
be able (and feel comfortable) to provide guidance to researchers based on their own down-to-
earth needs.
And once researchers make a significant finding, it is important that it is communicated to survey
practitioners in a way they understand. While adopting a technical language conforms to
scientific publication standards (which is fine), it is not necessarily conducive to productive
exchanges with partners outside of the research circle, such as survey practitioners and
managers. Indeed, when presented with too technical a report on a finding, chances are
practitioners will not understand what it is about and fail to grasp its true potential for practical
applications. While van Buuren’s plea above calls for a non-technical dialogue to be engaged with
practitioners, it may leave researchers legitimately wondering: Technically speaking, just how
non-technical must a technical argument framed?
Maybe the best answers to such a question come from looking at some of the current practices.
One of the continuous learning formats in vogue at Statistics Canada is that of a reading group:
participants agree beforehand on a paper to read, and meet afterwards to discuss its contents
and relevance to their work. By joining forces, practitioners engaged in reading group activities
find it easier to penetrate what they perceive to be technical and/or dense papers. In a recent
activity of this kind the focus was on Tambay (2017), a confidentiality-related paper that initially

8
came across as technical to the participants; the reader is invited to look up this paper and
compare his/her impressions with those of the reading group participants.
Researchers might help survey practitioners engage more by packaging their findings in an
alternate format to what is required by the scientific community. For instance, in addition to the
publication in a peer-reviewed journal (or technical report), an executive summary of sorts could
also be written (by prospective MSc or PhD students?) and posted on one’s university website to
the attention of survey practitioners. It would explain the finding in layman’s terms, notably
taking care in highlighting key ideas, principles and assumptions. Differential Privacy, again a
topic related to confidentiality, is an example where significant efforts were recently made to
make the seminal technical work reported in Dwork (2006) more accessible to practitioners e.g.,
the online tutorial Differential Privacy in the Wild3.
By making supplementary reading material and tutorials available through their own websites,
researchers also foster collaboration opportunities with practitioners. At Statistics Canada we
largely owe our successful implementation of the Rao-Wu Rescaling Bootstrap and the
Generalized REGression (GREG) model-assisted estimation to the open channels the Agency
maintained between its practitioners and Professors Rao and Särndal, respectively, during the
critical years of their implementation.
3.3 How Should Error Be Served: à-la-bias or à-la-variance?
Smith (2011) remarks that TSE combines the bias and variance components of the error into one.
This is a view we adopted in Section 3.1.1 when discussing the communicating vessels nature of
the error: Practitioners were warned that regardless of the form the error takes, bias or variance,
corrective measures may only move it about within the survey process. It is important for
practitioners to realize that some measures do not move the error at all within the system, but
work to convert it from an apprehended bias into a variance. In itself this is a sensible action to
take since the error is generally more easily estimated when made to contribute to the variance
rather than to the bias. In our course on TSE we give as an example the account given in Section
12.5 of Lohr (1999) of the so-called randomisation method.
3.4 Questions
For people working for national statistical agencies, how is TSE communicated to staff?
For people in academia, do you perceive a gap or disconnect with practitioners? If so,
what means do you take or see yourself taking to reach out further to them?
Researchers, have you tried to establish partnerships with statistical agencies by which to
share knowledge, expertise and issues? If not, why? If so, have you been successful? What
have been some of the challenges you have faced?
3 http://sigmod2017.org/wp-content/uploads/2017/03/04-Differential-Privacy-in-the-wild-1.pdf

9
4. In Need for a Paradigm Extension or a Paradigm Shift?
So far we have looked into some ways of drawing practitioners closer to the current TSE
paradigm. But as dictionaries4 remind us, a paradigm is not permanent:
[A paradigm] is a set of theories that explain the way a particular subject is understood at a
particular time.
In this section we briefly consider some possible ways of extending TSE to help practitioners
answer the new challenges they are facing today, allowing for
Effects to be considered in addition to errors
Implementation errors to be taken explicitly into account
New data sources to be exploited
Non-probabilistic sampling methods to be used
4.1 Meet TSEFF, TSE for Effects
With TSE, the focus is legitimately on survey error, inviting for corrective measures to be taken to reduce its extent to some acceptable level. But how can one conclusively tell whether the adopted measure, once implemented, has had the desired effect of reducing error? Indeed, several factors are at work in a survey process explaining why in practice two repetitions of the same process could yield different estimates. Hence, how does one tell a difference in outcomes due to the effectiveness of the measure taken from one that would occur at random? This brings us to the notion of effect, which is the difference between two estimates of the same parameter of interest obtained under concurring methodologies. In essence, effects arise from there being not one but two (or more) “parallel” streams of data transiting through the survey process rather than just one. It is simple enough to produce a version of TSE featuring effects: one merely has to double all of the arrows to reflect the two different streams of data flowing through the survey process when competing methodologies are considered in parallel – see Figure 4.1.1.
Figure 4.1.1 Turning the TSE diagram into TSEFF, which features effects
4 Definition is taken from the Cambridge Online Dictionary https://dictionary.cambridge.org

10
By promoting TSEFF alongside TSE, we would further raise practitioners’ awareness to the
importance of assessing the real impact corrective methodologies have once implemented,
which requires careful planning at the design stage of the survey and the use of appropriate
estimation techniques; see papers written in the wake of van den Brakel (2001) for details.
4.2 Errata Non Grata: Implementation Errors
The “E” in TSE refers to an “honourable” error, one that exists because of the current limitations
of our knowledge on how best to carry out a survey process. In contrast, practice abounds with
examples where an error is actually a mistake: an action was taken (or not taken?) by someone
who should have known better. This is reminiscent in tennis’ parlance of an unforced error, a
mistake made when the player ought to have been in full control.
To illustrate, consider the following example. By drawing a Stratified Simple Random Sampling
Without Replacement (ST-SRSWOR) sample from a frame we accept that a certain amount of
sampling error will be produced in the estimates. But what if the selection of the ST-SRSWOR
sample is carried out from an outdated version of the file posing as the frame? While we may
shove it under the sampling error rug, this type of error does not speak to the limitations of ST-
SRSWOR since it arose from the incorrect way the design was implemented. In our training we
chose to draw further attention to implementation errors by the “muddying” they do of the
conceptual errors featured in TSE as shown in Figure 4.2.1.
Figure 4.2.1 A muddied version of TSE’s conceptual errors due to implementation errors
At Statistics Canada, back in 2012 before we became aware of ASPIRE through ITSEW 2014 (see
Biemer et al. 2014), we further raised our practitioners’ awareness to implementation errors
through a simple checklist-type tool we developed. It consisted of three phases: Launch (before
the implementation of a product is undertaken), Follow-up (starts once the implementation is in
full swing) and Evaluation (begins when the implementation is drawing to an end). At each phase
practitioners were asked to perform various specific tasks. For example, the Launch phase
required them to describe the characteristics of the product, to identify the risk factors that could
jeopardize the success of the product implementation, to define and set up checks, and to
provide for measures that will ensure a proper implementation.

11
4.3 New Times, New Sources, New Methods (and Old Ones Making a Comeback)
As evident from the news5, Statistics Canada is under more pressure than ever before to consider
and exploit alternate data sources to surveys for the purpose of delivering quality inferences to
Canadians in a more timely and resource-mindful way. To deal with new data sources, new
methods may be required, although in the case of non-probabilistic schemes we are merely
witnessing the resurgence of old ones. Presented with the challenges these changes bring,
practitioners will naturally turn to fundamental principles for guidance, one of which is and ought
to be the TSE paradigm. However, some practitioners have the impression that TSE with its
middle letter is growing obsolete, failing to get away from the highly controlled data collection
environment provided by traditional surveys.
How useful is it to look at data sources other than surveys through the TSE lens? Take
administrative data as example. Would a clear and interesting picture emerge through TSE or
would the view offered be all distorted because it is not survey data?
Figure 4.3.1 How relevant a view would we get by moving TSE over to other data sources?
In his essay on the future of survey sampling, Brick (2011) makes the following rather grim
assessment of the use of administrative data as an alternative to direct survey data collection:
Despite their promise, the use of administrative records has not lived up to its potential, at least
not in U.S. applications. Jabine and Scheuren (1985) describe six goals set by the U.S. government
to improve the use of administrative records in survey sampling for a 10-year period. Roughly 25
years later, many of the goals outlined there have not been fully realized. Sampling from
administrative records has not been successful in areas other than government statistics either. […]
Administrative records have always posed problems for survey applications due to incompleteness,
lack of timeliness, poor data for locating and contacting the respondents, and incomplete
maintenance of the records.
5 See for instance: http://www.environicsanalytics.ca/footer/news/2017/11/21/chief-statistician-of-canada-anil-arora-describes-statistics-canadas-initiative-to-create-a-more-data-drive-society https://www.hilltimes.com/2018/03/12/statistics-canada-gets-recognition-needs-deserves-morneaus-budget/136562

12
While this is a fair assessment of the situation (at least at the time it was published), and one
commonly shared by survey practitioners, something was lost in ignoring the very purpose
administrative data are serving. A glance at the top of both of TSE’s branches is enough to draw
one’s attention straight to it: What are the key underlying concepts (Measurement) and who is
targeted (Representation)? From that perspective, administrative data are not so much “bad” or
“of poor quality” than ill-fitted for a purpose that is not directly compatible with theirs.
To illustrate, consider the case of a child benefit file from a government program to supplement
family incomes. When a child is born, various information is captured, notably name and contact
address. The parents may have the choice to receive their child benefits through a bank transfer,
which requires them to provide bank account information, or by regular mail. As time goes by,
addresses change as families move from one place to another. However, only families getting
their check by mail truly have an incentive to keep their contact information on record up to date
since the others will keep on receiving their money as long as the banking information is accurate.
And as long as everyone is getting their money, the agency may not be aware (or care) of the
change in address information that has taken place: its main purpose is achieved regardless.
However, a survey using this information to enrich its frame will inevitably see the contact
information as being of poor quality (for its own purpose, which is quite different in nature).
In using alternate data sources for surveying activities, TSE forces one to look into areas for
potential issues that could otherwise go unnoticed. For example, the prospect of validity error
calls for attention to be given to the core concepts used. While one could think that a survey and
an administrative data source will agree on key intuitive or elementary concepts, practice shows
otherwise. The post-secondary education system in Québec, one of the ten provinces of Canada,
provides an example of just how different two views of the same basic “concept” can be. A survey
gaining access to Québec post-secondary institutions may not see the need to question the
notion of “student is a resident of Québec at time of enrollment” as meaning anything else than
what it says. However, following a directive6 issued by the government of Québec (education, in
Canada, is under provincial jurisdiction) a university considers an individual who was baptised in
Québec but has since lived outside the province as “resident”.
And what about the even less traditional data sources available today, which are referred to as
organic data in Groves (2016)? Are they bringing new sources of errors to TSE or are they actually
only shifting the emphasis away from the usual culprits to others within the existing paradigm?
Do we need to revamp TSE entirely or can we still tie everything to TSE provided we rebrand it to
something like the Total Inferential Error (TIE)?
6 See http://collections.banq.qc.ca/ark:/52327/bs42161 (in French only) on page 10 the clause “Le
certificat de baptême délivré par une paroisse du Québec avant le 1er janvier 1994, et ce peu importe le
lieu de naissance indiqué.” (The author’s free translation: “The baptism certificate delivered by one of
Québec’s parishes before January 1st 1994, regardless of the place of birth specified.”)

13
4.4 Questions
In your respective agencies is attention of practitioners drawn to effects? If so, through
what means?
What are some of your practices to further raise awareness to effects and
implementation errors?
Has your statistical agency made use already of a Total Uncertainty approach? How did
that go? What else does it bring to the table that TSE itself cannot deliver?
References
Biemer, P., Trewin, D., Bergdahl, H. and Japec, L. 2014. A System for Managing the Quality of
Official Statistics. Journal of Official Statistics. Vol. 30, No. 3, pp 381-415.
Brick, J.M. 2011. The Future of Survey Sampling. Public Opinion Quarterly. pp. 872-888.
Dwork, C. 2006. Differential privacy. Proceedings of the 33rd International conference on
Automata Languages and Programming. Vol. Part II. pp. 1-12
Groves, R. M. 2016. Towards a Quality Framework for Blends of a Designed and Organic Data.
Waksberg Award Winner Address, part of Statistics Canada’s 2016 Methodology Symposium.
Groves, R. M. and L. Lyberg. 2010. Total Survey Error: Past, Present, and Future. Public Opinion
Quarterly, Vol. 74, Issue 5, pp. 849-979.
ITSEW. 2014. Author’s recollection of floor discussions.
Kott, P.S., B. Swensson, C.-E. Särndal and J. Wretman. 2005. An Interview with the Authors of the
Book Model Assisted Survey Sampling. Journal of Official Statistics. Vol. 21, No. 2, pp. 171-182.
Lohr, S. 1999. Sampling: design and analysis. Duxbury Press.
Särndal, C.E., B. Swensson and J. Wretman. 1992. Model assisted survey sampling. Springer, New-York.
Smith, T.W. 2011. Refining the Total Survey Error Perspective. International Journal of Public
Opinion Research. Vol. 23. No. 4.
Tambay, J.-L. 2017. A layered perturbation method for the protection of tabular outputs. Survey
Methodology, Vol. 43, No. 1, pp. 31-40.
Tourangeau, R. B. Edwards, T.P. Johnson, K.M. Wolter and N. Bates. (editors). 2014. Hard-to-
Survey Populations. Cambridge University Press
van Buuren, S. 2012. Flexible Imputation of Missing Data. CRC Press.
Van den Brakel, J.A. 2001. Design and Analysis of Experiments Embedded in Complex Sample
Surveys. Ph.D. Thesis. Rotterdam: Erasmus University of Rotterdam.