FUNDING UNHCR’S PROGRAMMES Funding UNHC R’s … · FUNDING UNHCR’S PROGRAMMES Funding UNHC...
24
132 UNHCR Global Report 2014 FUNDING UNHCR’S PROGRAMMES Funding UNHC O ver the past few years, UNHCR has been hugely challenged to respond to the needs of record numbers of people forced to flee by a growing number of conflicts, as presented in this report on the activities and results of the work of the Office in 2014. The generosity of host countries has been stretched beyond limits and donors have dug very deep to ramp up funding to save millions of lives. With crises escalating, the gap between needs and resources has widened to alarming levels. Funds available in 2014 amounted to USD 3.6 billion, USD 369 million more than in 2013. However, despite the significant increase in contributions, only 55 per cent of the 2014 comprehensive budgetary requirements were covered, leaving many of the needs of people of concern to UNHCR unmet. This chapter presents a review of UNHCR’s budgetary requirements, income, expenditure and financial management in 2014. It includes a short presentation on UNHCR’s main donors; for more details, please go to the organization’s main operational website Global Focus (http://reporting.unhcr.org) where the donor profiles are displayed and updated regularly. It should be noted that in this Global Report 2014, all income and expenditures have been prepared using the modified cash basis accounting method (see Glossary), whereas UNHCR’s financial statements are prepared in accordance with International Public Sector Accounting Standards (IPSAS). | Assessing the needs of refugees and other people of concern to UNHCR | P rompted by UNHCR’s Executive Committee and recognizing the need for structural changes in the organization, High Commissioner António Guterres launched an internal reform process in 2006. The primary objective was to increase the organization’s effectiveness in meeting the needs of people of concern to UNHCR by developing programmes and processes based on comprehensive needs assessments and executed through results-driven planning, implementation and reporting. The adoption of a results-based management approach entailed integrating a number of new elements in the management of UNHCR’s operations, including a Results Framework; comprehensive needs assessments for each operation leading to an overall global needs assessment; global strategic priorities; and a revised budget structure. The Results Framework provides a standardized description of the results UNHCR wants to achieve and was designed to guide the assessment and planning processes. The global needs assessment is in essence a comprehensive mapping of the needs of people of concern to UNHCR worldwide against basic humanitarian standards, taking into account the existing capacity to implement or manage the implementation of response activities. It allows UNHCR to plan and budget more efficiently than before in order to meet these needs and to prioritize activities predictably and responsibly, with the aim of maximizing the organization’s use of resources. UNHCR adopted its current budget structure on 1 January 2010. This new structure was based on the comprehensive needs of people of concern, rather than on the approach linked to expected levels of income that had been followed prior to 2010. In 2014, the processes behind the comprehensive planning and budgeting approach were again followed and improved, based on the experience of two previous biennial programming cycles. The logic of such an approach is clear, and this was what Executive Committee members had called for in order to assess the true extent of the growing humanitarian needs for refugees and other people of concern to the Office of the High Commissioner. However, the needs of forcibly displaced people across the world have grown so extensively and dramatically in the past five years that, by 2014, it became obvious that the corresponding material and financial requirements to respond adequately far outstripped the resources currently available for humanitarian support around the world. While much was achieved with the remarkable level of funding provided by UNHCR’s donors and the dedicated efforts of its partners to support and implement the operations – often requiring enormous flexibility and creativity to overcome unexpected obstacles and a rapidly changing working environment – 45 per cent of the requirements in 2014 could not be covered. A more detailed analysis of the budgets, income and funding is presented below. | Financial analysis | REQUIREMENTS T he original 2014 budget of USD 5,307.8 million was approved by the Executive Committee at its 64th session in October 2013. At its 65th session in October 2014, the Executive Committee approved a revised budget for 2014 of USD 6,236.2 million, based on updated requirements. The final 2014 budget of USD 6,569.7 million represents the sum of the original budget of USD 5,307.8 million and the supplementary budgets, totalling USD 1,261.9 million, established in the course of the year.
Transcript of FUNDING UNHCR’S PROGRAMMES Funding UNHC R’s … · FUNDING UNHCR’S PROGRAMMES Funding UNHC...

132 UNHCR Global Report 2014
F U N D I N G U N H C R ’ S P R O G R A M M E S
Funding UNHC R’s programmesO
ver the past few years, UNHCR has been hugely challenged to respond to the needs of record numbers of people forced to flee by a growing number of conflicts, as presented in this report on the activities and results of the
work of the Office in 2014. The generosity of host countries has been stretched beyond
limits and donors have dug very deep to ramp up funding to save millions of lives. With crises escalating, the gap between needs and resources has widened to alarming levels. Funds available in 2014 amounted to USD 3.6 billion, USD 369 million more than in 2013. However, despite the significant increase in contributions, only 55 per cent of the 2014 comprehensive budgetary requirements were covered, leaving many of the needs of people of concern to UNHCR unmet.
This chapter presents a review of UNHCR’s budgetary requirements, income, expenditure and financial management in 2014. It includes a short presentation on UNHCR’s main donors; for more details, please go to the organization’s main operational website Global Focus (http://reporting.unhcr.org) where the donor profiles are displayed and updated regularly.
It should be noted that in this Global Report 2014, all income and expenditures have been prepared using the modified cash basis accounting method (see Glossary), whereas UNHCR’s financial statements are prepared in accordance with International Public Sector Accounting Standards (IPSAS).
| Assessing the needs of refugees andother people of concern to UNHCR |
Prompted by UNHCR’s Executive Committee and recognizing the need for structural changes in the organization, High Commissioner António Guterres launched an internal reform process in 2006. The
primary objective was to increase the organization’s effectiveness in meeting the needs of people of concern to UNHCR by developing programmes and processes based on comprehensive needs assessments and executed through results-driven planning, implementation and reporting.
The adoption of a results-based management approach entailed integrating a number of new elements in the management of UNHCR’s operations, including a Results Framework; comprehensive needs assessments for each operation leading to an overall global needs assessment; global strategic priorities; and a revised budget structure.
The Results Framework provides a standardized description of the results UNHCR wants to achieve and was designed
to guide the assessment and planning processes. The global needs assessment is in essence a comprehensive mapping of the needs of people of concern to UNHCR worldwide against basic humanitarian standards, taking into account the existing capacity to implement or manage the implementation of response activities. It allows UNHCR to plan and budget more efficiently than before in order to meet these needs and to prioritize activities predictably and responsibly, with the aim of maximizing the organization’s use of resources.
UNHCR adopted its current budget structure on 1 January 2010. This new structure was based on the comprehensive needs of people of concern, rather than on the approach linked to expected levels of income that had been followed prior to 2010. In 2014, the processes behind the comprehensive planning and budgeting approach were again followed and improved, based on the experience of two previous biennial programming cycles.
The logic of such an approach is clear, and this was what Executive Committee members had called for in order to assess the true extent of the growing humanitarian needs for refugees and other people of concern to the Office of the High Commissioner. However, the needs of forcibly displaced people across the world have grown so extensively and dramatically in the past five years that, by 2014, it became obvious that the corresponding material and financial requirements to respond adequately far outstripped the resources currently available for humanitarian support around the world.
While much was achieved with the remarkable level of funding provided by UNHCR’s donors and the dedicated efforts of its partners to support and implement the operations – often requiring enormous flexibility and creativity to overcome unexpected obstacles and a rapidly changing working environment – 45 per cent of the requirements in 2014 could not be covered. A more detailed analysis of the budgets, income and funding is presented below.
| Financial analysis |
REQUIREMENTS
The original 2014 budget of USD 5,307.8 million was approved by the Executive Committee at its 64th session in October 2013. At its 65th session in October 2014, the Executive Committee approved a revised budget for
2014 of USD 6,236.2 million, based on updated requirements. The final 2014 budget of USD 6,569.7 million represents the sum of the original budget of USD 5,307.8 million and the supplementary budgets, totalling USD 1,261.9 million, established in the course of the year.

133UNHCR Global Report 2014
F U N D I N G U N H C R ’ S P R O G R A M M E S
Funding UNHC R’s programmes SUPPLEMENTARY
BUDGETS
The USD 1,261.9 million for the supplementary budgets that were established by the High Commissioner to address unforeseen and new emergency needs during 2014 (see also Table 2), in accordance with UNHCR
Financial Rule 7.5, included: • Emergency response for the Syria situation (USD 212.5
million) • Mainstreaming of the Emergency/Non-Food Item project in
Sudan (USD 12.5 million) • Emergency response for the South Sudan situation (USD 502.2
million) • Emergency response for the Iraq situation (USD 334.9 million) • Emergency response for the Central African Republic situation
(USD 157.5 million) • Emergency response for Internally Displaced Persons from
North Waziristan Agency in Pakistan (USD 15.1 million) • Emergency response for the Nigeria situation (USD 16.6
million) • Internally Displaced People in Ukraine (USD 10.6 million)
Programmed activities: initial and final budgets by region and pillar | 2014 CHART 1
GROWING GLOBAL BUDGETARY REQUIREMENTS
Since the occurrence of new complex emergency situations in Africa and the Middle East in 2010, UNHCR’s requirements have reflected a steady increase, from USD 3,288.7 million in 2010
to USD 3,821.7 million in 2011 (16 per cent increase), to USD 4,255.6 million in 2012 (11 per cent increase over 2011), to USD 5,335.4 million in 2013 (25 per cent increase over 2012), and finally reaching USD 6,569.7 million in 2014 – a 23 per cent increase compared to 2013.
The original requirements for programmed activities only (excluding reserves and JPOs) were USD 4,880.9 million or 92 per cent of the total original budget, while the final requirements reached USD 6,233.0 million or 95 per cent of the total final budget.
Chart 1 illustrates the initial requirements and the final requirements for programmed activities by pillar and geographic region. A comparison of the final 2013 requirements for programmed activities (USD 5,084.3 million) with 2014 shows an overall increase of USD 1,148.8 million or 23 per cent.
Mill
ions
(USD
)

134 UNHCR Global Report 2014
F U N D I N G U N H C R ’ S P R O G R A M M E S
REQUIREMENTS BY PILLAR
Of the total USD 6,233.0 million requirements, USD 4,559.3 million, or 73 per cent of the overall requirements, was allocated to Pillar 1 for refugee programmes. When compared to 2013, this is a
minor decrease (4 per cent) although still a material increase (USD 622.9 million) in dollar terms. IDP projects in Pillar 4 represented the second largest budgetary allocation with USD 1,347.2 million or 22 per cent of the total requirements for programmed activities. In comparison with 2013, this is an increase in both percentage (5 per cent) and dollars (USD 527.0 million).
Reintegration projects (Pillar 3) and stateless programmes (Pillar 2) represented 4 per cent (USD 258.3 million) and 1 per cent (USD 68.3 million) of total programmed activities respectively and remained fairly stable compared to 2013.
The pillar comparison with 2013 demonstrates that in addition to increasing requirements for existing and new refugee emergencies, in 2014 UNHCR was also called to an increased involvement in IDP projects, confirming the growing needs in this area – as was already the case in 2013.
As shown in the chart, the majority of IDP project requirements are found in the Middle East and North Africa region (mainly in Iraq and the Syrian Arab Republic) and in the East and Horn of Africa (mainly in South Sudan).
REQUIREMENTS BY REGION
As in 2012 and 2013, Africa in 2014 continued to account for the largest part of total planned activities – approximately USD 2,583.0 million or 41 per cent – an increase of some USD 616.2 million or 31 per cent
compared to 2013. The bulk of the requirements (USD 1,991.5 million or 77 per cent of the total) remained in Pillar 1 for refugee programmes, followed by USD 482.0 million or 19 per cent for IDP projects in Pillar 4.
After Africa, the Middle East and North Africa region (USD 1,944.6 million) remained the region with the second largest requirements, representing 31 per cent of overall programmed activities in 2014 with an increase of USD 331.3 million or 21 per cent compared to 2013. Pillar 1, refugee programmes, accounted for some USD 1,246.0 million or 64 per cent, followed by Pillar 4, IDP projects, with some USD 654.8 million or 34 per cent.
Requirements for planned activities in the Asia and the Pacific region were approximately USD 610.5 million (10 per cent), with
a minor decrease of USD 15.9 million (3 per cent) as compared to 2013.
Europe stood at some USD 487.1 million, or 8 per cent of the total planned activities, which represents an increase of some USD 102 million (26 per cent) compared to 2013. Europe’s largest budgetary requirements (88 per cent) remained in Pillar 1 for refugee programmes.
The Americas remained stable at 2 per cent of the total requirements with some USD 110.5 million.
The aggregate requirements for Global Programmes and Headquarters stood at USD 497.4 million, or 8 per cent of the total, with a slight increase in dollar terms of some USD 75 million.
MAJOR COUNTRY OPERATIONS
At the country level, in 2014 the largest operational requirements were in Iraq (a total of USD 564.3 million of which USD 359.9 million or 64 per cent was for Pillar 4), owing to the critical situation in the country.
Major needs remained located in the Middle East countries involved in the emergency response to the Syria situation, Lebanon (USD 455.2 million almost entirely for refugee programmes), Syria (USD 331.4 million of which 79 per cent was for IDP projects) and Jordan (USD 307.7 million for refugee programmes).
In Europe, Turkey was also involved in the response to the Syria situation with some USD 318.4 million for refugee programmes.
In Africa, the largest requirements were in South Sudan (USD 423.0 million of which 53 per cent was for IDP projects and 45 per cent for refugee programmes), followed by Kenya and Ethiopia (USD 285.1 million and USD 283.7 million respectively), mainly for refugee programmes, as well as Uganda (USD 232.1 million) and Chad (USD 227.1 million).
In Asia, Pakistan accounted for some USD 162.5 million of which 37 per cent was for reintegration projects (Pillar 3) and 35 per cent for refugee programmes (Pillar 1).
In 2014, UNHCR utilized USD 89.3 million from its Operational Reserve to meet additional needs for Global Programmes (USD 39.6 million or 44 per cent of the total), field operations (USD 38.7 million or 43 per cent of the total, mainly in Asia and Africa) and Headquarters (USD 11.0 million or 12 per cent).
Use made of the NAM Reserve in 2014 amounted to USD 1 million of the total approved amount of USD 20 million, with 94 per cent allocated in the Asia and the Pacific region for operations in Bangladesh.

135UNHCR Global Report 2014
F U N D I N G U N H C R ’ S P R O G R A M M E S
MANAGEMENT OF FUNDS
UNHCR’s final budget in 2014 reached USD 6,569.7 million (comprising USD 6,233.0 million for planned activities, USD 324.7 million as reserve balances and USD 12 million for JPOs). This represents an increase
of approximately USD 1,234.3 million (or 23 per cent) in comparison with the 2013 final budget.
Funds available reached USD 3,603.1 million, representing an increase of approximately USD 369.0 million (or 11 per cent) in comparison with 2013.
Expenditure also increased by some USD 383.6 million (or 13 per cent) in comparison with 2013, reaching USD 3,355.4 million. The total 2014 expenditure included USD 3,348.1 million for programmed activities and USD 7.3 million for JPOs.
The 2014 resulting closing funding balance to be brought forward to 2015 is therefore approximately USD 247.7 million. This amount includes specific earmarked funds for the continuation of some of the programmed activities in 2015.
Chart 2 illustrates the trends of budgets, funds available and expenditure for the eight-year period from 2007 to 2014. The sharp increase in requirements in 2010 corresponded to the move to comprehensive needs-based planning and budgeting as of that year. The chart illustrates the commensurate increase in funds available and expenditure. Nevertheless, the gap between funds available and overall requirements remains evident, amounting to some USD 2,966.6 million (or 45 per cent) in 2014.
EXPENDITURE BY PILLAR
In 2014, expenditure for refugee programmes (Pillar 1 excluding JPOs) amounted to approximately USD 2,619.7 million: in comparison with expenditure for refugee programmes in 2013 this represents an increase of some USD
233.9 million or 10 per cent. The ratio of Pillar 1 expenditure over total expenditure for programmed activities was 78 per cent in 2014 with a decrease of 2 per cent compared to 2013.
Expenditure for IDP projects (Pillar 4) amounted to USD 613.3 million in 2014. This reflects an increase of approximately USD 162.7 million (or 36 per cent) in comparison with expenditure for IDP projects in 2013. The ratio of expenditure for IDP projects over total expenditure for programmed activities was 18 per cent in 2014, compared to 15 per cent in 2013.
Expenditure on reintegration projects (Pillar 3) and stateless programmes (Pillar 2) amounted to USD 79.1 million and USD 36.0 million respectively. When compared to 2013, there was a moderate decrease in Pillar 3 expenditure while expenditure remained the same for Pillar 2. The ratios of pillar expenditure over total expenditure for programmed activities remained fairly stable at 2 and 1 per cent for Pillar 3 and Pillar 2 respectively.
UNHCR budgets, funds available and expenditure | 2007 - 2014 CHART 2

136 UNHCR Global Report 2014
F U N D I N G U N H C R ’ S P R O G R A M M E S
Chart 3 provides further details on expenditure breakdown by region and pillar.
EXPENDITURE BY REGION
At the regional level, the greatest expenditure was incurred in the Middle East and North Africa (MENA) region where it reached USD 1,198.8 million, with a net increase of some USD 140.8 million compared to
2013, and accounted for 36 per cent of the total expenditure for programmed activities, the same level as in 2013. Over 68 per cent of the total expenditure in the MENA region was for refugee programmes under Pillar 1 while 31 per cent was for IDP projects (Pillar 4). In particular, the expenditure for IDP projects in the region increased by some USD 120.3 million or 47 per cent compared to expenditure for IDP projects in 2013, mainly due to the extensive humanitarian needs in Iraq.
Expenditure in Africa amounted to USD 1,125.2 million and accounted for 34 per cent of total expenditure for programmed activities in 2014. The bulk of the expenditure, over 84 per cent, was for refugee programmes and some 12 per cent for IDP projects. The comparison with total 2013 expenditure in Africa shows a net increase of approximately USD 153.1 million or 16 per cent, distributed primarily over Pillar 1 by USD 104.8 million and by USD 45.8 million in Pillar 4. The main expenditure increases in 2014 are found in the East and Horn of Africa region, namely in Ethiopia and Uganda for refugee operations and South Sudan for IDP projects, as well as in the Central Africa and the Great Lakes subregion for refugee operations in Cameroon.
Expenditure for programmed activities by region and pillar | 2014 CHART 3
Programmed activities: expenditure by region | 2014 CHART 4
137UNHCR Global Report 2014
F U N D I N G U N H C R ’ S P R O G R A M M E S
As was already the case in 2013, in 2014 the expenditure in the Asia and the Pacific region continued to decline, from 10 per cent to 8 per cent of total expenditure for programmed activities at USD 269.5 million of which some 60 per cent was for refugee programmes.
Expenditure in Europe increased by some USD 38.5 million or 23 per cent compared to 2013, amounting in 2014 to USD 209.3 million or 6 per cent of the total expenditure for programmed activities. Expenditure for refugee programmes accounted for some 83 per cent of the total expenditure in Europe, with an increase of USD 30.7 million or 21 per cent in comparison with 2013. The bulk of the increase was incurred in Eastern Europe.
Expenditure in the Americas remained at USD 61.1 million, at the same level as in 2013, and accounted for just under 2 per cent of total expenditure for programmed activities.
Expenditure on Global Programmes at USD 278.9 million increased by some USD 62.2 million with a 29 per cent increase compared to 2013, but its share of total expenditure for programmed activities remained fairly stable at 8 per cent.
There was a minor increase of USD 11.9 million in expenditure on Headquarters although compared to total
programmed expenditure, Headquarters expenditure continued to decrease from 8 per cent in 2012 to 6.5 per cent in 2013 and 6.1 per cent in 2014.
Chart 4 provides the percentage by region for 2014 programmed expenditure.
| Income |
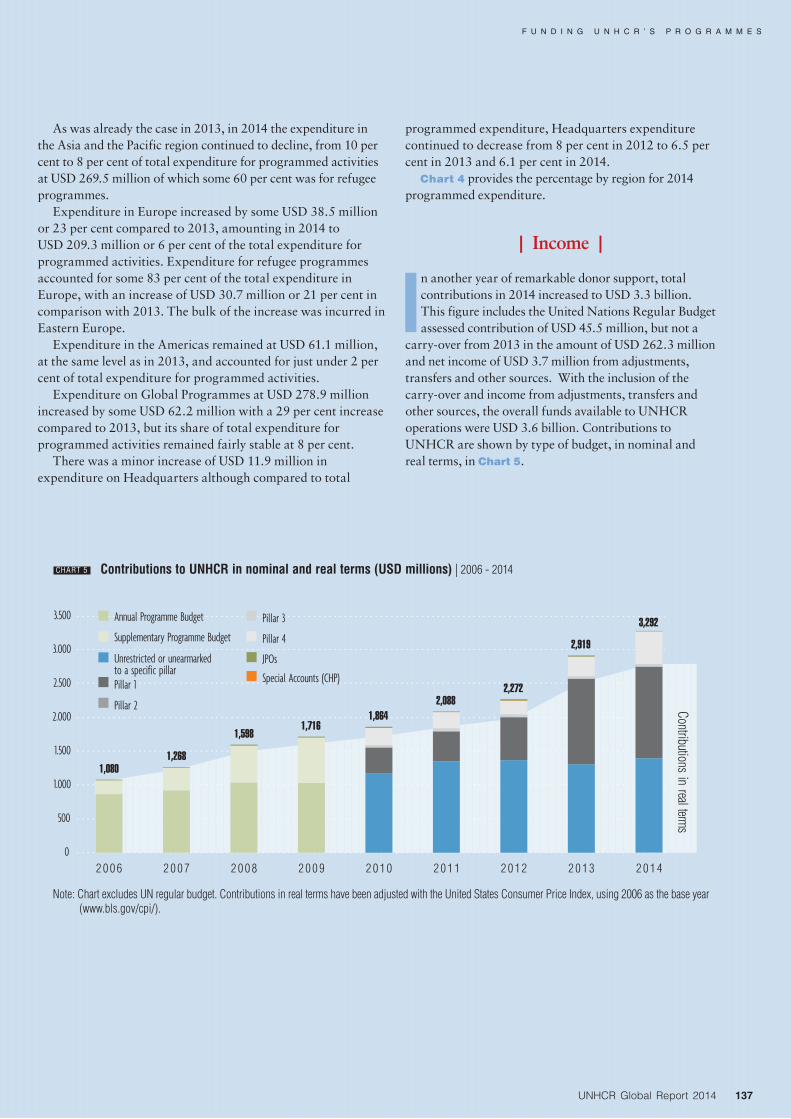
In another year of remarkable donor support, total contributions in 2014 increased to USD 3.3 billion. This figure includes the United Nations Regular Budget assessed contribution of USD 45.5 million, but not a
carry-over from 2013 in the amount of USD 262.3 million and net income of USD 3.7 million from adjustments, transfers and other sources. With the inclusion of the carry-over and income from adjustments, transfers and other sources, the overall funds available to UNHCR operations were USD 3.6 billion. Contributions to UNHCR are shown by type of budget, in nominal and real terms, in Chart 5.
Contributions to UNHCR in nominal and real terms (USD millions) | 2006 - 2014 CHART 5
Note: Chart excludes UN regular budget. Contributions in real terms have been adjusted with the United States Consumer Price Index, using 2006 as the base year (www.bls.gov/cpi/).

138 UNHCR Global Report 2014
F U N D I N G U N H C R ’ S P R O G R A M M E S
While UNHCR continued to work on broadening its sources of income, the share of contributions remained practically the same as in 2013, with approximately 53.4 per cent of voluntary contributions provided by UNHCR’s top three donors, and 82.2 per cent by the top 10 donors (see Chart 6). The top donors in 2014 are the United States, the European Union, and private-sector donations, followed by the United Kingdom and Japan. UNHCR’s main donors are shown in Chart 7, while the full list of donors in 2014 can be found in Table 4. For more detailed donor profiles, see UNHCR’s Global Focus website (http://reporting.unhcr.org).
POOLED FUNDING AND DEVELOPMENT PARTNERSHIPS
In 2014, UNHCR continued to seek funding from decentralized humanitarian, transitional and development sources, and to support field operations in the preparation of submissions.
Further investment was made at both headquarters and field levels to produce high quality proposals and reports on the implementation of projects through such funding streams.
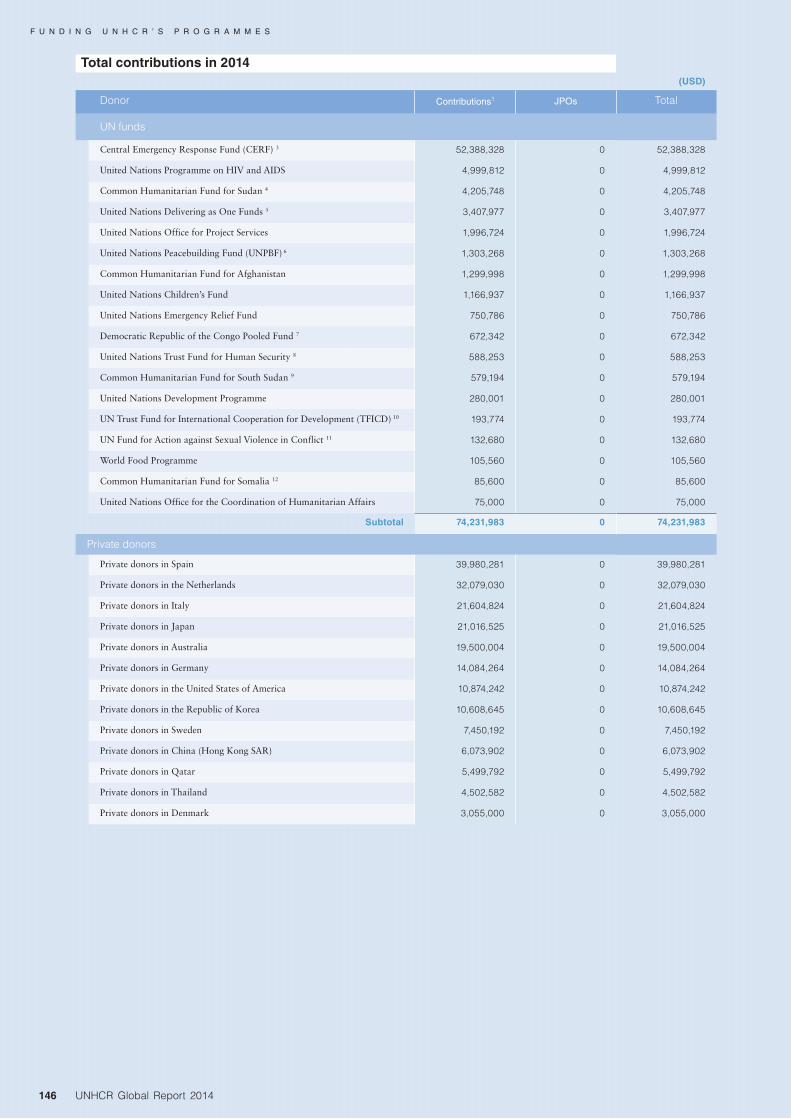
The total amount of contributions received from UN-managed pooled and trust funds in 2014 was USD 74.2 million, compared to USD 94.9 million in 2013. Funding from the Central Emergency Response Fund (CERF) fell to USD 52.4 million, and contributions from the Common Humanitarian Funds (CHFs) decreased from USD 9 million in 2013 to USD 6.1 million in 2014, owing to a significant drop in funds received from the CHF Sudan. The CHF contributions of USD 6.2 million were for needs in Afghanistan, Somalia, South Sudan and Sudan. Other significant pooled funding was received from the UN Delivering as One Funds (USD 3.4 million). The CERF remains a significant funding source, ranking as UNHCR’s 14th largest source of income in 2014.
In 2014, UNHCR continued to strengthen its partnerships with development actors, including UNDP and the World Bank, as well as to ensure that displacement issues are on the development agenda. In addition to the Solutions Strategy for Afghan Refugees to Support Voluntary Repatriation, Sustainable Reintegration and Assistance to Host Countries and the Transitional Solutions Initiative in Eastern Sudan and in Colombia, UNHCR is also partnering with a broad coalition of States, civil society groups, international organizations and others through the Solutions Alliance, a new network of actors committed to addressing protracted displacement situations and avoiding new protracted displacement situations.
Japan
European Union
Private donors
Sweden
Netherlands
United Kingdom
Norway
Germany
Canada
Denmark
Australia
Switzerland
Finland
France
Other donors
United States of America
39%
8%
6%
6% 6%
3%
4%
2%
2%
1%
6%
Kuwait
3%
3%
4%
Main donors in 2014 CHART 7
2%
1%1%
1%1%
Qatar
Saudi Arabia
Share of contributions by main donors | 2006 - 2014 CHART 6
Other donors
Next 7 donors
Top 3 donors
Note: Chart excludes UN regular budget.

139UNHCR Global Report 2014
F U N D I N G U N H C R ’ S P R O G R A M M E S
PRIVATE-SECTOR FUNDRAISING
UNHCR experienced yet another year of notable achievements in building relations and drawing contributions from the private sector. In 2014, UNHCR received USD 208.2 million
from private donors, surpassing the USD 200 million mark for the first time (see Chart 8). This represents an increase of some 310 per cent as compared to 2009.
In Chart 9 which displays private-sector contributions by origin, it can be seen that the private-sector donor base has continued to grow. Contributions from private donors in Spain, the Netherlands, Italy, Japan, Australia, Germany, the United States, the Republic of Korea, Sweden and China (Hong Kong SAR) were the top 10 sources of UNHCR’s private-sector funding in 2014.
Private-sector contributions (USD millions) | 2006 - 2014 CHART 8
Private-sector contributions by origin | 2014 CHART 9
USD millions
140 UNHCR Global Report 2014
F U N D I N G U N H C R ’ S P R O G R A M M E S
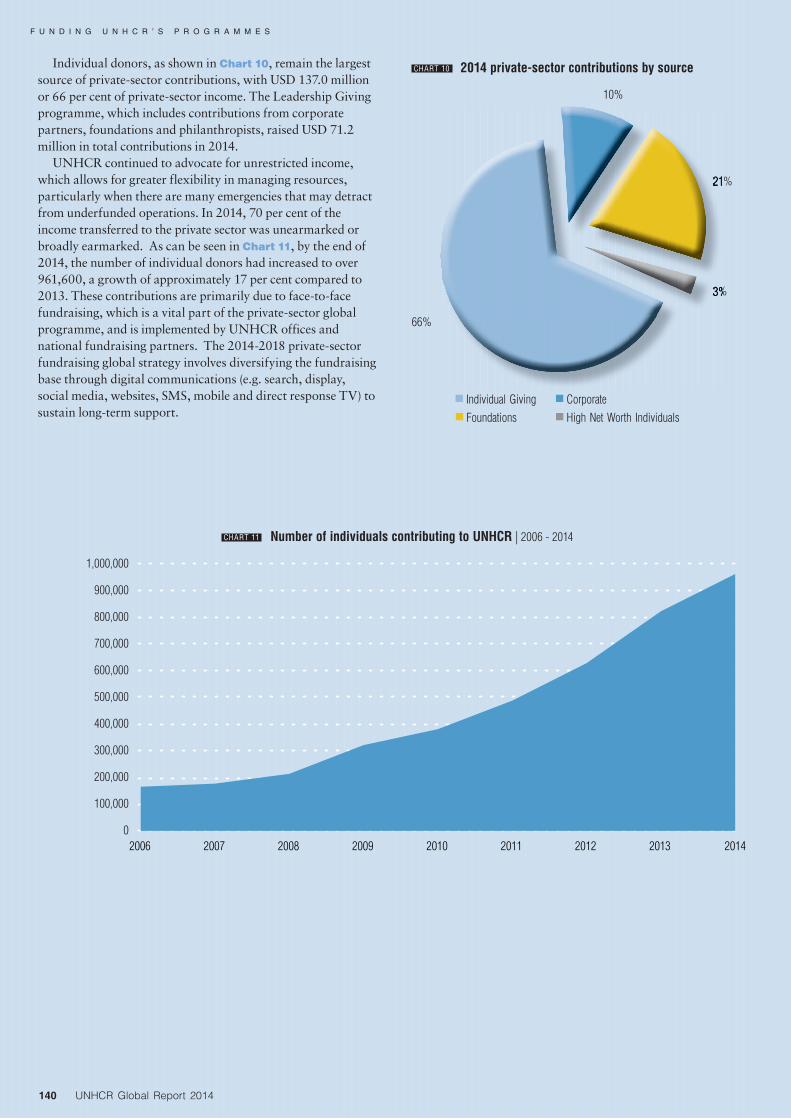
Individual donors, as shown in Chart 10, remain the largest source of private-sector contributions, with USD 137.0 million or 66 per cent of private-sector income. The Leadership Giving programme, which includes contributions from corporate partners, foundations and philanthropists, raised USD 71.2 million in total contributions in 2014.
UNHCR continued to advocate for unrestricted income, which allows for greater flexibility in managing resources, particularly when there are many emergencies that may detract from underfunded operations. In 2014, 70 per cent of the income transferred to the private sector was unearmarked or broadly earmarked. As can be seen in Chart 11, by the end of 2014, the number of individual donors had increased to over 961,600, a growth of approximately 17 per cent compared to 2013. These contributions are primarily due to face-to-face fundraising, which is a vital part of the private-sector global programme, and is implemented by UNHCR offices and national fundraising partners. The 2014-2018 private-sector fundraising global strategy involves diversifying the fundraising base through digital communications (e.g. search, display, social media, websites, SMS, mobile and direct response TV) to sustain long-term support.
2014 private-sector contributions by source CHART 10
1,000,000
900,000
800,000
700,000
600,000
500,000
400,000
300,000
200,000
100,000
0
Number of individuals contributing to UNHCR | 2006 - 2014 CHART 11
66%
10%
21%
3%
21%21%21%
3%3%3%
141UNHCR Global Report 2014
F U N D I N G U N H C R ’ S P R O G R A M M E S
| Quality of contributions |
In order to provide reliable and uninterrupted protection and assistance for populations of concern, the Office depends on early and unrestricted donor support. Predictable funding is essential to plan, budget and implement operations in a timely
and efficient manner. While the US dollar value of unrestricted funding of UNHCR’s
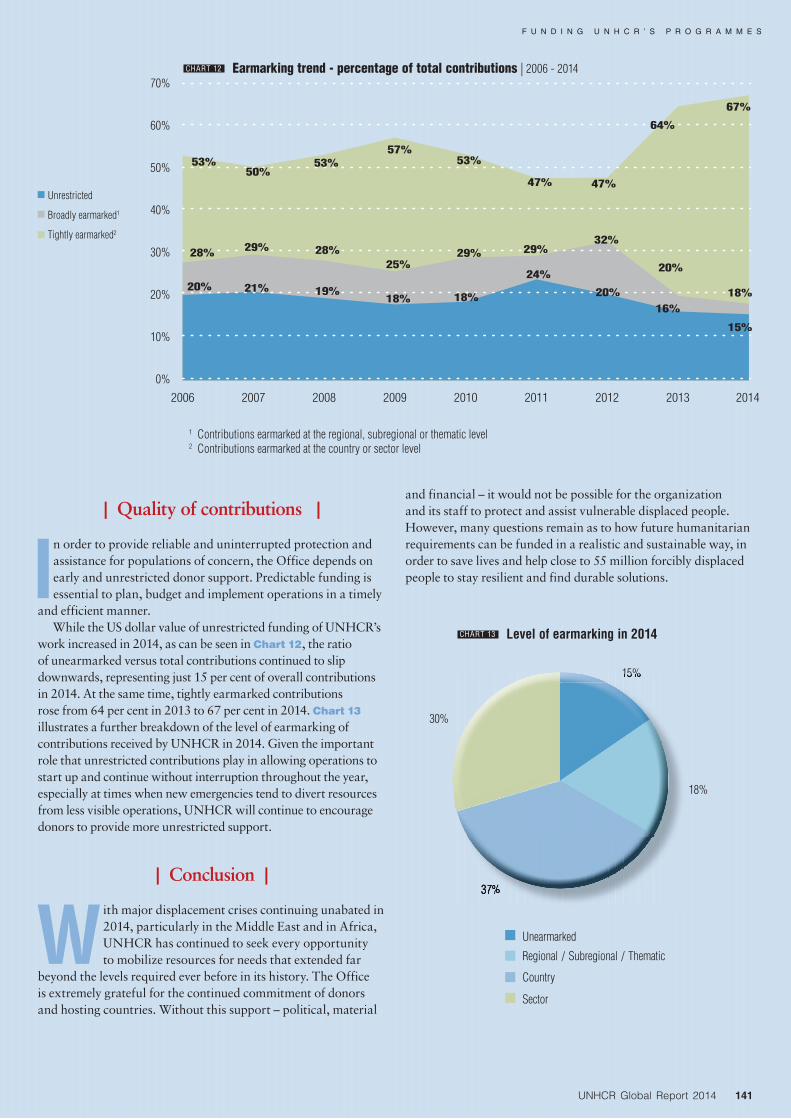
work increased in 2014, as can be seen in Chart 12, the ratio of unearmarked versus total contributions continued to slip downwards, representing just 15 per cent of overall contributions in 2014. At the same time, tightly earmarked contributions rose from 64 per cent in 2013 to 67 per cent in 2014. Chart 13 illustrates a further breakdown of the level of earmarking of contributions received by UNHCR in 2014. Given the important role that unrestricted contributions play in allowing operations to start up and continue without interruption throughout the year, especially at times when new emergencies tend to divert resources from less visible operations, UNHCR will continue to encourage donors to provide more unrestricted support.
| Conclusion |
With major displacement crises continuing unabated in 2014, particularly in the Middle East and in Africa, UNHCR has continued to seek every opportunity to mobilize resources for needs that extended far
beyond the levels required ever before in its history. The Office is extremely grateful for the continued commitment of donors and hosting countries. Without this support – political, material
and financial – it would not be possible for the organization and its staff to protect and assist vulnerable displaced people. However, many questions remain as to how future humanitarian requirements can be funded in a realistic and sustainable way, in order to save lives and help close to 55 million forcibly displaced people to stay resilient and find durable solutions.
Level of earmarking in 2014 CHART 13
1 Contributions earmarked at the regional, subregional or thematic level2 Contributions earmarked at the country or sector level
70%
60%
50%
40%
30%
20%
10%
0%
Unrestricted
Broadly earmarked1
Tightly earmarked2
Earmarking trend - percentage of total contributions | 2006 - 2014 CHART 12

142 UNHCR Global Report 2014
F U N D I N G U N H C R ’ S P R O G R A M M E S
TABLE 1Budget and expenditure in 2014
(USD)
Subregion
Pillar 1 Refugee
programme
Pillar 2 Stateless
programme
Pillar 3 Reintegration
projects
Pillar 4 IDP
projects Total
Central Africa and the Great Lakes
Budget 307,970,396 2,809,642 64,777,447 127,766,329 503,323,814
Expenditure 175,781,135 1,299,486 22,289,366 36,784,365 236,154,352
East and Horn of Africa Budget 1,407,771,179 12,567,881 15,006,956 299,263,267 1,734,609,283
Expenditure 613,326,614 5,745,710 3,130,447 88,577,817 710,780,588
West Africa Budget 205,830,081 3,836,016 9,329,473 54,252,741 273,248,311
Expenditure 118,993,898 2,130,337 4,163,614 10,493,252 135,781,101
Southern Africa Budget 69,955,136 1,139,941 - 690,555 71,785,632
Expenditure 41,601,755 530,332 - 347,899 42,479,986
North Africa Budget 175,288,903 509,962 - 2,050,000 177,848,865
Expenditure 98,903,228 88,692 - 383,024 99,374,944
Middle East Budget 1,070,743,151 3,732,621 39,598,855 652,731,435 1,766,806,062
Expenditure 712,056,164 3,078,401 10,535,762 373,769,158 1,099,439,485
South-West Asia Budget 184,600,696 212,420 120,933,719 77,188,051 382,934,886
Expenditure 88,791,053 185,668 34,246,586 35,679,540 158,902,847
Central Asia Budget 10,120,377 4,024,848 - 2,457,167 16,602,392
Expenditure 5,587,550 2,896,797 - 1,432,522 9,916,869
South Asia Budget 31,381,187 2,336,884 3,030,049 1,264,439 38,012,559
Expenditure 18,175,829 463,396 491,882 967,069 20,098,176
South-East Asia Budget 84,648,403 16,994,259 - 57,397,389 159,040,051
Expenditure 38,357,348 7,955,182 - 23,839,167 70,151,697
East Asia and the Pacific Budget 13,554,106 298,032 - - 13,852,138
Expenditure 10,043,182 283,339 - - 10,326,521
Eastern Europe Budget 348,653,091 3,224,190 - 21,416,117 373,293,398
Expenditure 114,936,788 1,284,114 - 13,355,687 129,576,589
South-Eastern Europe Budget 16,939,696 4,820,537 5,595,628 18,285,055 45,640,916
Expenditure 9,449,523 3,334,647 4,212,107 9,535,412 26,531,689
Northern, Western, Central and Southern Europe
Budget 64,254,085 3,810,594 - - 68,064,679
Expenditure 50,313,784 2,856,909 - - 53,170,693
North America and the Caribbean
Budget 9,697,762 7,448,701 - 3,270,295 20,416,758
Expenditure 6,937,387 3,563,959 - 620,575 11,121,921
Latin America Budget 60,538,773 502,657 - 29,177,542 90,218,972
Expenditure 32,203,278 265,713 - 17,513,854 49,982,845
Global Programmes Budget 287,827,709 - - - 287,827,709
Expenditure 278,890,855 - - - 278,890,855
Headquarters1 Budget 209,581,781 - - - 209,581,781
Expenditure 205,400,769 - - - 205,400,769
Subtotal programmed activities
Budget 4,559,356,511 68,269,185 258,272,127 1,347,210,382 6,233,108,205
Expenditure 2,619,750,140 35,962,682 79,069,764 613,299,341 3,348,081,927
Operational Reserve Budget 305,665,349 - - - 305,665,349
NAM Reserve2 Budget 18,979,973 - - - 18,979,973
Junior Professional Officers
Budget 12,000,000 - - - 12,000,000
Expenditure 7,327,376 - - - 7,327,376
Budget 4,896,001,833 68,269,185 258,272,127 1,347,210,382 6,569,753,527
Expenditure 2,627,077,516 35,962,682 79,069,764 613,299,341 3,355,409,303
1 Includes allocations from the UN Regular Budget as follows: USD 45,551,800 (budget) and USD 45,594,595 (expenditure)2 “New or additional activities - mandate-related” (NAM) Reserve

143UNHCR Global Report 2014
F U N D I N G U N H C R ’ S P R O G R A M M E S
TABLE 2Supplementary budgets in 2014
(USD)
Description Region / Subregion Budget
Emergency response for the Syria situationUNHCR requirements in the regional Refugee Response Plan 2014 (RRP6) and the Syria Humanitarian Assistance Response Plan 2014 (SHARP)
Middle East and North Africa 205,835,722
Europe 6,616,344
Subtotal 212,452,066
Mainstreaming of the Emergency/Non-Food Item project in Sudan
East and Horn of Africa 12,500,000
Subtotal 12,500,000
Emergency response for the South Sudan situationUNHCR requirements in the South Sudan emergency revised regional Refugee Response Plan (RRP) issued in July 2014 and the Emergency Response for the South Sudan situation revised Supplementary Appeal issued in August 2014
East and Horn of Africa 501,417,653
Global Programmes 250,000
Headquarters 504,305
Subtotal 502,171,958
Emergency response for the Iraq situationRevised Supplementary Appeal issued in September 2014
Middle East and North Africa 329,040,828
Europe 5,900,000
Headquarters 13,839
Subtotal 334,954,667
Emergency response for the Central African Republic situationUNHCR requirements in the Central African Republic revised regional Refugee Response Plan issued in July 2014 and the Emergency Response for the Central African Republic situation revised Supplementary Appeal issued in August 2014
East and Horn of Africa 27,640,433
Central Africa and the Great Lakes 128,234,424
West Africa 372,472
Global Programmes 500,000
Headquarters 769,340
Subtotal 157,516,669
Emergency response for Internally Displaced Persons from North Waziristan Agency in PakistanSupplementary Appeal issued in July 2014
Asia and the Pacific 15,130,400
Subtotal 15,130,400
Emergency response for the Nigeria situa-tionNigeria regional Refugee Response Plan (RRP) issued in September 2014 and Emergency Response for the Nigeria situation Supplementary Appeal issued in September 2014
West Africa 7,615,560
East and Horn of Africa 3,455,378
Central Africa and the Great Lakes 5,521,053
Subtotal 16,591,991
Internally Displaced People in UkraineSupplementary Appeal issued in August 2014
Europe 10,593,000
Subtotal 10,593,000
Total 1,261,910,751
TABLE 3Summary of contributions in 2014
(USD)
Donor
Unearmarked or broadly earmarked
Pillar 1 Refugee
programme
Pillar 2 Stateless
programme
Pillar 3 Reintegration
projects
Pillar 4 IDP
projects JPOs Total
Governments and the European Union
1,261,256,305 1,016,130,797 2,490,057 29,766,946 417,592,974 7,872,428 2,735,109,507
Inter-governmental bodies 1,146,639 238,353,298 1,032,189 3,867,104 30,272,214 274,671,444
Private donors 138,525,679 60,170,447 264,010 9,266,347 208,226,484
UN funds 199,117 47,157,430 337,550 2,006,403 24,531,483 74,231,983
UN Regular Budget 45,551,800 45,551,800
Total 1,401,127,740 1,407,363,772 3,859,796 35,904,462 481,663,018 7,872,428 3,337,791,218
Note: Includes indirect support costs that are recovered from contributions to Pillars 3 and 4, supplementary budgets and the “New or additional activities – mandate-related” (NAM) Reserve

144 UNHCR Global Report 2014
F U N D I N G U N H C R ’ S P R O G R A M M E S
TABLE 4Total contributions in 2014
(USD)
Donor Contributions1 JPOs Total
Governments and the European Union
United States of America 1,279,067,870 1,760,000 1,280,827,870
European Union 271,511,801 0 271,511,801
United Kingdom 203,507,919 0 203,507,919
Japan 180,656,824 955,642 181,612,466
Germany 138,460,391 1,037,221 139,497,612
Sweden 134,103,834 131,319 134,235,153
Kuwait 104,356,762 0 104,356,762
Saudi Arabia 92,295,902 0 92,295,902
Norway 90,247,067 679,529 90,926,595
Netherlands 76,720,760 840,149 77,560,909
Denmark 76,750,590 479,337 77,229,927
Canada 73,423,460 0 73,423,460
Australia 48,200,780 0 48,200,780
Switzerland 47,684,728 0 47,684,728
Finland 31,363,238 909,668 32,272,906
Qatar 26,431,993 0 26,431,993
France 21,080,878 381,932 21,462,810
Republic of Korea 15,692,275 178,185 15,870,460
Ireland 13,043,719 0 13,043,719
Italy 11,161,966 130,873 11,292,839
Luxembourg 10,518,204 37,681 10,555,885
Belgium 9,978,099 350,892 10,328,991
Spain2 7,577,540 0 7,577,540
United Arab Emirates 6,703,556 0 6,703,556
New Zealand 5,829,916 0 5,829,916
Bahrain 3,530,000 0 3,530,000
Brazil 3,213,557 0 3,213,557
Austria 2,815,524 0 2,815,524
Russian Federation 2,000,000 0 2,000,000
Hungary 1,918,027 0 1,918,027
Morocco 1,029,077 0 1,029,077
Mexico 1,025,000 0 1,025,000
China 929,464 0 929,464
Turkey 700,000 0 700,000
Estonia 676,790 0 676,790
Poland 655,798 0 655,798
Czech Republic 394,441 0 394,441
Argentina 326,000 0 326,000
Monaco 318,151 0 318,151
Portugal 307,357 0 307,357
Romania 229,096 0 229,096
Liechtenstein 220,507 0 220,507

145UNHCR Global Report 2014
F U N D I N G U N H C R ’ S P R O G R A M M E S
Total contributions in 2014(USD)
Donor Contributions1 JPOs Total
Kazakhstan 206,788 0 206,788
Armenia 198,712 0 198,712
Latvia 146,335 0 146,335
Algeria 100,000 0 100,000
Israel 100,000 0 100,000
Chile 100,000 0 100,000
Croatia 97,541 0 97,541
Turkmenistan 94,090 0 94,090
Viet Nam 90,000 0 90,000
Namibia 88,399 0 88,399
Montenegro 86,122 0 86,122
Slovak Republic 79,513 0 79,513
Kyrgyzstan 71,154 0 71,154
Greece 68,027 0 68,027
Nigeria 63,735 0 63,735
Lithuania 63,434 0 63,434
Malta 62,267 0 62,267
Singapore 50,000 0 50,000
Indonesia 50,000 0 50,000
Slovenia 41,379 0 41,379
Azerbaijan 36,724 0 36,724
Uruguay 30,000 0 30,000
Georgia 25,000 0 25,000
South Africa 21,264 0 21,264
Thailand 20,000 0 20,000
Holy See 20,000 0 20,000
Costa Rica 15,147 0 15,147
Botswana 13,288 0 13,288
Andorra 13,175 0 13,175
Bulgaria 11,000 0 11,000
Tunisia 7,000 0 7,000
India 6,679 0 6,679
Cyprus 6,244 0 6,244
Serbia 5,000 0 5,000
Mozambique 2,000 0 2,000
Subtotal 2,998,748,880 7,872,428 3,006,621,309
Intergovernmental bodies
Intergovernmental Authority on Development 2,500,000 0 2,500,000
International Organization for Migration 309,642 0 309,642
African Union 200,000 0 200,000
Arab Gulf Programme for United Nations Development Organizations 150,000 0 150,000
Subtotal 3,159,642 0 3,159,642
146 UNHCR Global Report 2014
F U N D I N G U N H C R ’ S P R O G R A M M E S
Total contributions in 2014(USD)
Donor Contributions1 JPOs Total
UN funds
Central Emergency Response Fund (CERF) 3 52,388,328 0 52,388,328
United Nations Programme on HIV and AIDS 4,999,812 0 4,999,812
Common Humanitarian Fund for Sudan 4 4,205,748 0 4,205,748
United Nations Delivering as One Funds 5 3,407,977 0 3,407,977
United Nations Office for Project Services 1,996,724 0 1,996,724
United Nations Peacebuilding Fund (UNPBF) 6 1,303,268 0 1,303,268
Common Humanitarian Fund for Afghanistan 1,299,998 0 1,299,998
United Nations Children’s Fund 1,166,937 0 1,166,937
United Nations Emergency Relief Fund 750,786 0 750,786
Democratic Republic of the Congo Pooled Fund 7 672,342 0 672,342
United Nations Trust Fund for Human Security 8 588,253 0 588,253
Common Humanitarian Fund for South Sudan 9 579,194 0 579,194
United Nations Development Programme 280,001 0 280,001
UN Trust Fund for International Cooperation for Development (TFICD) 10 193,774 0 193,774
UN Fund for Action against Sexual Violence in Conflict 11 132,680 0 132,680
World Food Programme 105,560 0 105,560
Common Humanitarian Fund for Somalia 12 85,600 0 85,600
United Nations Office for the Coordination of Humanitarian Affairs 75,000 0 75,000
Subtotal 74,231,983 0 74,231,983
Private donors
Private donors in Spain 39,980,281 0 39,980,281
Private donors in the Netherlands 32,079,030 0 32,079,030
Private donors in Italy 21,604,824 0 21,604,824
Private donors in Japan 21,016,525 0 21,016,525
Private donors in Australia 19,500,004 0 19,500,004
Private donors in Germany 14,084,264 0 14,084,264
Private donors in the United States of America 10,874,242 0 10,874,242
Private donors in the Republic of Korea 10,608,645 0 10,608,645
Private donors in Sweden 7,450,192 0 7,450,192
Private donors in China (Hong Kong SAR) 6,073,902 0 6,073,902
Private donors in Qatar 5,499,792 0 5,499,792
Private donors in Thailand 4,502,582 0 4,502,582
Private donors in Denmark 3,055,000 0 3,055,000

147UNHCR Global Report 2014
F U N D I N G U N H C R ’ S P R O G R A M M E S
Total contributions in 2014(USD)
Donor Contributions1 JPOs Total
Private donors in Canada 2,456,475 0 2,456,475
Private donors in Switzerland 2,295,337 0 2,295,337
Private donors in the United Arab Emirates 2,039,885 0 2,039,885
Private donors in the United Kingdom 1,443,491 0 1,443,491
Private donors in Saudi Arabia 1,058,203 0 1,058,203
Private donors in Venezuela (Bolivarian Rep. of) 1,051,572 0 1,051,572
Private donors in Norway 958,135 0 958,135
Private donors in Austria 157,849 0 157,849
Private donors in Greece 141,540 0 141,540
Private donors in France 99,235 0 99,235
Private donors in Lebanon 50,000 0 50,000
Private donors in the Philippines 48,744 0 48,744
Private donors in New Zealand 30,000 0 30,000
Private donors in Angola 20,537 0 20,537
Private donors in Belarus 19,671 0 19,671
Private donors in Mexico 10,074 0 10,074
Private donors in Ireland 4,757 0 4,757
Private donors in Romania 3,177 0 3,177
Private donors in Jordan 2,816 0 2,816
Private donors in Belgium 2,366 0 2,366
Private donors in Turkey 1,867 0 1,867
Private donors in the Czech Republic 1,165 0 1,165
Private donors in Malaysia 306 0 306
Subtotal 208,226,484 0 208,226,484
Total 3,284,366,990 7,872,428 3,292,239,418
Note: Includes indirect support costs that are recovered from contributions to Pillars 3 and 4, supplementary budgets and the “New or additional activities - mandate-related” (NAM) Reserve and excludes the UN Regular Budget allocation1 Includes USD 88,317,600 received through the United Nations Office for the Coordination of Humanitarian Affairs 2 Contribution from Central Government: USD 3,514,552; contribution from other public sources channelled through España con ACNUR: USD 4,062,9883 For details of all donors go to the CERF website: http://cerf.un.org4 Funded by the Governments of Australia, Denmark, Ireland, the Netherlands, Norway, Spain, Sweden and the United Kingdom5 Funded by the Governments of the Netherlands, Norway, Spain and the United Kingdom 6 For details of donors go to the UNPBF website: http://www.unpbf.org/7 Funded by the Governments of Belgium, Ireland, Luxembourg, Norway, Spain, Sweden and the United Kingdom8 Funded by the Government of Japan9 Funded by the Governments of Australia, Denmark, Ireland, the Netherlands, Norway, Sweden and the United Kingdom 10 Funded by the Government of Japan11 Funded by the Governments of Finland, Norway, Sweden and the United Kingdom12 Funded by the Governments of Australia, Denmark, Finland, Germany, Ireland, the Netherlands, Norway, Sweden, Switzerland, and the United Kingdom

148 UNHCR Global Report 2014
F U N D I N G U N H C R ’ S P R O G R A M M E S
TABLE 5Transfers from the 2014 Operational Reserve
(USD)
1. Operational Reserve approved by the Executive Committee in October 2013 394,927,789
2. Transfers from the Operational Reserve (by regions/countries/headquarters)
AFRICAAngola Seeds for Solutions Initiative 1,000,000
Burundi Seeds for Solutions Initiative 500,000
Cameroon Capacity Building Initiative 79,897
Central African Republic Capacity Building Initiative 140,532
Chad Capacity Building Initiative 250,169
Côte d'Ivoire Ebola Virus Disease in West Africa 50,000
Democratic Republic of the Congo Capacity Building Initiative 55,152
Guinea Ebola Virus Disease in West Africa 200,000
Kenya Capacity Building Initiative 43,973
Liberia Ebola Virus Disease in West Africa 1,450,000
Malawi 1) Capacity Building Initiative 38,708
2) Mozambican influx in southern Malawi 100,000
Mali 1) Mali Situation - return and reintegration of Malian refugees 9,700,000
2) Capacity Building Initiative 53,489
Niger Capacity Building Initiative 123,240
Rwanda Capacity Building Initiative 42,334
Senegal Regional Office 1) Capacity Building Initiative 100,175
2) Ebola Virus Disease in West Africa 100,000
Somalia Capacity Building Initiative 257,016
South Africa Regional Office Capacity Building Initiative 304,554
South Sudan Capacity Building Initiative 134,074
Sudan Capacity Building Initiative 100,590
Uganda Capacity Building Initiative 46,435
Zambia Capacity Building Initiative 81,100
Subtotal 14,501,499
MIDDLE EAST AND NORTH AFRICAAlgeria Capacity Building Initiative 46,220
Iraq 1) Iraq Situation 8,265,077
2) Capacity Building Initiative 46,473
Israel Capacity Building Initiative 37,238
Egypt Regional Office Capacity Building Initiative 76,500
Libya Capacity Building Initiative 48,038
Morocco Capacity Building Initiative 71,780
Yemen Capacity Building Initiative 49,867
Subtotal 8,641,194
ASIA AND THE PACIFICAfghanistan 1) Capacity Building Initiative 50,445
2) Afghan Situation 9,000,001
Pakistan Capacity Building Initiative 156,351
The Philippines 1) Emergency response, typhoon Haiyan 4,729,000
2) Capacity Building Initiative 40,764
Kazakhstan Regional Office Capacity Building Initiative 141,262
Tajikistan Capacity Building Initiative 41,826
Indonesia Capacity Building Initiative 39,477
Malaysia Capacity Building Initiative 51,824
Myanmar Capacity Building Initiative 41,294
Thailand Regional Office Capacity Building Initiative 180,219
Subtotal 14,472,462

149UNHCR Global Report 2014
F U N D I N G U N H C R ’ S P R O G R A M M E S
(USD)
EUROPEBelgium Regional Office Capacity Building Initiative 39,481
Bosnia and Herzegovina Capacity Building Initiative 105,352
Georgia Capacity Building Initiative 89,831
Italy Regional Office Capacity Building Initiative 34,877
Iraq Situation 100,000
Subtotal 369,542
AMERICASColombia Capacity Building Initiative 37,097
Ecuador Capacity Building Initiative 100,584
Panama Regional Office Capacity Building Initiative 125,044
Subtotal 262,725
GLOBAL PROGRAMMESExecutive Direction and Management Innovation Initiative 312,590
Division of External Relations Private Sector Fundraising global activities 9,999,998
Division of International Protection 1) Seeds for Solutions Initiative 605,000
2) Capacity Building Initiative 45,967
3) Refugee Status Determination deployments 204,000
4) Global Resettlement activities 1,745,000
5) Advocacy for Protection 86,039
6) DAFI Scholarship Programme 585,645
7) In-kind services for the deployment of standby experts 105,000
Division of Programme Support and Management
1) Seeds for Solutions Initiative 1,882,726
2) Capacity Building Initiative 124,023
3) In-kind services for the deployment of standby experts 136,000
Division of Emergency Security and Supply
1) Global Fleet Management 5,531,525
2) Strengthening Emergency Capacity Management Service 660,984
3) Capacity Building Initiative 106,397
4) Strengthening Field Safety Service 47,509
5) In-kind contribution for free warehouse space 821,823
6) Staff accomodation 285,045
7) In-kind services for the deployment of stand-by experts 2,389,000
8) Refugee housing units 11,500,000
Division of Information Systems and Telecommunications
1) Capacity Building Initiative 56,317
2) Acquisition of software 1,113,986
Division of Human Resources Management
1) Finalization of e-Learning services 325,234
2) Global Protection Cluster learning activities 243,685
3) DHRM Staff Accomodation 478,152
4) Francophone Emergency Management Workshop (WEM) 222,717
Subtotal 39,614,361

150 UNHCR Global Report 2014
F U N D I N G U N H C R ’ S P R O G R A M M E S
(USD)
HEADQUARTERS Executive Direction and Management 1) Support to Executive Office of the Secretary-General 74,987
2) Strengthening the Investigation Service 186,861
3) Capacity Building Initiative 247,373
4) Strengthening the New York Office 134,263
5) Implementation of the UNHCR-DRC investigation roster 280,661
6) Strengthening Executive Direction and Management 77,651
7) Strengthening management support 150,000
Division of External Relations 1) Support to the Office for the Coordination of Humanitarian Affairs 279,646
2) External relations support to the Special Envoy function 225,129
3) UNHCR contribution to United Nations Development Group 1,096,866
4) Capacity Building Initiative 747,742
Division of International Protection 1) Capacity Building Initiative 275,463
2) Seeds for Solutions Initiative 70,000
3) Strengthening the Division of International Protection 216,459
Division of Programme Support and Management
Capacity Building Initiative 215,744
Department of Operations - Regional Bureaus
1) Afghan Situation 150,000
2) Strengthening Department of Operations 117,313
Division of Information Systems and Telecommunications
1) Capacity Building Initiative 70,486
2) Acquisition of software 3,504,000
Division of Human Resources Management
1) Strengthening of human resources 947,655
2) Enhancement of mental health and psychosocial support 90,000
3) Walk-in Clinic 30,500
Global Service Centre 1) Support to Entry-Level Humanitarian Professional Programme and Capacity Building Initiative
250,521
2) Global Protection Cluster learning activities 113,030
3) Improve capacity in procurement services 164,371
4) Improve capacity in logistics services 324,461
5) Capacity Building Initiative in finance 45,967
6) In-kind contribution for free office/warehouse space 798,568
7) Staff accomodation 40,000
Staff Council Assess field staff condition in key operations 25,000
Subtotal 10,950,718
Total transferred 89,262,439
3. Balance 305,665,350
151UNHCR Global Report 2014
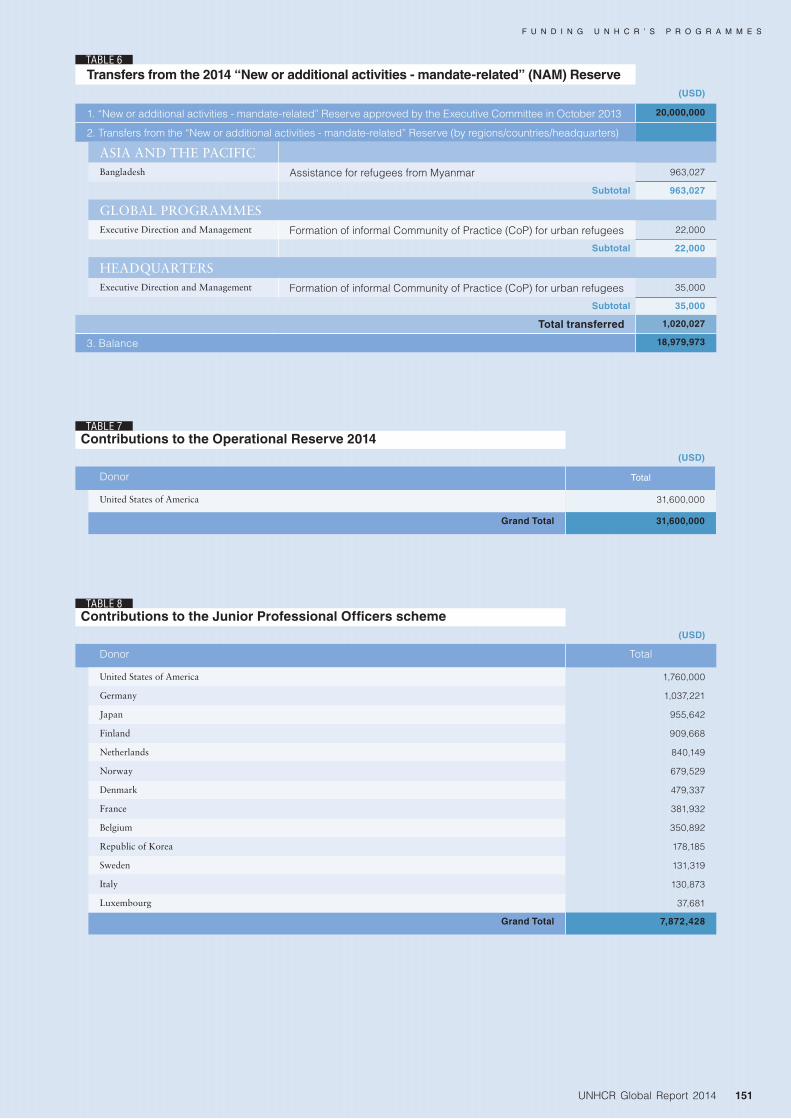
F U N D I N G U N H C R ’ S P R O G R A M M E S
Transfers from the 2014 “New or additional activities - mandate-related” (NAM) Reserve(USD)
1. “New or additional activities - mandate-related” Reserve approved by the Executive Committee in October 2013 20,000,000
2. Transfers from the “New or additional activities - mandate-related” Reserve (by regions/countries/headquarters)
ASIA AND THE PACIFICBangladesh Assistance for refugees from Myanmar 963,027
Subtotal 963,027
GLOBAL PROGRAMMESExecutive Direction and Management Formation of informal Community of Practice (CoP) for urban refugees 22,000
Subtotal 22,000
HEADQUARTERSExecutive Direction and Management Formation of informal Community of Practice (CoP) for urban refugees 35,000
Subtotal 35,000
Total transferred 1,020,027
3. Balance 18,979,973
TABLE 6
TABLE 7Contributions to the Operational Reserve 2014
(USD)
Donor Total
United States of America 31,600,000
Grand Total 31,600,000
TABLE 8Contributions to the Junior Professional Officers scheme
(USD)
Donor Total
United States of America 1,760,000
Germany 1,037,221
Japan 955,642
Finland 909,668
Netherlands 840,149
Norway 679,529
Denmark 479,337
France 381,932
Belgium 350,892
Republic of Korea 178,185
Sweden 131,319
Italy 130,873
Luxembourg 37,681
Grand Total 7,872,428

152 UNHCR Global Report 2014
F U N D I N G U N H C R ’ S P R O G R A M M E S
TABLE 92014 in-kind contributions
(USD)
Donor Description Total
Argentina Premises for UNHCR office in Buenos Aires 126,000
Armenia Premises for UNHCR office in Yerevan 98,712
Austria Premises for UNHCR office in Vienna 58,369
Azerbaijan Premises for UNHCR Warehouse in Baku 6,946
Botswana Premises for UNHCR office in Gabarone 13,288
Canada Core relief items for UNHCR emergency operation in Iraq and deployment of standby experts to various UNHCR operations
434,787
China Premises for UNHCR office in Hong Kong SAR (China) 129,464
Croatia Premises for UNHCR office in Zagreb 48,633
Czech Republic Premises for UNHCR office in Prague 36,751
Denmark Premises for UNHCR office in Copenhagen and rub halls for UNHCR emergency operation in Iraq
234,649
Estonia Food items for Ukraine IDPs 116,090
Germany NFIs for UNHCR operation in Iraq 856,060
Hungary Premises for UNHCR offices in Budapest: Global Service Centre and Regional Repre-sentation for Central Europe
1,802,215
Ireland Deployment of standby experts through Irish Aid 157,500
Italy Premises for UNHCR office in Rome 234,740
Kazakhstan Premises for UNHCR offices in Almaty and Astana 191,788
Kuwait Premises for UNHCR office in Kuwait City 106,762
Kyrgyzstan Premises for UNHCR office in Bishkek 71,154
Luxembourg Premises for UNHCR office at University of Luxembourg 10,325
Montenegro Premises for UNHCR office in Podgorica 86,122
Morocco Premises for UNHCR office in Laayoune, Western Sahara 29,077
Namibia Premises for UNHCR office in Windhoek 88,399
Nigeria Premises for UNHCR office in Lagos 63,735
Poland Premises for UNHCR office in Warsaw 74,141
RedR Deployment of standby experts to various UNHCR operations 90,000
Austrian Red Cross NFIs for UNHCR operation in Iraq 114,436
Danish Refugee Council Deployment of standby experts to various UNHCR operations 120,000
Miscellaneous donors Germany Tents and core relief items for IDPs in Iraq 155,317
AS Roma Clothing for UNHCR operation in Lebanon 54,490
SCA HYGIENE PRODUCTS SPA Sanitary pads for UNHCR operation In Lebanon 14,280
Fast Retailing Co., Ltd. (UNIQLO) Second-hand clothing for UNHCR operations in Algeria, Bangladesh, Burkina Faso, Cameroon, the Democratic Republic of the Congo, Côte d'Ivoire, Jordan, Kenya, Malawi, the Philippines and Syria.
5,502,088
Fuji Optical Optical package to UNHCR operation in Azerbaijan 195,194

153UNHCR Global Report 2014
F U N D I N G U N H C R ’ S P R O G R A M M E S
2014 in-kind contributions(USD)
Donor Description Total
Kohshin Rubber Co Ltd Gumboots for UNHCR operation in Philippines 12,500
Norwegian Church Aid Wash kits for UNHCR operation in Iraq and deployment of standby staff to various UNHCR operations
958,135
Husqvarna AB Chainsaw for UNHCR operation in the Philppines 200,000
UNHCR Insamlinsstiftelse Human Bridge clothes to UNHCR operation in Syria 148,775
International Olympic Committee Sports kits to UNHCR operation in Myanmar and Uganda 59,100
IKEA Foundation Bedding for UNHCR operation in the Phillippines and mattresses and quilts for refugees in Iraq
2,243,986
DUBAI WORLD CENTRAL Clothes and blankets for UNHCR operation in Jordan 89,945
Vodafone Foundation Vodafone tablets for UNHCR operation in Dadaab, Kenya 126,191
Catholic Relief Services Tents for UNHCR operation in Ethiopia 405,720
Latter-day Saint Charities, Inc. Second-hand clothing to UNHCR operation in Cameroon 1,222,500
Localized Water Solutions LLC LWS water system to Mauritania 46,384
Soles for Souls Shoes for UNHCR operations in Syria 151,317
TOMS Shoes Shoes for UHCR operations in Uganda 102,638
Global Bright Foundation Solar lamps to UNHCR operation in Rwanda 114,500
Qatar Tents, blankets, fuel coupons and NFIs to UNHCR operations in Turkey and Lebanon 14,679,605
Romania Premises for UNHCR offices in Bucharest and Timisoara 149,096
South Africa Premises for UNHCR office in Cape Town 21,264
Spain Premises for UNHCR office in Madrid 410,477
Sweden Services by experts deployed by the Swedish Rescue Services (MSB) to various operations, blankets and tents to UNHCR operation in Iraq and mobile workshops to UNHCR global fleet management
1,270,885
Switzerland Deployment of standby experts from Switzerland and tents for UNHCR operation in Iraq
3,764,469
Turkmenistan Premises for UNHCR office in Ashgabat 94,090
United Arab Emirates Premises for UNHCR warehouse in Dubai provided through the International Humanitarian City
1,643,646
United Kingdom Deployment of standby experts from the United Kingdom and tents for UNHCR operation in Iraq
898,160
United Nations Office for the Coordi-nation of Humanitarian Affairs
Tents for UNHCR operation in Afghanistan 75,000
Viet Nam Premises for UNHCR office in Hanoi 90,000
Total 40,299,892

154 UNHCR Global Report 2014
F U N D I N G U N H C R ’ S P R O G R A M M E S
(USD)
Donor Total
Sweden 89,925,316
United Kingdom 55,910,543
Norway 49,293,460
Netherlands 44,836,957
Denmark 27,981,812
Japan 21,882,503
Australia 21,694,215
Switzerland 17,054,033
France 14,000,000
Canada 11,310,592
Germany 10,296,146
Belgium 9,881,423
Finland 9,510,870
Ireland 8,437,068
New Zealand 5,016,722
Republic of Korea 3,092,275
Luxembourg 2,038,043
Italy 1,375,516
Kuwait 1,000,000
Morocco 1,000,000
Saudi Arabia 1,000,000
China 800,000
Austria 734,694
Russian Federation 500,000
Argentina 200,000
Qatar 200,000
Turkey 200,000
United Arab Emirates 200,000
(USD)
Donor Total
Poland 120,548
Algeria 100,000
Israel 100,000
Romania 80,000
Estonia 67,935
Indonesia 50,000
Singapore 50,000
Hungary 41,040
Uruguay 30,000
Azerbaijan 29,778
Monaco 27,174
Mexico 25,000
Latvia 20,380
Portugal 20,000
Thailand 20,000
Costa Rica 15,147
Kazakhstan 15,000
Slovak Republic 13,587
Bulgaria 11,000
Tunisia 7,000
India 6,679
Cyprus 6,244
Holy See 5,000
Serbia 5,000
Mozambique 2,000
Private donors 98,581,258
Total 508,821,959
Unrestricted voluntary contributions in 2014TABLE 10
155UNHCR Global Report 2014
F U N D I N G U N H C R ’ S P R O G R A M M E S
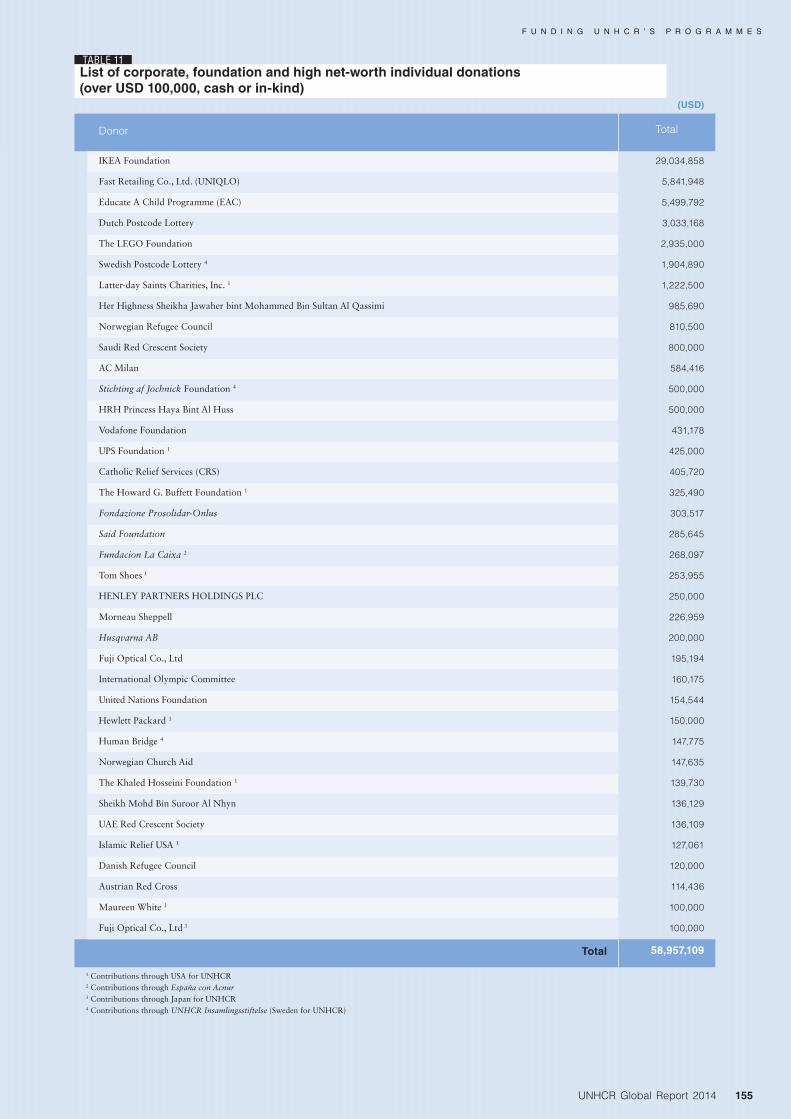
TABLE 11
(USD)
Donor Total
IKEA Foundation 29,034,858
Fast Retailing Co., Ltd. (UNIQLO) 5,841,948
Educate A Child Programme (EAC) 5,499,792
Dutch Postcode Lottery 3,033,168
The LEGO Foundation 2,935,000
Swedish Postcode Lottery 4 1,904,890
Latter-day Saints Charities, Inc. 1 1,222,500
Her Highness Sheikha Jawaher bint Mohammed Bin Sultan Al Qassimi 985,690
Norwegian Refugee Council 810,500
Saudi Red Crescent Society 800,000
AC Milan 584,416
Stichting af Jochnick Foundation 4 500,000
HRH Princess Haya Bint Al Huss 500,000
Vodafone Foundation 431,178
UPS Foundation 1 425,000
Catholic Relief Services (CRS) 405,720
The Howard G. Buffett Foundation 1 325,490
Fondazione Prosolidar-Onlus 303,517
Said Foundation 285,645
Fundacion La Caixa 2 268,097
Tom Shoes 1 253,955
HENLEY PARTNERS HOLDINGS PLC 250,000
Morneau Sheppell 226,959
Husqvarna AB 200,000
Fuji Optical Co., Ltd 195,194
International Olympic Committee 160,175
United Nations Foundation 154,544
Hewlett Packard 1 150,000
Human Bridge 4 147,775
Norwegian Church Aid 147,635
The Khaled Hosseini Foundation 1 139,730
Sheikh Mohd Bin Suroor Al Nhyn 136,129
UAE Red Crescent Society 136,109
Islamic Relief USA 1 127,061
Danish Refugee Council 120,000
Austrian Red Cross 114,436
Maureen White 1 100,000
Fuji Optical Co., Ltd 3 100,000
Total 58,957,109
1 Contributions through USA for UNHCR2 Contributions through España con Acnur3 Contributions through Japan for UNHCR4 Contributions through UNHCR Insamlingsstiftelse (Sweden for UNHCR)
List of corporate, foundation and high net-worth individual donations (over USD 100,000, cash or in-kind)