Fundamental Study on Kinetics of Hemicellulose Hydrolysis ...
172
Fundamental Study on Kinetics of Hemicellulose Hydrolysis and Bioconversion of Hemicellulose Hydrolysate Mixture into Lactic Acid by Suan Shi A dissertation submitted to the Graduate Faculty of Auburn University in partial fulfillment of the requirements for the Degree of Doctor of Philosophy Auburn, Alabama December 12, 2015 Keywords: hemicellulose, kinetic, pretreatment, lactic acid, high solid, residence time distribution Copyright 2015 by Suan Shi Approved by Yoon Y Lee, Chair, Professor of Chemical Engineering Mario Eden, Professor of Chemical Engineering Steve Duke, Associate Professor of Chemical Engineering Maobing Tu, Associate Professor of Forestry and Wildlife Sciences
Transcript of Fundamental Study on Kinetics of Hemicellulose Hydrolysis ...
Fundamental Study on Kinetics of Hemicellulose Hydrolysis and
Bioconversion of Hemicellulose Hydrolysate Mixture into Lactic Acid
by
Suan Shi
A dissertation submitted to the Graduate Faculty of
Auburn University
in partial fulfillment of the
requirements for the Degree of
Doctor of Philosophy
Auburn, Alabama
December 12, 2015
Keywords: hemicellulose, kinetic, pretreatment, lactic acid, high solid,
residence time distribution
Copyright 2015 by Suan Shi
Approved by
Yoon Y Lee, Chair, Professor of Chemical Engineering
Mario Eden, Professor of Chemical Engineering
Steve Duke, Associate Professor of Chemical Engineering
Maobing Tu, Associate Professor of Forestry and Wildlife Sciences

i
Dissertation Abstract
In the first part of this dissertation, the kinetics of hemicellulose hydrolysis in dilute-acid
hydrolysis of Kramer Corn Stover (KCS) under high-solid conditions was investigated. Dilute-
acid pretreatment is one of the most advanced and widely accepted pretreatment technologies.
The National Renewable Energy Laboratory (NREL) has developed a continuous auger-driven
pretreatment reactor that can be operated with high-solid charge. It operates at high temperatures
and with short residence times resulting in high productivity and sugar concentrations above 10
wt%. We investigated the kinetics of the reactions occurring in dilute-acid pretreatment of KCS,
covering the reaction conditions similar to those of the NREL reactor. For this purpose, batch
experiments were performed under high solid conditions and the data were put into kinetic model.
The conventional bi-phasic kinetic model was initially adopted: two different fragments of
hemicellulose to oligomers, to xylose, and to decomposition products. In the model verification
process, we observed consistent discrepancies in which xylose and its oligomers were under-
estimated during the latter phase of the reactions. It was then speculated that side reactions may
have occurred, likely the recombination of xylose and its oligomers with soluble lignin forming
lignin-carbohydrate complex (LCC). In subsequent investigations, we positively identified the
presence of LCC in the pretreatment liquid by Nuclear Magnetic Resonance (NMR) and by
Fourier Transform Infrared (FTIR). The kinetic model was therefore modified incorporating the
side reactions. The revised model has shown close and consistent agreement with the
experimental data. Although it is a simplified empirical model, the experimental data yielded
reliable degree of confidence in the Arrhenius plots for all of the rate constants. This model can
thus serve as a useful tool for optimal design and operation of dilute-acid pretreatment reactors in
NREL.
ii
Although the continuous reactor is designed to behave as a plug flow reactor (PFR), the
residence time distribution (RTD) data obtained from tracer tests have shown that the flow
pattern in the reactor deviates significantly from PFR. The kinetic information was put into the
reactor performance model incorporating the RTD information. The results were further
analyzed to assess the effects of dispersion (RTD) on the performance of the NREL-continuous
reactor. The kinetic data, the model procedure, and the output of reactor performance (yield of
xylose and oligomers) as it relates to the degree of dispersion are presented, and the strategy to
improve the reactor performance is discussed.
In the second part of this dissertation, secondary hydrolysis of hemicellulose liquor from
dilute-acid pretreatment of KCS was investigated. Dilute-acid pretreatment often generates
substantial amounts of xylose oligomers. Those oligomers need to be hydrolyzed to monomer for
it to be effectively utilized in the bioconversion process. A post treatment, secondary hydrolysis,
is therefore necessary. Because of the unique features of the NREL-continuous reactor, namely
high solid loading, low acid content, and short residence time, the hydrolysis of hemicellulose
was limited. The pretreatment liquor (often termed as pre-hydrolysate) obtained from this reactor
thus contains relatively high amounts of xylose oligomers, typically in the range of 10-40% of
the total sugar. In order to fully utilize the sugars in the pre-hydrolysate, oligomers need to be
hydrolyzed to monomers. However, the secondary hydrolysis of this liquor was found to be
much more difficult than hydrolysis of xylose oligomers in a clean environment. This
investigation was undertaken to verify the factors inhibiting the acid-catalyzed oligomer
hydrolysis. For this purpose, the secondary hydrolysis was experimentally studied using rapid-
heating small-scale batch reactors. The experiments were done for pre-hydrolysate and for clean
xylose oligomers. The comparison of the results indicated that a significant fraction of oligomers

iii
may be bound to lignin fragments, and some of it may also exist in branched form. Formation of
LCC was also proven to be a significant factor in oligomer hydrolysis and xylose degradation.
The third part of the dissertation deals with the production of lactic acid from the mixture
of pre-hydrolysate and paper mill sludge by simultaneous saccharification and co-fermentation
(SSCF). Paper mill sludge is a solid waste material composed of pulp residues and ash generated
from pulping and paper making process. The carbohydrate portion of the sludge from a Kraft
mill has chemical and physical characteristics similar to those of commercial-grade wood pulp.
Because of its high carbohydrate contents and well-dispersed structure, the sludge can be
biologically converted to value-added products without pretreatment. In bioconversion of solid
feedstock such as paper mill sludge, a certain amount of water must be added to attain fluidity. In
this study, hemicellulose pre-hydrolysate, in place of water, was added to the sludge to increase
the concentration of the final product. Pre-hydrolysate was obtained by hot-water treatment of
pine wood in which the total sugar concentration reached 4 wt. %. The mixture was subjected to
SSCF using enzymes (cellulase and pectinase) and Lactobacillus delbrueckii (ATCC-10863).
Pectinase was added to convert mannose oligomers in the prehydrolysate to monomers. During
the SSCF of the mixture, calcium carbonate existing in the paper sludge acted as a buffer
keeping the pH to near optimum. The overall product yield on the basis of total carbohydrate
content of the initial feed ranged 80-90% of the theoretical maximum. Use of the mixture of pre-
hydrolysate and pulp mill sludge as the fermentation feed also increased the product
concentration to 60 g of lactate/L.

iv

v
Acknowledgments
The author would like to thank my advisor, Dr. Yoon Young Lee. He has continually inspired
me to reach out to new fields, and has shared his excellent knowledge of science with me
through his creativity and guidance. I would also like to thank Dr. Donald Cahela, Dr. Changshin
Sunwoo, Dr. Wei Wang, and Dr. Meng Liang for numerous technical discussions and their help
during the course of this investigation. I would to thank my laboratory colleagues, Dr. Li Kang,
Dr. Urvi Kothari, Venkata Ramesh Pallapolu, Wenjian Guan and Tapas Acharjee for their
cooperation during the course of this investigation.
The author would like to thank my family members: father, Zuliang Shi; mother, Cuihua Wang;
and my wife Jing Li, for their constant support and encouragement which have motivated me
throughout all of my endeavors.
The funding for this study was provided by the National Renewable Energy Laboratory (NREL)
of DOE, Alabama Center for Paper and Bioresource Engineering, Auburn University, Alabama
Department of Agriculture and Industries, and their support is gratefully acknowledged.

vi
Style manual or journal used: Bioresource Technology
Computer software used: Microsoft Office 2010 (Professional), Wolfram Mathematica 8,
MathCad 15, Origin Pro 8.5.1.

vii
TABLE OF CONTENTS
Dissertation Abstract ........................................................................................................................ i
Acknowledgments........................................................................................................................... v
List of Tables .................................................................................................................................. x
List of Figures ............................................................................................................................... xii
List of Abbreviations .................................................................................................................... xv
I. Introduction ............................................................................................................................. 1
II. Literature Review.................................................................................................................... 6
II.1 Background of lignocellulosic biomass ........................................................................... 6
II.1.1 Types of lignocellulosic biomass .............................................................................. 6
II.1.2 Structure and chemical composition of lignocellulosic biomass .............................. 8
II.2 Pretreatment of biomass ................................................................................................. 12
II.2.1 Need for pretreatment and options .......................................................................... 12
II.2.2 Pretreatment at high solid loading .......................................................................... 16
II.3 Modeling investigation on acid pretreatment of hemicellulose ..................................... 17
II.4 Reactors for pretreatment and reactor residence time distribution ................................ 21
II.4.1 Application of continuous reactor in acid pretreatment .......................................... 21
II.4.2 Residence time distribution of continuous reactor.................................................. 22
II.5 Post hydrolysis of pre-hydrolysate ................................................................................. 23
II.5.1 Xylose-oligosaccharides from dilute acid pretreatment ......................................... 23
II.5.2 Need for post-hydrolysis and options ..................................................................... 24
II.6 Lactic acid production from lignocellulosic biomass .................................................... 25
II.6.1 Background of bioconversion of biomass into lactic acid ...................................... 25
II.6.2 Simultaneous saccharification and fermentation in LA bioconversion .................. 27
II.7 Development of integrated wood based bio-refinery ..................................................... 28
II.7.1 Background of paper and pulp making ................................................................... 28
II.7.2 The Integrated Forest Bio-refinery ......................................................................... 33
III. Kinetic Study of Dilute-Acid Catalyzed Hemicellulose Hydrolysis of Corn Stover under
High-Solid Conditions .................................................................................................................. 36

viii
III.1 Abstract ....................................................................................................................... 36
III.2 Introduction ................................................................................................................ 37
III.2.1 Materials and Methods ............................................................................................ 40
III.2.2 Feedstock ................................................................................................................ 40
III.2.3 Neutralization Capacity of Kramer Corn Stover .................................................... 40
III.2.4 Dilute Acid Hydrolysis ........................................................................................... 41
III.2.5 HPLC Analysis ....................................................................................................... 42
III.2.6 Kinetic Model Development ................................................................................... 42
III.3 Results and Discussion ............................................................................................... 44
III.3.1 Neutralization Capacity of Kramer Corn Stover .................................................... 44
III.3.2 Model Fitness .......................................................................................................... 45
III.3.3 Modification of Kinetic Model ............................................................................... 48
III.4 Conclusion .................................................................................................................. 52
IV. Incorporation of residence time distribution in the modeling of NREL screw-driven
continuous pretreatment reactor .................................................................................................... 77
IV.1 Abstract ....................................................................................................................... 77
IV.2 Introduction ................................................................................................................ 78
IV.3 Materials and Methods ............................................................................................... 80
IV.3.1 RTD Tests ............................................................................................................... 80
IV.4 Results and discussion ................................................................................................ 81
IV.4.1 RTD Data Analysis ................................................................................................. 81
IV.4.2 Assess the Performance of NREL Reactor Using RTD Data ................................. 82
IV.5 Conclusion .................................................................................................................. 83
V. Secondary Hydrolysis of Pretreatment Liquor Obtained from Continuous High-Solids
Dilute-Acid Pretreatment of Corn Stover ..................................................................................... 89
V.1 Abstract .......................................................................................................................... 89
V.2 Introduction .................................................................................................................... 90
V.3 Materials and Methods ................................................................................................... 93
V.3.1 Materials ................................................................................................................. 93
V.3.2 Dilute acid hydrolysis Reaction .............................................................................. 93

ix
V.3.3 Enzymatic hydrolysis Reaction ............................................................................... 93
V.3.4 HPLC Analysis ....................................................................................................... 94
V.4 Results and discussion .................................................................................................... 94
V.4.1 Secondary Dilute Acid Hydrolysis Reactions......................................................... 94
V.4.2 Enzymatic Hydrolysis Reactions ............................................................................ 95
V.5 Conclusion ...................................................................................................................... 96
VI. Lactic Acid Production from the Mixture of Hemicellulose Prehydrolysate and Kraft
Paper Mill Sludge ....................................................................................................................... 112
VI.1 Abstract ..................................................................................................................... 112
VI.2 Introduction .............................................................................................................. 113
VI.3 Materials and Methods ............................................................................................. 115
VI.3.1 Materials ............................................................................................................... 115
VI.3.2 Pre-extraction of Southern pine chips ................................................................... 116
VI.3.3 Detoxification of Prehydrolysate .......................................................................... 117
VI.3.4 SSF of Prehydrolysate........................................................................................... 117
VI.3.5 Enzymatic Digestibility Test of Recycled Paper Mill Sludge .............................. 117
VI.3.6 SSF of Recycle Paper Mill Sludge........................................................................ 118
VI.3.7 Analytical Methods ............................................................................................... 119
VI.4 Results and Discussion ............................................................................................. 119
VI.4.1 Partial Extraction of Softwood Hemicellulose ..................................................... 120
VI.4.2 Enzymatic Hydrolysis Test of Recycle Paper Mill Sludge ................................... 120
VI.4.3 SSF of Recycle Paper Mill Sludge........................................................................ 121
VI.4.4 SSF of Prehydrolysate........................................................................................... 122
VI.4.5 SSF of the Mixture of RPMS and Prehydrolysate ................................................ 123
VI.5 Conclusion ................................................................................................................ 127
VII. Future Work ..................................................................................................................... 140
Bibliography ............................................................................................................................... 142

x
List of Tables
Table II-1Estimated availability of selected feedstocks ................................................................. 7
Table II-2 Composition of different biomass feedstocks ................................................................ 8
Table II-3 Ratio of the lignin monomers in plant species ............................................................. 11
Table II-4 Fast-xylan fraction in various biomass species............................................................ 19
Table II-5 Global pulp production by category (Sixta, 2006) ...................................................... 29
Table III-1 Fast-xylan fraction in various biomass species .......................................................... 53
Table III-2 Fitted kinetic constants during the hydrolysis at various pretreatment condition ...... 54
Table III-3 Statistical results for kinetic data ................................................................................ 55
Table III-4 Fitted Arrhenius parameters for each rate constant ki ................................................ 57
Table III-5 Comparison of parameters results of this study with the literature values ................. 58
Table III-6 Arrhenius parameters for each rate constant ki from modified model ....................... 59
Table IV-1 RTD data for the NREL reactor operated with two different RPM ........................... 87
Table IV-2 Xylose production comparison between NREL reactor and PFR .............................. 88
Table V-1 Pretreatment conditions for hydrolysate samples ........................................................ 97
Table V-2 Optimum post hydrolysis condition for pre-hydrolysate samples ............................... 98
Table VI-1 Sugar Content in the Liquid Obtained through Three-stage Pre-extraction ............. 128
Table VI-2 Degradation Compounds Obtained through Three-Stage Pre-extraction ................ 129
Table VI-3 LA production at 5% solid loading and different enzyme loading after 72hr .......... 130

xi
Table VI-4 LA production at 7.5 FPU/g-glucan and different solid loading after 72hr ............. 131
Table VI-5 Experiment design via Taguchi methods ................................................................. 132
Table VI-6 Results of SSF of Mixture ........................................................................................ 133

xii
List of Figures
Figure II-1 Schematic structure of cellulose ................................................................................... 9
Figure II-2 Schematic structure of cellulose ................................................................................. 10
Figure II-3 Three common monolignols ....................................................................................... 11
Figure II-4 Pretreatment effect on lignocellulosic biomass (Mosier et al., 2004) ........................ 12
Figure II-5 Process diagram for dilute acid pretreatment of biomass for bioprocess ................... 14
Figure II-6 Mechanical pulping process (Iggesund Paperboard AB, 2008) ................................. 30
Figure II-7 Recovery cycles of chemicals for a Kraft mill (Prevention, 2001) ............................ 31
Figure III-1 Hydrolysis of xylan in KCS during dilute acid pretreatments (S/L = 1:2). .............. 60
Figure III-2 Experimental and fitted data profiles of KCS hydrolysis (155oC, 1 wt% H2SO4) .... 61
Figure III-3 Experimental and fitted data profiles of KCS hydrolysis (155oC, 1.5 wt% H2SO4) . 61
Figure III-4 Experimental and fitted data profiles of KCS hydrolysis (155oC, 2 wt% H2SO4) .... 62
Figure III-5 Experimental and fitted data profiles of KCS hydrolysis (170oC, 1 wt% H2SO4) .... 62
Figure III-6 Experimental and fitted data profiles of KCS hydrolysis (170oC, 1.5 wt% H2SO4) . 63
Figure III-7 Experimental and fitted data profiles of KCS hydrolysis (170oC, 2 wt% H2SO4) .... 63
Figure III-8 Experimental and fitted data profiles of KCS hydrolysis (185oC, 1 wt% H2SO4) .... 64
Figure III-9 Experimental and fitted data profiles of KCS hydrolysis (185oC, 1.5 wt% H2SO4) . 64
Figure III-10 Experimental and fitted data profiles of KCS hydrolysis (185oC, 2 wt% H2SO4) .. 65
Figure III-11 Activation energy plots for rate constant ki ............................................................ 67
xiii
Figure III-12 Acid exponent plots for rate constant ki ................................................................. 69
Figure III-13 Xylose oligomer hydrolysis profiles at different environments .............................. 70
Figure III-14 Xylose degradation profiles at different environments ........................................... 71
Figure III-15 Schematic structures of lignin and LCC ................................................................. 72
Figure III-16 FTIR spectra of LCC sample .................................................................................. 73
Figure III-17 NMR spectra of LCC sample .................................................................................. 74
Figure III-18 Modified oligomer calculation ................................................................................ 75
Figure III-19 Modified model fitness ........................................................................................... 76
Figure IV-1 RTD test flow chart ................................................................................................... 84
Figure IV-2 Broken Flight Auger Reactor with Baffles ............................................................... 85
Figure IV-3 Continuous Flight Auger Reactor with Anti-Rotation Bars ..................................... 85
Figure IV-4 RTD profiles for broken flight at different auger speed ........................................... 86
Figure IV-5 RTD profiles for continuous flight at different auger speed ..................................... 86
Figure V-1 Sugar content in pre-hydrolysate samples ................................................................ 100
Figure V-2 Secondary hydrolysis profiles for sample A with 0% AAI (1.24 wt% H2SO4) ....... 101
Figure V-3 Secondary hydrolysis profiles for sample A with 50% AAI (1.86 wt% H2SO4) ..... 102
Figure V-4 Secondary hydrolysis profiles for sample A with 100% AAI (2.48 wt% H2SO4) ... 103
Figure V-5 Secondary hydrolysis profiles for sample B with 0% AAI (1.99 wt% H2SO4) ....... 104
Figure V-6 Secondary hydrolysis profiles for sample B with 50% AAI (2.98 wt% H2SO4) ..... 105

xiv
Figure V-7 Secondary hydrolysis profiles for sample B with 100% AAI (3.98 wt% H2SO4) ... 106
Figure V-8 Secondary hydrolysis profiles for sample C with 0% AAI (2.25 wt% H2SO4) ....... 107
Figure V-9 Secondary hydrolysis profiles for sample C with 50% AAI (3.37 wt% H2SO4) ..... 108
Figure V-10 Secondary hydrolysis profiles for sample C with 100% AAI (4.5 wt% H2SO4) ... 109
Figure V-11 Oligomer variation during secondary hydrolysis of prehydrolysate ...................... 110
Figure V-12 Enzymatic hydrolysis yield during post hydrolysis of prehydrolysate .................. 111
Figure VI-1 Proposed Three-Stage Pre-extraction Process ........................................................ 134
Figure VI-2 Enzymatic Hydrolysis of RPMS, α-cellulose, α-cellulose plus CaCO3 .................. 135
Figure VI-3 LA yield profiles for SSF of prehydrolysate........................................................... 136
Figure VI-4 pH profiles during SSF of the Mixture ................................................................... 137
Figure VI-5 LA concentration profiles during SSF of different feedstock ................................. 138
Figure VI-6 LA yields during SSF of different feedstock .......................................................... 139

xv
List of Abbreviations
KCS Kramer Corn Stover
RTD Residence Time Distribution
DP Degree of Polymerization
SSF Simultaneous Saccharification and Fermentation
SSCF Simultaneous Saccharification and Cofermentation
SHF Separate Hydrolysis and Fermentation
NREL National Renewable Energy Laboratory
HMF hydroxymethylfurfural
PFR Plug Flow Reactor
LCC Lignin-Carbohydrate Complex
LA Lactic Acid
LAB Lactic Acid Bacteria
PLA Poly-Lactic Acid
MSW Municipal Solid Wastes
NC Neutralization Capability
DI water De-ionized water
SS316 Grade 316 Stainless Steel
AAI Additional Acid Input
RPMS Recycled Paper Mill Sludge
RPM Rounds Per Minute
1
I. Introduction
Biomass is the most important sustainable feedstock for bio-fuels and bio-chemicals
today. Lignocellulosic biomass is an abundant and renewable feedstock with an estimated annual
worldwide production of 10-50 billion dry tones (Galbe & Zacchi, 2002). Biomass mostly
consists of three major components: cellulose, hemicellulose and lignin. From an economic
standpoint, it is imperative that all three components be utilized in the biomass conversion
process. Hemicellulose is the second largest component in lignocellulosic biomass, representing
about 20-35% of biomass. In recent years, bioconversion of hemicellulose has received a great
deal of attention due to its amorphous structure that easily hydrolyzes in dilute acid and its
practical applications in various agro-industrial processes, such as efficient conversion to fuels
and chemicals, digestibility boost for animal feedstock, delignification of paper pulp and
improvement in the consistency of beer (Viikari et al., 1993; Wong et al., 1988; Zeikus et al.,
1991). The most promising pretreatment option for hemicellulose is dilute acid with high xylose
yield which significantly increases susceptibility to hydrolysis for cellulose (Bungay, 1992;
Wyman et al., 1993; Lloyd & Wyman, 2005). The dilute-acid pretreatment accompanies
hydrolysis of the hemicellulose fraction in the biomass, often termed as prehydrolysis. The
prehydrolysis has advanced to the point where the hemicellulose sugars are obtained with yields
above 80% and concentrations high enough to be directly used as feed for bioconversion
(Springer, 1985; Lee et al., 1978; Nguyen et al., 2000).
The most logical choice for commercial-scale biomass pretreatment reactor is moving-
bed (screw-driven) continuous type (Lee et al., 1999). Optimal production of xylose from
biomass must be analyzed with respect to reactor yield, product concentration, and reactor cost
2
considerations (Maloney et al., 1986). Determination of the most desirable processing conditions
requires the ability to predict reactor performance from knowledge of hydrolysis kinetics. In
particular, the performance of continuous co-current solid-liquid reactors is of interest. NREL
has developed an efficient continuous pretreatment reactor that can be operated with high-solid
charge and short residence time. In the actual design and operation of the reactor, a number of
technical problems have surfaced in the pilot scale testing of the prehydrolysis process. The
technical problems stem from several unique features of the process. Firstly, the process is
relatively fast, which results in short residence times in the reactor. The reaction is also
heterogeneous in that the catalyst is penetrating into the solid reactant. Finally, it is carried out
in a moving-bed reactor under high-solid and low-water conditions.
The reaction conditions in this process were beyond the parameters normally explored in
conventional processes, particularly with respect to the solid/liquid ratio. It is important to
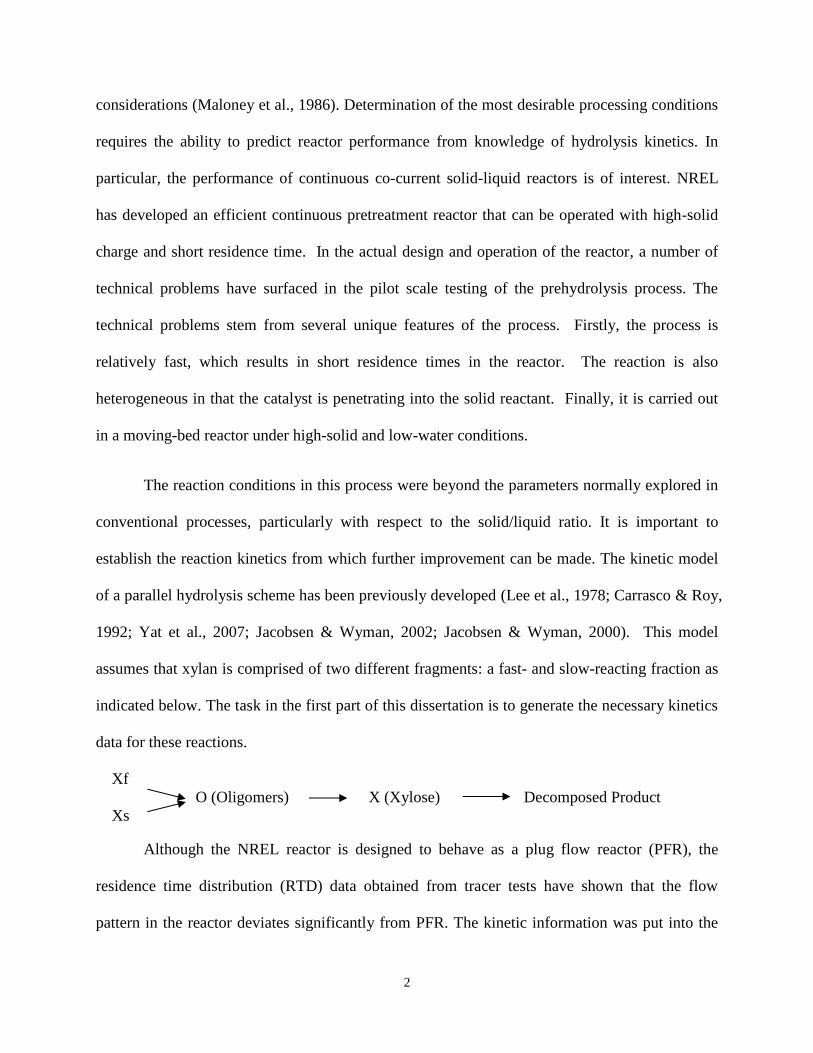
establish the reaction kinetics from which further improvement can be made. The kinetic model
of a parallel hydrolysis scheme has been previously developed (Lee et al., 1978; Carrasco & Roy,
1992; Yat et al., 2007; Jacobsen & Wyman, 2002; Jacobsen & Wyman, 2000). This model
assumes that xylan is comprised of two different fragments: a fast- and slow-reacting fraction as
indicated below. The task in the first part of this dissertation is to generate the necessary kinetics
data for these reactions.
Xf
O (Oligomers) X (Xylose) Decomposed Product
Xs
Although the NREL reactor is designed to behave as a plug flow reactor (PFR), the
residence time distribution (RTD) data obtained from tracer tests have shown that the flow
pattern in the reactor deviates significantly from PFR. The kinetic information was put into the

3
reactor performance model incorporating the RTD information. The results were further
analyzed to assess the effects of dispersion (RTD) on the performance of the NREL-continuous
reactor.
Dilute acid pretreatment often yields substantial amount of soluble hemicellulose in the
oligomeric form (Lloyd & Wyman, 2005; Carvalheiro et al, 2008). The ratio of monomers to
oligomers depends on the severity of the pretreatment. More severe conditions are required to
achieve maximum monomer yield than was needed to achieve maximum total hemicellulose
recovery.
There are not many microbiological cultures that can directly metabolize oligosaccharide
to make bio-fuels or chemicals. A post treatment, secondary hydrolysis, is therefore necessary.
The post hydrolysis options can be reduced to acid (Saska & Ozer, 1995; Allen et al., 1996;
Shevchenko et al., 2000; Duarte et al., 2004; Garrote et al., 2001c; Duarte et al., 2009) or enzyme
(Duarte et al., 2004; Vazquez et al., 2001; Walch et al., 1992) catalyzed hydrolysis. Acid
hydrolysis typically presents both higher yield and productivity when compared to the enzymatic
hydrolysis processes. In contrast to enzymatic hydrolysis, significant monosaccharide
degradation reactions may occur during acid post hydrolysis. Examples of such reactions are the
degradation of pentoses to furfural, hexoses to HMF, and of both these furans to aliphatic acids
such as formic and levulinic acids. Therefore, to obtain a high monosaccharide recovery, a
careful optimization of the operational conditions is required.
In the subsequent parts of this dissertation, secondary hydrolysis of hemicellulose liquor
from dilute-acid pretreatment of KCS was investigated. This investigation was undertaken to
verify the factors inhibiting the acid-catalyzed oligomer hydrolysis. For this purpose, the

4
secondary hydrolysis was experimentally studied using rapid-heating small-scale batch reactors.
The experiments were done for pre-hydrolysate and for clean xylose oligomers. The comparison
of the results indicated that a significant fraction of oligomers may be bound to lignin fragments,
and some of it may also exist in branched form. Formation of LCC was also proven to be factors
significantly affecting the oligomer hydrolysis and xylose degradation.
Lignocellulosic biomass pre-hydrolysate can be converted into bio-fuels or various
chemicals with or without mixing with cellulose solids. Lactic Acid (LA) is an important
industrial commodity with a large and fast growing market due to its wide applications in
cosmetics, pharmaceuticals, textile and food industry (Xu et al., 2006; John et al., 2007; Vickroy,
1985). Its most dominant application is polymerization to biodegradable poly-lactic acid (PLA).
Presently, of all the LA produced worldwide, about 90% comes from fermentation while the rest
is through chemical synthesis (Hofvendahl & Hahn–Hägerdal, 2000). Most of the fermentation
processes utilize starch-derived glucose or sucrose as feedstock (Litchfield, 1996). To reduce the
feedstock cost, considerable studies have been pursued on the fermentation of lignocellulosic
carbohydrates for lactic acid production (Parajo et al., 1997; Grade et al., 2002; Neureiter et al.,
2004).
While a lot of attention and effort have been put into cellulosic LA production, there is
another industry struggling in the United States: Pulp and Paper industry. The United States had
been the world’s leading producer of paper until it was overtaken by China in 2009 (De Sisti,
2012). The decreased demand for paper due to digital information technology and increased
competition with cheap supply of foreign papers led American traditional pulp and paper
manufacturers to look for new opportunities and industries. Paper mill sludge is a solid waste
material composed of pulp residues and ash generated from the pulping and paper making

5
process. Paper sludge has been a disposal liability for many years (Albertson & Pope, 1999).
However, due to its high carbohydrate content and well-dispersed structure, the sludge can be
biologically converted to value-added products without pretreatment (Schmidt et al., 1997; Lark
et al., 1997; Kang et al., 2010). Utilization of paper mill sludge as feedstock to produce LA has
at least two economic advantages. First, the cost of this feed stock is basically zero or even
negative considering the cost of disposal is about $20 per wet ton (Kang et al., 2010). Paper
sludge is produced at a concentrated site and permanent production location, making the
feedstock availability reliable. Second, pretreatment is not necessary to bio-convert paper mill
sludge to products. Pretreatment is one of the most costly steps in bio refinery process, thus
elimination of pretreatment significantly reduces the production cost of LA. In bioconversion of
solid feedstock such as paper mill sludge, a certain amount of water must be added to attain
fluidity. In this study, hemicellulose pre-hydrolysate, in place of water, was added to the sludge
to increase the concentration of the final product.
The main objectives of the final part of this dissertation are to characterize the chemical
and physical properties of paper mill sludge, explore the new scheme of bioconversion process
using two feed streams readily available from pulp and paper industry.
6
II. Literature Review
II.1 Background of lignocellulosic biomass
II.1.1 Types of lignocellulosic biomass
Biomass is the most important renewable energy source today. Lignocellulosic biomass is
an abundant and renewable feedstock with an estimated annual worldwide production of 10-50
billion dry tones (Galbe & Zacchi, 2002). Various types of lignocellulosic feedstocks are being
used for production of bio-fuels and value-added products, such as lactic acid. Agricultural
residues, wood and herbaceous crops, municipal solid wastes and paper mill sludge wastes can
all be used as lignocellulosic feedstocks. They have distinct advantages over the first generation
feedstocks (starch and sugars) since they have a much higher biomass yield per acre and make
use of wastes from various sources (Tilman et al., 2006; Sun & Cheng, 2002; Lavigne & Powers,
2007).
Agricultural Residues
These are the leftovers in the agriculture fields after grains are harvested. Corn stover,
wheat straw, and rice straw are the most common agricultural biomass. Compared to the woody
biomass, these feedstocks are easier to pretreat and biologically convert to biofuels and
chemicals. Table II-1 lists the availability data reported by Perlack et al. (2011). Agricultural
residues clearly dominate available biomass resources for bioprocess. As these data show, corn
stover is the most abundant agricultural residue. Numerous studies have been focused on corn
stover as feedstock to make biofuels and/or value-added products (Sheehan et al., 2003; Öhgren
et al., 2006; Lau & Dale, 2009; Varga et al., 2004; Zhu et al., 2007; Sreenath, et al., 2001).
Energy crops, such as switch grass and hybrid poplars crops are grown for the purpose of

7
producing energy and/or chemicals (Keshwani & Cheng, 2009). These crops grow fast and
require minimum nutrients. They can be cultivated on fallow, non-agricultural lands.
Table II-1Estimated availability of selected feedstocks
Feedstock type Estimated availability
(million dry t/yr)
Corn stover 215
Other agricultural residues 80
Energy crops 95
Wood residues 129
Woody biomass
Woody biomass is physically larger and structurally stronger and denser than non-woody
biomass. Chemically, woody biomass contains higher lignin content compared to other
lignocellulosic biomass. There are two types of wood: softwoods such as pine, and hardwoods
such as poplar. The fiber in softwoods is longer than that in hardwoods. Hardwoods have a lower
level of lignin than softwoods. Also, the degree of polymerization (DP) of softwood lignin is
higher than that of hardwood lignin. Softwoods contain more glucomannans than hardwoods,
while hardwoods contain more xylans. Softwood species generally show higher recalcitrance
toward external chemical and enzymatic treatment compared to the hardwood species (Mabee et
al., 2006; Sannigrahi et al., 2010).
Wastes
There is a wide range of biomass materials that are produced as wastes from other
processes, operations or industries. Many of these have valuable energy contents that can
usefully be exploited. Waste sludge from pulp and paper mills, recycled paper and municipal
solid wastes (MSW) are the main examples of this type of biomass. Due to the high percentage
of cellulose and low lignin content, these materials are very feasible substrates for bioprocess.
8
II.1.2 Structure and chemical composition of lignocellulosic biomass
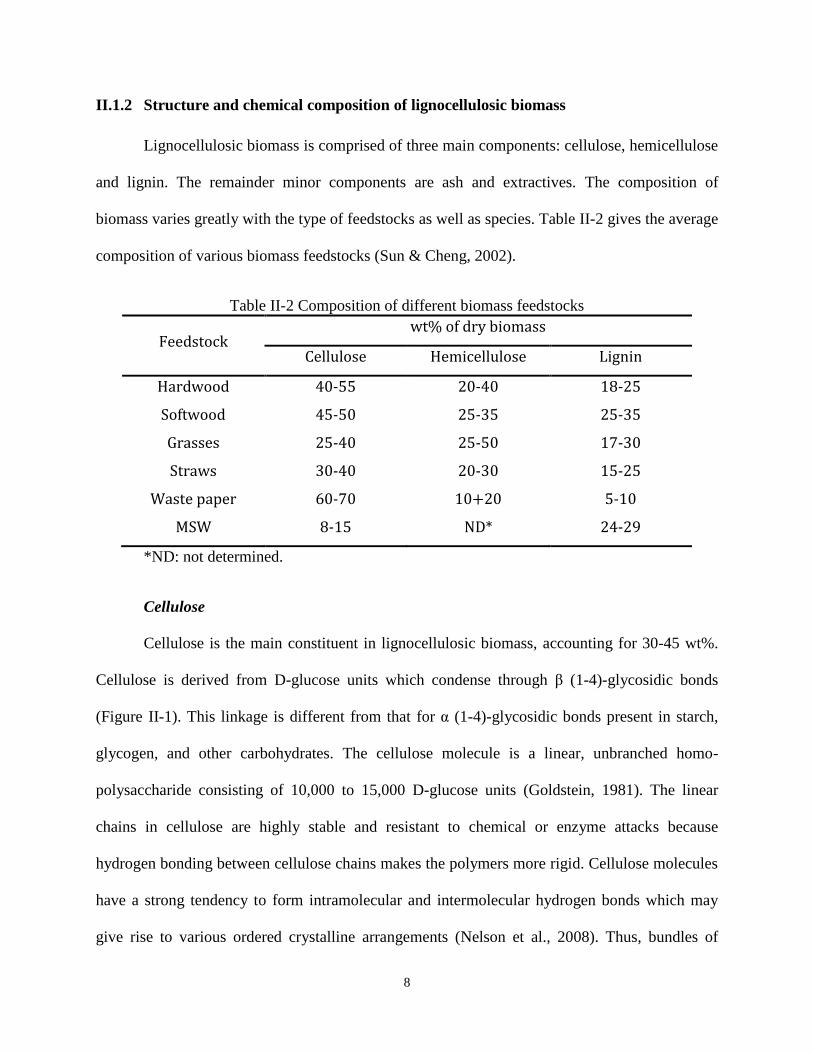
Lignocellulosic biomass is comprised of three main components: cellulose, hemicellulose
and lignin. The remainder minor components are ash and extractives. The composition of
biomass varies greatly with the type of feedstocks as well as species. Table II-2 gives the average
composition of various biomass feedstocks (Sun & Cheng, 2002).
Table II-2 Composition of different biomass feedstocks
Feedstock wt% of dry biomass
Cellulose Hemicellulose Lignin
Hardwood 40-55 20-40 18-25
Softwood 45-50 25-35 25-35
Grasses 25-40 25-50 17-30
Straws 30-40 20-30 15-25
Waste paper 60-70 10+20 5-10
MSW 8-15 ND* 24-29
*ND: not determined.
Cellulose
Cellulose is the main constituent in lignocellulosic biomass, accounting for 30-45 wt%.
Cellulose is derived from D-glucose units which condense through β (1-4)-glycosidic bonds
(Figure II-1). This linkage is different from that for α (1-4)-glycosidic bonds present in starch,
glycogen, and other carbohydrates. The cellulose molecule is a linear, unbranched homo-
polysaccharide consisting of 10,000 to 15,000 D-glucose units (Goldstein, 1981). The linear
chains in cellulose are highly stable and resistant to chemical or enzyme attacks because
hydrogen bonding between cellulose chains makes the polymers more rigid. Cellulose molecules
have a strong tendency to form intramolecular and intermolecular hydrogen bonds which may
give rise to various ordered crystalline arrangements (Nelson et al., 2008). Thus, bundles of

9
cellulose molecules are aggregated together and form micro-fibrils, in which highly ordered
(crystalline) regions alternate with less ordered (amorphous) regions resulting in low
accessibility to enzymes. Micro-fibrils build up fibrils and, finally, cellulose fibers (Sjöström,
1993; Zhang et al. 2007).
Figure II-1 Schematic structure of cellulose
The degree of crystallinity and degree of polymerization (DP) of cellulose are two
important factors in determining its susceptibility to hydrolysis. It has been shown that the
amorphous portion can easily be hydrolyzed while the crystalline portion is more resistant to
hydrolysis (Fan et al., 1980, 1982; Knappert et al., 1981). The DP is more important when
hydrolysis reaction is carried out using enzyme. Certain fragments of enzymes cleave the
cellulose by an end-wise mechanism (Puri, 1984).
Hemicellulose
Hemicellulose is the second most common polysaccharides in nature. It represents 20-35
wt% of lignocellulosic biomass. Unlike cellulose, hemicelluloses are not chemically
homogeneous; they are highly complex, branched polymers made up of pentoses (xylose,
arabinose), hexoses (mannose, glucose, and galactose) and sugar acid. Agricultural residues,
such as corn stover and sugarcane bagasse, contain large amounts of xylan, some arabinan, and
only very small amounts of mannan. Hardwood hemicellulose mostly contains xylans while

10
softwood hemicellulose contains large amounts of glucomannan. Xylan is the most abundant
hemicellulose, while in softwoods mannan tends to be the most abundant hemicellulose.
The structure of xylan is characterized by a long linear backbone chain of 1, 4-linmked β-
D-xylopyranose units (Figure II-2). The frequency and composition of branches are dependent
on the source of xylan (Aspinall, 1980). The side chains consist of O-acetyl, α-L-
arabinofuranosyl, α-1, 2-linked glucuronic or 4-O-methylglucuronic acid. The DP of
hemicellulose is much lower than cellulose (about 200 vs. more than 10,000). Due to its
amorphous structure and low DP, hemicellulose is the most thermal and chemical sensitive
amongst the three main components of biomass. During acid pretreatment, hemicellulose is the
first to be hydrolyzed (Schell, 2003; Bobleter, 1994).
Figure II-2 Schematic structure of cellulose
Lignin
Lignin is the major non-carbohydrate in biomass accounting for 15-25 wt%. Lignin is a
complex phenylpropanoid polymer that plays a critical role in giving structural rigidity to hold
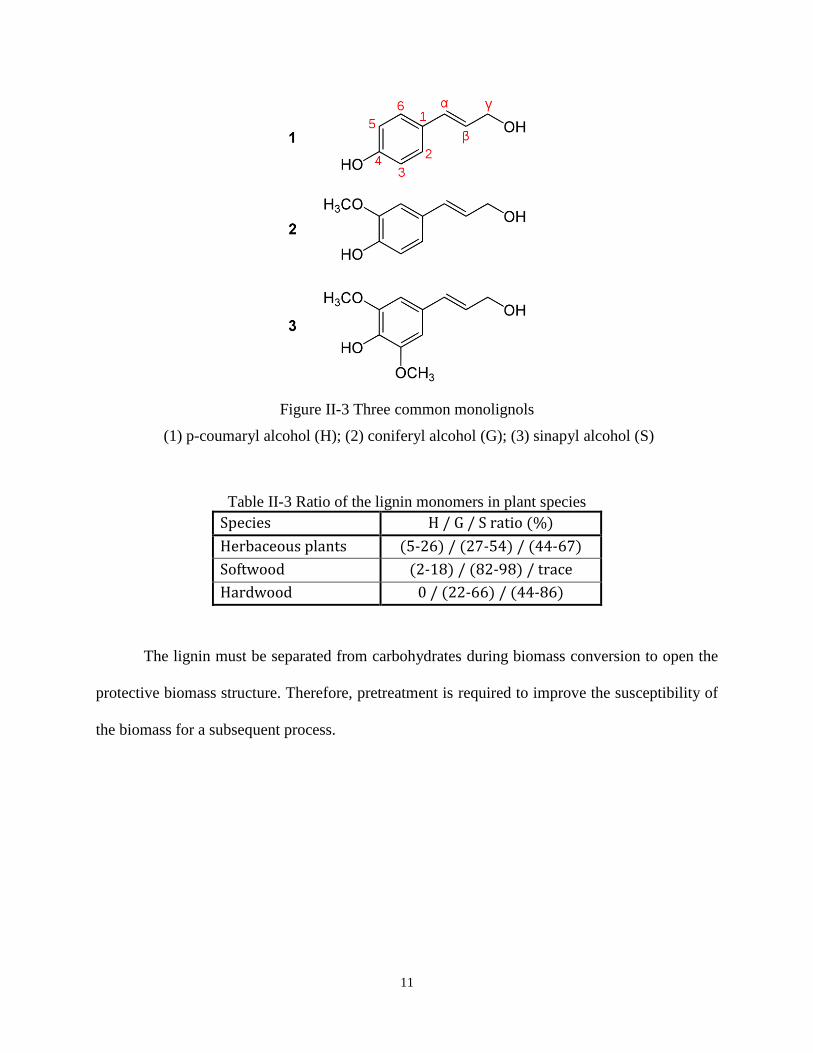
plant fibers together. The main substituents of lignin, coniferyl alcohol, sinapyl alcohol and p-
coumaryl alcohol (Figure II-3) are linked together via β-O-4, α-O-4, β-5, β-1, 5-5, 4-O-5 and β–β
linkages (Buranov & Mazza, 2008; Gierer, 1980). The various ratios of the different monomers
in different plant species is listed in Table II-3.
11
Figure II-3 Three common monolignols
(1) p-coumaryl alcohol (H); (2) coniferyl alcohol (G); (3) sinapyl alcohol (S)
Table II-3 Ratio of the lignin monomers in plant species
Species H / G / S ratio (%)
Herbaceous plants (5-26) / (27-54) / (44-67)
Softwood (2-18) / (82-98) / trace
Hardwood 0 / (22-66) / (44-86)
The lignin must be separated from carbohydrates during biomass conversion to open the
protective biomass structure. Therefore, pretreatment is required to improve the susceptibility of
the biomass for a subsequent process.

12
II.2 Pretreatment of biomass
II.2.1 Need for pretreatment and options
The cellulose in lignocellulosic biomass was covered by a lignin-hemicellulose matrix,
which makes biomass recalcitrant to direct enzymatic hydrolysis. Additionally, a high degree of
crystallinity and polymerization barricade the cellulose from hydrolysis. Therefore, pretreatment
is necessary to improve the digestibility of the biomass for a subsequent enzymatic hydrolysis
step (Figure II-4) (Mosier et al., 2005). The overall purpose of pretreatment is to break down the
shield formed by lignin and hemicellulose, disrupt the crystalline structure and reduce the degree
of polymerization of cellulose.
Figure II-4 Pretreatment effect on lignocellulosic biomass (Mosier et al., 2004)
A number of pretreatment technologies based on numerous physical, chemical and
biological methods have been developed. Physical pretreatment technologies do not involve the
use of chemicals. Chemical pretreatment technologies include: acid pretreatment, alkaline
pretreatment and organosolv pretreatment. Biological pretreatment technologies employ lignin
degrading microorganisms to improve substrate accessibility to enzymes (Taniguchi et al., 2005).

13
In order to achieve higher efficiency, some processes are a combination of two or more
pretreatment methods (McMillan, 1994).
Physical pretreatment
Mechanical pretreatment is one type of physical pretreatments. It includes process like
fine milling and grinding. Mechanical pretreatment reduces the particle size, thus increasing the
surface area of biomass. It is also believed that mechanical pretreatment is able to decrystallize
cellulose. Another physical pretreatment option is through non-mechanical methods that include
irradiation, pyrolysis, steaming, and microwave treatment. The power required for physical
pretreatment is usually very high. As a result of its high cost, physical pretreatment is not
considered an attractive option in biomass processing.
Chemical pretreatment
Acid pretreatment: Acid pretreatment has a long history of use with most feedstocks
because of its high efficiency (Grethlein et al., 1984; Schell et al., 1992; Nguyen et al., 1998;
Schell et al., 2003). Various acids such as sulfuric acid, hydrochloric acid, phosphoric acid, and
nitric acid can be used in this process (Allen et al., 2001; Kalman et al., 2002; Saha et al., 2005a;
Saha et al., 2005b; Kim & Mazza, 2008). The concentrated acid process has relatively high sugar
yield with very little sugar degradation. However, it is extremely difficult to recover most of the
acid, thus making this process economically unfeasible.
Dilute acid processes (0.5-1.5 wt%, 121-180oC) have been most favored for industrial
application, since these processes achieve reasonable high sugar yields from hemicellulose.
Lignin is not removed and the cellulose crystallinity is not affected at these pretreatment
conditions (Sun & Cheng, 202; Hsu, et al., 2010; Guo et al., 2008; Zhu et al., 2009). Besides the
14
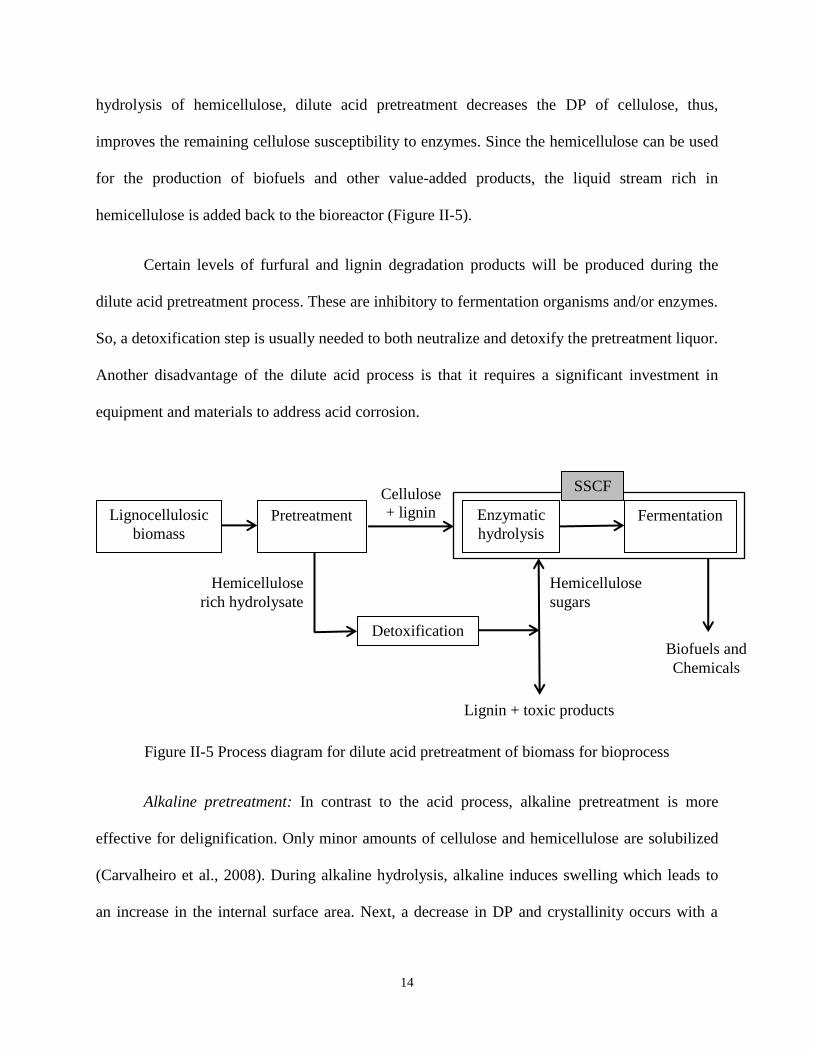
hydrolysis of hemicellulose, dilute acid pretreatment decreases the DP of cellulose, thus,
improves the remaining cellulose susceptibility to enzymes. Since the hemicellulose can be used
for the production of biofuels and other value-added products, the liquid stream rich in
hemicellulose is added back to the bioreactor (Figure II-5).
Certain levels of furfural and lignin degradation products will be produced during the
dilute acid pretreatment process. These are inhibitory to fermentation organisms and/or enzymes.
So, a detoxification step is usually needed to both neutralize and detoxify the pretreatment liquor.
Another disadvantage of the dilute acid process is that it requires a significant investment in
equipment and materials to address acid corrosion.
Figure II-5 Process diagram for dilute acid pretreatment of biomass for bioprocess
Alkaline pretreatment: In contrast to the acid process, alkaline pretreatment is more
effective for delignification. Only minor amounts of cellulose and hemicellulose are solubilized
(Carvalheiro et al., 2008). During alkaline hydrolysis, alkaline induces swelling which leads to
an increase in the internal surface area. Next, a decrease in DP and crystallinity occurs with a
Lignocellulosic
biomass
Pretreatment Fermentation Enzymatic
hydrolysis
Detoxification
Hemicellulose
rich hydrolysate
Cellulose
+ lignin
Hemicellulose
sugars
Lignin + toxic products
Biofuels and
Chemicals
SSCF

15
consequent cleavage of lignin-hemicellulose bonds. Then, degradation of lignin takes place.
Reagents used in alkaline pretreatment can be categorized into two groups: i) sodium hydroxide,
potassium hydroxide, or calcium hydroxide; and ii) ammonia. Sodium hydroxide and lime are
stronger reagents as compared to ammonia. For lignocellulosic feedstocks with higher lignin
content, NaOH is a better delignifying reagent since those feedstocks are more recalcitrant.
Ammonia, on the other hand, shows higher efficiencies in the pretreatment of agricultural
residues that have low lignin content. Recovery of the reagents is an important part of alkaline
pretreatment. The recovery of sodium hydroxide has been well documented in the pulp industry
and the high volatility of ammonia makes it easy to recover and reuse. However, the main
disadvantage of these alkaline reagents is that they are expensive.
Organosolv pretreatment: As the name indicates, organosolv pretreatment uses organic
solvents (ethanol, acetone, carboxylic acid, etc.) as reagents. This process is usually run at a high
temperature (e.g., 200oC) and high pressure (Zhao et al., 2009; Hallac et al., 2010). Lignin and
hemicellulose can be solubilized while cellulose is protected from solubilization. The advantage
of organosolv pretreatment is that the organic solvents are recoverable through distillation and
are recycled for pretreatment. However, organosolv pretreatment must be performed under
extremely tight and efficient control due to the volatility of organic solvent. Therefore,
organosolv pretreatment is not a feasible choice at present.
Biological pretreatment
Biological pretreatment uses lignin degrading microorganisms, such as white, brown and
soft rot fungi and bacteria to modify the chemical composition and/or structure of the cellulosic
biomass (Kirk and Farrell, 1987). The advantage of biological pretreatment is that the enzymes
and microbes are very specific, rarely producing inhibitors or toxins and effectively degrading

16
lignin. Also, this process requires low energy input and mild environmental conditions. But
reaction times tend to be long; anywhere between 5 days and a month. This slow rate, as
compared to chemical treatments, has prevented the usage of biological pretreatment in
commercial scale plants.
II.2.2 Pretreatment at high solid loading
Any thermo-chemical pretreatment process requires significant amount of water. The
reasons are as follows: (1) Biomass is highly water-absorbing and the chemicals used in the
pretreatment (e.g. sulfuric acid) are unable to penetrate into the substrate if the substrate is not
fully wetted. (2) Excess water is needed to maintain easily-deliverable slurry in continuous
pretreatment reactors. For batch reactors, water is required to enable the substrate to be evenly
distributed by agitating or shaking. (3) In order to achieve a good heat transfer, the void space
between biomass particles needs to be filled with liquid.
A high solid loading is important for process economics because this reduces the reactor
size, lowers the cost in heating, and lowers water usage (Hsu et al., 1996). In a previous study, a
solid loading of 40% was applied for pretreatment of aspen wood and wheat straw in a small (1/2”
o.d. × 4” long) pipe reactor with indirect heating (Grohmann et al., 1986a). Another study
involved the loading of 30% solids for pretreatment of corn stover that was applied in a
cylindrical reactor with direct steam injection aided by indirect heating (Schell et al., 1992). In a
third study, a 100-L pilot-scale horizontal shaft mixer/reactor was used for dilute-acid
pretreatment of lignocellulosic biomass at a solids loading of 10-15%, with heating either by
steam injection into the reactor jacket or directly into the reactor (Hsu et al., 1996). Shortly
afterwards, a solids concentration of 40-50% using a 130-L reactor was reported by the same

17
group (Kadam and Hsu, 1997). In NREL, the solid loading used in their screw-driven continuous
reactor is 30%.
The solid liquid (S/L) ratio is also a minor process variable that affects kinetics. Saeman
(1945) reported that S/L ratio over the range of 5 to 20 had a small but definite effect on the rate
of cellulose hydrolysis.
II.3 Modeling investigation on acid pretreatment of hemicellulose
Because of the heterogeneity in component and structure, hemicellulose exists in an
amorphous state which makes it easier to hydrolyze than cellulose. During the initial phase of
acid pretreatment, random attacks by acid on the hemicellulose chains produce oligomers with
varying DP. The oligomers continue to break down to monomers. When xylose is subjected to
acid for an extended period of time, it will degrade to furfural, reducing the sugar yield and
inhibiting the subsequent fermentation process. The overall hydrolysis reaction can be termed as
a continual depolymerization process in which the average molecular weight is gradually
decreased. The intermediate product, oligomer, is defined as a water-soluble polymer (1< DP
<10) (Lee & McCaskey, 1983).
Previous studies in hemicellulose hydrolysis led to various kinetic models. The simplest
model describing hemicellulose hydrolysis is based on a two-step first-order reaction
(Ranganathan et al., 1985; Bhandari et al., 1984; Converse et al., 1989). According to this model,
hemicellulose is hydrolyzed to xylose, which breaks down to degradation products in the second
step:
𝑋𝑦𝑙𝑎𝑛 𝑘1→ 𝑋𝑦𝑙𝑜𝑠𝑒
𝑘2→ 𝐹𝑢𝑟𝑓𝑢𝑟𝑎𝑙 (II-1)

18
In 1956, Kobayashi & Sakai (1956) proposed a model in which hemicellulose was
categorized into two fragments: fast-reacting xylan and slow-reacting xylan. This modification
was based on the fact that the hydrolysis rate decreased dramatically after conversion reached
approximately 70%. Since then, most kinetic studies of hemicellulose (Nee & Wen, 1976;
Conner, 1984; Grohmann et al., 1986a; Maloney et al., 1985; Maloney et al., 1986; Kim and Lee,
1987; Esteghlalian et al., 1997) have been based on this reaction pattern:
𝐹𝑎𝑠𝑡⎼𝑋𝑦𝑙𝑎𝑛 𝑘1𝑓→
𝑆𝑙𝑜𝑤⎼𝑋𝑦𝑙𝑎𝑛 𝑘1𝑠→ 𝑋𝑦𝑙𝑜𝑠𝑒
𝑘2→ 𝐹𝑢𝑟𝑓𝑢𝑟𝑎𝑙 (II-2)
The biphasic behavior of hemicellulose can be explained in many ways. First, a portion
of xylan is located in the cell wall and is easily accessible to the reagent, while the remaining
xylan is located at a greater depth and is firmly retained within cellulose chains. Second, the slow
reaction is due to a part of xylan that is embedded within or attached to the lignin by lignin-
carbohydrate bonds (Conner, 1984). Third, the difference in the hydrolysis rate is attributed to
the variation in the polymeric structure of xylan as the acetyle and uronic acid ratios to xylose
change (Nikitin, 1966). The proportion of slow-reacting hemicellulose is estimated to be 0.20 -
0.32 (Grohmann et al., 1986a; Maloney et al., 1985; Kim and Lee, 1987, Eken-Saraçoğlu et al.,
1998). The percentage of fast-xylan in various biomass species from literature is shown in Table
II-4.

19
Table II-4 Fast-xylan fraction in various biomass species
References Feedstock Fast-xylan fraction (%)
Simmonds et al. (1955) Sweetgum 70.0
Kobayashi & Sakai (1956) Buna 70.0
Springer et al. (1963) Aspen 60.0
Springer & Zoch (1968) Aspen, Birch, Elm, Maple 60.0
Veeraraghavan et al. (1982) Southern red oak 72.0
Conner (1984) Southern red oak Paper birch Red maple Quaking aspen American elm
73.9 71.6 80.3 76.0 84.3
Maloney et al. (1985) Paper birch 68.4
Grohmann et al. (1986) Aspen Wheat straw
76.0 67.0
Kim & Lee (1987) Southern red oak 69.7
Esteghlalian et al. (1997) Corn stover Switchgrass Popler
64.4 76.8 83.8
A third variation of the basic model is the inclusion of an oligomer intermediate. The
measurement of significant amount of oligomers in several studies (Abatzoglov et al., 1986;
Chen et al., 1996; Conner & Lorenz, 1986; Jensen et al., 2008) supports the inclusion of the
oligomer intermediate in the kinetic model:
𝐻𝑒𝑚𝑖𝑐𝑒𝑙𝑙𝑢𝑙𝑜𝑠𝑒𝑘1→ 𝐹𝑎𝑠𝑡⎼𝑋𝑦𝑙𝑎𝑛
𝑘𝑓→
𝑆𝑙𝑜𝑤⎼𝑋𝑦𝑙𝑎𝑛 𝑘𝑠→𝑂𝑙𝑖𝑔𝑜𝑚𝑒𝑟
𝑘2→ 𝑋𝑦𝑙𝑜𝑠𝑒
𝑘3→ 𝐹𝑢𝑟𝑓𝑢𝑟𝑎𝑙 (II-3)
Model II-2 applies to situations where the oligomer to monomer reaction rate is much
faster than the formation of oligomers that the latter can be omitted. Model II-3 is best used for
reactions under relative mild conditions where buildup of oligomers cannot be neglected, such as
in flow through systems (Chen et al., 1996; Jacobsen et al., 2000).
20
In either case, the reactions are assumed to be pseudo-homogeneous following a first-
order dependence on reactant concentrations. The major parameters that affect the kinetic of
hemicellulose hydrolysis are temperature and acid concentration. The catalytic activity of acid
depends on the type of acid, the L/S ratio and the neutralization capability of the substrate. Each
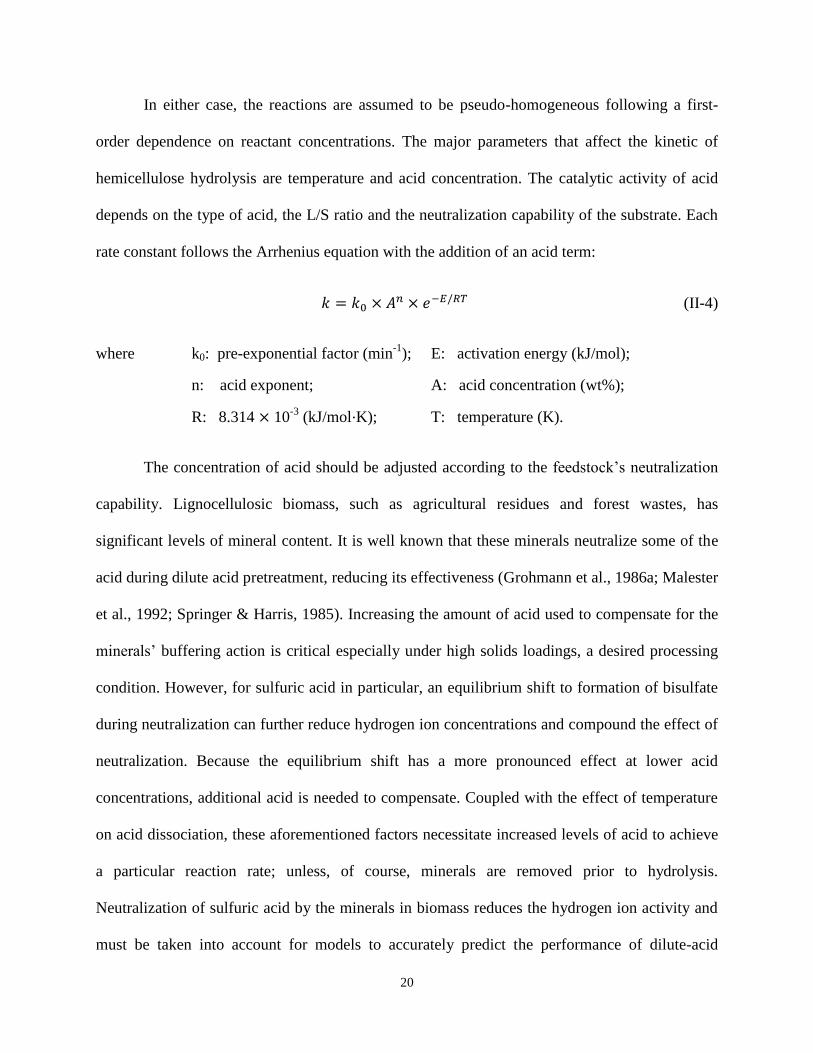
rate constant follows the Arrhenius equation with the addition of an acid term:
𝑘 = 𝑘0 × 𝐴𝑛 × 𝑒−𝐸/𝑅𝑇 (II-4)
where k0: pre-exponential factor (min-1
); E: activation energy (kJ/mol);
n: acid exponent; A: acid concentration (wt%);
R: 8.314 × 10⁻³
(kJ/mol⋅K); T: temperature (K).
The concentration of acid should be adjusted according to the feedstock’s neutralization
capability. Lignocellulosic biomass, such as agricultural residues and forest wastes, has
significant levels of mineral content. It is well known that these minerals neutralize some of the
acid during dilute acid pretreatment, reducing its effectiveness (Grohmann et al., 1986a; Malester
et al., 1992; Springer & Harris, 1985). Increasing the amount of acid used to compensate for the
minerals’ buffering action is critical especially under high solids loadings, a desired processing
condition. However, for sulfuric acid in particular, an equilibrium shift to formation of bisulfate
during neutralization can further reduce hydrogen ion concentrations and compound the effect of
neutralization. Because the equilibrium shift has a more pronounced effect at lower acid
concentrations, additional acid is needed to compensate. Coupled with the effect of temperature
on acid dissociation, these aforementioned factors necessitate increased levels of acid to achieve
a particular reaction rate; unless, of course, minerals are removed prior to hydrolysis.
Neutralization of sulfuric acid by the minerals in biomass reduces the hydrogen ion activity and
must be taken into account for models to accurately predict the performance of dilute-acid
21
hemicellulose hydrolysis. Furthermore, in the case of sulfuric acid, the neutralization products
lead to a bisulfate ion shift, further reducing active hydrogen ion. Neutralization and formation of
bisulfate can have a particularly significant impact on low acid concentrations or high solids
loadings.
II.4 Reactors for pretreatment and reactor residence time distribution
II.4.1 Application of continuous reactor in acid pretreatment
The most logical choice for commercial-scale biomass pretreatment reactor is a moving-
bed (screw-driven) continuous type. This type of reactor has a flow-through design, with the
solid and liquid traveling through the reactor at the same velocity. The pretreatment reactions
proceed as the reagents travel through the reactor. The flow pattern of screw-driven continuous
reactors is similar to that of plug flow reactors (PFR). A continuous screw-driven reactor process
is capable of providing a unique and continuously stirred thermo-chemical reactor environment
in combination with thermo-mechanical energy and dilute acid. This type of reactor can provide
high shear, rapid heat transfer, effective pulverization, and adaptability to many different
processes.
Thompson and Grethlein (1979) reported a cellulose kinetic study on various biomasses
using a PFR system. This system had a tubular reactor, and biomass slurry was pumped through
by an external positive displacement pump. An electrical preheater was used for temperature
control. The reaction was initiated by the injection of acid at the entrance of the reactor. The
residence time was less than 1 minute. The pretreatment conditions covered in this study were
0.5-2.0 wt% sulfuric acid at 200-240oC. They achieved 50% glucose yield, which is a significant
improvement from the typical results of a batch reactor. Another example of the application of
22
PFR is from New York University (Rugg, & Stanton, 1982). A twin-screw extruder was used in
this study. The reaction conditions were similar to those in the Thompson and Grethlein study. A
number of process studies were done using this type of reactor (Green et al., 1988; Rugg &
Brenner, 1982; Rugg et al., 1981). Glucose yields of 50–60% were obtained under similar
conditions (232oC, 10-20 s). In order to retain high sugar concentration in the products, it was
necessary to use a dense, low water feed into the reactor. Rugg et al. (1981) contend that their
twin-screw extruder reactor can accommodate solid feeds with a wide range of solid/liquid ratio
(10% for waste paper pulp, 95% for sawdust). The continuous screw-driven reactor in NREL
was used for dilute acid pretreatment of corn stover in this study. Conditions were relatively mild
with sulfuric acid loading near 1.0% and temperature at 160oC.
II.4.2 Residence time distribution of continuous reactor
The flow pattern of the continuous screw-driven reactor, although similar to that of a PFR,
has not been investigated. It is noted, however, that deviation of the flow pattern from a PFR
negatively affects the reactor performance. The RTD is commonly used to assess the effects of
non-ideal flow in a pretreatment reactor (Janssen et al., 1979; Bounie, 1988; Oberlehner et al.,
1994; Puaux et al., 2000). RTD can be used to characterize the mixing and flow within reactors
and to compare the behavior of real reactors to ideal models. This is useful, not only for
troubleshooting existing reactors, but also for estimating the yield of a given reaction and
designing for future reactors. The characteristics of the RTD are defined using several functions
and moments. The distribution of residence time is represented by an exit age distribution
function E(t), which is defined as 𝐸(𝑡) =𝐶(𝑡)
∫ 𝐶(𝑡)𝑑𝑡∞0
. The average residence time 𝑡̅ is called first
moment, which is defined as 𝑡̅ = ∫ 𝑡 ∙ 𝐸(𝑡)𝑑𝑡∞
0. The variance of the distribution 𝜎2
is called the

23
second moment about the mean, which is defined as 𝜎2 = ∫ (𝑡 − 𝑡̅)2 ∙ 𝐸(𝑡)𝑑𝑡∞
0. It indicates the
degree of dispersion around the mean.
Residence time distributions are measured by introducing a non-reactive tracer into the
system at the inlet. The concentration of the tracer is changed according to a known function and
the response is found by measuring the concentration of the tracer at the outlet. Experimental
methods to determine RTD include the use of a radioactive tracer (Wolf et al., 1976), a dye
(Chen et al., 1995; Weiss & Stamato, 1989), an optical (UV) tracer (Oberlehner et al., 1994) or a
magnetic tracer (Werner, 1979).
II.5 Post hydrolysis of pre-hydrolysate
II.5.1 Xylose-oligosaccharides from dilute acid pretreatment
During dilute acid pretreatment, the major reactions are:
1) Oligomers with varying degrees of polymerization are produced by random attacks of
acid on the hemicellulose chains,
2) Sugars are further degraded to form monosaccharides and sugar decomposition
products such as furfural and HMF,
3) Acetic acid is produced by the cleavage of acetyl groups in biomass, which makes the
pH decrease during the prehydrolysis.
So the pretreatment liquor contains both mono- and oligo-sugars along with lignin, acetic
acid, and some degradation products. The ratio of monomers to oligomers in the prehydrolysate
depends on the severity of the pretreatment. The monomeric sugar yield is mostly affected by
acid concentration, while for formation of sugar degradation products, such as furfural is

24
impacted most by temperature (Roberto et al., 2003; Neureiter et al., 2002). Milder conditions
cause less sugar degradation resulting in enhanced hemicellulose recovery. Actually, the partial
hydrolysis of hemicellulose can enable a reduction both on energy requirements and on the
formation of many relevant sugar degradation compounds, particularly, HMF and furfural.
Oligosaccharides, and particularly xylose-oligosaccharides produced from herbaceous
and hardwood feedstock, may have a high added value as marketable products for application in
the food, pharmaceutical, and cosmetic industries as specialty chemicals (Nabarlatz et al., 2007;
Moure et al., 2006). As these applications are rather restricted in volume, hydrolysis of
hemicellulosic oligosaccharides into monomers is almost a compulsory requirement for it to be
effectively utilized in the bioconversion process.
II.5.2 Need for post-hydrolysis and options
A post treatment, secondary hydrolysis, is therefore necessary. The post hydrolysis
process has been applied to pretreatment hydrolysate obtained from all types of materials:
softwood (Shevchenko et al., 2000; Bossaid et al., 2001); hardwood (Garrote et al., 2001a); and
herbaceous (Saska & Ozer, 1995; Allen et al., 1996; Duarte et al., 2004; Garrote et al., 2001b;
Duarte et al., 2009) catalyzed by H2SO4 (conc. from 0.5% to 6.5% w/w) at 100-135oC and
reaction time up to 10h (Saska & Ozer, 1995; Shevchenko et al., 2000; Duarte et al., 2004;
Garrote et al., 2001a; Garrote et al., 2001b). The post hydrolysis options can be reduced to acid
(Saska & Ozer, 1995; Allen et al., 1996; Shevchenko et al., 2000; Duarte et al., 2004; Garrote et
al., 2001c; Duarte et al., 2009) or enzymatic (Duarte et al., 2004; Vazquez et al., 2001; Walch et
al., 1992) catalyzed hydrolysis.
25
Acid hydrolysis typically presents both higher yield and productivity when compared to
the enzymatic hydrolysis processes. Furthermore, as much of the hemicellulose complex
structure is still present in the oligosaccharides (Carvalheiro et al., 2004; Kabel et al., 2002),
several enzymatic activities are usually required for the complete hydrolysis (e.g., for hardwood
type materials: endoxylanase, exoxylanase, β-xylosidase and accessory activities like acetyl
xylanesterase, α-glucuronidase, α-arabinofuranosidase, and feruloyl esterase). As a result, the
process is potentially inefficient and uneconomical. Under fully optimized conditions, sugar
recovery is around 100% (Saska & Ozer, 1995; Shevchenko et al., 2000; Duarte et al., 2004;
Garrote et al., 2001a; Garrote et al., 2001b; Duarte et al., 2009), as compared to standard dilute
acid hydrolysis (121ºC, 4% H2SO4 and 60 min). This can be considered a major advantage of the
acid post hydrolysis process. Other advantages associated to this process are its high-speed and
low catalyst cost.
If the conditions are not carefully chosen, however, significant monosaccharide
degradation reactions may occur during acid post hydrolysis. Therefore, to obtain a high
monosaccharide recovery, an optimization of the operational conditions is required.
II.6 Lactic acid production from lignocellulosic biomass
II.6.1 Background of bioconversion of biomass into lactic acid
Lactic Acid (LA) is an important industrial commodity with large and fast growing
market due to its wide applications in cosmetics, pharmaceuticals, textile and food industry (Xu
et al., 2006; John et al., 2007; Vickroy, 1985). Its most dominant application is polymerization to
biodegradable poly-lactic acid (PLA). PLA is an environmental friendly material to manufacture
plastic (Kharas et al., 1994), and because being able to degrade to harmless lactic acid, it is also
26
used in drug delivery (John et al., 2007; Schmidt & Padukone, 1997) system or can be used as
medical implants (Auras et al., 2011). As a result, the annual worldwide production of LA in
2001 was about 86,000 tons (Bouchoux et al., 2006), 260,000 tons in 2008 and expected to reach
1,000,000 tons in 2020 (Jem et al., 2010). Presently, of all the LA produced worldwide, about 90%
was made from fermentation, and the rest was from chemical synthesis (Hofvendahl & Hahn–
Hägerdal, 2000).
Chemical synthesis routes produce only racemic lactic acid. The commercial process is
mainly based on the hydrolysis of lactonitrile by strong acids. Other possible chemical synthesis
routes for lactic acid include oxidation of propylene glycol, base-catalyzed degradation of sugars,
reaction of acetaldehyde, carbon monoxide, and water at elevated temperatures and pressures,
hydrolysis of chloropropionic acid, and nitric acid oxidation of propylene, etc. None of these
routes are technically and economically feasible processes (Holten, 1971; Datta et al., 1995).
Most fermentation processes require starch-derived glucose or sucrose as feedstock (Litchfield,
1996). However, a wide variety of carbohydrate sources can be used (molasses, corn syrup, whey,
cane or beet sugar). Lactic acid bacteria (LAB) have complex nutrient requirements due to their
limited ability to synthesize B-vitamins and amino acids (Chopin, 1993). Corn steep liquor, yeast
extract, and soy hydrolysate are normally used to provide nutrients to LAB in the fermentation
process. Excess calcium carbonate is added to the fermenters to neutralize the acid produced.
The advantages of production of lactic acid through fermentation include low temperature, low
energy consumption, and high product specificity as it produces a desired stereoisomer, optically
pure L-(+)- or D-(−)-lactic acid (Pandey et al. 2001).
It is very expensive when pure sugars like glucose and sucrose are used as feedstock for
production of lactic acid. To reduce the feedstock cost, a considerable number of studies have

27
been pursued to look at the fermentation of lignocellulosic carbohydrates for lactic acid
production (Parajo et al., 1997; Garde et al., 2002; Neureiter et al., 2004; McCaskey et al., 1994;
Patel et al., 2004). Bustos et al. (2004) achieved 99.6% of the theoretical lactic acid level in
bioconversion of vine-trimming wastes by lactobacillus pentosus. Zhu et al. (2007) used corn
stover and L. pensosus in their study; they got 90% of theoretical maximum yield in batch
fermentation and 65% yield in fed-batch, but with a much higher lactic acid product
concentration. Iyer et al. (2000) reported an excess of 80% yield of xylose using soft wood
hydrolysate and L. rhamnous. Garde et al. (2002) reported 95% of theoretical maximum yield
from wheat straw hemicellulose hydrolysate by the mixed strains of L. pentosus and L.brevis.
Marques et al. (2008) achieved a yield of 97% from recycled paper sludge by L. rhamnousus.
II.6.2 Simultaneous saccharification and fermentation in LA bioconversion
Simultaneous saccharification and fermentation (SSF) is widely used for converting
cellulosic material into biofuels or chemicals. Unlike separate hydrolysis and fermentation (SHF),
in SSF enzymes are added to the reactor along with the microorganisms. Thus sugar hydrolysis
and fermentation is carried out simultaneously. This method was first introduced by Takagi et al.
(1977). The main advantage of SSF is that it eliminates the product inhibition of enzymes by
sugars and thereby allows for reduced the enzyme loading. The enzyme loading (the amount of
enzyme added per unit weight of substrate) is a key variable in the saccharification step since
enzymes are the most expensive component in the SSF process. Many investigators measured the
effects of enzyme loading on the rates and yields of saccharification and SSF (Wald et al., 1984;
Wyman et al., 1986; Spindler et al., 1990; Stockton et al., 1991; Tatsumoto et al., 1988). The
results show that the saturated value of enzyme loading is approximately 15-50 FPU / g cellulose.
However, when the hydrolysis was carried out alone, much larger levels of enzymes were needed
28
to obtain reasonable hydrolysis yield (Wald et al., 1984; Wiley, 1985). Marques et al. (2008)
found that in the production of LA from recycled paper sludge, the overall yield from SSF was
0.97 g/g compared to 0.81 g/g from SHF. They concluded this might be caused by the reduction
of end-product inhibition of hydrolysis as the sugars were quickly consumed by the bacteria
when they were released by enzymes. The main disadvantage of SSF is the compromising
conditions for hydrolysis and fermentation. For example, the optimum temperature for most
LAB (30-40oC) is lower than the optimum temperature for cellulase enzymes (50
oC). Therefore,
SSF can only be carried out at a much lower temperature than the optimum temperature of
cellulase. Thus the fermentation step is usually prolonged in SSF compared to fermentation after
separate hydrolysis.
II.7 Development of integrated wood based bio-refinery
II.7.1 Background of paper and pulp making
The pulp and paper industry is comprised of companies that mainly use wood (near 90%)
as raw material and produce pulp, paper, board and other cellulose-based products. Some other
lignocellulosic non-woody plants can also be used, such as cotton, wheat straw, sugar cane waste,
corn stover, bamboo, and linen rags. Pulp can be manufactured using mechanical, chemical
(Kraft and sulfite processes), or hybrid methods (Table II-4). The aim of pulping is to break
down the bulk structure of the fiber source (chips, stems, or other plant parts) into the constituent
fibers. Chemical pulping achieves this by degrading the lignin and hemicellulose into small,
water-soluble molecules which can be washed away from the cellulose fibers without
depolymerizing the cellulose fibers. The various mechanical pulping methods physically tear the
cellulose fibers one from another.
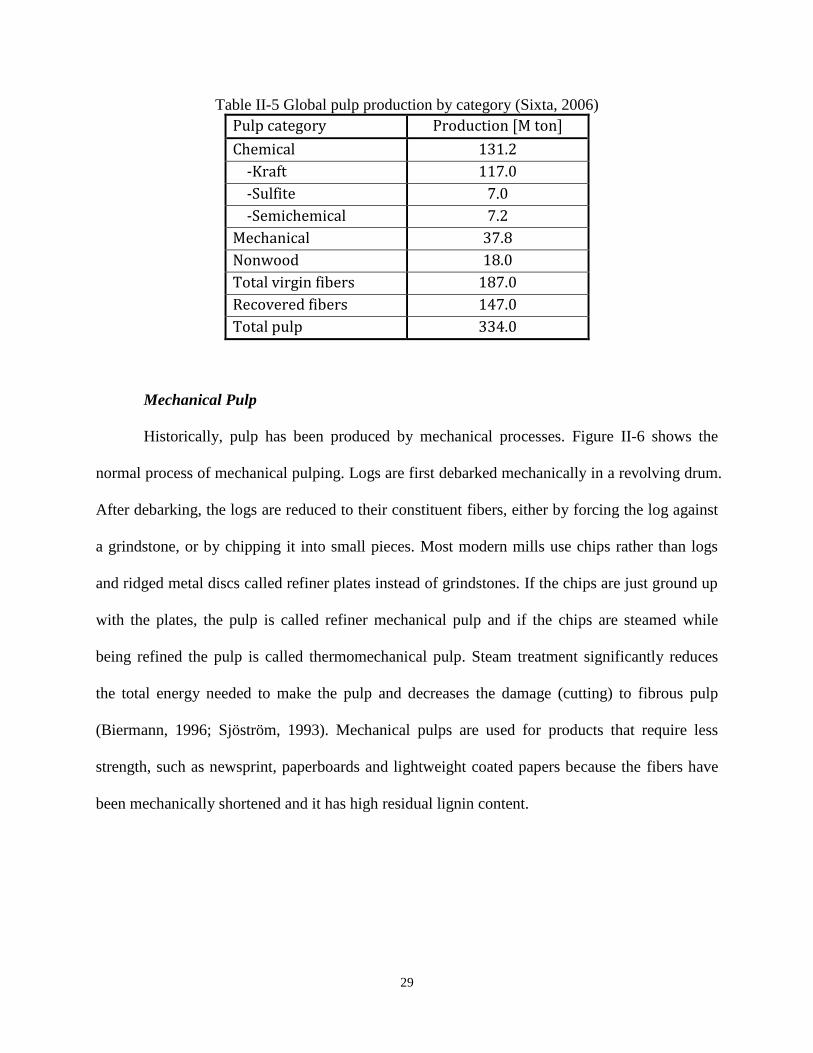
29
Table II-5 Global pulp production by category (Sixta, 2006)
Pulp category Production [M ton]
Chemical 131.2
-Kraft 117.0
-Sulfite 7.0
-Semichemical 7.2
Mechanical 37.8
Nonwood 18.0
Total virgin fibers 187.0
Recovered fibers 147.0
Total pulp 334.0
Mechanical Pulp
Historically, pulp has been produced by mechanical processes. Figure II-6 shows the
normal process of mechanical pulping. Logs are first debarked mechanically in a revolving drum.
After debarking, the logs are reduced to their constituent fibers, either by forcing the log against
a grindstone, or by chipping it into small pieces. Most modern mills use chips rather than logs
and ridged metal discs called refiner plates instead of grindstones. If the chips are just ground up
with the plates, the pulp is called refiner mechanical pulp and if the chips are steamed while
being refined the pulp is called thermomechanical pulp. Steam treatment significantly reduces
the total energy needed to make the pulp and decreases the damage (cutting) to fibrous pulp
(Biermann, 1996; Sjöström, 1993). Mechanical pulps are used for products that require less
strength, such as newsprint, paperboards and lightweight coated papers because the fibers have
been mechanically shortened and it has high residual lignin content.
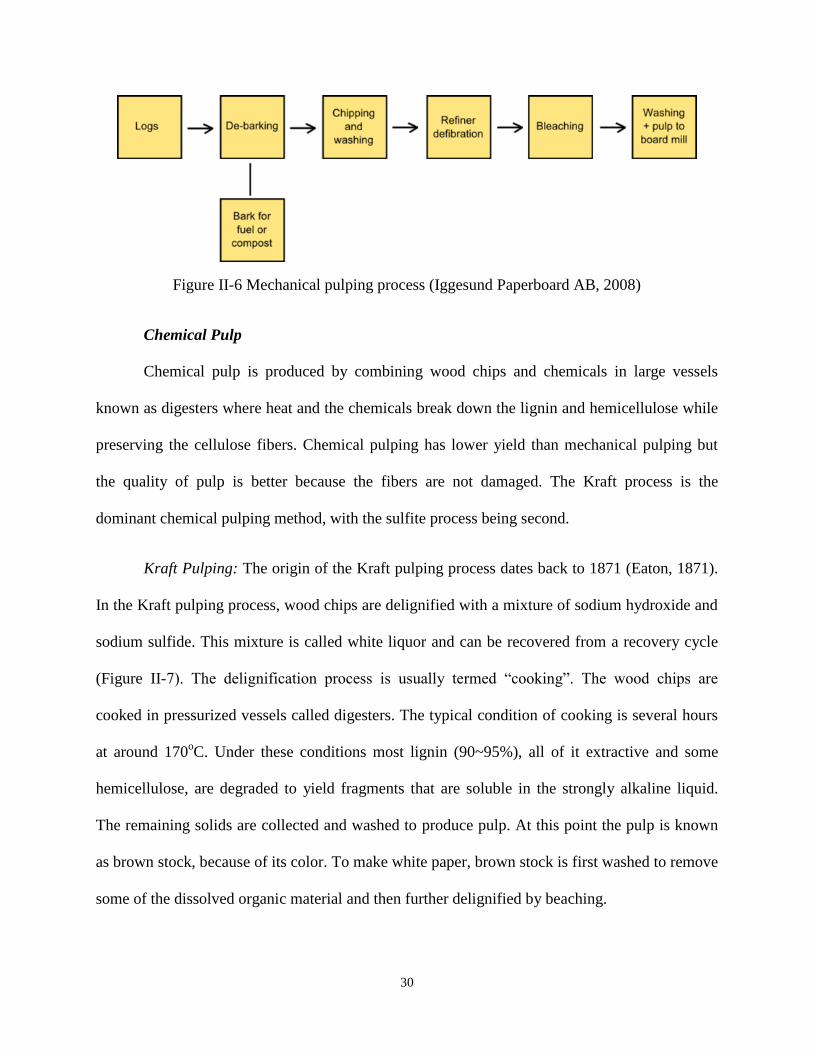
30
Figure II-6 Mechanical pulping process (Iggesund Paperboard AB, 2008)
Chemical Pulp
Chemical pulp is produced by combining wood chips and chemicals in large vessels
known as digesters where heat and the chemicals break down the lignin and hemicellulose while
preserving the cellulose fibers. Chemical pulping has lower yield than mechanical pulping but
the quality of pulp is better because the fibers are not damaged. The Kraft process is the
dominant chemical pulping method, with the sulfite process being second.
Kraft Pulping: The origin of the Kraft pulping process dates back to 1871 (Eaton, 1871).
In the Kraft pulping process, wood chips are delignified with a mixture of sodium hydroxide and
sodium sulfide. This mixture is called white liquor and can be recovered from a recovery cycle
(Figure II-7). The delignification process is usually termed “cooking”. The wood chips are
cooked in pressurized vessels called digesters. The typical condition of cooking is several hours
at around 170oC. Under these conditions most lignin (90~95%), all of it extractive and some
hemicellulose, are degraded to yield fragments that are soluble in the strongly alkaline liquid.
The remaining solids are collected and washed to produce pulp. At this point the pulp is known
as brown stock, because of its color. To make white paper, brown stock is first washed to remove
some of the dissolved organic material and then further delignified by beaching.

31
The combined liquid from the cooking step is called “black liquor’’; it contains lignin
fragments, carbohydrates from the breakdown of hemicellulose, sodium carbonate, sodium
sulfate and other inorganic salts. This black liquor will then be concentrated in multiple effect
evaporators to 65-75% solids and transferred to the recovery boiler for burning and recovery of
inorganic chemicals (Na2S, Na2CO3), which will in turn be reused in the pulping process.
Dissolving these inorganic chemicals from the recovery boiler produces “green liquor”. This
liquid is then mixed with calcium oxide, which becomes calcium hydroxide in solution, to
regenerate the white liquor. Calcium carbonate precipitates from the white liquor and is heated to
recover calcium oxide.
CaO + H2O → Ca(OH)2
Na2CO3 + Ca(OH)2 → 2 NaOH + CaCO3
CaCO3 → CaO + CO2
Figure II-7 Recovery cycles of chemicals for a Kraft mill (Prevention, 2001)

32
Kraft chemical recovery processes consume an estimated 8.04 million BTU/ton of pulp.
However, the recovery boilers in the chemical recovery processes can produce 1-2 times more
energy in the form of high pressure steam, which is used to reduce the steam usage in the
cooking process as well as generate electricity (Martin et al., 2000).
Kraft pulping produces a stronger pulp from a wider variety of fiber sources, compared to
other pulping processes. All types of wood, including very resinous types like southern pine, and
nob-wood species like bamboo can be used in the Kraft process. The disadvantage of Kraft
pulping is that, compared to other pulping process, it produces darker pulp, that needs bleaching
to make it white. Bleaching decreases the mass of pulp produced by about 5%, decreases the
strength of the fibers and adds to the cost of manufacturing.
Sulfite Pulping: Sulfite pulping evolved from the soda processes developed in the
nineteenth century, which used strong bases (alkaline solutions) such as lye to digest wood. In
the sulfite pulping process various salts of sulfurous acid are used to extract lignin from wood
chips and produce almost pure cellulose fibers. The sulfite process is carried out between pH 1.5
and 5 depending on the counter-ion to sulfite and the ratio of base to sulfurous acid. The pulp is
in contact with chemicals for 4-14 hours and temperatures are in the range of 130 to 160oC
(Biermann, 1993). The sulfite process does not degrade lignin to the same extent as the kraft
process and the lignosulfonates from the sulfite process are useful byproducts. Since the sulfite
process is acidic, some of the cellulose was hydrolyzed in the acidic conditions, which causes
that sulfite pulp fibers are not as strong as kraft pulp fibers. The yield of pulp (based on wood
used) is higher than for Kraft pulping and sulfite pulp is easier to bleach.
33
Chemi-thermo-mechanical pulp:
The hybrid pulping is mainly chemi-thermo-mechanical pulp or chemi-mechanical pulp
making processes involving mechanical action and the use of chemicals. The wood chips are
pretreated with sodium carbonate, sodium hydroxide, sodium sulfite, and other chemical prior to
a mechanical action. This mechanical action is not as drastic as a mechanical pulp making
process. The conditions of the chemical treatment are much vigorous than in a chemical pulping
process. It removes extractives and small amounts of hemicellulose but not much lignin. Chemi-
thermo-mechanical pulp is stronger than thermomechanical pulp, but requires less energy to
produce. Chemi-thermo-mechanical pulp displaces small amounts of chemical pulps in certain
grades of paper (Biermann, 1996; Sjöström, 1993).
Recycled Pulp
In the US, approximately 27% of paper is recycled and used in applications which require
less brightening, such as newspaper and paperboard. (American Forest & Paper Association,
Paper, Paperboard & Wood Pulp: 2002 Statistics, Data through 2001, 2002). Recycled pulp is
also called deinked pulp. Deinked pulp is recycled paper which has been processed by chemicals,
thus removing printing inks and other unwanted elements. Many newsprint, toilet paper and
facial tissue grades commonly contain 100 percent deinked pulp. In many other grades, such as
lightweight coated for offset and printing and writing papers for office and home use, deinked
pulp makes up a substantial proportion of the furnish.
II.7.2 The Integrated Forest Bio-refinery
The pulp and paper industry in the United States is struggling due to the decreased
demand for paper brought on by the advent of digital information technology; as well as
increased competition from cheaper foreign products. The United States had been the world’s
34
leading producer of paper until it was overtaken by China in 2009 (De Sisti, 2012). These facts
are forcing the pulp and paper industries to find new opportunities in order to improve their
competitiveness. The integrated “bio-refinery” process that produces value-added products as
supplements in Kraft paper mills is an example of a new opportunity for the pulp and paper
industry. A wood-based bio-refinery is a plant that produces multiple value-added products.
From the pulp and paper making process, there are several potential opportunities, hemicellulose,
black liquor, paper sludge, and waste paper.
Paper mill sludge is a solid waste material composed of pulp residues and ash generated
from the pulping and paper making process. Paper sludge has been a disposal liability for many
years (Albertson & Pope, 1999). However, due to its high carbohydrate content and well-
dispersed structure, the sludge can be biologically converted to value-added products without
pretreatment (Schmidt et al., 1997; Lark et al., 1997; Kang et al., 2010). Utilization of paper mill
sludge as feedstock to produce LA has at least two economic advantages. First, the cost of this
feed stock is basically zero or even negative considering the cost of disposal is about $20 per wet
ton (Kang et al., 2010). Paper sludge is produced at a concentrated site and permanent production
location, making the feedstock availability reliable. Second, pretreatment is not necessary to bio-
convert paper mill sludge to products. Pretreatment is one of the most costly steps in bio-refinery
process, thus elimination of pretreatment significantly reduces the production cost of LA.
In the United States, about 80% of pulp capacity is Kraft pulp. During the Kraft pulping
process, most of the hemicellulose goes into black liquor that is then burned to recover chemicals
and generate steam and electricity (Biermann, 1993). It is difficult to separate the hemicellulose
from the black liquor, and the heating value of hemicellulose (13.6 MJ/kg) is only half of that of
lignin (27 MJ/kg) (Sixta, 2006). As a result, burning hemicellulose sugar like this can be
35
wasteful. Studies have shown it is technically feasible to remove part of the hemicellulose before
pulping by hot water/steam (Yoon et al., 2008; Yoon et al., 2010), dilute acid (Springer & Harris
1982), or mild alkaline (Al-Dajani & Tschirner, 2008) treatment. Hemicellulose hydrolyzates
from water or dilute-acid pretreatment can be utilized to produce value-added products, such as
ethanol and xylitol (Buhner & Agblevor, 2004; Mussatto et al., 2005; Walther et al., 2001;
Werpy & Petersen, 2004). Hemicellulose pre-extraction has to be done without reducing pulp
yield and strength, since the existing ways of pulp and paper-making remain at the heart of wood
based bio-refinery (Closset et al., 2005; Mensink et al., 2007).
36
III. Kinetic Study of Dilute-Acid Catalyzed Hemicellulose Hydrolysis of
Corn Stover under High-Solid Conditions
III.1 Abstract
The kinetic model of dilute acid hydrolysis of hemicellulose in Kramer corn stover under
high solid loading conditions was investigated in this study. We investigated the kinetics of the
reactions occurring in dilute-acid pretreatment of corn stover, covering the reaction conditions
similar to those of the NREL reactor. The hydrolysis reactions were performed at various
temperatures (155⎼185oC), acid concentrations (1⎼2 wt%) and reaction times with a 1/2 solid to
liquid ratio. The experimental data was fitted to a first-order biphasic model which assumes that
xylan is comprised of two different fragments: fast and slow reacting fraction. Due to the high
solid loading condition, significant amount of xylose oligomers was observed during the
pretreatment. Thus, the inclusion of an oligomer intermediate in the kinetic model was applied.
Kinetic constants were analyzed by an Arrhenius-type expansion with introduction of acid
concentration factor. The kinetic model showed overall good agreement with experimental data.
However, it under-predicts xylose oligomers at latter stage, particularly under relatively high
severity conditions. It was speculated that side reactions may occur, especially recombination of
xylose and its oligomers with soluble lignin forming lignin-carbohydrate complex. In subsequent
investigation, we have positively identified the presence of lignin-carbohydrate complex during
the acid pretreatment by NMR and by FTIR. The kinetic model was therefore modified
incorporating the side reactions. The revised model has shown closer agreement with the
experimental data.

37
III.2 Introduction
Corn stover is a renewable, cheap and easily available biomass resource. The hydrolysis
of corn stover to produce sugar and conversion to fuels and chemicals has been extensively
studied (Sheehan et al., 2003; Kadam & McMillan, 2003; Lau & Dale, 2009; Öhgren et al., 2006;
Kazi et al., 2010). Hemicellulose accounts for around 20% of corn stover. Its utilization is an
important segment in overall bioconversion process.
Pretreatment is a necessary step in bioconversion process. The overall purpose of
pretreatment is to break down the shield formed by lignin and hemicellulose, disrupt the
crystalline structure and reduce the degree of polymerization of cellulose (Mosier et al., 2005;
Zhang, 2007). Dilute-acid pretreatment is one of the most advanced and widely accepted
pretreatment technologies (Torget et al., 2000; Wyman et al., 2005). It can effectively remove
and recover most of the hemicellulose, increase the yield of cellulose in subsequent enzymatic
hydrolysis.
An exhaustive mechanism of lignocellulosic biomass hydrolysis process in acid
environment has not been elucidated. Due to its heterogeneous characteristic with multi-stage
mechanism involved, such as diffusion of catalyst and transportation of products. Simplified
approaches have been used to understand the complex reaction. Kinetic modeling based on
pseudo-homogeneous reactions is a common approach for its ability to accurately reproduce
experimental data (Garrote et al., 2001c). The kinetics of hemicellulose hydrolysis catalyzed by
dilute acid has been studied comprehensively. The simplest kinetic model that has been proposed
is based on the hydrolysis of cellulose (Saeman, 1945). It is a two-step homogeneous pseudo-
first-order reaction: xylan is first hydrolyzed to xylose, and the xylose is then degraded to
furfural.
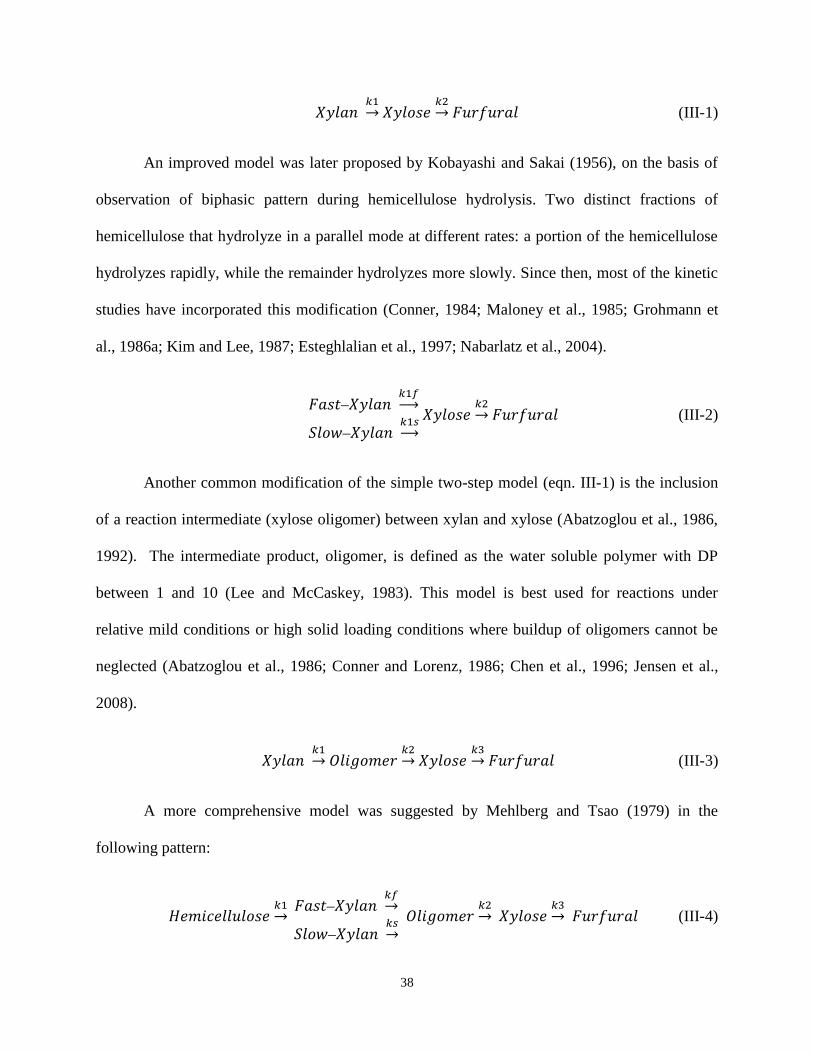
38
𝑋𝑦𝑙𝑎𝑛 𝑘1→ 𝑋𝑦𝑙𝑜𝑠𝑒
𝑘2→ 𝐹𝑢𝑟𝑓𝑢𝑟𝑎𝑙 (III-1)
An improved model was later proposed by Kobayashi and Sakai (1956), on the basis of
observation of biphasic pattern during hemicellulose hydrolysis. Two distinct fractions of
hemicellulose that hydrolyze in a parallel mode at different rates: a portion of the hemicellulose
hydrolyzes rapidly, while the remainder hydrolyzes more slowly. Since then, most of the kinetic
studies have incorporated this modification (Conner, 1984; Maloney et al., 1985; Grohmann et
al., 1986a; Kim and Lee, 1987; Esteghlalian et al., 1997; Nabarlatz et al., 2004).
𝐹𝑎𝑠𝑡⎼𝑋𝑦𝑙𝑎𝑛 𝑘1𝑓→
𝑆𝑙𝑜𝑤⎼𝑋𝑦𝑙𝑎𝑛 𝑘1𝑠→ 𝑋𝑦𝑙𝑜𝑠𝑒
𝑘2→ 𝐹𝑢𝑟𝑓𝑢𝑟𝑎𝑙 (III-2)
Another common modification of the simple two-step model (eqn. III-1) is the inclusion
of a reaction intermediate (xylose oligomer) between xylan and xylose (Abatzoglou et al., 1986,
1992). The intermediate product, oligomer, is defined as the water soluble polymer with DP
between 1 and 10 (Lee and McCaskey, 1983). This model is best used for reactions under
relative mild conditions or high solid loading conditions where buildup of oligomers cannot be
neglected (Abatzoglou et al., 1986; Conner and Lorenz, 1986; Chen et al., 1996; Jensen et al.,
2008).
𝑋𝑦𝑙𝑎𝑛 𝑘1→ 𝑂𝑙𝑖𝑔𝑜𝑚𝑒𝑟
𝑘2→ 𝑋𝑦𝑙𝑜𝑠𝑒
𝑘3→ 𝐹𝑢𝑟𝑓𝑢𝑟𝑎𝑙 (III-3)
A more comprehensive model was suggested by Mehlberg and Tsao (1979) in the
following pattern:
𝐻𝑒𝑚𝑖𝑐𝑒𝑙𝑙𝑢𝑙𝑜𝑠𝑒𝑘1→ 𝐹𝑎𝑠𝑡⎼𝑋𝑦𝑙𝑎𝑛
𝑘𝑓→
𝑆𝑙𝑜𝑤⎼𝑋𝑦𝑙𝑎𝑛 𝑘𝑠→ 𝑂𝑙𝑖𝑔𝑜𝑚𝑒𝑟
𝑘2→ 𝑋𝑦𝑙𝑜𝑠𝑒
𝑘3→ 𝐹𝑢𝑟𝑓𝑢𝑟𝑎𝑙 (III-4)

39
In all cases, the reactions are assumed to be pseudo-homogeneous following a first-order
dependence on reactant concentrations. All the rate constants have Arrhenius-type temperature
dependence with an expansion of acid concentration term (Nee and Yee, 1976; Maloney et al.,
1985; Carrasco and Roy, 1992; Nabarlatz et al., 2004; Jensen, et al., 2008):
𝑘 = 𝑘0 ∗ 𝐴𝑛 ∗ 𝑒−𝐸/𝑅𝑇 (III-5)
where k0: pre-exponential factor (min-1
); E: activation energy (kJ/mol);
n: acid exponent; A: acid concentration (wt%).
R: 8.314 × 10⁻³
(kJ/mol⋅K) T: temperature (K)
Previous studies have led to various kinetic models with parameters. These models and
parameters only apply to specific substrates and cover a narrow range of reaction conditions.
According to our preliminary test, none of those models with parameter values gave satisfactory
fittings to hydrolysis of corn stover under high solid loading condition. A high solid loading is
preferred for process economics because this reduces the reactor size, lowers the cost in heating,
and lowers water usage (Hsu et al., 1996). Saeman (1945) reported that the solid to liquid (S/L)
ratio over the range of 5 to 20 had a small but definite effect on the rate of cellulose hydrolysis.
Solid loading effect was reported as an indicator of deviation from first-order kinetics (Jacobsen
and Wyman, 2002). Jensen et al., (2008) suggested that the effect of solid loading could be
potentially incorporated in the Arrhenius expression for the kinetic constants.
National Renewable Energy Laboratory (NREL) has developed a continuous auger-
driven pretreatment reactor that can be operated with high-solid charge and short residence time.
The reaction condition employed in this process is beyond the region normally explored in the
conventional processes, especially in the solid/liquid ratio. The purpose of this study is to

40
investigate the kinetics of the reactions occurring in dilute-acid pretreatment of corn stover,
covering the reaction conditions similar to those of the NREL reactor.
III.2.1 Materials and Methods
III.2.2 Feedstock
Kramer Corn Stover (KCS) sample was provided by NREL. This substrate was harvested
from the Kramer farm in Wray, Colorado. It was ground and screened, particles with size
between 20-60 mesh were collected for the hydrolysis experiments. The ground KCS was air-
dried at room temperature to moisture content below 10%. The chemical composition (dry basis)
of the KCS was analyzed according to the NREL standard procedure (2008), and this substrate
was found to have 37.3 wt% glucan, 20.6 wt% xylan, 3.6 wt% arabinan, 0.6 wt% galactan, 16.03
wt% insoluble lignin, 1.01wt% acid soluble lignin and 6.3 wt% ash.
III.2.3 Neutralization Capacity of Kramer Corn Stover
Since the mineral content of biomass can neutralize some of the acid during dilute acid
pretreatment (Grohmann et al., 1985; Springer & Harris, 1985; Malester et al., 1992). The
concentration of acid should be corrected according to feedstock’s neutralization capability (NC).
The NC of KCS was measured using 1N [H+] sulfuric acid solution. Five grams of KCS (dry
weight) was put into a beaker with 100 ml DI water. The control group is 100 ml blank DI water.
Sulfuric acid solution was added to the beaker gradually while the pH change was monitored in
the beaker. After the neutralization capacity has been reached, the [H+] difference would remain
constant as the acid addition will increase the [H+] at the same rate in both KCS and the blank.
41
III.2.4 Dilute Acid Hydrolysis
The acid hydrolysis reactions were carried out in small-scale tubular reactors (provided
by NREL) with 4 ml total working volume. The tubular reactors are made out of Hastelloy alloy
to prevent formation of metallic ions by sulfuric acid. Some of the metallic ions, especially
chromium ion which is one of major component in SS-316, are known to be a strong catalyst for
sugar decomposition. Accurate evaluating of kinetic parameters requires a short heat-up period.
The reactants must be quickly brought up to desired temperature and remain at isothermal
condition. The temperature inside the reactor was measured using a thermocouple probe and a
digital indicator. To initiate the reaction, a set of reactors were placed into an oil bath (Haake
FS2 model) in which the temperature was pre-adjusted at a level 50°C higher than the desired
reaction temperature. The ramp up time was less than 1 minute. When the center section of the
reactor reached the desired reaction temperature, it was transferred into another oil bath pre-set at
the desired reaction temperature.
The reaction temperatures were set at 155, 170 and 185oC. The S/L ratio of 1:2 was
applied uniformly, equivalent to 33% solid consistency. Three levels of acid loading (after NC
correction) were used: 1.0wt%, 1.5wt% and 2.0wt%. The experimental design was set up within
practical reaction conditions. For example, the acid level below 1wt% at 155oC was not covered
because of low yields; whereas the acid level above 2wt% at 185oC was not tested because of too
high xylose degradation. To ensure complete wetting and diffusion of acid through the biomass,
the air-dried and screened KCS was presoaked with acid solution for 30 minutes before being
placed into the reactor. Each reactor contained 3.0 grams of wet feedstock.
At various reaction times, reactors were collected from the oil batch and were
immediately quenched in an ice-water bath to stop the reaction. Because of the high S/L ratio, it

42
was unable to squeeze out the liquid from the pretreated KCS. Thus, each collected sample was
diluted 10-times by DI water. The diluted slurries were filtrated to separate the solid and liquid.
The liquid portion was collected for the subsequent analysis of monomer and oligomer sugar
components. The oligomer value was determined by taking the difference of xylose monomer
values in the liquid after and before autoclave at 4 wt% sulfuric acid and 121oC for 1 hour (eqn.
III-6). The solid portion was then washed several times until neutral and was air-dried for the
subsequent composition analysis. These data were then used to determine the associated kinetic
parameters of the proposed model maximizing the degree of fitness.
Xylose-oligomer = Xylose after autoclave – Xylose before autoclave (III-6)
III.2.5 HPLC Analysis
Solid and liquid samples were measured using HPLC equipped with Bio-Rad’s Aminex
HPX-87P, Aminex HPX-87H column and a refractive index detector. The sugars and
degradation products analysis was performed according to the NREL TP 510-42623 and TP 510-
42618.
III.2.6 Kinetic Model Development
In the present work, due to the high solid loading conditions, the biphasic model with the
inclusion of oligomer as intermediate was applied:
𝐹𝑎𝑠𝑡⎼𝑋𝑦𝑙𝑎𝑛 𝑘𝑓→
𝑆𝑙𝑜𝑤⎼𝑋𝑦𝑙𝑎𝑛 𝑘𝑠→𝑂𝑙𝑖𝑔𝑜𝑚𝑒𝑟
𝑘1→ 𝑋𝑦𝑙𝑜𝑠𝑒
𝑘2→ 𝐹𝑢𝑟𝑓𝑢𝑟𝑎𝑙 (III-7)
For this kinetic model, the variation of each individual component can be theoretically
determined by the following set of differential equations:

43
𝑑𝑋𝑓 𝑑𝑡⁄ = −𝑘𝑓 ∗ 𝑋𝑓 (III-8)
𝑑𝑋𝑠 𝑑𝑡⁄ = −𝑘𝑠 ∗ 𝑋𝑠 (III-9)
𝑑𝑂 𝑑𝑡⁄ = 𝑘𝑓 ∗ 𝑋𝑓 + 𝑘𝑠 ∗ 𝑋𝑠 − 𝑘1 ∗ 𝑂 (III-10)
𝑑𝑋 𝑑𝑡⁄ = 𝑘1 ∗ 𝑂 − 𝑘2 ∗ 𝑋 (III-11)
𝑑𝐹 𝑑𝑡⁄ = 𝑘2 ∗ 𝐹 (III-12)
With initial conditions at 𝑡 = 0, 𝑋𝑓 = 𝐹𝑓 ∗ 𝑋0, 𝑋𝑠 = 𝐹𝑠 ∗ 𝑋0, 𝑂 = 0, 𝑋 = 0, 𝐹 = 0.
Where
Xf: fast-xylan Xs: slow-xylan
O: xylose oligomer X: xylose monomer
F: furfural Ff: fraction of fast-xylan
Fs: fraction of slow-xylan X0: initial xylan
By solving these linear differential equations with their initial conditions, the time
dependent expressions are obtained as follows:
𝑋𝑓(𝑡) = 𝐹𝑓 ∗ 𝑋0 ∗ 𝑒−𝑘𝑓∗𝑡 (III-13)
𝑋𝑠(𝑡) = 𝐹𝑠 ∗ 𝑋0 ∗ 𝑒−𝑘𝑠∗𝑡 (III-14)
𝑂 (𝑡) = 𝐹𝑓∗ 𝑋0∗𝑘𝑓
𝑘1−𝑘𝑓(𝑒−𝑘𝑓∗𝑡 − 𝑒−𝑘1∗𝑡) +
𝐹𝑠∗ 𝑋0∗𝑘𝑠
𝑘1−𝑘𝑠(𝑒−𝑘𝑠∗𝑡 − 𝑒−𝑘1∗𝑡) (III-15)
𝑋 (𝑡) = 𝐹𝑓∗ 𝑋0∗𝑘𝑓∗𝑘1
(𝑘1−𝑘𝑓)(𝑘2−𝑘𝑓)(𝑒−𝑘𝑓∗𝑡 − 𝑒−𝑘2∗𝑡) +
𝐹𝑠∗ 𝑋0∗𝑘𝑠∗𝑘1
(𝑘1−𝑘𝑠)(𝑘2−𝑘𝑠)(𝑒−𝑘𝑓∗𝑡 − 𝑒−𝑘2∗𝑡)
−(𝑘1
𝑘2−𝑘1) (
𝐹𝑓∗ 𝑋0∗𝑘𝑓
𝑘1−𝑘𝑓+𝐹𝑠∗ 𝑋0∗𝑘𝑠
𝑘1−𝑘𝑠) ( 𝑒−𝑘1∗𝑡 − 𝑒−𝑘2∗𝑡) (III-16)

44
The total amount of xylan remaining in the solids residue can be then expressed as:
𝑋𝑅 = 𝑋𝑓 + 𝑋𝑠 = 𝐹𝑓 ∗ 𝑋0 ∗ 𝑒−𝑘𝑓∗𝑡 + (1 − 𝐹𝑓) ∗ 𝑋0 ∗ 𝑒
−𝑘𝑠∗𝑡 (III-17)
Where XR: total xylose equivalents remaining in the solids residue.
The experimental data were fitted to the proposed kinetic model using Nonlinear
Regression function in Mathematica. The experimental data of remaining xylan in solids were
first fitted to eqn. (17) to determine Ff, kf and ks simultaneously. After obtaining nine set of Ff
value, the average will be used for subsequent regression. The rate constants were calculated
using a maximum likelihood approach, which is based on minimization of error between the
experimental data and the kinetic model. After acquiring the rate constants at each set of reaction
conditions (temperature and acid concentration), the kinetic parameters (k0, n and E) of each
constant were determined by regression using the linearized Arrhenius equation (eqn. III-18).
The accountability of estimated rate constants and parameters were evaluated with statistical
analysis.
𝑙𝑛(𝑘) = 𝑙𝑛(𝑘0) + 𝑛 ∗ 𝑙𝑛(𝐴) – 𝐸/𝑅𝑇 (III-18)
III.3 Results and Discussion
III.3.1 Neutralization Capacity of Kramer Corn Stover
Lignocellulosic biomass has a significant amount of mineral content. It is well known
that these minerals can neutralize some of the acid during dilute acid pretreatment, reducing its
effectiveness (Grohmann et al., 1986a; Malester et al., 1992; Springer & Harris, 1985). The NC
has a minor effect at low solid loading and/or high acid loading conditions. However, at high
solid concentrations, it has to be considered to evaluate the actual acid level. For sulfuric acid, an

45
equilibrium shift to formation of bisulfate during neutralization can further reduce hydrogen ion
concentrations and compound the effect of neutralization. Because the equilibrium shift has a
more pronounced effect at lower acid concentrations, additional acid is needed to compensate
(Lloyd and Wyman 2004). Coupled with the effect of temperature on acid dissociation, these
effects increase acid requirements to achieve a particular reaction rate unless minerals are
removed prior to hydrolysis. Neutralization of sulfuric acid by the minerals in biomass reduces
the hydrogen ion activity and must be taken into account for models to accurately predict the
performance of dilute-acid hemicellulose hydrolysis.
The hydrogen ions [H+] difference between KCS and blank indicates the neutralization
of acid. After the neutralization capacity has been reached the [H+] difference would remain
constant. The neutralization point was located at [H+] = 0.013393M per 5g of KCS. Total
volume of 1N sulfuric acid solution added at this point is 4.2 ml. Thus the neutralization capacity
of this feedstock is:
0.013393 ∗ (100 + 4.2)/1000 ∗ 49/5 = 0.01368
Every gram of KCS will neutralize 13.68 mg of H2SO4. This value will be used to
calculate the actual amount of H2SO4 required achieving desired acid loading in the dilute-acid
pretreatment experiments.
III.3.2 Model Fitness
The experimental data showed that high xylose oligomer concentrations are achieved in
all the pretreat conditions under high solid loading. The maximum oligomer concentration ranges
from 41 to 53% of initial xylan. The high amount of oligomer indicate that the inclusion of
xylose oligomer as reaction intermediate is required to accurate depict the mechanism of

46
hemicellulose hydrolysis process. The xylose monomer concentration increased with reaction
time at the early stage and began to decrease after reaching maximum value at all pretreatment
conditions. The only exception is under the low temperature and low acid. These data confirm
that the proposed kinetic model (eqn. III-7) is appropriate.
The percentage of the fast-xylan (Ff) in KCS varies between 0.59 and 0.85 at different
pretreatment conditions. There was no apparent relationship between the Ff and pretreatment
conditions. Therefore, the average value of 0.70 is chosen. This value is close to the reported
value (0.65) in the literature for corn stover (Esteghlalian et al., 1997). The percentage of fast-
xylan in various biomass species from literature is shown in Table III-1. Figure III-1 depicts the
representative reaction pattern of acid hydrolysis of xylan in KCS. The sharp breakage in the
plots confirms that the xylan in KCS is biphasic. This finding is in agreement with conventional
kinetic model as described previously. One exception was the straight line at lowest temperature
and lowest acid concentration (155oC and 1 wt% H2SO4). Under this condition, it is believed that
120 minutes of reaction time was not sufficient to remove the entire fast-xylan fraction.
Each set of experimental data were fitted to eqn. (III-13) to (III-17) to calculate ki for
each run. The calculated rate constants for each of the conditions are shown in Table III-2. As we
can see from the table, the xylan hydrolysis rates were strictly higher than the xylose degradation
rates, which implied all the pretreatment conditions explored favored xylan hydrolysis. The
statistical data for all the regression results are shown in Table III-3. As seen from the statistical
output, all of the p-Values are far below 0.01, which indicates our regression results are valid.
Figure III-2 to III-10 are the experimental and model fitted data profiles. The solid lines are the
fitted model data, and the points are experimental data. The model predictions showed overall
good agreement with the measured data.

47
From the experimentally determined rate constants the Arrhenius parameters (pre-
exponential factor, activation energy and the acid exponent) were determined by regression using
the linearized Arrhenius equation (eq. III-18). The activation energy and acid exponents of ki
determined from statistical are listed in Table III-4. Figure III-11 and III-12 are sample plots for
activation energy and acid exponent for ki respectively. The Arrhenius parameter values are in
good agreement with those derived from individual runs.
A direct comparison of the kinetic parameters from this study with the ones from
literature is difficult because of the differences in substrates materials kinetic models and
experimental conditions. Table III-5 summarizes the comparison of kinetic parameters obtained
in this study with the values reported in literatures. The activation energies determined in this
study were found to be of the same order as most of the literature values (Kim & Lee, 1987;
Maloney et al., 1985; Esteghlalian et al., 1996; Eken-Saraçoğlu et al., 1998). The slow hydrolysis
step requires more energy since it has higher activation energy value than the fast hydrolysis step.
This is in agreement with the literature values (Kim & Lee, 1987; Maloney et al., 1985;
Esteghlalian et al., 1996; Eken-Saraçoğlu et al., 1998). Discrepancy was found between this
study and literature results. The activation energies of kf and ks are relatively low compare to
literature value and the acid exponent are higher. This may be due to the solid loading in this
study is much higher than previous studies (Maloney et al., 1985; Esteghlalian et al., 1996; Eken-
Saraçoğlu et al., 1998). Also, the formation of xylose oligomers was not taken into consideration
as intermediates in most of the previous studies. This can bring significant differences for kinetic
parameter values. Of particular significance in this result is that the hydrolysis reactions are more
sensitive to temperature and acid concentration than the decomposition reaction; this is indicated

48
by the magnitude of activation energies and acid exponents. Thus, the higher the temperature and
acid concentration, the higher yield of xylose is expected.
III.3.3 Modification of Kinetic Model
Although the kinetic model (eqn. III-7) accurately predicted the maximum value and
initial points of xylose oligomer formation, significant discrepancy was observed at the latter
stage of the reaction. The latter phase of xylose oligomer levels was consistently under-estimated
for most of the pretreatment conditions. A potential explanation is that the high amount of
observed xylose oligomers may be caused by the interaction of xylose monomers/oligomers with
the extraneous components released into prehydrolysate during the pretreatment, especially with
soluble lignin.
The effect of extraneous components released to the hydrolysate on the hydrolysis of
oligomers and/or on the decomposition of xylose was investigated. Parallel experiments were
carried out in which xylose oligomers were hydrolyzed under the same experimental conditions
such as acid concentration and temperature, but under two different environments: (1)
pretreatment hydrolysate as is, (2) pure xylose oligomers without any extraneous components.
The pure xylose oligomers were prepared from partial hydrolysis of Beechwood xylan (Sigma
X4252). In both cases the total xylose units in the oligomers were set to be identical. The
hydrolysis results are shown in Figure III-13. The data clearly indicate that there is a substantial
effect of the extraneous components as the yield from pure xylose oligomer was 22% higher than
that from pretreatment hydrolysate. We speculated that the yield difference may be caused by
formation of lignin–carbohydrate complex (LCC). To look into this closely, the xylose
degradation was also investigated. Xylose was put under the hydrolysis reaction conditions with

49
and without lignin. It was found that xylose degrades more with introduction of external lignin
(Figure III-14).
Figure III-15 is a schematic structure of lignin and LCC (Singh, et al., 2005). In order to
verify the existence of LCC, lignin sample was extracted from the hydrolysate. Ethyl acetate was
used to extract soluble lignin existing in the pretreatment liquor, and this liquid lignin sample
was purified by hexane. It was then freeze-dried and subjected to FTIR and NMR test. Both the
FTIR (Figure III-16) and NMR (Figure III-17) spectra clearly show that this sample has lignin as
well as sugar peaks, a positive proof that at least a part of the extracted solid is LCC. We also
analyzed the composition of this LCC sample and found that it contains xylose at level of 15
wt%.
The failure of the proposed model (eqn. III-7) to accurately describe the experimental
data of xylose oligomer at latter stage suggests that the formation and hydrolysis of oligomer
intermediate may not be described by a single irreversible step. Based on the discovery of LCC
formation during pretreatment, we proposed a modified kinetic model with incorporation of LCC:
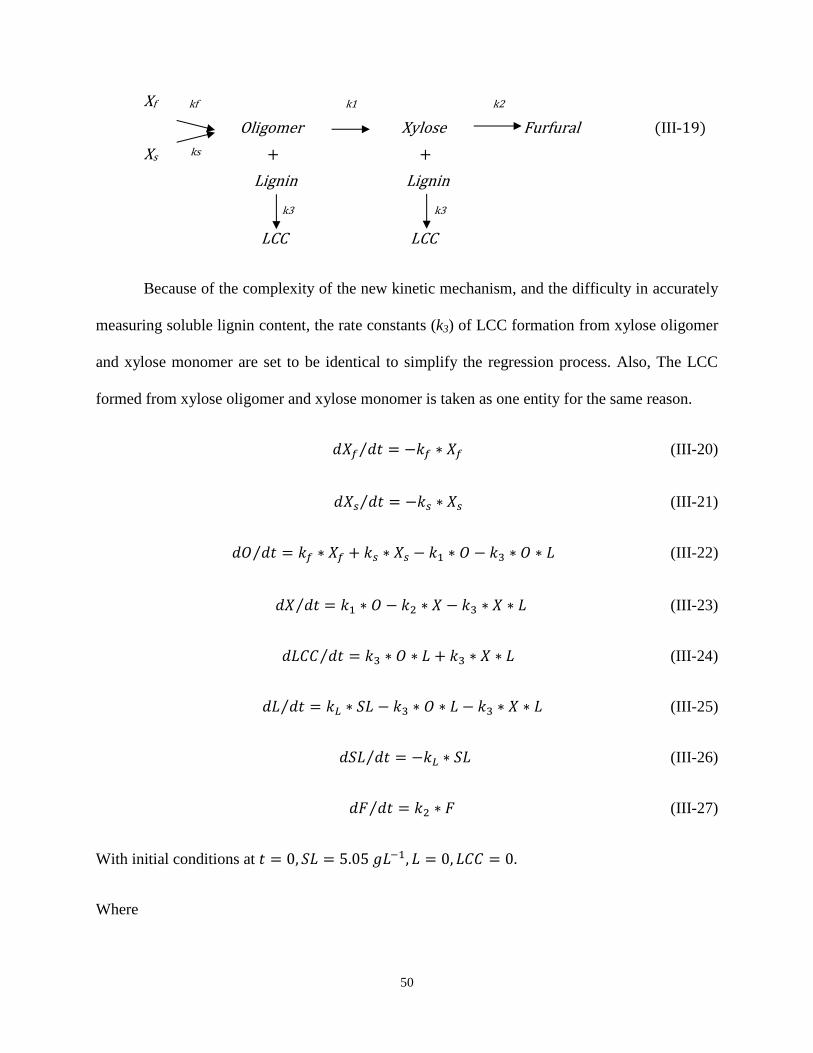
50
Xf kf k1 k2
Oligomer Xylose Furfural (III-19)
Xs ks + +
Lignin Lignin
k3 k3
LCC LCC
Because of the complexity of the new kinetic mechanism, and the difficulty in accurately
measuring soluble lignin content, the rate constants (k3) of LCC formation from xylose oligomer
and xylose monomer are set to be identical to simplify the regression process. Also, The LCC
formed from xylose oligomer and xylose monomer is taken as one entity for the same reason.
𝑑𝑋𝑓 𝑑𝑡⁄ = −𝑘𝑓 ∗ 𝑋𝑓 (III-20)
𝑑𝑋𝑠 𝑑𝑡⁄ = −𝑘𝑠 ∗ 𝑋𝑠 (III-21)
𝑑𝑂 𝑑𝑡⁄ = 𝑘𝑓 ∗ 𝑋𝑓 + 𝑘𝑠 ∗ 𝑋𝑠 − 𝑘1 ∗ 𝑂 − 𝑘3 ∗ 𝑂 ∗ 𝐿 (III-22)
𝑑𝑋 𝑑𝑡⁄ = 𝑘1 ∗ 𝑂 − 𝑘2 ∗ 𝑋 − 𝑘3 ∗ 𝑋 ∗ 𝐿 (III-23)
𝑑𝐿𝐶𝐶 𝑑𝑡⁄ = 𝑘3 ∗ 𝑂 ∗ 𝐿 + 𝑘3 ∗ 𝑋 ∗ 𝐿 (III-24)
𝑑𝐿 𝑑𝑡⁄ = 𝑘𝐿 ∗ 𝑆𝐿 − 𝑘3 ∗ 𝑂 ∗ 𝐿 − 𝑘3 ∗ 𝑋 ∗ 𝐿 (III-25)
𝑑𝑆𝐿 𝑑𝑡⁄ = −𝑘𝐿 ∗ 𝑆𝐿 (III-26)
𝑑𝐹 𝑑𝑡⁄ = 𝑘2 ∗ 𝐹 (III-27)
With initial conditions at 𝑡 = 0, 𝑆𝐿 = 5.05 𝑔𝐿−1, 𝐿 = 0, 𝐿𝐶𝐶 = 0.
Where

51
LCC: lignin–carbohydrate complex SL: soluble lignin content in KCS
L: soluble lignin concentration in prehydrolysate
Since this is a non-linear model, there are no analytical solutions for each of the
components. Mathcad software was used to perform the non-linear regression based on the
differential equations (III-20 to III-27). The Arrhenius parameters for rate constants are shown in
Table III-6. Since the kf and ks values are calculated from the remaining xylan in the solids, it
will not affected by the LCC. So the Arrhenius parameters for these two rate constants are the
same as before. The modified model resulted in higher R2-values, indicating a better fitness.
We have also devised a new analytical method to measure xylose-oligomers, which we
claim to be more accurate. The oligomer concentration started to increase at the end of acid
pretreatment (Figure III-10). This could not be explained by any kinetic model. So we think the
way we measure the oligomer may not be accurate. We analyze xylose-oligomers performing
secondary hydrolysis (121oC autoclave with 4% sulfuric acid) and taking the difference of xylose
monomer values before and after secondary hydrolysis. During the pretreatment, xylose and its
oligomers recombine with soluble lignin forming LCC. LCC formation increases as the
pretreatment proceeds. According to our analytical method, the portion of xylose monomer that
went into formation of LCC is counted as oligomers because when we took the difference after
and before autoclaving, that portion is not measured as xylose. Therefore we believe the correct
way to calculate xylose-oligomer is:
Xylose-oligomer = Xylose after autoclave – Xylose before autoclave – Xylose in LCC
(III-28)

52
The amount of xylose in LCC can be calculated from the concentration of soluble lignin
as we found the soluble lignin in prehydrolysate contains 15 wt% xylose. For sample data taken
at 185oC and 2 wt% acid, the fitness of modified kinetic model with the experimental oligomer
data is shown in Figure III-18. Figure III-19 is another example of model comparison of xylose
monomer. It is clearly shown that the agreement is closer using the modified model.
III.4 Conclusion
The overall kinetic behavior of the xylan in Kramer corn stover was investigated under
high solid conditions. The reaction kinetics under high solids conditions is significantly different
from that of low solids conditions, the formation of oligomer as reaction intermediate cannot be
neglected. And the kinetic parameter values were slightly different from literature values due to
the model difference. The kinetic model with no LCC formation showed overall good agreement
with experimental data. But under high severity conditions, significant discrepancy was observed.
The latter phase of xylose oligomer levels was consistently under-estimated. LCC was proven to
be formed during acid hydrolysis which should be considered. Lignin interferes with the xylose
oligomer hydrolysis reaction inducing side reactions with the oligomers and with the monomers.
The modified model shows better agreement with the experimental data.

53
Table III-1 Fast-xylan fraction in various biomass species
References Feedstock Fast-xylan fraction (%)
Simmonds et al. (1955) Sweetgum 70.0
Kobayashi & Sakai (1956) Buna 70.0
Springer et al. (1963) Aspen 60.0
Springer & Zoch (1968) Aspen, Birch, Elm, Maple 60.0
Veeraraghavan et al. (1982) Southern red oak 72.0
Conner (1984) Southern red oak
Paper birch
Red maple
Quaking aspen
American elm
73.9
71.6
80.3
76.0
84.3 Maloney et al. (1985) Paper birch 68.4
Grohmann et al. (1986) Aspen
Wheat straw
76.0
67.0
Kim & Lee (1987) Southern red oak 69.7
Esteghlalian et al. (1997) Corn stover
Switchgrass
Popler
64.4
76.8
83.8 This study Corn stover 70.0
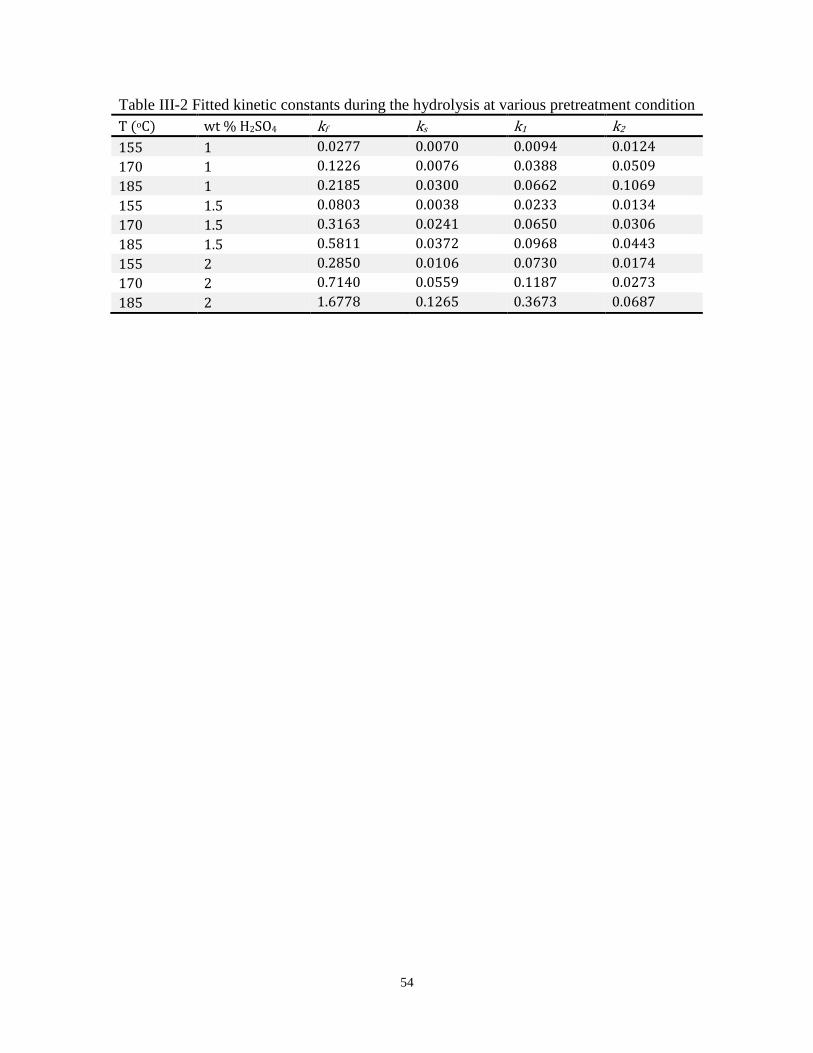
54
Table III-2 Fitted kinetic constants during the hydrolysis at various pretreatment condition
T (oC) wt % H2SO4 kf ks k1 k2
155 1 0.0277 0.0070 0.0094 0.0124
170 1 0.1226 0.0076 0.0388 0.0509
185 1 0.2185 0.0300 0.0662 0.1069
155 1.5 0.0803 0.0038 0.0233 0.0134
170 1.5 0.3163 0.0241 0.0650 0.0306
185 1.5 0.5811 0.0372 0.0968 0.0443
155 2 0.2850 0.0106 0.0730 0.0174
170 2 0.7140 0.0559 0.1187 0.0273
185 2 1.6778 0.1265 0.3673 0.0687

55
Table III-3 Statistical results for kinetic data
a) 1% acid and 155°C
Estimate Standard Error P-Value
kf 0.0277 0.00160745 1.21008*10^-12
ks 0.0070 0.00111982 6.35099*10^-6
k1 0.0094 0.000430376 5.75638*10^-16
k2 0.0124 0.00143547 2.96489*10^-9
b) 1% acid and 170°C
Estimate Standard Error P-Value
kf 0.1226 0.00507026 6.92769*10^-11
ks 0.0076 0.000879516 3.06763*10^-6
k1 0.0388 0.00231204 1.05821*10^-9
k2 0.0509 0.00351834 5.90937*10^-9
c) 1% acid and 185°C
Estimate Standard Error P-Value
kf 0.2185 0.0080913 8.36816*10^-13
ks 0.0300 0.00183991 4.99107*10^-10
k1 0.0662 0.00484218 7.20405*10^-10
k2 0.1069 0.00648817 1.00072*10^-10
d) 1.5% acid and 155°C
Estimate Standard Error P-Value
kf 0.0803 0.0038646 3.01745*10^-8
ks 0.0038 0.000479391 0.0000436861
k1 0.0233 0.00086584 6.55386*10^-10
k2 0.0134 0.000735151 1.99364*10^-8
e) 1.5% acid and 170°C
Estimate Standard Error P-Value
kf 0.3163 0.0239266 1.63253*10^-8
ks 0.0241 0.00221663 1.42749*10^-7
k1 0.0650 0.00274041 4.39889*10^-12
k2 0.0306 0.00101518 2.07289*10^-13

56
f) 1.5% acid and 185°C
Estimate Standard Error P-Value
kf 0.5811 0.0484428 4.85751*10^-8
ks 0.0372 0.0047867 5.11109*10^-6
k1 0.0968 0.00579479 3.61191*10^-10
k2 0.0443 0.00174082 1.76077*10^-12
g) 2% acid and 155°C
Estimate Standard Error P-Value
kf 0.2850 0.0183941 8.51379*10^-8
ks 0.0106 0.00125411 0.0000143307
k1 0.0730 0.00654311 7.78506*10^-7
k2 0.0174 0.00136093 1.65548*10^-7
h) 2% acid and 170°C
Estimate Standard Error P-Value
kf 0.714 0.109962 0.00011237
ks 0.0559 0.00514992 1.79021*10^-6
k1 0.1187 0.00708201 1.19929*10^-8
k2 0.0273 0.00260893 1.03694*10^-6
i) 2% acid and 185°C
Estimate Standard Error P-Value
kf 1.6778 0.125315 4.73351*10^-8
ks 0.1265 0.0130295 4.91293*10^-7
k1 0.3673 0.0223367 4.4257*10^-10
k2 0.0687 0.00213672 8.9311*10^-14

57
Table III-4 Fitted Arrhenius parameters for each rate constant ki
k0 (min-1) n E (kJ/mol) R2
kf 3.28E+11 2.15 105.63 0.99
ks 1.96E+11 1.68 112.49 0.98
k1 2.07E+09 2.02 92.088 0.95
k2 1.47E+08 0.88 82.818 0.94

58
Table III-5 Comparison of parameters results of this study with the literature values
Reference Feedstock Parameter k0 (min-1) n E (kJ/mol)
Kim & Lee (1987) Southern red oak kf 1.04 x 10¹⁴ 1.54 120.1 ks 6.00 x 10¹² 1.19 118.0
Maloney et al. (1985) Paper birch kf 2.67 x 10¹⁶ 1 126.6 ks 16 x 1019 1 156.5 Esteghlalian et al. (1996)
Switchgrass
kf 1.9 x 10²¹ 0.4 169.0 ks 4.2 x 10²³ 2.0 210.7 Poplar kf 3.3 x 10²¹ 0.4 176.7 ks 3.3 x 10²² 1.5 192.0 Corn stover kf 6.7 x 10¹⁶ 1.5 129.8 ks 6.9 x 10¹⁹ 1.6 167.6 Eken-Saraçoğlu et al. (1998)
Corn cob
kf 1.486 x 10¹⁰ 1.21 80.34 ks 2.00 x 10¹⁰ 1.86 85.67 Sunflower seed hull kf 9.642 x 10¹⁰ 1.55 92.31 ks 4.32 x 10⁹ 1.39 78.35 This study Corn stover kf 3.28 x 10¹¹ 2.1 105 ks 1.96 x 10¹¹ 1.68 112

59
Table III-6 Arrhenius parameters for each rate constant ki from modified model
k0 (min-1) n E (kJ/mol) R2
kf 3.28E+11 2.15 105.63 0.99
ks 1.96E+11 1.68 112.49 0.98
k1 1.88E+09 1.87 92.088 0.97
k2 1.01E+08 0.91 82.818 0.96
k3 4.22E+07 1.25 85.364 0.93
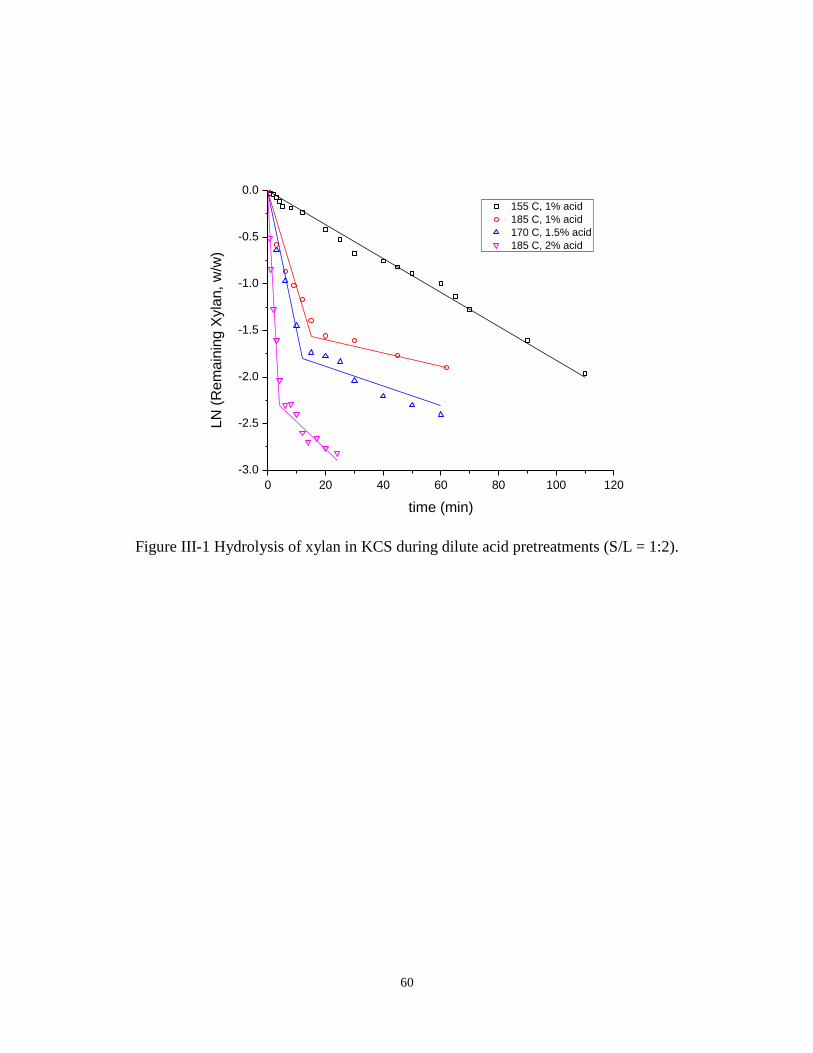
60
0 20 40 60 80 100 120
-3.0
-2.5
-2.0
-1.5
-1.0
-0.5
0.0
155 C, 1% acid
185 C, 1% acid
170 C, 1.5% acid
185 C, 2% acid
LN
(R
em
ain
ing X
yla
n, w
/w)
time (min)
Figure III-1 Hydrolysis of xylan in KCS during dilute acid pretreatments (S/L = 1:2).

61
0 20 40 60 80 100 120 140
0
20
40
60
80
100
Remaining Xylan
Xylose
Xylose Oligomer
% I
nitia
l X
yla
n (
Xylo
se E
qu
ivale
nt)
time (min)
Figure III-2 Experimental and fitted data profiles of KCS hydrolysis (155
oC, 1 wt% H2SO4)
0 20 40 60 80
0
20
40
60
80
100
Remaining Xylan
Xylose
Xylose Oligomer
% Initia
l X
yla
n (
Xylo
se E
quiv
ale
nt)
time (min)
Figure III-3 Experimental and fitted data profiles of KCS hydrolysis (155
oC, 1.5 wt% H2SO4)

62
0 20 40 60 80
0
20
40
60
80
100
Remaining Xylan
Xylose
Xylose Oligomer
% Initia
l X
yla
n (
Xylo
se E
quiv
ale
nt)
time (min)
Figure III-4 Experimental and fitted data profiles of KCS hydrolysis (155
oC, 2 wt% H2SO4)
0 10 20 30 40 50 60
0
20
40
60
80
100
Remaining Xylan
Xylose
Xylose Oligomer
% Initia
l X
yla
n (
Xylo
se E
quiv
ale
nt)
time (min)
Figure III-5 Experimental and fitted data profiles of KCS hydrolysis (170
oC, 1 wt% H2SO4)
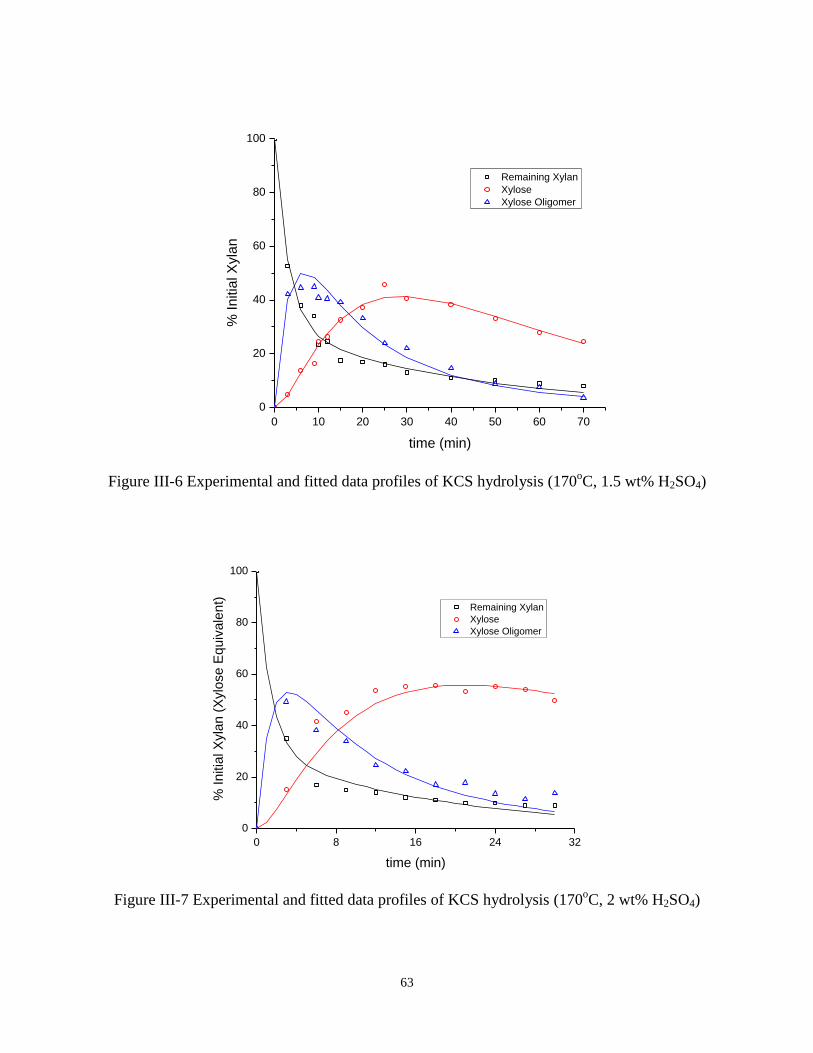
63
0 10 20 30 40 50 60 70
0
20
40
60
80
100
Remaining Xylan
Xylose
Xylose Oligomer
% I
nitia
l X
yla
n
time (min)
Figure III-6 Experimental and fitted data profiles of KCS hydrolysis (170
oC, 1.5 wt% H2SO4)
0 8 16 24 32
0
20
40
60
80
100
Remaining Xylan
Xylose
Xylose Oligomer
% Initia
l X
yla
n (
Xylo
se E
quiv
ale
nt)
time (min)
Figure III-7 Experimental and fitted data profiles of KCS hydrolysis (170
oC, 2 wt% H2SO4)

64
0 5 10 15 20 25 30 35
0
20
40
60
80
100
Remaining Xylan
Xylose
Xylose Oligomer
% Initia
l X
yla
n (
Xylo
se E
quiv
ale
nt)
time (min)
Figure III-8 Experimental and fitted data profiles of KCS hydrolysis (185
oC, 1 wt% H2SO4)
0 10 20 30 40 50
0
20
40
60
80
100
Remaining Xylan
Xylose
Xylose Oligomer
% Initia
l X
yla
n (
Xylo
se E
quiv
ale
nt)
time (min)
Figure III-9 Experimental and fitted data profiles of KCS hydrolysis (185
oC, 1.5 wt% H2SO4)

65
0 5 10 15 20 25
0
20
40
60
80
100
Remaining Xylan
Xylose
Xylose Oligomer
% I
nitia
l X
yla
n
time (min)
Figure III-10 Experimental and fitted data profiles of KCS hydrolysis (185
oC, 2 wt% H2SO4)
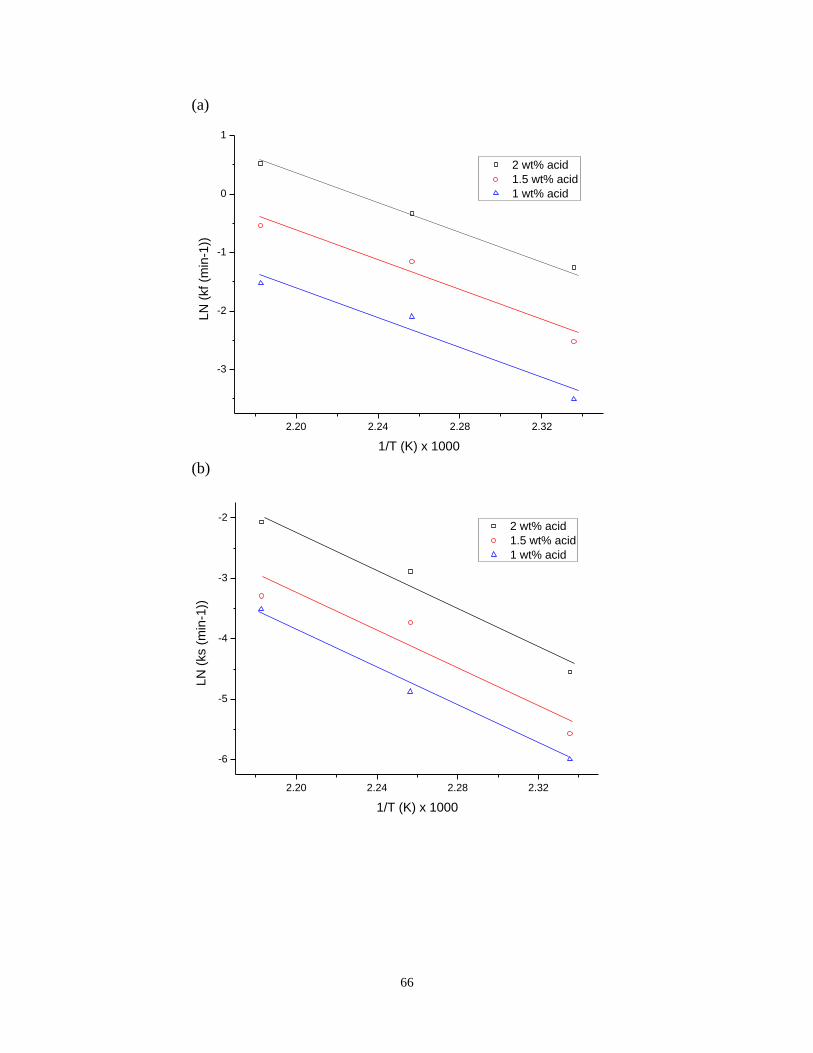
66
(a)
2.20 2.24 2.28 2.32
-3
-2
-1
0
1
2 wt% acid
1.5 wt% acid
1 wt% acidL
N (
kf
(min
-1))
1/T (K) x 1000
(b)
2.20 2.24 2.28 2.32
-6
-5
-4
-3
-2 2 wt% acid
1.5 wt% acid
1 wt% acid
LN
(ks (
min
-1))
1/T (K) x 1000

67
(c)
2.20 2.24 2.28 2.32
-4
-3
-2
-1
2 wt% acid
1.5 wt% acid
1 wt% acid
LN
(k1
(m
in-1
))
1/T (K) x 1000
Figure III-11 Activation energy plots for rate constant ki
(a) activation energy plots for kf
(b) activation energy plots for ks
(c) activation energy plots for k1

68
(a)
0.0 0.2 0.4 0.6 0.8
-3
-2
-1
0
1
185 C
170 C
155 C
LN
(kf
(min
-1))
LN (acid, wt%)
(b)
0.0 0.2 0.4 0.6 0.8
-7
-6
-5
-4
-3
-2
-1
185 C
170 C
155 C
LN
(ks (
min
-1))
LN (acid, wt%)
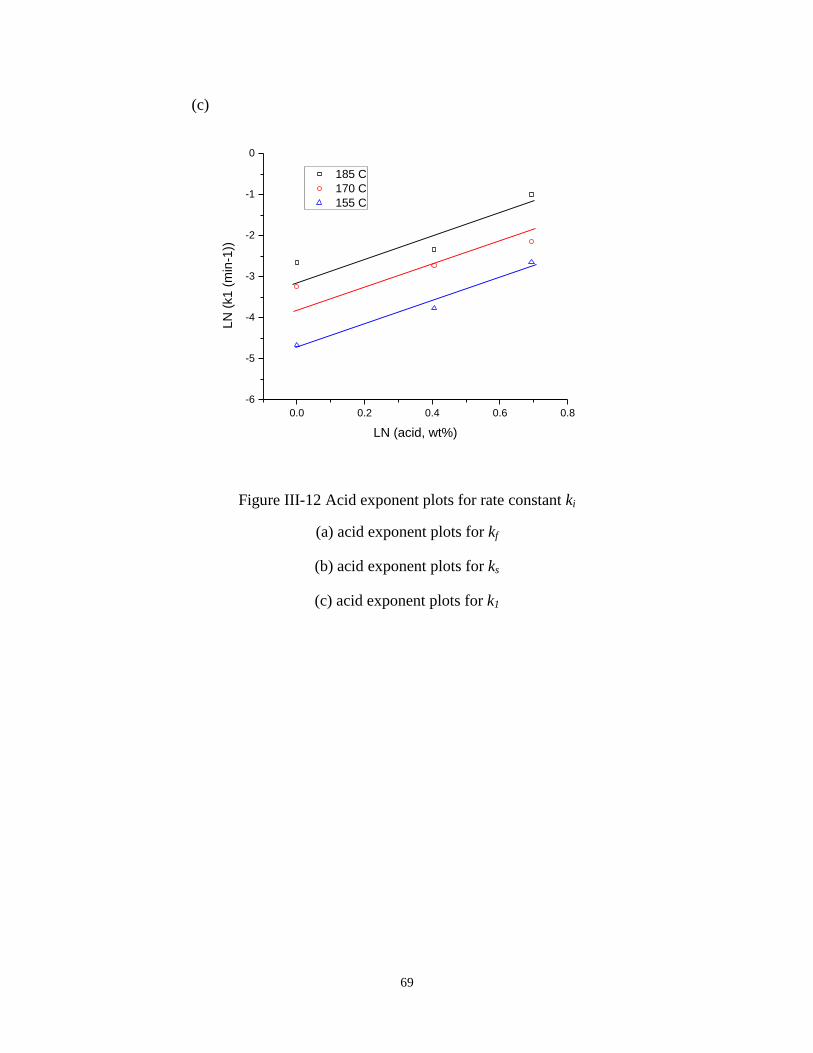
69
(c)
0.0 0.2 0.4 0.6 0.8
-6
-5
-4
-3
-2
-1
0
185 C
170 C
155 C
LN
(k1
(m
in-1
))
LN (acid, wt%)
Figure III-12 Acid exponent plots for rate constant ki
(a) acid exponent plots for kf
(b) acid exponent plots for ks
(c) acid exponent plots for k1
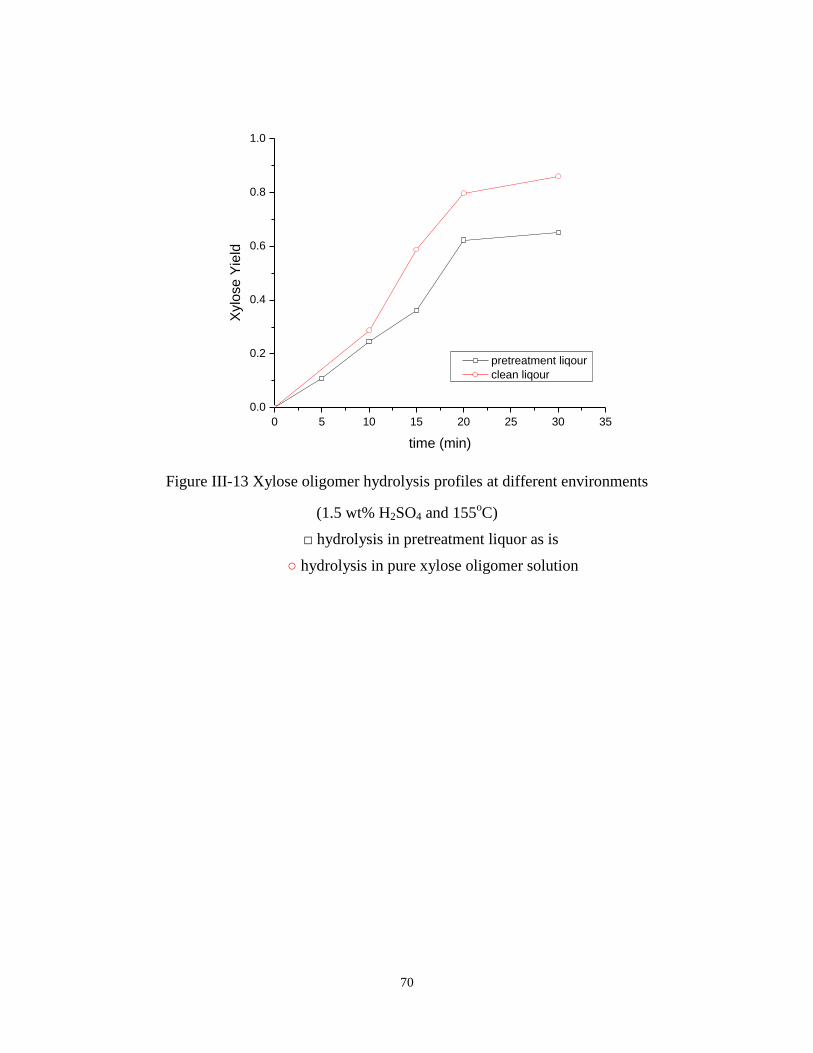
70
0 5 10 15 20 25 30 35
0.0
0.2
0.4
0.6
0.8
1.0
Xylo
se
Yie
ld
time (min)
pretreatment liqour
clean liqour
Figure III-13 Xylose oligomer hydrolysis profiles at different environments
(1.5 wt% H2SO4 and 155oC)
□ hydrolysis in pretreatment liquor as is
○ hydrolysis in pure xylose oligomer solution

71
0 10 20 30 40 50 60
0.3
0.4
0.5
0.6
0.7
0.8
0.9
1.0
% x
ylo
se
time (min)
w/ lignin
w/o lignin
Figure III-14 Xylose degradation profiles at different environments
(1.5 wt% H2SO4 and 155oC)
□ degradation with external lignin
○ degradation w/o addition of lignin

72
Figure III-15 Schematic structures of lignin and LCC

73
Figure III-16 FTIR spectra of LCC sample
3300 OH stretch Various Socrates, 1994
polysaccharides
alcohols
1732, 1742 Ester Various Stewart, 1995
carbonyls polysaccharides
1705-1720 Carbonyl/carboxyl Lignin Boeriu et al., 2004
stretch
1514, 1595 Aromatic Skeletal Lignin Boeriu et al., 2004;
Vibration and CH Owen & Thomas,
deformation 1989
1215-1220 C-C,C-O,C=O Lignin Boeriu et al., 2004
(combination)
1041, 1047 Kacurakova et al.,
Xylan 1994, 1998
800-1000 Tul’chinsky
Glucose et al.,1976
& mannose

74
Figure III-17 NMR spectra of LCC sample
Lignin Carbohydrat
e

75
0 5 10 15 20 25
0
10
20
30
40
50
conventional method
revised method
model fitted
xylo
se
olig
om
er
%
time (min)
Figure III-18 Modified oligomer calculation
(185oC & 2 wt% H2SO4)
□ Oligomer value measured using eqn. (6)
∆ Oligomer value measured using eqn. (28)
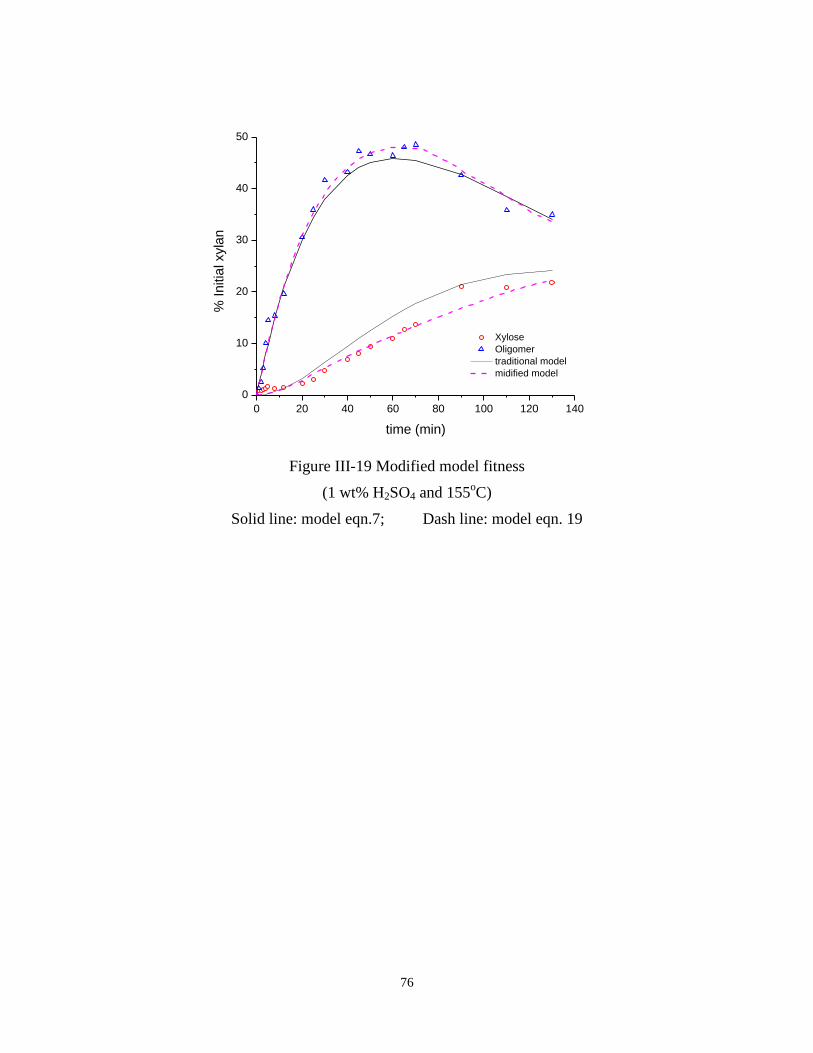
76
0 20 40 60 80 100 120 140
0
10
20
30
40
50
Xylose
Oligomer
traditional model
midified model
% I
nitia
l xyla
n
time (min)
Figure III-19 Modified model fitness
(1 wt% H2SO4 and 155oC)
Solid line: model eqn.7; Dash line: model eqn. 19

77
IV. Incorporation of residence time distribution in the modeling of NREL
screw-driven continuous pretreatment reactor
IV.1 Abstract
In the actual design and operation of the NREL screw-driven reactor, a number of
technical problems surfaced in the pilot scale testing of the prehydrolysis process. The technical
problems stem from several unique features of the process. The process is relatively fast, which
results in short residence time in the reactor. The reaction is heterogeneous in that the catalyst is
penetrating into the solid reactant. It is carried out in a moving-bed reactor under high-solid and
low-water conditions.
The residence time distribution (RTD) tests were performed to obtain the RTD data. The
RTD data were then incorporated with the pre-determined kinetic parameters to compare the
xylose yield from NREL reactor and an ideal PFR. The flow pattern of NREL screw-driven
continuous reactor is proven be close to that of a PFR by the RTD test, especially when
continuous flight and low RPM were applied. The dimensionless variance at this operation
condition is 0.045 compared to the theoretical value of 0 for PFR. The reduction in xylose yield
due to non-ideal flow in the NREL reactor is 1-3 %.

78
IV.2 Introduction
Of the many pretreatment technologies, dilute acid pretreatment is preferred since it has
been explored extensively in numerous studies and proven to be more scalable than other
pretreatment methods (Eggeman & Elander, 2005; Sun & Cheng, 2005; Moiser et al., 2005). The
most logical choice for commercial-scale biomass pretreatment reactor is that of a moving-bed
(screw-driven) continuous type. This type of reactor has a flow-through design, meaning that the
solid and liquid travel through the reactor at the same velocity. The pretreatment reaction
proceeds as the reagents travel through the reactor. The flow pattern of a screw-driven
continuous reactor resembles that of a plug flow reactor (PFR). A continuous screw-driven
reactor process is capable of providing a unique and continuously stirred thermo-chemical
reactor environment in combination with thermo mechanical-energy and dilute acid. This type of
reactor can provide high shear, rapid heat transfer, effective pulverization, and adaptability to
many different processes.
Thompson and Grethlein (1979) conducted a cellulose kinetic study on various biomasses
using a PFR system. This system had a tubular reactor, and biomass slurry was pumped through
by an external positive displacement pump. An electrical preheater was used for temperature
control. The reaction was initiated by the injection of acid at the entrance of the reactor. The
residence time was less than 1 minute. The pretreatment conditions covered in this study were
0.5–2.0% sulfuric acid at 200–240oC. They achieved 50% glucose yield, a significant
improvement from the typical results of a batch reactor. Another example of the application of
PFR is from New York University (Rugg, & Stanton, 1982). A twin-screw extruder was used in
this study. The reaction conditions were similar to those in the Thompson and Grethlein study. A
number of process studies were done using this type of reactor (Green et al., 1988; Rugg &
79
Brenner, 1982; Rugg et al., 1981). Glucose yields of 50–60% were obtained under similar
conditions (232oC, 10-20 s). In order to retain high sugar concentration in the products, it was
necessary to use a dense, low water feed into the reactor. Rugg et al. (1981) contend that their
twin-screw extruder reactor can accommodate solid feeds with a wide range of solid/liquid ratio
(10% for waste paper pulp, 95 % for sawdust). The continuous screw-driven reactor in NREL
was used for dilute acid pretreatment of corn stover in this study. Conditions were relatively mild
with sulfuric acid loading near 0.6% and temperature at 155oC.
The flow pattern of the continuous screw-driven reactor, although similar to that of a PFR,
has not been investigated. It is noted, however, that deviation of the flow pattern from a PFR
negatively affects the reactor performance. The RTD is commonly used to assess the effects of
non-ideal flow in a pretreatment reactor (Janssen et al., 1979; Bounie, 1988; Oberlehner et al.,
1994; Puaux et al., 2000). RTD can be used to characterize the mixing and flow within reactors
and to compare the behavior of real reactors to ideal models. This is useful, not only for
troubleshooting existing reactors, but also for estimating the yield of a given reaction and
designing for future reactors. The characteristics of the RTD are defined using several functions
and moments. The distribution of residence time is represented by an exit age distribution
function E(t), which is defined as (𝑡) =𝐶(𝑡)
∫ 𝐶(𝑡)𝑑𝑡∞0
. The average residence time 𝑡̅ is called first
moment, which is defined as 𝑡̅ = ∫ 𝑡 ∙ 𝐸(𝑡)𝑑𝑡∞
0. The variance of the distribution 𝜎2
is called the
second moment about the mean, which is defined as 𝜎2 = ∫ (𝑡 − 𝑡̅)2 ∙ 𝐸(𝑡)𝑑𝑡∞
0.
Residence time distributions are measured by introducing a non-reactive tracer into the
system at the inlet. The concentration of the tracer is changed according to a known function and
the response is found by measuring the concentration of the tracer at the outlet. Experimental
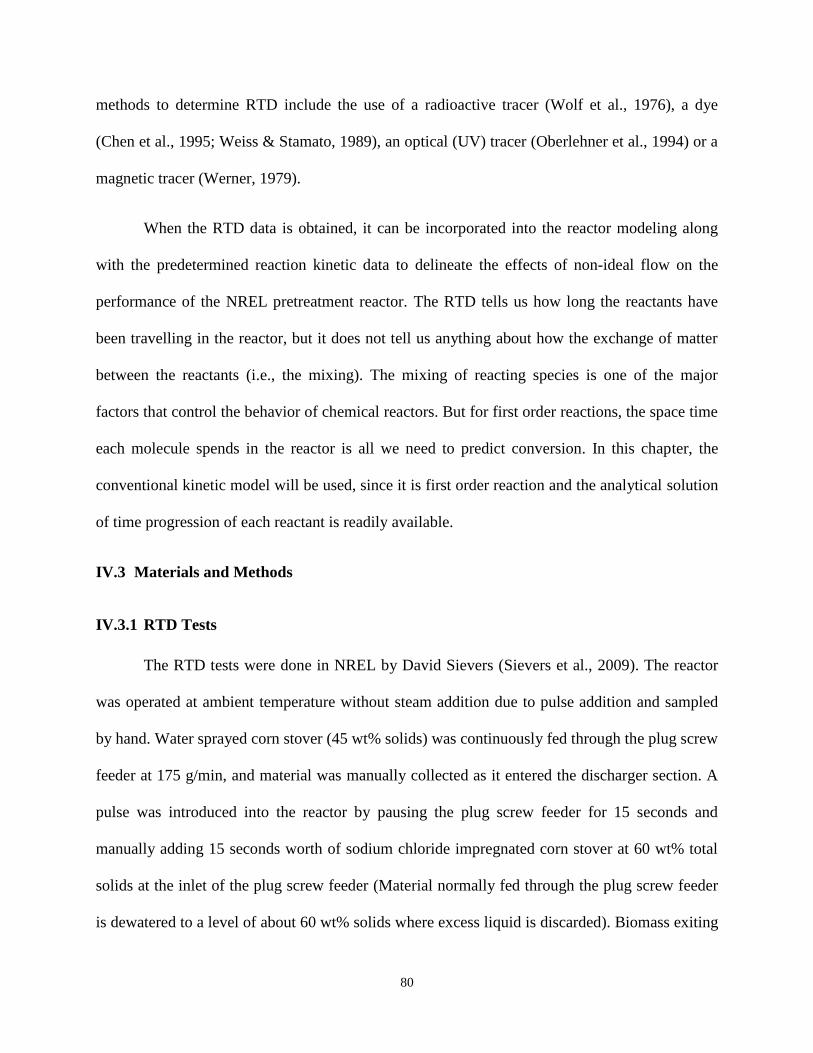
80
methods to determine RTD include the use of a radioactive tracer (Wolf et al., 1976), a dye
(Chen et al., 1995; Weiss & Stamato, 1989), an optical (UV) tracer (Oberlehner et al., 1994) or a
magnetic tracer (Werner, 1979).
When the RTD data is obtained, it can be incorporated into the reactor modeling along
with the predetermined reaction kinetic data to delineate the effects of non-ideal flow on the
performance of the NREL pretreatment reactor. The RTD tells us how long the reactants have
been travelling in the reactor, but it does not tell us anything about how the exchange of matter
between the reactants (i.e., the mixing). The mixing of reacting species is one of the major
factors that control the behavior of chemical reactors. But for first order reactions, the space time
each molecule spends in the reactor is all we need to predict conversion. In this chapter, the
conventional kinetic model will be used, since it is first order reaction and the analytical solution
of time progression of each reactant is readily available.
IV.3 Materials and Methods
IV.3.1 RTD Tests
The RTD tests were done in NREL by David Sievers (Sievers et al., 2009). The reactor
was operated at ambient temperature without steam addition due to pulse addition and sampled
by hand. Water sprayed corn stover (45 wt% solids) was continuously fed through the plug screw
feeder at 175 g/min, and material was manually collected as it entered the discharger section. A
pulse was introduced into the reactor by pausing the plug screw feeder for 15 seconds and
manually adding 15 seconds worth of sodium chloride impregnated corn stover at 60 wt% total
solids at the inlet of the plug screw feeder (Material normally fed through the plug screw feeder
is dewatered to a level of about 60 wt% solids where excess liquid is discarded). Biomass exiting
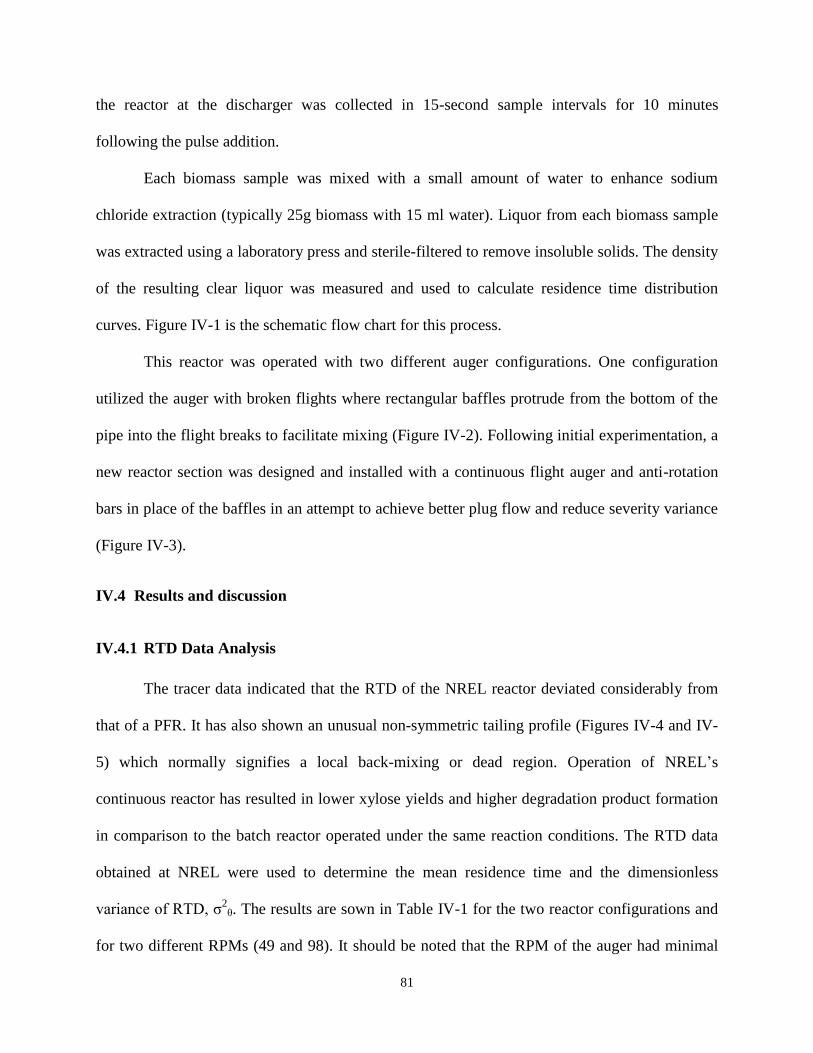
81
the reactor at the discharger was collected in 15-second sample intervals for 10 minutes
following the pulse addition.
Each biomass sample was mixed with a small amount of water to enhance sodium
chloride extraction (typically 25g biomass with 15 ml water). Liquor from each biomass sample
was extracted using a laboratory press and sterile-filtered to remove insoluble solids. The density
of the resulting clear liquor was measured and used to calculate residence time distribution
curves. Figure IV-1 is the schematic flow chart for this process.
This reactor was operated with two different auger configurations. One configuration
utilized the auger with broken flights where rectangular baffles protrude from the bottom of the
pipe into the flight breaks to facilitate mixing (Figure IV-2). Following initial experimentation, a
new reactor section was designed and installed with a continuous flight auger and anti-rotation
bars in place of the baffles in an attempt to achieve better plug flow and reduce severity variance
(Figure IV-3).
IV.4 Results and discussion
IV.4.1 RTD Data Analysis
The tracer data indicated that the RTD of the NREL reactor deviated considerably from
that of a PFR. It has also shown an unusual non-symmetric tailing profile (Figures IV-4 and IV-
5) which normally signifies a local back-mixing or dead region. Operation of NREL’s
continuous reactor has resulted in lower xylose yields and higher degradation product formation
in comparison to the batch reactor operated under the same reaction conditions. The RTD data
obtained at NREL were used to determine the mean residence time and the dimensionless
variance of RTD, σ2
θ. The results are sown in Table IV-1 for the two reactor configurations and
for two different RPMs (49 and 98). It should be noted that the RPM of the auger had minimal

82
impact on the mean residence time for both configurations. Doubling the RPM reduced the
residence time only by 0.7% for the broken flight reactor and by 5% for the continuous flight
reactor.
Intuitively, one would expect the residence time to be inversely proportional to the RPM.
It certainly was not the case here. At his time, we have not developed a clear explanation for this
phenomenon. It may have something to do with the clogging of the reactor and the fact that the
shrinkage or softening of the biomass particles occurs at the extent of it changes with reaction
time. The RPM had minimal impact on dimensionless variance for the broken flight reactor; with
49 RPM corresponding to 0.170 and 98 RPM corresponding to 0.184. On the other hand, the
RPM effect was significant for the continuous flight reactor; 49 RPM corresponding to 0.045 and
98 RPM corresponding to 0.147. Between the two reactors, the broken flight reactor exhibited
the higher variance indicating a higher degree of back-mixing. Based on the theoretical extremes
of σ2
θ, 0 for PFR and 1.0 for CSTR, the mixing pattern of the NREL reactor more closely
resembles a PFR.
IV.4.2 Assess the Performance of NREL Reactor Using RTD Data
The batch kinetic model and the data previously obtained in Chapter III were used to
delineate the effect of non-ideal flow of the pretreatment reactor. The xylose production from
KCS based on the theoretical calculation of a PFR and that of the NREL reactor were compared
to see the effect of non-ideal flow.
For PFR, the xylose concentration based upon our previously reported kinetic model with
respect to time is:
𝑋1(𝑡) = 𝐹𝑓∗ 𝑋0∗𝑘𝑓∗𝑘1
(𝑘1−𝑘𝑓)(𝑘2−𝑘𝑓)(𝑒−𝑘𝑓∗𝑡 − 𝑒−𝑘2∗𝑡) +
𝐹𝑠∗ 𝑋0∗𝑘𝑠∗𝑘1
(𝑘1−𝑘𝑠)(𝑘2−𝑘𝑠)(𝑒−𝑘𝑓∗𝑡 − 𝑒−𝑘2∗𝑡)

83
−(𝑘1
𝑘2−𝑘1) (
𝐹𝑓∗ 𝑋0∗𝑘𝑓
𝑘1−𝑘𝑓+𝐹𝑠∗ 𝑋0∗𝑘𝑠
𝑘1−𝑘𝑠) ( 𝑒−𝑘1∗𝑡 − 𝑒−𝑘2∗𝑡) (IV- 1)
The overall xylose concentration (X2) was then computed by integration of the point-wise
xylose concentration of eqn. (IV-1) over the time span of the experimental RTD:
𝑋2(𝑡) = ∫ 𝑋1(𝑡) ∗ 𝐸(𝑡)𝑑𝑡𝑡
0 (IV-2)
Table IV-2 shows the comparison of xylose concentrations from the two cases (PFR and
NREL reactor) and the corresponding xylose yields. The results indicate that the reduction in
xylose yield due to non-ideal flow in the NREL reactor is 2-3 % for the broken flight reactor and
only 1-2% for the continuous reactor. Despite a noticeable degree in deviation of RTD from PFR
for the two NREL reactor configurations, the reduction of yield is significant only for the broken
flight reactor, and even so, it is less than 5%.
IV.5 Conclusion
The flow pattern of NREL screw-driven continuous reactor is proven be close to that of a
PFR by the RTD test, especially when continuous flight and low RPM were applied. The
dimensionless variance at this operation condition is 0.045 compared to the theoretical value of 0
for PFR. The reduction in xylose yield due to non-ideal flow in the NREL reactor is 2-3 % for
the broken flight reactor and only 1-2% for the continuous reactor.

84
Figure IV-1 RTD test flow chart
Outlet screw
feeder Auger Pipe
Discharger
NaCl sprayed
Biomass
Water sprayed
Biomass
Plug
screw
Inlet screw
feeder
Pulse @ t=0
Sample
collection
Extract liquor
from solids
with lab press
Slurry 25g with
15ml water to
extract NaCl
Sterile filter
liquor to
remove
Measure liquor density
to determine relative
NaCl content at each
time interval

85
Figure IV-2 Broken Flight Auger Reactor with Baffles
Figure IV-3 Continuous Flight Auger Reactor with Anti-Rotation Bars
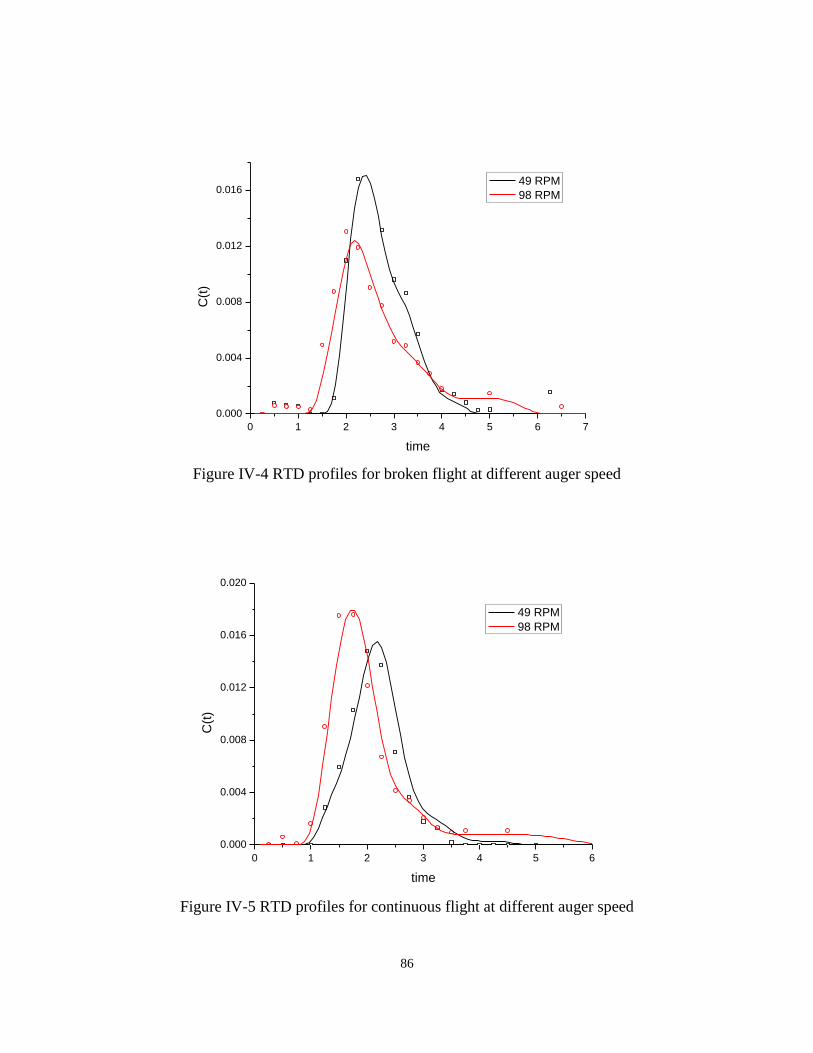
86
0 1 2 3 4 5 6 7
0.000
0.004
0.008
0.012
0.016 49 RPM
98 RPMC
(t)
time
Figure IV-4 RTD profiles for broken flight at different auger speed
0 1 2 3 4 5 6
0.000
0.004
0.008
0.012
0.016
0.020
49 RPM
98 RPM
C(t
)
time
Figure IV-5 RTD profiles for continuous flight at different auger speed

87
Table IV-1 RTD data for the NREL reactor operated with two different RPM
Mean Residence Time (min)
Auger Speed Broken Flight Continuous Flight 49 rpm 2.73 2.09 98 rpm 2.75 1.99
Dimensionless Variance of RTD, σ2θ
Auger Speed Broken Flight Continuous Flight 49 rpm 0.170 0.045 98 rpm 0.184 0.147

88
Table IV-2 Xylose production comparison between NREL reactor and PFR
(185oC, 2 wt% acid, time equals to mean residence time)
Conditions Broken Flight @ 49 rpm
Broken Flight @ 98 rpm
Continuous Flight @ 49 rpm
Continuous Flight @ 98 rpm
Xylose from NREL Reactor (g/L)
41.20 42.03 34.69 31.98
Xylose from PFR (g/L)
44.82 45.09 35.33 33.63
Monomeric Xylose Yield from NREL Reactor*
0.343 0.350 0.289 0.267
Monomeric Xylose Yield from PFR
0.374 0.376 0.294 0.280
Total Xylose Yield from NREL Reactor** 0.716 0.728 0.721 0.706
Total Xylose Yield from PFR
0.747 0.747 0.732 0.725
* monomeric xylose yield = 𝑚𝑜𝑛𝑜𝑚𝑒𝑟 𝑥𝑦𝑙𝑜𝑠𝑒 𝑖𝑛 𝑝𝑟𝑒ℎ𝑦𝑑𝑟𝑜𝑙𝑦𝑠𝑎𝑡𝑒
𝑖𝑛𝑖𝑡𝑖𝑎𝑙 𝑥𝑦𝑙𝑎𝑛 (𝑥𝑦𝑙𝑜𝑠𝑒 𝑒𝑞𝑢𝑖𝑣𝑎𝑙𝑒𝑛𝑡)
** total xylose yield = 𝑚𝑜𝑛𝑜𝑚𝑒𝑟+𝑜𝑙𝑖𝑔𝑜𝑚𝑒𝑟 𝑥𝑦𝑙𝑜𝑠𝑒 𝑖𝑛 𝑝𝑟𝑒ℎ𝑦𝑑𝑟𝑜𝑙𝑦𝑠𝑎𝑡𝑒
𝑖𝑛𝑖𝑡𝑖𝑎𝑙 𝑥𝑦𝑙𝑎𝑛 (𝑥𝑦𝑙𝑜𝑠𝑒 𝑒𝑞𝑢𝑖𝑣𝑎𝑙𝑒𝑛𝑡)

89
V. Secondary Hydrolysis of Pretreatment Liquor Obtained from
Continuous High-Solids Dilute-Acid Pretreatment of Corn Stover
V.1 Abstract
The prehydrolysate produced from NREL continuous pretreatment reactor contains high
levels of hemicellulose sugars, with concentrations surpassing 10 wt%. On the other hand, the
short residence time and high solid condition limits the hydrolysis of hemicellulose. The
prehydrolysate obtained from this reactor thus contains relatively high amounts of xylose
oligomers, typically in the range of 10-40% of the total sugar. In order to fully utilize the sugars
in the prehydrolysate, oligomers need to be hydrolyzed to monomers. Dilute acid post hydrolysis
experiments were carried out to find the best conditions for post hydrolysis. The objective is to
hydrolyze all the xylose oligomers with minimal xylose degradation. At optimal conditions, total
xylose recovery is around 95% for all prehydrolysate samples. The degradation is minimal. The
dilute acid post hydrolysis was compared with enzymatic hydrolysis. It is found that the dilute
acid post hydrolysis gives higher yield with much shorter reaction time.

90
V.2 Introduction
During dilute acid pretreatment, the major reactions are:
1) Oligomers with varying degrees of polymerization are produced by random attacks of
acid on the hemicellulose chains,
2) Sugars are further degraded to form monosaccharides and sugar decomposition
products such as furfural and HMF,
3) Acetic acid is produced by the cleavage of acetyl groups in biomass, which makes the
pH decrease during the prehydrolysis.
So the prehydrolysate contains both mono- and oligo-sugars along with lignin, acetic acid,
and some degradation products. The ratio of monomers to oligomers in the prehydrolysate
depends on the severity of the pretreatment. The monomeric sugar yield is mostly affected by
acid concentration, while for formation of sugar degradation products, such as furfural is
impacted most by temperature (Roberto et al., 2003; Neureiter et al., 2002). Milder conditions
cause less sugar degradation resulting in enhanced hemicellulose recovery. Actually, the partial
hydrolysis of hemicellulose can enable a reduction both on energy requirements and on the
formation of many relevant sugar degradation compounds, particularly, HMF and furfural.
Oligosaccharides, and particularly xylose-oligosaccharides produced from herbaceous
and hardwood feedstock, may have a high added value as marketable products for application in
the food, pharmaceutical, and cosmetic industries as specialty chemicals (Nabarlatz et al., 2007;
Moure et al., 2006). As these applications are rather restricted in volume, hydrolysis of
hemicellulosic oligosaccharides into monomers is almost a compulsory requirement for it to be
effectively utilized in the bioconversion process.

91
A post treatment, secondary hydrolysis, is therefore necessary. The post hydrolysis
process has been applied to pretreatment hydrolysate obtained from all types of materials:
softwood (Shevchenko et al., 2000; Bossaid et al., 2001); hardwood (Garrote et al., 2001a); and
herbaceous (Saska & Ozer, 1995; Allen et al., 1996; Duarte et al., 2004; Garrote et al., 2001b;
Duarte et al., 2009) catalyzed by H2SO4 (conc. from 0.5% to 6.5% w/w) at 100-135oC and
reaction time up to 10h (Saska & Ozer, 1995; Shevchenko et al., 2000; Duarte et al., 2004;
Garrote et al., 2001a; Garrote et al., 2001b). The post hydrolysis options can be reduced to acid
(Saska & Ozer, 1995; Allen et al., 1996; Shevchenko et al., 2000; Duarte et al., 2004; Garrote et
al., 2001c; Duarte et al., 2009) or enzyme (Duarte et al., 2004; Vazquez et al., 2001; Walch et al.,
1992) catalyzed hydrolysis.
Acid hydrolysis typically presents both higher yield and productivity when compared to
the enzymatic hydrolysis processes. Furthermore, as much of the hemicellulose complex
structure is still present in the oligosaccharides (Carvalheiro et al., 2004; Kabel et al., 2002),
several enzymatic activities are usually required for the complete hydrolysis (e.g., for hardwood
type materials: endoxylanase, exoxylanase, β-xylosidase and accessory activities like acetyl
xylanesterase, α-glucuronidase, α-arabinofuranosidase, and feruloyl esterase). As a result, the
process is potentially inefficient and uneconomical. Under fully optimized conditions, sugar
recovery is around 100% (Saska & Ozer, 1995; Shevchenko et al., 2000; Duarte et al., 2004;
Garrote et al., 2001a; Garrote et al., 2001b; Duarte et al., 2009), as compared to standard dilute
acid hydrolysis (121ºC, 4% H2SO4 and 60 min). This can be considered a major advantage of the
acid post hydrolysis process. Other advantages associated to this process are its high-speed and
low catalyst cost.

92
If the conditions are not carefully chosen, however, significant monosaccharide
degradation reactions may occur during acid post hydrolysis. Therefore, to obtain a high
monosaccharide recovery, an optimization of the operational conditions is required.

93
V.3 Materials and Methods
V.3.1 Materials
Pretreatment hydrolysate samples were provided by NREL. The pretreatment conditions
are listed in Table V-1. The details about the sugar content of these samples are shown in Figure
V-1.
V.3.2 Dilute acid hydrolysis Reaction
Reactions were carried out in acid-resistant Nickel-Copper tubular reactors (3/8’’x 4’’)
capped with SS-316 Yor-Lok end fittings. The reactors were filled with 2.0 ml pretreatment
liquor. To initiate the reaction, the reactors were placed into a forced-air convention oven in
which the temperature was adjusted to a level 100oC higher than the desired point. Reactor
temperature was monitored by a thermocouple that extends to the center of the reactor. After the
temperature reached the desired point (which normally takes up to 1 minute), the oven
temperature was manually decreased to the desired temperature. The two-step procedure was
done to minimize the preheating time. After being subjected to specified reaction times, the
reactors were quenched in a cold water bath, and the contents were collected. Because the total
sugar concentration in the hydrolysate was too high to be accurately measured by the HPLC
system, the liquors were diluted before being subjected to the sugar content analysis.
V.3.3 Enzymatic hydrolysis Reaction
Various enzymes were used in the enzymatic hydrolysis test, which include: Spezyme CP
(Lot No. 301-00348-257, 59 FPU/ml, 123mg protein/ml), Xylanase (Multifect Xylanase, Lot No.
301-04021-015, 42 mg protein/ml), Pectinase (Multifect Pectinase FE, Lot No. A21-03356-001,
82 mg protein/ml) and β-glucosidase (Novozyme 188, Cat. No. C6150, 655 CBU/ml, 140 mg

94
protein/ml). The enzyme loading was is 20 mg protein/gram of xylose-oligomer. And the
temperature is set to be 50oC.
V.3.4 HPLC Analysis
Sugar analysis for hydrolysate samples were performed according to the NREL TP 510-
42623 using HPLC equipped with Bio-Rad’s Aminex HPX-87P, Aminex HPX-87H column and
a RI detector. The difference of xylose monomer values before and after 121oC incubation was
interpreted as the xylose oligomer value.
V.4 Results and discussion
V.4.1 Secondary Dilute Acid Hydrolysis Reactions
For each of the liquor samples, 2–4 levels of temperatures, and 3 levels of acid
concentrations (0%, 50% and 100% additional acid input (AAI)) were applied. The experiments
were designed to find the optimal condition to convert xylose oligomer to monomer with
minimum degradation.
The results of the hydrolysis are presented in Figure V-2 to Figure V-10. The hydrolysis
yield is defined as the yield of xylose oligomer to monomer, and the overall yield is total xylose
after hydrolysis over total initial total xylose (initial xylose monomers plus oligomers).
The optimum hydrolysis conditions for each sample are listed in Table V-2. For sample
A, the optimum condition is 140oC with 100% AAI (final acid concentration is 2.48 wt%) at 8
minutes and the highest hydrolysis and overall yield is 89% and 94% respectively. The xylose
degradation during the secondary hydrolysis is 4% at this point. The optimum hydrolysis
condition for sample B is 140oC with 0% AAI (final acid concentration is 1.99 wt%) at 20
minutes and the highest hydrolysis and overall yield is 44% and 95% respectively. The xylose

95
degradation during the secondary hydrolysis is 0.3% at this point. The optimum hydrolysis
condition for sample C is 120oC with 0% AAI (final acid concentration is 2.25 wt%) at 19
minutes and the highest hydrolysis and overall yield is 64% and 96% respectively. The xylose
degradation during the secondary hydrolysis is 1.1% at this point. Since the initial acid content in
sample B and C are high, and the xylose oligomer level is relative low, additional acid are not
required for Sample B and C for secondary hydrolysis.
As we can see from the experimental results, at the optimal condition, secondary
hydrolysis leads to 95% xylose yield. It appears that the xylose oligomers left in the pretreatment
hydrolysate are a resilient fraction. We observed variations in oligomers with concentrations
increasing and decreasing throughout the experiment (Figure V-11). This is perhaps an
indication that oligomers exist in complex form with other organic components such as lignin to
form a lignin-carbohydrate-complex (LCC).
V.4.2 Enzymatic Hydrolysis Reactions
We also attempted enzymatic hydrolysis of the oligomers in the prehydrolysate. The
purpose of this study was to see if the mixture of the prehydrolysate and treated solid could be
hydrolyzed simultaneously in a single step, simulating the conditions of SSCF. Sample A was
chosen for this test because it contains the highest oligomer concentration. Spezyme CP was
used for this experiment (Lot No. 301-00348-257, 59 FPU/ml, 123mg protein/ml). The enzyme
loading was 20 mg protein/gram of xylose oligomer. Figure V-12 shows the enzymatic
hydrolysis profile. With cellulase alone (Spezyme CP), a hydrolysis yield of 42% was achieved
after 48 hr. This is far below the acceptable range. This indicates that with normal hydrolysis
practice using cellulase alone will not hydrolyze the oligomers effectively. Acid treatment or
some other means of secondary hydrolysis is therefore necessary. So, some more commercial

96
enzymes were then tested: Xylanase (Multifect Xylanase, Lot No. 301-04021-015, 42 mg
protein/ml), Pectinase (Multifect Pectinase FE, Lot No. A21-03356-001, 82 mg protein/ml) and
β-glucosidase (Novozyme 188, Cat. No. C6150, 655 CBU/ml, 140 mg protein/ml). The enzyme
loadings were uniform at 20 mg/gram of xylose oligomer. As shown in Figure V-12, the best
performance was obtained with Multifect Pectinase, where the 48h hydrolysis yield was 81%. It
is surprising that this yield is higher than that of Multifect Xylanase (59%).
Enzymatic hydrolysis gives a much lower xylose yield (81%) compared to acid
hydrolysis (95%). Also, enzymatic hydrolysis requires much longer reaction times (48h vs 20
min). From an economic point of view, acid is a better option for post hydrolysis.
V.5 Conclusion
The total sugars present in the prehydrolysate from NREL continuous reactors are high
enough for fermentation. Due to the high solid loading and short residence time, high amount of
hemicellulose are still in oligomer form. In order to recover the hemicellulose from
prehydrolysate, secondary hydrolysis is a necessary step. At optimal conditions, xylose recovery
is around 95% for all three samples used in our study. Xylose monomer/oligomer is reacting with
soluble lignin leading to the formation of LCC during the acid hydrolysis process. This leads to
recovery less than 100%. Compared to enzymatic hydrolysis, acid hydrolysis is a better option
for post hydrolysis of prehydrolysate. Acid hydrolysis produces higher yield and requires shorter
reaction time, all at a lower cost.

97
Table V-1 Pretreatment conditions for hydrolysate samples
Sample Name Stage 1 Conditions Stage 2 Conditions
T SA t SC T SA t TSA SC
XT090403-B (A) 155 0.5wt% 1.5 - - - - - -
XT091017 (B) 158 1.0wt% 4.5 - 130 7.5 20 - -
XT090731-C (C) 155 16.8 5 0.28 130 7.6 20 24.5 0.28
Abbreviations used: T = temperature (oC), SA = biomass sulfuric acid loading (mg H2SO4/g dry biomass),
t = time (minutes), SC = total solids concentration (mass solids/overall mass) measured in pretreated
slurry, TSA = total sulfuric acid loading (mg H2SO4/g dry biomass).

98
Table V-2 Optimum post hydrolysis condition for pre-hydrolysate samples
AAI (%)
Final Acid
(wt%)
T (oC)
T (min)
Hydrolysis Yield* (%)
Overall Yield***
(%)
Residual Oligomers
(%)
Degradation*** (%)
Sample A 100 2.48 140 8 89 93.6 2.4 4 Sample B 0 1.99 140 20 44 94.8 4.9 0.3 Sample C 0 2.25 120 19 64 96.3 2.6 1.1
* hydrolysis yield = 𝑥𝑦𝑙𝑜𝑠𝑒_𝑝𝑟𝑜𝑑𝑢𝑐𝑒𝑑_𝑓𝑟𝑜𝑚_𝑜𝑙𝑖𝑔𝑜𝑚𝑒𝑟
𝑡𝑜𝑡𝑎𝑙_𝑥𝑦𝑙𝑜𝑠𝑒_𝑜𝑙𝑖𝑔𝑜𝑚𝑒𝑟
** overall yield = 𝑚𝑜𝑛𝑜𝑚𝑒𝑟𝑖𝑐_𝑥𝑦𝑙𝑜𝑠𝑒_𝑎𝑓𝑡𝑒𝑟_2𝑛𝑑_ℎ𝑦𝑑𝑟𝑜𝑙𝑦𝑠𝑖𝑠
𝑖𝑛𝑖𝑡𝑖𝑎𝑙_𝑡𝑜𝑡𝑎𝑙_𝑥𝑦𝑙𝑜𝑠𝑒
*** degradation = 𝑖𝑛𝑖𝑡𝑖𝑎𝑙 𝑡𝑜𝑡𝑎𝑙 𝑥𝑦𝑙𝑜𝑠𝑒 − 𝑚𝑜𝑛𝑜𝑚𝑒𝑟𝑖𝑐 𝑥𝑦𝑙𝑜𝑠𝑒 𝑎𝑓𝑡𝑒𝑟 2𝑛𝑑 ℎ𝑦𝑑𝑟𝑜𝑙𝑦𝑠𝑖𝑠−𝑟𝑒𝑠𝑖𝑑𝑢𝑎𝑙 𝑜𝑙𝑖𝑔𝑜𝑚𝑒𝑟
𝑖𝑛𝑖𝑡𝑖𝑎𝑙 𝑡𝑜𝑡𝑎𝑙 𝑥𝑦𝑙𝑜𝑠𝑒

99
(a)
(b)

100
(c)
Figure V-1 Sugar content in pre-hydrolysate samples
(a) sample A, acid level in liquor: [H+]=0.254 mol/L (1.24 wt% H2SO4)
(b) sample B, acid level in liquor: [H+]=0.406 mol/L (1.99 wt% H2SO4)
(c) sample C, acid level in liquor: [H+]=0.460 mol/L (2.25 wt% H2SO4)

101
(a)
0 10 20 30 40 50 60 70 80
0
10
20
30
40
50
60
70
80
time (min)
hydro
lysis
yie
ld (
%)
130C
140C
150C
170C
45
50
55
60
65
70
75
80
85
90
overa
ll yie
ld (
%)
(b)
0 10 20 30 40 50 60 70 80
0
10
20
30
40
50
60
70
80
tota
l xylo
se
(g
/L)
time (min)
130C
140C
150C
170C
Figure V-2 Secondary hydrolysis profiles for sample A with 0% AAI (1.24 wt% H2SO4)
(a) hydrolysis and overall yield of xylose
(b) total xylose decomposition profiles
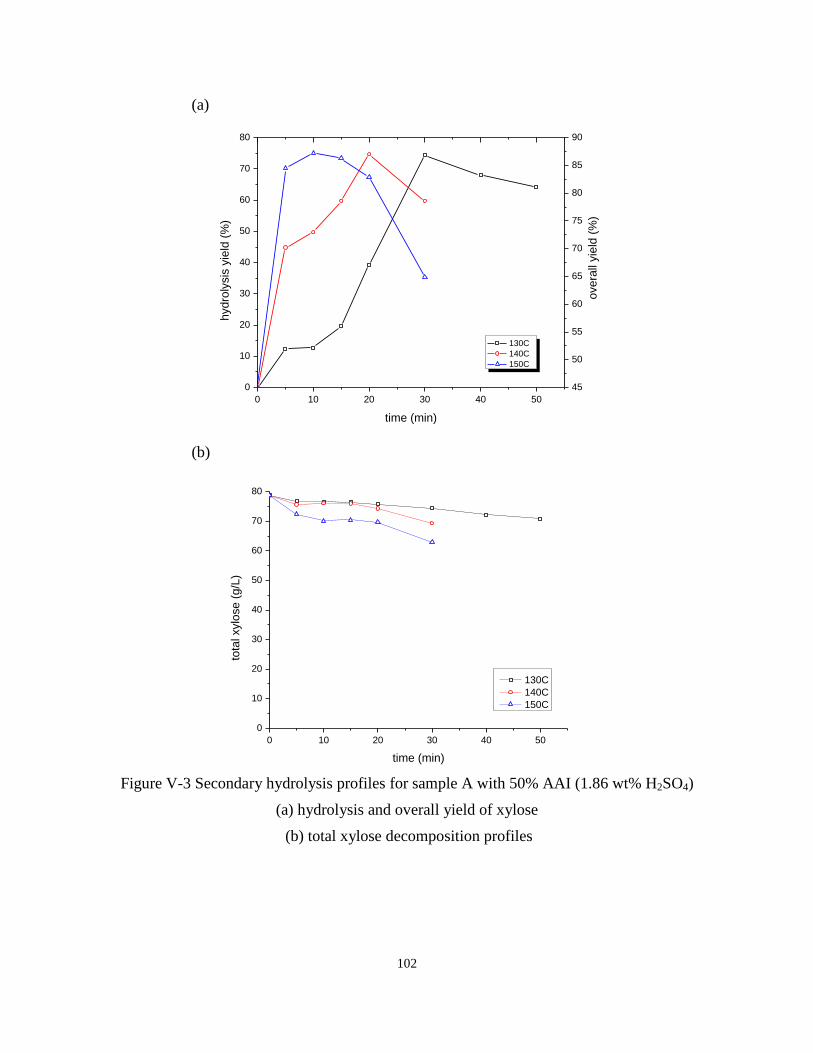
102
(a)
0 10 20 30 40 50
0
10
20
30
40
50
60
70
80
time (min)
hydro
lysis
yie
ld (
%)
130C
140C
150C
45
50
55
60
65
70
75
80
85
90
overa
ll yie
ld (
%)
(b)
0 10 20 30 40 50
0
10
20
30
40
50
60
70
80
tota
l xylo
se
(g
/L)
time (min)
130C
140C
150C
Figure V-3 Secondary hydrolysis profiles for sample A with 50% AAI (1.86 wt% H2SO4)
(a) hydrolysis and overall yield of xylose
(b) total xylose decomposition profiles

103
(a)
0 5 10 15 20 25 30 35 40 45
0
20
40
60
80
100
time (min)
hydro
lysis
yie
ld (
%)
130C
140C 50
60
70
80
90
100
overa
ll yie
ld (
%)
(b)
0 5 10 15 20 25 30 35 40 45
0
10
20
30
40
50
60
70
80
tota
l xylo
se (
g/L
)
time (min)
130C
140C
Figure V-4 Secondary hydrolysis profiles for sample A with 100% AAI (2.48 wt% H2SO4)
(a) hydrolysis and overall yield of xylose
(b) total xylose decomposition profiles

104
(a)
0 10 20 30 40 50 60 70 80 90
-60
-50
-40
-30
-20
-10
0
10
20
30
40
50
time (min)
hydro
lysis
yie
ld (
%)
130C
140C
150C
84
86
88
90
92
94
96
overa
ll yie
ld (
%)
(b)
0 20 40 60 80 100
0
10
20
30
40
50
60
70
80
90
100
tota
l xylo
se (
g/L
)
time (min)
130C
140C
150C
Figure V-5 Secondary hydrolysis profiles for sample B with 0% AAI (1.99 wt% H2SO4)
(a) hydrolysis and overall yield of xylose
(b) total xylose decomposition profiles
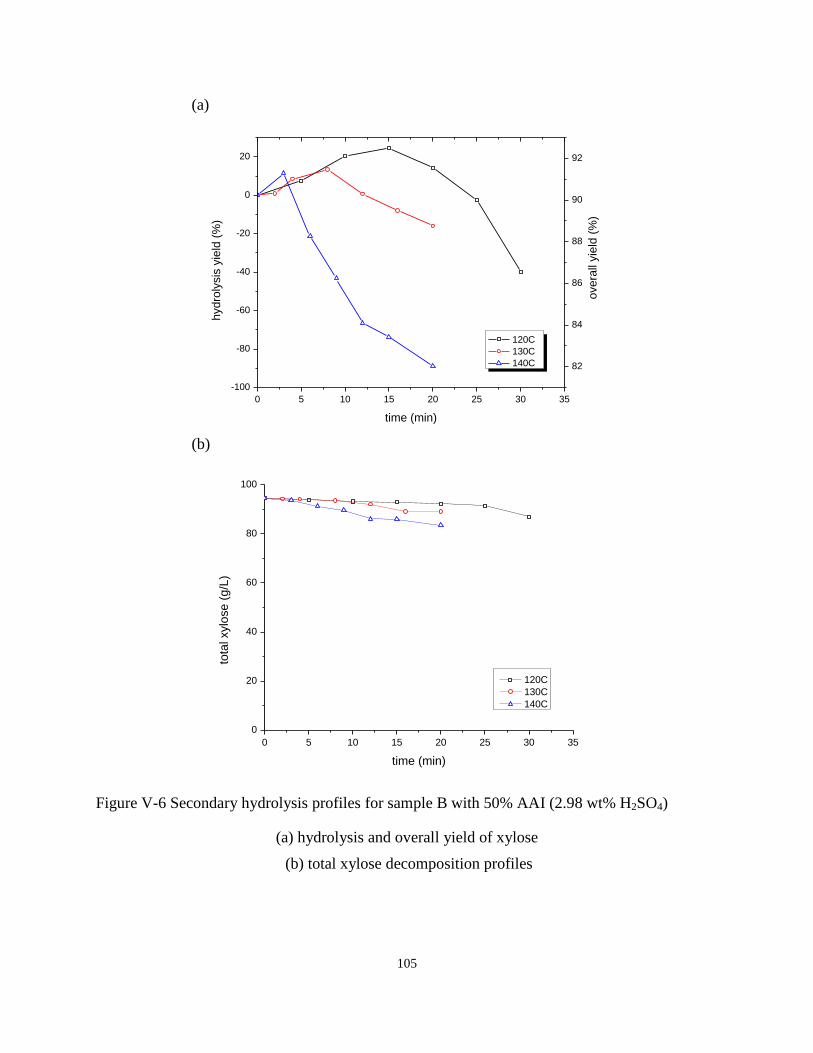
105
(a)
0 5 10 15 20 25 30 35
-100
-80
-60
-40
-20
0
20
time (min)
hydro
lysis
yie
ld (
%)
120C
130C
140C 82
84
86
88
90
92
overa
ll yie
ld (
%)
(b)
0 5 10 15 20 25 30 35
0
20
40
60
80
100
tota
l xylo
se
(g
/L)
time (min)
120C
130C
140C
Figure V-6 Secondary hydrolysis profiles for sample B with 50% AAI (2.98 wt% H2SO4)
(a) hydrolysis and overall yield of xylose
(b) total xylose decomposition profiles
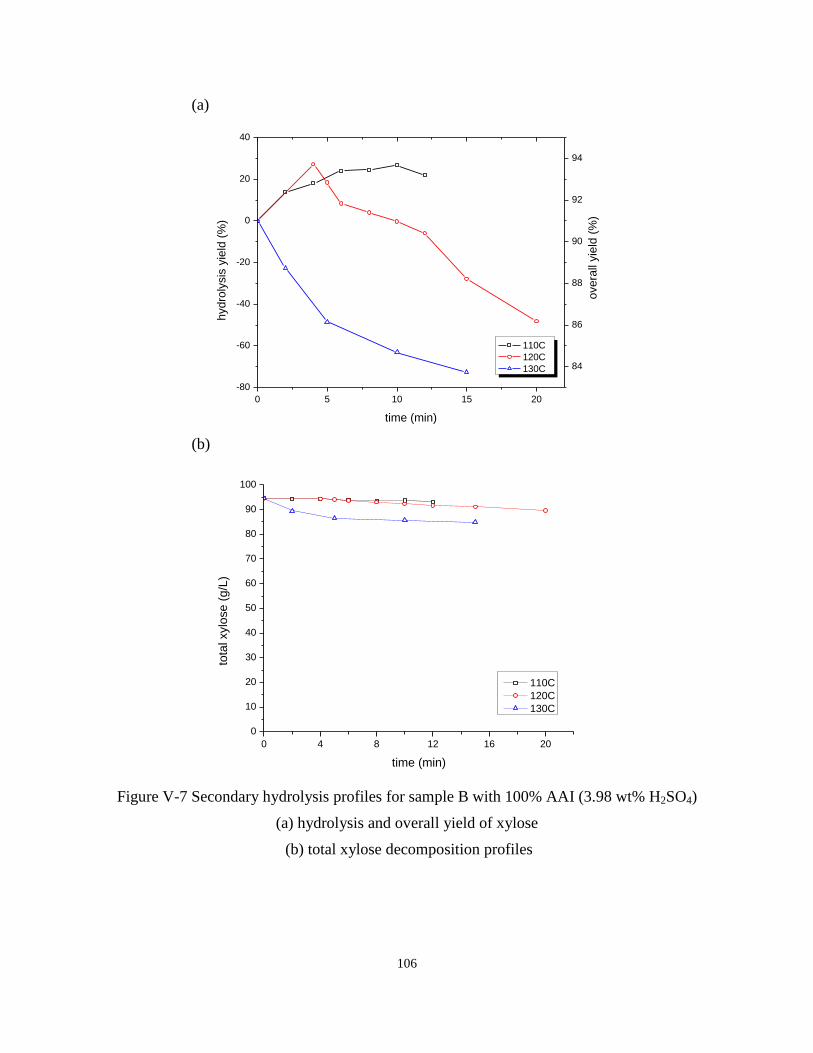
106
(a)
0 5 10 15 20
-80
-60
-40
-20
0
20
40
time (min)
hydro
lysis
yie
ld (
%)
110C
120C
130C 84
86
88
90
92
94
overa
ll yie
ld (
%)
(b)
0 4 8 12 16 20
0
10
20
30
40
50
60
70
80
90
100
tota
l xylo
se
(g
/L)
time (min)
110C
120C
130C
Figure V-7 Secondary hydrolysis profiles for sample B with 100% AAI (3.98 wt% H2SO4)
(a) hydrolysis and overall yield of xylose
(b) total xylose decomposition profiles

107
(a)
0 5 10 15 20 25 30
0
10
20
30
40
50
60
70
80
time (min)
hydro
lysis
yie
ld (
%)
120C
130C
140C
89
90
91
92
93
94
95
96
97
98
overa
ll yie
ld (
%)
(b)
0 5 10 15 20 25 30
0
20
40
60
80
100
xylo
se (
g/L
)
time (min)
120C
130C
140C
Figure V-8 Secondary hydrolysis profiles for sample C with 0% AAI (2.25 wt% H2SO4)
(a) hydrolysis and overall yield of xylose
(b) total xylose decomposition profiles
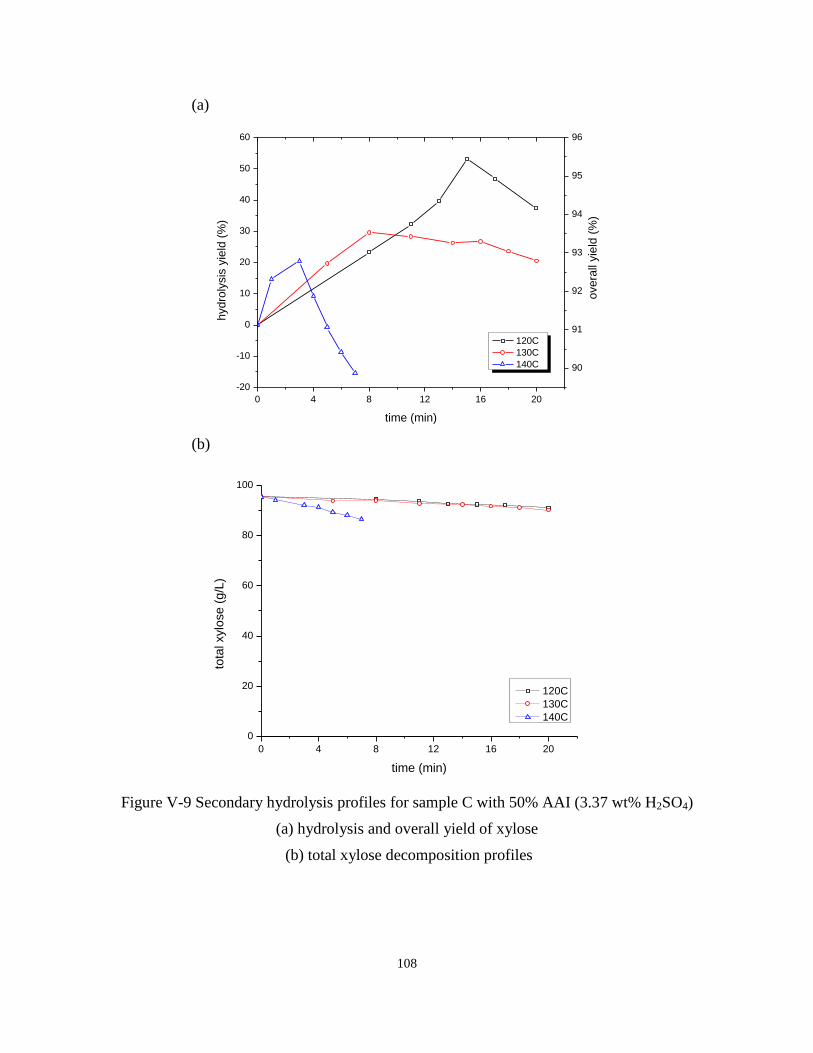
108
(a)
0 4 8 12 16 20
-20
-10
0
10
20
30
40
50
60
time (min)
hydro
lysis
yie
ld (
%)
120C
130C
140C 90
91
92
93
94
95
96
overa
ll yie
ld (
%)
(b)
0 4 8 12 16 20
0
20
40
60
80
100
tota
l xylo
se (
g/L
)
time (min)
120C
130C
140C
Figure V-9 Secondary hydrolysis profiles for sample C with 50% AAI (3.37 wt% H2SO4)
(a) hydrolysis and overall yield of xylose
(b) total xylose decomposition profiles
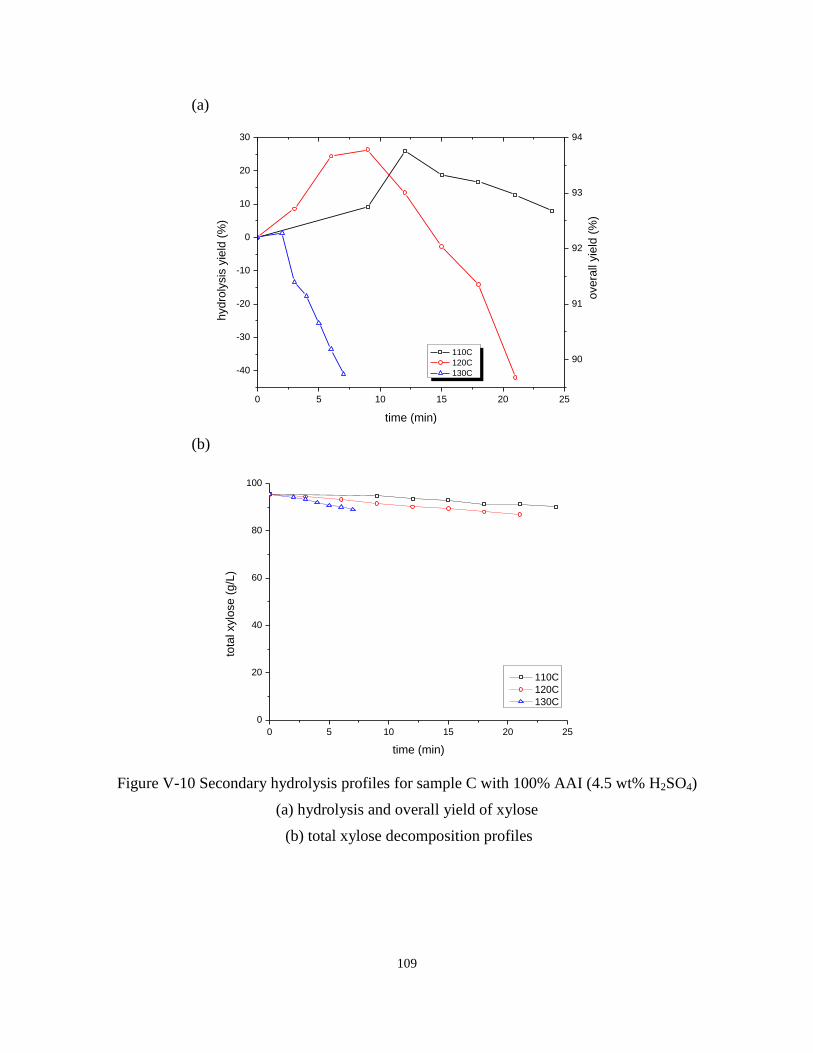
109
(a)
0 5 10 15 20 25
-40
-30
-20
-10
0
10
20
30
time (min)
hydro
lysis
yie
ld (
%)
110C
120C
130C
90
91
92
93
94
overa
ll yie
ld (
%)
(b)
0 5 10 15 20 25
0
20
40
60
80
100
tota
l xylo
se
(g
/L)
time (min)
110C
120C
130C
Figure V-10 Secondary hydrolysis profiles for sample C with 100% AAI (4.5 wt% H2SO4)
(a) hydrolysis and overall yield of xylose
(b) total xylose decomposition profiles

110
0 20 40 60 80 100
7.2
7.6
8.0
8.4
8.8
9.2
olig
om
er
conc. (g
/L)
time (min)
Figure V-11 Oligomer variation during secondary hydrolysis of prehydrolysate
(Sample B, Condition: 1.99 wt% acid & 130oC)

111
0 10 20 30 40 50
0
20
40
60
80
hyd
roly
sis
yield
(%
)
time (min)
Pectinase
Xylanase
cellulase
β-G
Figure V-12 Enzymatic hydrolysis yield during post hydrolysis of prehydrolysate
(Enzyme loading: 20 mg protein/g-xylose oligomers)
Cellulase: Spezyme CP
β-G: Novozyme -188
112
VI. Lactic Acid Production from the Mixture of Hemicellulose
Prehydrolysate and Kraft Paper Mill Sludge
VI.1 Abstract
Paper mill sludge is a solid waste material composed of pulp residues and ash generated
from pulping and paper making process. The carbohydrate portion of the sludge from
Kraft/Recycle paper mill has chemical and physical characteristics similar to those of
commercial wood pulp. Because of its high carbohydrate content and well-dispersed structure,
the sludge can be biologically converted to value-added products without pretreatment. In
bioconversion of solid feedstock such as paper mill sludge, a certain amount of water must be
present to attain fluidity. In this study, hemicellulose pre-hydrolysate, in place of water, was
added to the sludge to increase the concentration of the final product. Pre-hydrolysate was
obtained by hot-water treatment of pine wood in which the total sugar concentration reached 4
wt%. The mixture was processed by simultaneous saccharificiaton and fermentation (SSF) using
enzymes (cellulase and pectinase) and Lactobacillus rhamnosus (ATCC-10863). Pectinase was
added to hydrolyze mannose oligomers in the prehydrolysate to monomers. During the SSF of
the mixture, calcium carbonate in the paper sludge acted as a buffer, yielding calcium lactate as
the final product. External pH control was unnecessary due to the buffer action of calcium
carbonate that maintained the pH near optimum for the SSF. The lactic acid yield in the range of
80 - 90% of the theoretical maximum was obtained. Use of the mixed feed of pre-hydrolysate
and pulp mill sludge in the SSF raised the product concentration to 60 g of lactate/L.
113
VI.2 Introduction
Lactic acid is a specialty chemical widely used in cosmetics, pharmaceuticals, textile and
food industry (Xu et al., 2006; John et al., 2007; Vickroy, 1985). Strong market growth of lactic
acid is projected in production of polymers, especially poly-lactic acid (PLA). PLA is an
environmentally friendly polymer used for production of high-grade fabrics and biodegradable
plastics (Kharas et al., 1994). Sustained growth in medical-grade polymer such as drug delivery
system (John et al., 2007; Schmidt & Padukone, 1997) and medical implants (Auras et al., 2011)
is also expected. The worldwide production of lactic acid (LA) in 2001 was about 86,000
tons/year (Bouchoux et al., 2006), 260,000 tons in 2008 and expected to reach 1,000,000 tons in
2020 (Jem et al., 2010). Presently, about 90% of LA produced worldwide is made by
fermentation route and the rest by chemical synthesis (Hofvendahl & Hahn–Hägerdal, 2000).
Most of the fermentation relies on starch-derived glucose or sucrose as feedstock (Litchfield,
1996). In an effort to reduce the production cost, considerable research work has been conducted
in bioconversion of lignocellulosic carbohydrates for lactic acid production (Parajo et al., 1997;
Grade et al., 2002; Neureiter et al., 2004).
Lignocellulosic feedstocks are available from various sources. Our main interest was in
utilization of wastes materials available from pulp and paper plants. Among the various wastes
from pulp and plants, the mill sludge stands out as the most attractive feedstock as it has a
number of advantages. First of all, the cost is practically zero or may even be negative. Paper
sludge has in fact been a disposal liability for many years, the cost of disposal reported to be
about $20 per wet ton (Pope & Albertson, 1999; Kang et al., 2010). It has high carbohydrate
content and physical and chemical characteristics amenable for bioconversion. Because of its
well-dispersed structure, the paper mill sludge can be processed without pretreatment (Schmidt

114
et al., 1997; Lark et al., 1997; Kang et al., 2010). Pretreatment is one of the major unit processes
in the overall bioconversion process. Its elimination can significantly reduce the processing cost.
The paper mill sludge is reliable feedstock available year-round at a single site in a concentrated
form making it convenient for further processing. For biofuels application, the quantity of
sludge generated from a single paper mill is not sufficient to support a plant of economically-
feasible size. It is, however, sufficient for production of a specialty chemical such as lactic acid.
In the US, about 80% of the total pulp capacity is for Kraft pulping. Most of them also
operates recycle mill as a supplementary unit. In Kraft process, a large fraction of the
hemicellulose is released into black liquor, which is eventually burned in the recovery boiler
generating steam and electricity (Biermann, 1993). The heating value of hemicellulose
(13.6MJ/kg), however, is only half that of lignin (27MJ/kg) (Sixta, 2006). This underutilized
fraction of hemicellulose is another source of bioconversion feedstock. It has been proven that a
part of the hemicellulose can be recovered prior to pulping without degrading the quality of the
pulp by treatment with hot water/steam (Yoon et al., 2008; Yoon et al., 2010), dilute acid
(Springer & Harris 1982), or mild alkaline (Al-Dajani & Tschirner, 2008).
In bio-processing of lignocellulosic feedstocks such as paper mill sludge, a certain
amount of water must be present in the bioreactor to maintain fluidity and viable microbial
activity. In this work, addition hemicellulose pre-hydrolysate to the sludge, in place of water,
was considered as a means to increase the product concentration and to utilize the portion of
hemicellulose in the pulp feed that is virtually wasted in pulping process. We explored a novel
process scheme wherein the two different carbohydrate resources available from pulp mills are
biologically converted to lactic acid. The scope of the work covered characterization of paper
mill sludge and the pre-hydrolysate of pulp feed, and technical feasibility of converting them into

115
lactic acid by way of simultaneous saccharification and fermentation. Of our particular interest
was to investigate the feasibility of one-step processing of the mixed feedstock.
VI.3 Materials and Methods
VI.3.1 Materials
Feedstock
Southern pine chips were obtained from Rock-Tenn Company in Demopolis, Alabama.
Chips with major defects including bark, knots, and decayed parts were removed prior to
screening on a chip class laboratory screen equipped with a stack from top to bottom of 45-mm
round screens, 8-mm bar screens, 6-mm bar screens, and 4-mm round screens. The wood fraction
passing 45-mm round screens and 8-mm bar screens and retained on 6-mm bar screens was
collected, well mixed, and air-dried before use. Composition of southern pine was determined to
be: 40.6% glucan, 7.8% xylan, 2.2% galactan, 1.4% arabinan, 9.3% mannan, 30% lignin and 0.5%
ash.
The recycled paper mill sludge (RPMS) was collected from the wastewater clarifier unit
of a Kraft paper mill, Boise Paper Company (Jackson, AL). The RPMS was washed with tap
water three times and thickened to 26.5% consistency using a vacuum filter, and stored at 4o
C.
The RPMS was analyzed according to the National Renewable Energy Laboratory (NREL)
standard procedure (NREL, 2008) to contain 47.6 wt% glucan, 7.5 wt% xylan, 6.6 wt% lignin
and 34.5 wt% ash.
Enzymes and Microorganism
Cellic C-Tec2 (Novozymes Cellic CTec2, Batch VCNI0001, 119 FPU/ml) and Pectinase
(Multifect Pectinase FE, DuPont-Danisco, Lot No. A21-03356-001, 82 mg protein/ml) were used
116
in the enzymes hydrolysis test of the sludge and for the SSF experiments. Pectinase was used
specifically for hydrolysis of mannose oligomers in the pre hydrolysate. Lactobacillus
rhamnosus (ATCC-10863) was used as the microorganism in the SSF. Lactobacilli MRS Broth
(Acumedia) was used as the growth medium for preparation of inoculum.
VI.3.2 Pre-extraction of Southern pine chips
Hot water treatment was applied to extract hemicellulose sugars from Southern pine chips.
In order to avoid damaging the fiber quality, the pre-extraction was done in such a way that the
hemicellulose removal is limited to a certain level. In normal batch operation of pre-extraction,
the sugar concentration below 2% (w/v) is obtained. In order to increase the sugar content in the
extracted liquor, three stage extractions were applied as described in Figure VI-1. This three-
stage extraction also simulates the continuous counter-current extraction process, which would
be a preferred mode of operation in commercial scale operation. The extractions were conducted
in a 500 ml cylindrical bomb digester which was placed inside a M/K laboratory digester filled
with water as heat transfer fluid. In each extraction stage, 70 grams of oven-dried wood chips
were loaded in the bomb digester. DI water was used in the first-stage extraction. The liquid-to-
wood ratio was 5.8 to 1. To determine the optimum conditions, the digester was operated over a
broad range of conditions. From the data the operating conditions of 170oC and 60 minutes was
applied for generation of the prehydrolysates. The extract obtained from hot-water treatment was
drained from the wood chips to collect 70% of the total liquid. The liquor used in the second
stage was mixed with the extract liquor from the first stage extraction (70% of the total first stage
liquor) and make-up DI water (30% volume of the total first stage liquor) since about 30% of
total liquor is absorbed by the extracted wood. The same operation was applied to the third stage;
the input liquid consisted of 70% of second-stage liquor and 30% DI water. As wood chips are

117
extracted, their weight decreases due to the components being dissolved into the extraction liquor
(termed as pre-hydrolysate). The wood weight loss data were calculated from the difference
between the weight of fresh wood chips and that of thoroughly washed and dried wood residue.
The sugar contents of the extract and the reacted residue were determined by the NREL standard
procedures (NREL, 2008).
VI.3.3 Detoxification of Prehydrolysate
Over-liming was tested for detoxification of the prehydrolysate by the following
procedure. Lime (CaO) was added to the prehydrolysate to increase the pH to 10. The treatment
conditions were: 60oC, 30 minutes, 10g CaO/L of prehysrolysate. The pH was readjustment to
5.0 by sulfuric acid, centrifuged to remove precipitates, and the supernatant was used for the SSF
test.
VI.3.4 SSF of Prehydrolysate
Erlenmeyer flask (125 ml) was used as the bioreactor with 50 ml liquid volume. The SSF
were operated in an incubator shaker (New Brunswick Scientific, Innova-4080) at 37oC with 150
rounds per minute (RPM). CaCO3 was added to the prehydrolysate at the level of 5% w/v for
SSF operation as a neutralizing reagent. The prehydrolysate was steam sterilized at 121oC for 15
min. before the SSF. The biological components of the SSF were Pectinase enzyme and L.
rhamnosus, applied at the level of 15 mg-protein/g-mannan and 3.0% V/V inoculum respectively.
VI.3.5 Enzymatic Digestibility Test of Recycled Paper Mill Sludge
The enzymatic digestibility test of the RPMS was performed according to the NREL
Chemical Analysis and Testing Standard Procedures (NREL, 2008). Screw-capped 250 ml
Erlenmeyer flasks were used as the hydrolysis reactor. The RPMS samples were suspended in DI

118
water and put into the flasks to reach a total working volume of 100 ml such that the initial
glucan content in the reactor becomes 1% (w/v) and steam sterilized at 121°C for 15 min. The
enzymatic digestibility tests were carried out at 50°C in an incubator shaker (New Brunswick
Scientific, Innova-4080) agitated at 150 RPM. For hardwood pulp, enzymatic hydrolysis was
carried out under two different conditions: pH = 4.8 (0.05 M sodium citrate buffer) and with
addition of CaCO3 to the level of 0.5 g/g-glucan matching that of sludge without pH control. In
all digestibility tests, enzyme loading of 15 FPU Cellic CTec-2 was applied per g-glucan in the
feedstock. The enzymes were filter-sterilized. Hydrolysate samples were taken at 6, 12, 24, 48,
and 72 h and analyzed for glucose, xylose, and cellobiose. Total released glucose and cellobiose
after 72 h of hydrolysis were used to calculate the enzymatic digestibility:
Digestibility (%) = 𝐺𝑙𝑢𝑐𝑜𝑠𝑒 _𝑟𝑒𝑙𝑒𝑎𝑠𝑒𝑑(𝑔)+1.053 ∗𝐶𝑒𝑙𝑙𝑜𝑏𝑖𝑜𝑠𝑒 _𝑟𝑒𝑙𝑒𝑎𝑠𝑒𝑑 (𝑔)
1.111∗𝐺𝑙𝑢𝑐𝑎𝑛 _𝑎𝑑𝑑𝑒𝑑 (𝑔)∗ 100 (VI-1)
Commercial grade hardwood pulp was also put through the same procedure as a control.
VI.3.6 SSF of Recycle Paper Mill Sludge
The SSF tests of the RPMS were carried out with DI water and alternatively with
addition of the prehydrolysate. The procedure was similar to that previously described in the
section of SSF of prehydrolysate. In the SSF of RPMS alone, the sludge samples were suspended
in DI water and put into the flasks to reach a total working volume of 50 ml applying various
solid loadings. The slurries were steam sterilized by at 121oC for 15 min. Cellic C-Tec2 was
added at different enzyme loadings ranging 5-15 FPU/g-glucan. In the SSF of the RPMS-
prehydrolysate mixture, Pectinase and Cellic C-Tec2 were added at various levels. In all SSF
experiments, corn steep liquor and yeast extract were added as nutrients for the microorganism
119
(L. rhamnosus) in the amount of 0.5ml and 0.3g respectively. Samples was taken at 12, 24, 36,
48, 60, 72 and 96 h and analyzed for glucose and LA.
VI.3.7 Analytical Methods
The prehydrolysates were centrifuged to separate the solid part from liquid. The liquid
was analyzed for monomeric sugars. It was then held for 1 h with 4% sulfuric acid at 121°C in
an autoclave to hydrolyze the oligomers to monomers. The total sugar content after autoclave
hydrolysis minus the initial monomeric sugar content was taken as the oligomers in the
hydrolysate. Determination of sugar content was done according to the standard MREL
procedure (NREL, 2008). The solid samples were analyzed for carbohydrates, acid insoluble
lignin, acid soluble lignin, and ash following the NREL standard procedures (NREL, 2008). The
moisture content was measured by an infrared moisture balance (Denver Instrument, IR-30).
Sugars were determined by HPLC using a BioRad-HPX-87P column. LA, acetic acid, and other
organic compounds including furfural, HMF, levulinic acid were determined by HPLC using a
BioRad-HPX-87H column. A refractive index detector was used with the HPLC. Where
applicable, statistical analysis was performed including mean value and standard deviation.
VI.4 Results and Discussion
With the ultimate goal of establishing a bioconversion process utilizing the two different
feedstocks available from Kraft paper mills, the experimental work in this investigation was
structured to perform the following specific tasks: characterization of the sludge and pre-
hydrolysate including the bioconversion compatibility, method to produce pre-hydrolysate from
pulp feed, and assessment of the SSF as a bioconversion process converting the mixed feed to
lactic acid.

120
VI.4.1 Partial Extraction of Softwood Hemicellulose
On the basis of our previous study (Kang et al., 2012), the extraction time of 60 minutes
was applied to recover as much hemicellulose sugars as possible without degrading the quality
the cellulosic fiber. With 3-stage pre-extraction, the total sugar concentration in the hydrolysate
was raised to 40.7 g/L, mannose being the largest sugar component at 15.5 g/L (Table VI-1). The
overall recovery of hemicellulose sugars was approximately the same as that of each stage. In 3-
stage operation, about 38% of total hemicellulose sugars, which is equivalent to 10.7% of total
solid, was recovered while the loss of cellulose was only 0.03%.The recovered sugar was
obtained mostly in the form of oligomer rather than monomer (Table VI-1). In the hydrolysate,
the hexose sugars (mannose, glucose, galactose) had higher ratio of oligomer to monomer than
pentoses (xylose, arabinose). Hexose oligomers have been reported to be more stable against
acid-catalyzed degradation (BeMiller, 1967). Other organic compounds were also generated
during the pre-extraction process. The identifiable organic compounds were acetic acid, acetyl
ligand attached to other organic compound, furfural, HMF, levulinic acid (Table VI-2). These
compounds also accumulated over the 3-stage processing to the final total concentration of 5.72
g/L (Table VI-2). There are numerous other unidentified compounds in the pre-hydrolysate
including lignin degradation products. Over the three-stage pre-hydrolysis, the pH stayed
relatively constant at 3.50, 3.43 and 3.40, respectively. It appears that the ash content in the wood
is mainly inorganic salt, which act as a buffer when dissolved in water.
VI.4.2 Enzymatic Hydrolysis Test of Recycle Paper Mill Sludge
The washed RPMS was first subjected to enzymatic hydrolysis to produce sugars using
Cellic CTec-2. The results were compared with those of pure cellulose. The enzymatic
conversion of the sludge was dismal showing less than 20% of glucan digestibility whereas that

121
of α-cellulose was above 80% under the identical hydrolysis conditions (Figure VI-2). To verify
the reason for the difference in the enzyme efficiency between the two substrates, additional
hydrolysis tests were conducted using a mixture of α-cellulose and CaCO3, the major inorganic
contaminant in the sludge. The α-cellulose was mixed with CaCO3 at the same level as that in the
sludge. The hydrolysis profiles of the three substrates shown in Figure 2 clearly indicate that
presence of CaCO3 is the main reason for the inhibited enzymatic reaction. This reaffirmed the
finding of our previous work on ethanol production from paper mill sludges (Kang et.al, 2012)
that ash contained in the sludge interferes with the enzymatic reaction. Specifically, CaCO3 in
ash acts as a buffer which maintains the pH two units above the optimum for the cellulose
enzymes. Such pH problem can be resolved if the sludge is treated by an acid, thus bringing the
pH towards the optimum. Alternatively, one may apply a SSF wherein the end-product is an acid,
i.e., lactic acid. With this approach, the acid is internally generated to form calcium lactate as the
end-product instead of treating the sludge with external acid. The calcium carbonate in the
sludge essentially serves as a pH control reagent in the fermentation process.
VI.4.3 SSF of Recycle Paper Mill Sludge
Since the glucose digestibility is below 20% from enzymatic hydrolysis of RPMS without
pH control, separate hydrolysis and fermentation (SHF) was ruled out as a feasible process
option. Presence of large amount of CaCO3 in the RPMS makes it extremely difficult to control
the pH. SSF was therefore pursued in the subsequent experiments. The SSF of RPMS was first
carried out with 5 wt% solid loading applying different enzyme loading, and with 7.5 FPU/g
glucan loading applying different solid loading. Higher enzyme dosage gave higher LA yield. At
5% solid loading, when the enzyme dosage increased from 5 to 10 FPU/g glucan, the 72-h LA
yield increased from 69% to 88%. At a fixed enzyme loading, the LA yield is seen to have
122
inverse relationship with solid loading, giving low yield at high solid loading, consequently low
LA acid concentration. The decreased LA yield is due to the limited enzymatic hydrolysis at high
solid loading, which is well-documented (Wang et al., 2011; Zhang et al., 2011; Cara et al., 2007;
Pessani et al., 2011). At a fixed enzyme loading of 7.5 FPU/g-glucan, 5% solid loading led to 82%
of LA yield, but the product concentration was only 20 g/L. When the solid loading was
increased to 15%, even though the yield decreased from 82% to 59%, the product concentration
rose to 44g/L (Table VI-3 and VI-4). The yield and product concentration are both important
factors in process economics. The fact that they have inverse relationship between them brings
up a delicate situation where a proper balance needs to be taken in the process design and
operation. With this in mind, we have explored the use of mixed feed (sludge plus prehysrolysate)
in the SSF.
VI.4.4 SSF of Prehydrolysate
Prior to the SSF of mixed feed, the SSF of the prehydrolysate was first investigated. The
largest sugar component in the prehydrolysate is mannose which exists mostly in the form of
oligomer (Table VI-1). In order to hydrolyze the mannose oligomers to monomer, the cellulase
was supplemented with pectinase in the SSF of the pre-hydrolysate. The pectinase used in this
study (Multifect Pectinase FE, DuPont-Danisco, Lot No. A21-03356-001, 82 mg protein/ml) was
reported to have high mannanse activity (Kang et al., 2011). The cellulase (Cellic C-Tec2)
loading was 5 FPU/g Glucan and the Pectinase loading was 15 mg protein/g Mannan.
The prehydrolysate produced from lignocellulosic biomass contains toxic components
such as organic acid, furans, and various phenolic compounds originated from lignin that inhibit
the fermentation process (Wang et al., 2011; Zhang et al., 2011) as well as the enzymatic
hydrolysis (Cara et al., 2007). The SSF of prehydrolysate was tested with and without
123
detoxification. The results are shown in Figure VI-3. Without detoxification, the SSF produced
dismal level of lactic acid, giving less than 5% yield. After detoxification by overliming, the SSF
LA yield rose 65% on the basis of total hexose sugars present in the prehydrolysate. The SSF of
the prehydrolysate was also carried out without detoxification but with addition of excess
amount of CaCO3, which acted as a neutralizing reagent for lactic acid and also as a buffer
stabilizing the pH. The pH level stayed near 5.6 throughout the SSF despite continual production
of LA, leaving calcium lactate as the end-product. In this method, the lactic acid yield reached
60%, only 5% lower than that obtained from detoxified (overlime-treated) prehydrolysate. Since
interaction between CaCO3 and the toxic components in the prehydrolysate at the fermentation
temperature of 37oC is quite low, it appears that the negative effect on lactic acid production in
the SSF is caused primarily by low pH rather than the direct interaction of the inhibitors with the
microorganism and the enzymes. It also indicates that addition of external CaCO3 may not be
necessary if the SSF is carried out using the mixed feed of prehydrolysate and RPMS since the
sludge contains high amount of CaCO3.
VI.4.5 SSF of the Mixture of RPMS and Prehydrolysate
In order to assess the overall performance and to refine the operating conditions, the SSF
of the mixed feed was investigated carrying out experiments under various process conditions.
The results of SSF of the mixture are shown in Table VI-6. As shown in the table, the yield is at
low solid loading is lower than that of high solid loading. This is contrary to what we observed in
the SSF of sludge alone. We believe it is due to the pH effect. Figure VI-4a and b show the pH
profiles during the SSF of the mixed-feed. With high solid loading (10%), the pH quickly
dropped to 5.8 (a level compatible with the SSF) from the initial vale of 7.2 and stayed at that
level throughout the SSF (Figure VI-4b). The reason for initial quick drop of pH is due to

124
production of lactic acid which eventually forms calcium lactate. The steady pH afterwards is
due to the buffer action of the ash content and the presence of calcium lactate and small amount
of calcium acetate which collectively act as a buffer. With low solid loading (5%), the pH
steadily declined and stayed at 4.2 due to low total amount of ash in the sludge. When the
prehydrolysate, the pH of which is 3.3, was added to the reactor that has low solid loading, the
acid-alkali balance becomes such that the overall acidity of the prehydrolysate and lactic acid
supersede the CaCO3 in the sludge driving the pH to the range of 4.2-4.5 (Fig. VI-4a), which is
below the optimum of the SSF. In other words, with low sludge loading, the ash content in the
sludge is not sufficient to maintain the pH near optimum level. This eventually led to low lactic
acid yield in the SSF.
We have thus proven that the pH problem encountered in the enzymatic hydrolysis of the
RPMS is resolved if one uses the mixed feed at high solid loading in the SSF. Unlike the case of
the SSF of the prehydrolysate, addition of external CaCO3 is not required when high sludge
loading is applied. At high sludge loading, the amount of the ash (CaCO3) contained in the
sludge is sufficient to maintain the pH within the operable range of the SSF.
Another important benefit sought in the use of the mixed-feed is to raise the product
concentration. Such benefit is also validated by the data presented in Fig. VI-5. It is clearly
shown that at a fixed level of solid loading, the LA concentration is much higher for the mixed-
feed than that of the sludge alone. With 10 wt% sludge loading and cellulose loading of 15 FPU /
g-glucan, the final lactic acid concentration reached 60 g/L for the mixed feed, whereas it is only
40 g/L for the sludge alone. It also proves that the hemicellulose sugars in the prehydrolysates
are utilized by the microorganism as well as the carbohydrates in the sludge. On the other hand,
the yields were 83% and 92%, for the mixture and the sludge only respectively (Fig. VI-6). The
125
yields were calculated on the basis of the theoretical maximum wherein the total of hexoses
sugars in the sludge and those in the prehydrolysate were taken into consideration in the case of
the mixed feed. The fact that the overall yield of the mixed feed is close to that of the
prehydrolysate indicate that the presence of the prehydrolysate impedes the SSF of the sludge
portion. We speculate that the toxins in the prehydrolysate are inhibiting the enzyme action on
the solid as well as the microbial activity.
To refine the process conditions, the SSF of the mixed-feed was further investigated. We
chose three process variables as the main parameters affecting the performance of the SSF of the
mixed feed: cellulase, pectinase, and solid loading. To identify the significance of the process
variables, 4 levels for each of the parameters were applied: solid loading (wt%): 5,7.5, 10, 15;
cellulase (C-Tec2) loading (FPU/g Glucan): 5,7.5, 10, 15; and pectinase loading (mg protein/g
Mannan): 10, 15, 20, 25. The SSF experiments were carried out following the experimental
design of Taguchi (Taguchi 1987; Rao et al., 2008) taking the product yield as the objective
function. This method uses orthogonal arrays to organize the parameters affecting the process
and the levels at which they should be varied. Knowing the number of parameters and the
number of levels, the proper orthogonal array can be selected. These arrays were created using
an algorithm developed by Taguchi (Taguchi, 1987). Under this scheme, L’16 orthogonal array
was chosen as shown in Table VI-5 (Taguchi, 1987). Total of 16 experimental runs were
required in this method as opposed to 64 runs of the exponential design (4x4x4). The results of
the 16 experimental runs were organized in Taguchi format as shown in Table VI-6. The
performance indexes from each the trial runs were determined to analyze the relative effect of
the different parameters. One of such is Ki listed in the table, which is the sum of the yield
(objective function) of the four trial runs representing the four levels of a given parameter, i
126
representing the four levels of that parameter. From this value we can determine the best level
for this parameter. Take cellulase loading for example, we applied 4 levels: 5, 7.5, 10 and 15
FPU/g glucan. At 15 FPU/g glucan level, which is the 4th
level of the parameter of cellulase
loading, the sum of the yield of all trials for this level (K4cellulase) is 67.96 + 76.39 + 83.09 +
64.59 = 292.03. Likewise, we calculate the K for all levels of cellulase loading, the highest Ki is
K4 = 292.03 which refers to 15 FPU/g glucan. This means the optimum value of cellulose
loading is 15 FPU/g glucan within the levels we applied. The R is the difference between the
highest K and lowest K value. The larger the R value for a parameter, the larger the effect the
variable has on the process. This is because the same change in signal causes a larger effect on
the output variable being measured. The highest LA yield observed from the 16 experimental
runs was 83% wherein LA concentration was 60 g/L. It was attained at the level of the three
chosen parameters: 10% of solid loading, 15 FPU/g glucan of cellulase loading, and 15 mg
protein/g mannan of pectinase loading. These are the set of conditions that exhibited highest LA
yield within the range of the parameters covered by the 16 runs. It is interpreted as a reasonable
operating condition to apply for the proposed SSF of the mixed-feed when the yield is taken as
the key performance index. Additional operating conditions need to be considered to determine
the true optimum set of operating conditions. From the experiment design, the preferred
experiment conditions are determined to be: 10 wt% sludge loading, 15 FPU/g-glucan of
cellulase loading and 10 mg protein / g-mannan of pectinase loading. Among the three main
parameters, the solid loading and cellulase loading have shown more significant effects on LA
yield than pectinase loading as indicted by the R values in Table VI-6.

127
VI.5 Conclusion
With hot-water treatment of Southern pine, a representative pulp feedstock, 10% of the
hemicellulose can be selectively recovered as fermentable sugars without degrading the yield and
quality of the pulp fibers. The recovered hemicellulose sugars are 75% hexoses (mannose,
galactose and glucose) 25% pentoses (xylose and arabinose); and 62% oligomers and 38%
monomers. The prehydrolysate and the pulp mill sludge can separately be converted to lactic
acid by SSF using Lactobacillus rhamnosus as the microorganism and different set of enzymes
for each case: pectinase and cellulase for the prehydrolysate and cellulase for the sludge. The
SSF can also be applied for the mixture of these two low-cost feedstocks available from a Kraft
pulp mill. The use of the mixed-feed significantly increased the product concentration in the
SSF over that of the sludge alone. From the data of multiple SSF runs, it was demonstrated that
83% lactic acid yield with 60 g/L lactic acid concentration is attainable. From the experiment
design, the preferred experiment conditions are determined to be: 10 wt% sludge loading, 15
FPU/g-glucan of cellulase loading and 10 mg protein / g-mannan of pectinase loading. Among
the three parameters, solid loading and cellulase loading have shown more significant effects on
lactic acid production, while the pectinase loading only has minor effect. During the SSF
process, calcium carbonate existing in the RPMS acted as neutralizing reagent keeping the pH
near optimum level resulting calcium lactate as the end-product.

128
Table VI-1 Sugar Content in the Liquid Obtained through Three-stage Pre-extraction
S/L ratio = 5.8:1, 170oC and 60min for each stage (From Kang, et.al, 2012)
Monomeric Sugars (g/L) Oligomeric Sugars (g/L)
Total Sugars(g/L)
Glu Xyl Gal Ara Man Glu Xyl Gal Ara Man
First Stage 0.40 1.14 0.73 1.46 0.55 1.60 2.46 2.07 0.27 8.15 19.32
Second Stage 1.07 2.65 1.59 2.27 1.60 2.88 3.02 3.60 0.33 12.97 31.99
Third Stage 2.41 3.76 2.61 3.54 3.20 2.97 2.65 3.93 0.10 15.53 40.70
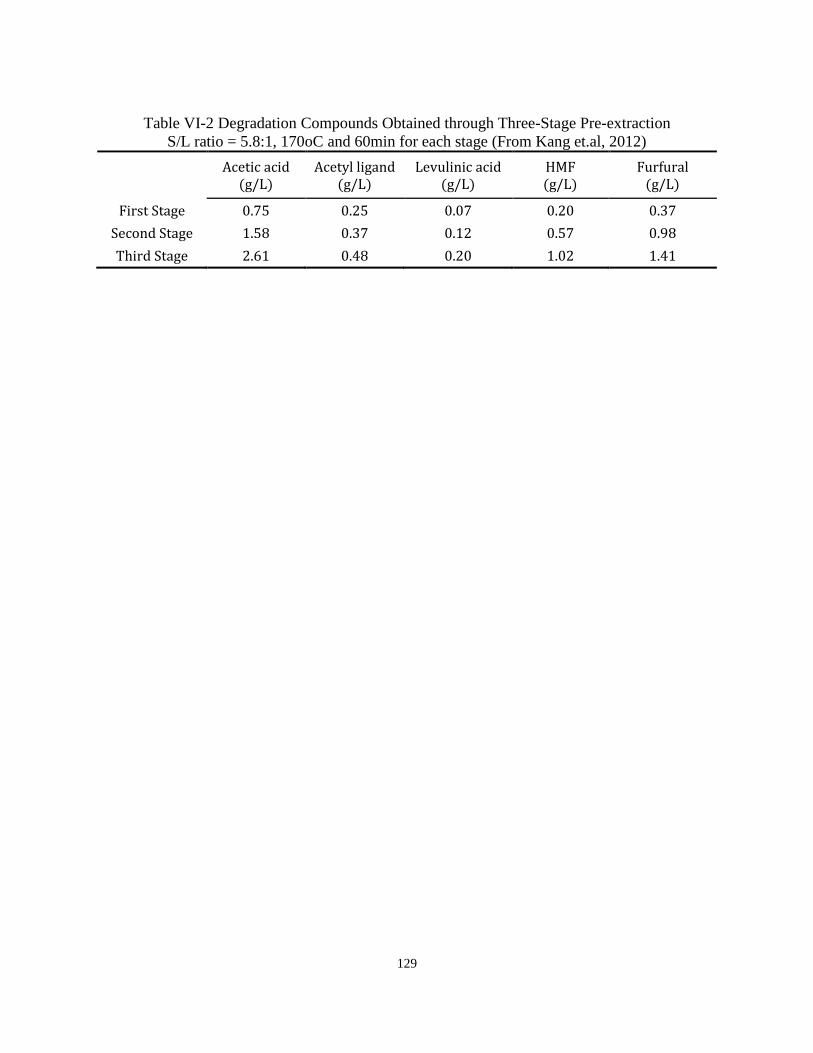
129
Table VI-2 Degradation Compounds Obtained through Three-Stage Pre-extraction
S/L ratio = 5.8:1, 170oC and 60min for each stage (From Kang et.al, 2012)
Acetic acid
(g/L) Acetyl ligand
(g/L) Levulinic acid
(g/L) HMF (g/L)
Furfural (g/L)
First Stage 0.75 0.25 0.07 0.20 0.37
Second Stage 1.58 0.37 0.12 0.57 0.98
Third Stage 2.61 0.48 0.20 1.02 1.41

130
Table VI-3 LA production at 5% solid loading and different enzyme loading after 72hr
Enzyme Loading FPU/g-glucan
Lactic Acid (g/L)
Acetic Acid (g/L)
LA yield %
5 16.97 2.57 69.62
7.5 20.56 2.23 83.17

131
Table VI-4 LA production at 7.5 FPU/g-glucan and different solid loading after 72hr
Solid Loading w/v Lactic Acid (g/L) Acetic Acid (g/L) LA yield %
5% 20.15 2.12 82.51
10% 39.34 2.79 79.41
15% 43.95 2.84 59.26

132
Table VI-5 Experiment design via Taguchi methods
Experiment Solid Loading (w/v%)
Cellulase Loading (FPU/g Glucan)
Pectinase Loading (mg protein/g Man)
1 5 5 10 2 5 7.5 15 3 5 10 20 4 5 15 25 5 7.5 5 15 6 7.5 7.5 10 7 7.5 10 25 8 7.5 15 20 9 10 5 20
10 10 7.5 25 11 10 10 10 12 10 15 15 13 15 5 25 14 15 7.5 20 15 15 10 15 16 15 15 10
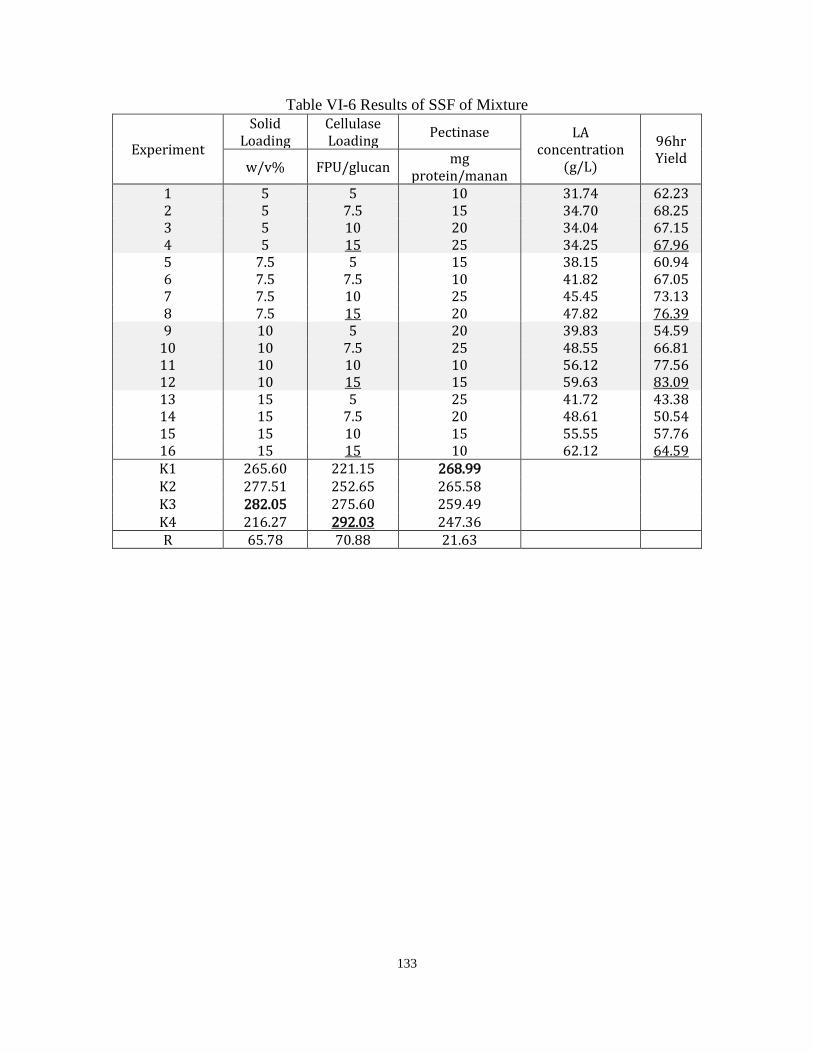
133
Table VI-6 Results of SSF of Mixture
Experiment
Solid Loading
Cellulase Loading
Pectinase LA concentration
(g/L)
96hr Yield
w/v% FPU/glucan mg
protein/manan 1 5 5 10 31.74 62.23 2 5 7.5 15 34.70 68.25 3 5 10 20 34.04 67.15 4 5 15 25 34.25 67.96 5 7.5 5 15 38.15 60.94 6 7.5 7.5 10 41.82 67.05 7 7.5 10 25 45.45 73.13 8 7.5 15 20 47.82 76.39 9 10 5 20 39.83 54.59
10 10 7.5 25 48.55 66.81 11 10 10 10 56.12 77.56 12 10 15 15 59.63 83.09 13 15 5 25 41.72 43.38 14 15 7.5 20 48.61 50.54 15 15 10 15 55.55 57.76 16 15 15 10 62.12 64.59 K1 265.60 221.15 268.99
K2 277.51 252.65 265.58 K3 282.05 275.60 259.49 K4 216.27 292.03 247.36 R 65.78 70.88 21.63
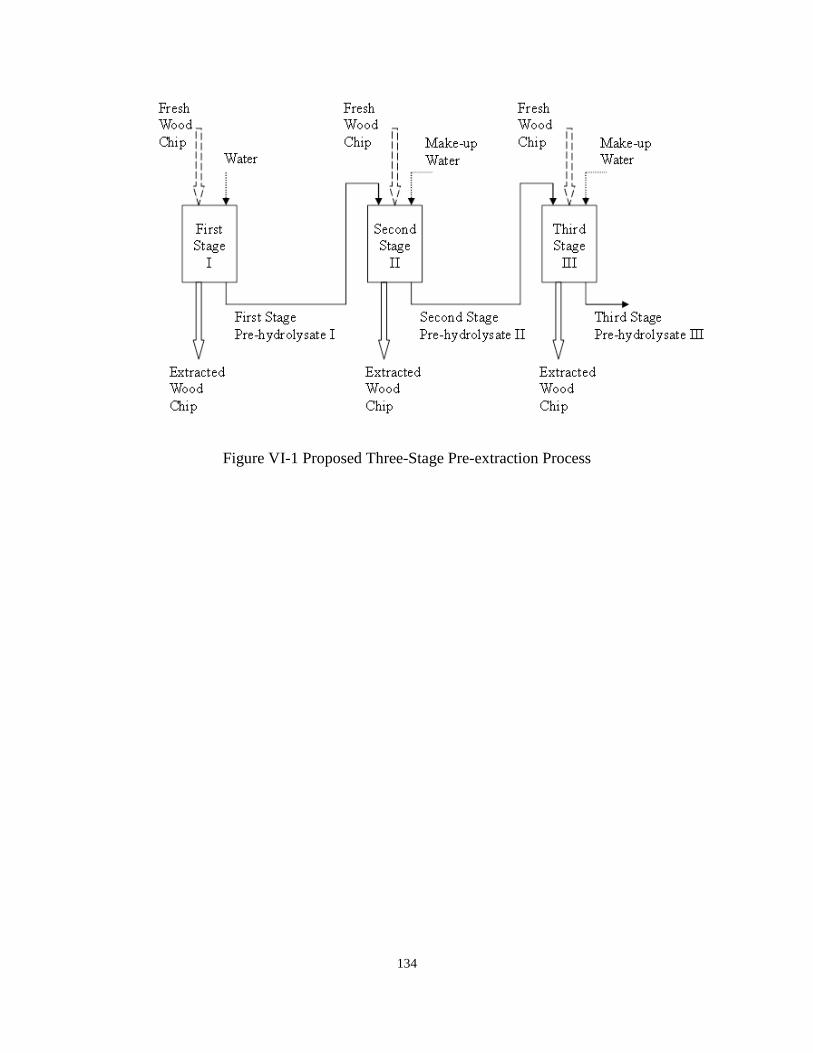
134
Figure VI-1 Proposed Three-Stage Pre-extraction Process
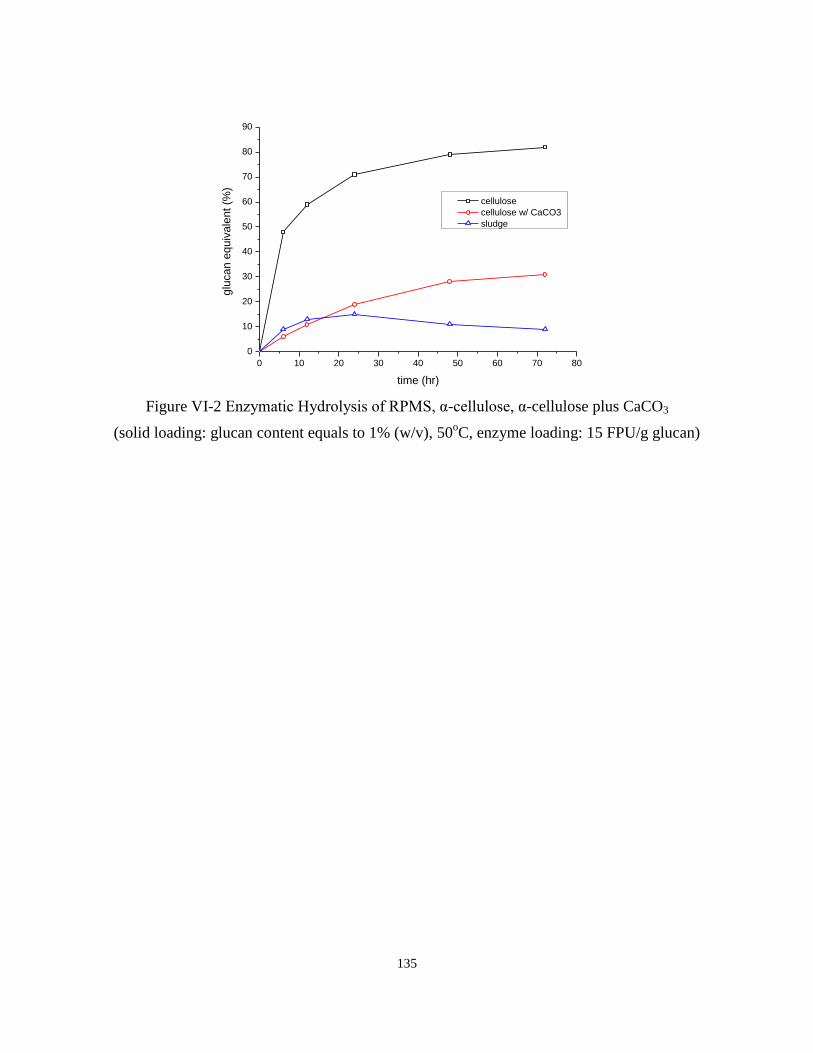
135
0 10 20 30 40 50 60 70 80
0
10
20
30
40
50
60
70
80
90
glu
can e
quiv
ale
nt (%
)
time (hr)
cellulose
cellulose w/ CaCO3
sludge
Figure VI-2 Enzymatic Hydrolysis of RPMS, α-cellulose, α-cellulose plus CaCO3
(solid loading: glucan content equals to 1% (w/v), 50oC, enzyme loading: 15 FPU/g glucan)
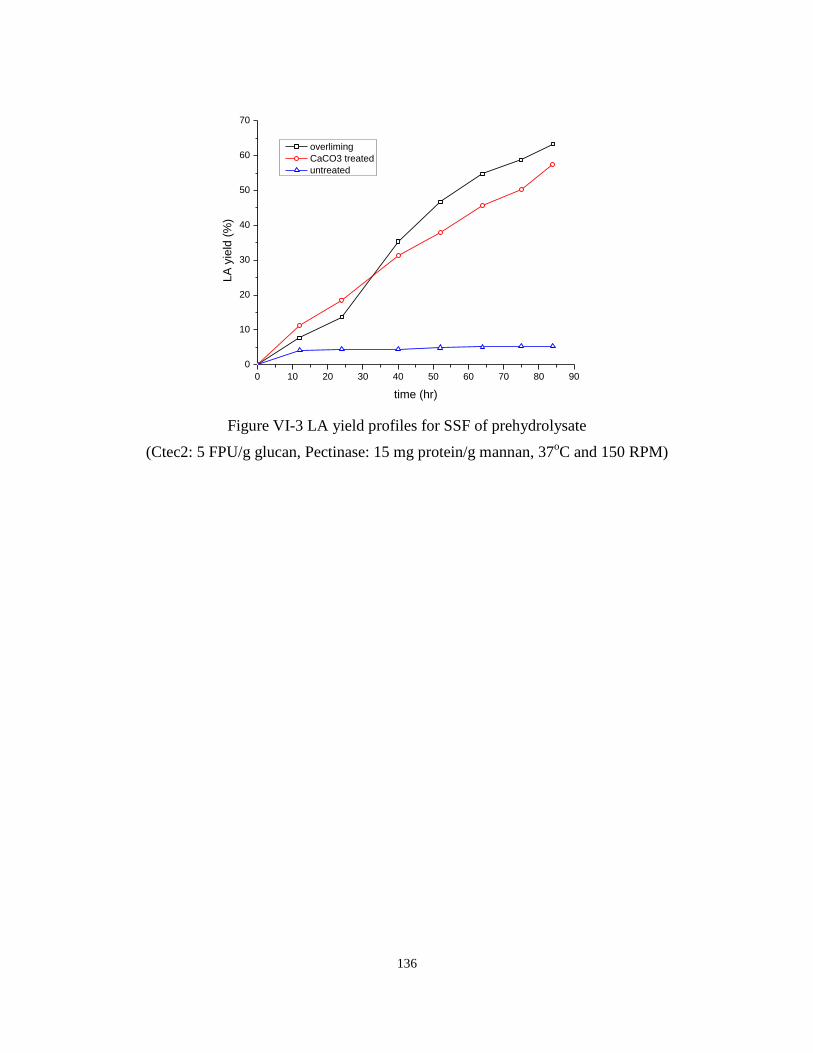
136
0 10 20 30 40 50 60 70 80 90
0
10
20
30
40
50
60
70
LA
yie
ld (
%)
time (hr)
overliming
CaCO3 treated
untreated
Figure VI-3 LA yield profiles for SSF of prehydrolysate
(Ctec2: 5 FPU/g glucan, Pectinase: 15 mg protein/g mannan, 37oC and 150 RPM)

137
(a) (b)
Figure VI-4 pH profiles during SSF of the Mixture
a) solid loading: 5%, cellulase(C-Tec2): 15 FPU/g glucan, pectinase: 25 mg protein/g mannan
b) solid loading: 10%, cellulase(C-Tec2): 15 FPU/g glucan, pectinase: 15 mg protein/g mannan
3.5
4
4.5
5
5.5
6
6.5
7
7.5
0 20 40 60 80 100 120
pH
Time (h)
3.5
4
4.5
5
5.5
6
6.5
7
7.5
0 20 40 60 80 100 120
pH
Time (h)

138
Figure VI-5 LA concentration profiles during SSF of different feedstock
(5% solid loading, cellulase(C-Tec2): 10FPU/g glucan, pectinase: 20 mg protein/mannan)
0
10
20
30
40
50
60
70
0 20 40 60 80 100
LA c
on
cen
trat
ion
g/L
Time / hr
sludge only
mixed-feed

139
Figure VI-6 LA yields during SSF of different feedstock
(5% solid loading, cellulase(C-Tec2): 10FPU/g glucan, pectinase: 20 mg protein/mannan)
0
10
20
30
40
50
60
70
80
90
100
0 20 40 60 80 100
LA y
ield
%
Time / hr
sludge only
mixed-feed
140
VII. Future Work
Additional work is needed to further prove the LCC formation during the dilute acid
pretreatment process. Pure xylose monomers and oligomers are suggested to react with lignin
model compounds. The lignin model compounds will be extracted from solution after the
reaction and subjected to FTIR and NMR. If the FTIR and NMR spectra show that the extracted
sample contains both lignin and carbohydrates peaks, that means we do have LCC formation
during the pretreatment and hydrolysis step.
Penetration of acid into the biomass structure and its dispersion in the reactor can become a
significant factor in the overall rate process of dilute-acid pretreatment. Since the residence time
in the screw-driven reactor is relatively low, the acid within the biomass may not be uniformly
distributed within that residence time period. The non-uniform transient acid profile can
significantly affect the overall pretreatment reaction. The extent of such effect can be
mathematically modeled in such a way that a dimensionless parameter, something equivalent to a
Thiele modulus in catalytic reaction theory, is used as an index indicating the overall effect of
transient acid diffusion. The dimensionless parameter involves biomass size, reaction kinetic
constants, and the acid diffusion coefficient within biomass. Of these entities, the acid diffusion
coefficient in biomass structure remains as unknown, and will be experimentally determined.
The modeling work will be organized in such a way that the efficiency factor is expressed as a
function of biomass size for various treatment conditions. This will provide practical information
with regard to the biomass size, whether one needs to reduce the size of feedstock to avoid the
negative effect of acid diffusion, if so, to what size for a given reaction condition.
The difference between the diffusion and dispersion is to be noted here. Diffusion refers to
intra-particle movement of acid, whereas dispersion refers to the bulk acid movement in the
141
reactor. One can make a similar argument with regard to dispersion creating no-uniform
condition across axial and radial position of the reactor. The dispersion is influenced not only by
the transport properties but also by the mechanical movement of particles in the reactor.
Secondly, in chapter IV, the RTD data were used to assess the performance of NREL
continuous pretreatment reactor along with the conventional kinetic model. The modified model
shows better agreement with experimental data in the latter reaction stage. This modified kinetic
model is no longer a first order reaction. For reactions other than first order, RTD data alone is
not sufficient to predict conversion. In these cases, the mixing of molecules must be known in
addition to how long each molecule spends in the reactor. Consequently, mixing models that
represent the mixing inside the reactor must be applied. The overall goal is to use the following
equation: RTD data + Kinetics + Model = Prediction. It is our job to choose the model that best
combines the conflicting goals of mathematical simplicity and physical realism. For a given
reactor, it is very common to test several model assumptions and make a comparison. We are
planning to try the following models and find the best one to assess the NREL reactor:
Segregation model, Maximum mixedness model, Tanks-in-series model and Dispersion model.

142
Bibliography
Abatzoglou, N., Bouchard, J., Chornet, E., & Overend, R. P. (1986). Dilute acid
depolymerization of cellulose in aqueous phase: experimental evidence of the significant
presence of soluble oligomeric intermediates. The Canadian Journal of Chemical
Engineering, 64(5), 781-786.
Abatzoglou, N., Chornet, E., Belkacemi, K., & Overend, R. P. (1992). Phenomenological
kinetics of complex systems: the development of a generalized severity parameter and its
application to lignocellulosics fractionation. Chemical Engineering Science, 47(5), 1109-
1122.
Albertson, D. M., & Pope, K. M. (1999). Paper sludge-waste disposal problem or energy
opportunity. In PROCESS AND PRODUCT QUALITY CONFERENCE AND TRADE
FAIR (Vol. 2, pp. 779-786).
Al-Dajani, W. W., & Tschirner, U. W. (2008). Pre-extraction of hemicelluloses and subsequent
Kraft pulping. Part I: alkaline extraction. Tappi J, 7(6), 3-8.
Allen, S. G., Kam, L. C., Zemann, A. J., & Antal, M. J. (1996). Fractionation of sugar cane with
hot, compressed, liquid water. Industrial & Engineering Chemistry Research, 35(8),
2709-2715.
Allen, S. G., Schulman, D., Lichwa, J., Antal, M. J., Jennings, E., & Elander, R. (2001). A
comparison of aqueous and dilute-acid single-temperature pretreatment of yellow poplar
sawdust. Industrial & engineering chemistry research, 40(10), 2352-2361.
Aristidou, A., & Penttilä, M. (2000). Metabolic engineering applications to renewable resource
utilization. Current Opinion in Biotechnology, 11(2), 187-198.
Aspinall, G. O. (1980). Chemistry of cell wall polysaccharides. The Biochemistry of plants: a
comprehensive treatise (USA).
Auras, R. A., Lim, L. T., Selke, S. E., & Tsuji, H. (Eds.). (2011). Poly (lactic acid): synthesis,
structures, properties, processing, and applications (Vol. 10). John Wiley & Sons.
BeMiller, J. N. (1966). Acid-catalyzed hydrolysis of glycosides. Advances in carbohydrate
chemistry and biochemistry, 22, 25-108.
Bhandari, N., Macdonald, D. G., & Bakhshi, N. N. (1984). Kinetic studies of corn stover
saccharification using sulphuric acid. Biotechnology and bioengineering, 26(4), 320-327.
Biermann, C. J. (1993). Essentials of pulping and papermaking. Academic press.
Bobleter, O. (1994). Hydrothermal degradation of polymers derived from plants. Progress in
Polymer Science, 19(5), 797-841.

143
Boeriu, C. G., Bravo, D., Gosselink, R. J., & van Dam, J. E. (2004). Characterisation of
structure-dependent functional properties of lignin with infrared spectroscopy. Industrial
crops and products, 20(2), 205-218.
Bouchoux, A., Roux-de Balmann, H., & Lutin, F. (2006). Investigation of nanofiltration as a
purification step for lactic acid production processes based on conventional and bipolar
electrodialysis operations. Separation and purification technology, 52(2), 266-273.
Bounie, D. (1988). Modelling of the flow pattern in a twin-screw extruder through residence-
time distribution experiments. Journal of food engineering, 7(3), 223-246.
Boussaid, A., Cai, Y., Robinson, J., Gregg, D. J., Nguyen, Q., & Saddler, J. N. (2001). Sugar
Recovery and Fermentability of Hemicellulose Hydrolysates from Steam‐ Exploded
Softwoods Containing Bark. Biotechnology progress, 17(5), 887-892.
Bungay, H. (1992). Product opportunities for biomass refining. Enzyme and microbial
technology, 14(6), 501-507.
Buranov, A. U., & Mazza, G. (2008). Lignin in straw of herbaceous crops. Industrial crops and
products, 28(3), 237-259.
Bustos, G., Moldes, A. B., Cruz, J. M., & Domínguez, J. M. (2004). Production of fermentable
media from vine‐trimming wastes and bioconversion into lactic acid by Lactobacillus
pentosus. Journal of the Science of Food and Agriculture, 84(15), 2105-2112.
Carrasco, F., & Roy, C. (1992). Kinetic study of dilute-acid prehydrolysis of xylan-containing
biomass. Wood Science and Technology, 26(3), 189-208.
Carvalheiro, F., Duarte, L. C., & Gírio, F. M. (2008). Hemicellulose biorefineries: a review on
biomass pretreatments.
Carvalheiro, F., Esteves, M. P., Parajó, J. C., Pereira, H., & Gırio, F. M. (2004). Production of
oligosaccharides by autohydrolysis of brewery’s spent grain. Bioresource Technology,
91(1), 93-100.
Chen, R., Lee, Y. Y., & Torget, R. (1996, January). Kinetic and Modeling Investigationon on
Two-Stage Reverse-Flow Reactoras Applied to Dilute-Acid Pretreatment of Agricultural
Residues. In Seventeenth Symposium on Biotechnology for Fuels and Chemicals (pp.
133-146). Humana Press.
Choi, C. H., Um, B. H., & Oh, K. K. (2013). The influence of screw configuration on the
pretreatment performance of a continuous twin screw-driven reactor (CTSR).
Bioresource technology, 132, 49-56.
Chopin, A. (1993). Organization and regulation of genes for amino acid biosynthesis in lactic
acid bacteria. FEMS microbiology reviews, 12(1), 21-37.

144
Conner, A. H. (1984). Kinetic modeling of hardwood prehydrolysis. Part I. Xylan removal by
water prehydrolysis. Wood and fiber science, 16(2), 268-277.
Conner, A. H., & Lorenz, L. F. (1986). Kinetic modeling of hardwood prehydrolysis. Part III.
Water and dilute acetic acid prehydrolysis of southern red oak. Wood and Fiber Science,
18(2), 248-263.
Converse, A. O., Kwarteng, I. K., Grethlein, H. E., & Ooshima, H. (1989). Kinetics of
thermochemical pretreatment of lignocellulosic materials. Applied Biochemistry and
Biotechnology, 20(1), 63-78.
Datta, R., Tsai, S. P., Bonsignore, P., Moon, S. H., & Frank, J. R. (1995). Technological and
economic potential of poly (lactic acid) and lactic acid derivatives. FEMS Microbiology
Reviews, 16(2‐3), 221-231.
De Sisti, Mike (12 December 2012). "China's Paper Operation". Pulitzer Center on Crisis
Reporting. Retrieved 13 April 2013.
Duarte, L. C., Carvalheiro, F., Lopes, S., Marques, S., Parajo, J. C., & Gírio, F. M. (2004,
January). Comparison of two posthydrolysis processes of brewery’s spent grain
autohydrolysis liquor to produce a pentose-containing culture medium. In Proceedings of
the Twenty-Fifth Symposium on Biotechnology for Fuels and Chemicals Held May 4–7,
2003, in Breckenridge, CO (pp. 1041-1058). Humana Press.
Duarte, L. C., Silva-Fernandes, T., Carvalheiro, F., & Gírio, F. M. (2009). Dilute acid hydrolysis
of wheat straw oligosaccharides. Applied biochemistry and biotechnology, 153(1-3), 116-
126.
EATON, A. K. (1871). U.S. Patent No. 119,224. Washington, DC: U.S. Patent and Trademark
Office.
Eggeman, T., & Elander, R. T. (2005). Process and economic analysis of pretreatment
technologies. Bioresource technology, 96(18), 2019-2025.
Eken-Saraçoğlu, N., Mutlu, S. F., Dilmaç, G., & Çavuşoğlu, H. (1998). A comparative kinetic
study of acidic hemicellulose hydrolysis in corn cob and sunflower seed hull. Bioresource
technology, 65(1), 29-33.
Esteghlalian, A., Hashimoto, A. G., Fenske, J. J., & Penner, M. H. (1997). Modeling and
optimization of the dilute-sulfuric-acid pretreatment of corn stover, poplar and
switchgrass. Bioresource Technology, 59(2), 129-136.
Fan, L. T., Lee, Y. H., & Beardmore, D. H. (1980). Mechanism of the enzymatic hydrolysis of
cellulose: effects of major structural features of cellulose on enzymatic hydrolysis.
Biotechnology and Bioengineering, 22(1), 177-199.

145
Fan, L. T., Lee, Y. H., & Gharpuray, M. M. (1982). The nature of lignocellulosics and their
pretreatments for enzymatic hydrolysis. In Microbial reactions (pp. 157-187). Springer
Berlin Heidelberg.
Galbe, M., Lidén, G., & Zacchi, G. (2005). Production of ethanol from biomass-Research in
Sweden. Journal of Scientific and Industrial Research, 64(11), 905.
Garde, A., Jonsson, G., Schmidt, A. S., & Ahring, B. K. (2002). Lactic acid production from
wheat straw hemicellulose hydrolysate by Lactobacillus pentosus and Lactobacillus
brevis. Bioresource Technology, 81(3), 217-223.
Garrote, G., Domı́nguez, H., & Parajó, J. C. (2001a). Generation of xylose solutions from
Eucalyptus globulus wood by autohydrolysis–posthydrolysis processes: posthydrolysis
kinetics. Bioresource Technology, 79(2), 155-164.
Garrote, G., Domínguez, H., & Parajó, J. C. (2001b). Manufacture of xylose-based fermentation
media from corncobs by posthydrolysis of autohydrolysis liquors. Applied biochemistry
and biotechnology, 95(3), 195-207.
Garrote, G., Domı́nguez, H., & Parajo, J. C. (2001c). Kinetic modelling of corncob
autohydrolysis. Process Biochemistry, 36(6), 571-578.
Gierer, J. (1980). Chemical aspects of Kraft pulping. Wood Science and Technology, 14(4), 241-
266.
Glassner, D., Hettenhaus, J., & Schechinger, T. (1998, October). Corn stover collection project.
In BioEnergy’98—Expanding Bioenergy Partnerships: Proceedings (Vol. 2, pp. 1100-
1110).
Goldstein, I. S. (1981). Organic chemicals from biomass. Organic chemicals from biomass.
Gong, C. S., Cao, N. J., Du, J., & Tsao, G. T. (1999). Ethanol production from renewable
resources. In Recent progress in bioconversion of lignocellulosics (pp. 207-241).
Springer Berlin Heidelberg.
Green, M., Kimchie, S., Malester, A. I., Rugg, B., & Shelef, G. (1988). Utilization of municipal
solid wastes (MSW) for alcohol production. Biological wastes, 26(4), 285-295.
Grethlein, H. E., Allen, D. C., & Converse, A. O. (1984). A comparative study of the enzymatic
hydrolysis of acid‐pretreated white pine and mixed hardwood. Biotechnology and
bioengineering, 26(12), 1498-1505.
Grohmann, K., Torget, R., & Himmel, M. (1986a). Optimization of dilute acid pretreatment of
biomass. In Biotechnology and bioengineering symposium (No. 15, pp. 59-80). Wiley.
Grohmann, K., Torget, R., & Himmel, M. (1986b). Dilute acid pretreatment of biomass at high
solids concentrations.

146
Guo, G. L., Chen, W. H., Chen, W. H., Men, L. C., & Hwang, W. S. (2008). Characterization of
dilute acid pretreatment of silvergrass for ethanol production. Bioresource Technology,
99(14), 6046-6053.
Hallac, B. B., Sannigrahi, P., Pu, Y., Ray, M., Murphy, R. J., & Ragauskas, A. J. (2010). Effect
of ethanol organosolv pretreatment on enzymatic hydrolysis of Buddleja davidii stem
biomass. Industrial & Engineering Chemistry Research, 49(4), 1467-1472.
Hofvendahl, K., & Hahn–Hägerdal, B. (2000). Factors affecting the fermentative lactic acid
production from renewable resources1. Enzyme and microbial technology, 26(2), 87-107.
Holten, C. H. (1971). Lactic acid. Properties and chemistry of lactic acid and derivatives.
Weinheim/Bergstr., W. Germany, Verlag Chemie GmbH.
Hsu, T. A., Himmel, M., Schell, D., Farmer, J., & Berggren, M. (1996, January). Design and
initial operation of a high-solids, pilot-scale reactor for dilute-acid pretreatment of
lignocellulosic biomass. In Seventeenth Symposium on Biotechnology for Fuels and
Chemicals (pp. 3-18). Humana Press.
Hsu, T. C., Guo, G. L., Chen, W. H., & Hwang, W. S. (2010). Effect of dilute acid pretreatment
of rice straw on structural properties and enzymatic hydrolysis. Bioresource technology,
101(13), 4907-4913.
Iyer, P. V., Thomas, S., & Lee, Y. Y. (2000). High-yield fermentation of pentoses into lactic acid.
Applied biochemistry and biotechnology, 84(1-9), 665-677.
Jacobsen, S. E., & Wyman, C. E. (2000, January). Cellulose and hemicellulose hydrolysis
models for application to current and novel pretreatment processes. In Twenty-First
Symposium on Biotechnology for Fuels and Chemicals (pp. 81-96). Humana Press.
Jacobsen, S. E., & Wyman, C. E. (2002). Xylose monomer and oligomer yields for uncatalyzed
hydrolysis of sugarcane bagasse hemicellulose at varying solids concentration. Industrial
& engineering chemistry research, 41(6), 1454-1461.
Janssen, L. P. B. M., Hollander, R. W., Spoor, M. W., & Smith, J. M. (1979). Residence time
distributions in a plasticating twin screw extruder. AIChE Journal, 25(2), 345-351.
Jem, K. J., van der Pol, J. F., & de Vos, S. (2010). Microbial lactic acid, its polymer poly (lactic
acid), and their industrial applications. In Plastics from bacteria (pp. 323-346). Springer
Berlin Heidelberg.
Jensen, J., Morinelly, J., Aglan, A., Mix, A., & Shonnard, D. R. (2008). Kinetic characterization
of biomass dilute sulfuric acid hydrolysis: Mixtures of hardwoods, softwood, and
switchgrass. AIChE journal, 54(6), 1637-1645.
John, R. P., Nampoothiri, K. M., & Pandey, A. (2007). Fermentative production of lactic acid
from biomass: an overview on process developments and future perspectives. Applied
Microbiology and Biotechnology, 74(3), 524-534.
147
Kabel, M. A., Carvalheiro, F., Garrote, G., Avgerinos, E., Koukios, E., Parajó, J. C., ... &
Voragen, A. G. J. (2002). Hydrothermally treated xylan rich by-products yield different
classes of xylo-oligosaccharides. Carbohydrate Polymers, 50(1), 47-56.
Kačuráková, M., Belton, P. S., Wilson, R. H., Hirsch, J., & Ebringerová, A. (1998). Hydration
properties of xylan‐type structures: an FTIR study of xylooligosaccharides. Journal of
the Science of Food and Agriculture, 77(1), 38-44.
Kačuráková, M., Ebringerova, A., Hirsch, J., & Hromadkova, Z. (1994). Infrared study of
arabinoxylans. Journal of the Science of Food and Agriculture, 66(3), 423-427.
Kadam, K. L., & McMillan, J. D. (2003). Availability of corn stover as a sustainable feedstock
for bioethanol production. Bioresource Technology, 88(1), 17-25.
Kadam, K. L.; Hsu, T., 1997. Making a Business from Biomass in Energy, Environment,
Chemicals, Fibers and Materials, Proceedings of the Biomass Conference of the
Americas, 3rd, Montreal, Aug. 24-29, 1997, 2 1079-1089.
Kalman, G., Varga, E., & Reczey, K. (2002). Dilute sulphuric acid pretreatment of corn stover at
long residence times. Chemical and biochemical engineering quarterly, 16(4), 151-157.
Kamiyama, Y., & Sakai, Y. (1979). Rate of hydrolysis of xylo-oligosaccharides in dilute sulfuric
acid. Carbohydrate Research, 73(1), 151-158.
Kang, L., Lee, Y. Y., Yoon, S. H., Smith, A. J., & Krishnagopalan, G. A. (2012). Ethanol
production from the mixture of hemicellulose prehydrolysate and paper sludge.
BioResources, 7(3).
Kang, L., Wang, W., & Lee, Y. Y. (2010). Bioconversion of Kraft paper mill sludges to ethanol
by SSF and SSCF. Applied biochemistry and biotechnology, 161(1-8), 53-66.
Kazi, F. K., Fortman, J. A., Anex, R. P., Hsu, D. D., Aden, A., Dutta, A., & Kothandaraman, G.
(2010). Techno-economic comparison of process technologies for biochemical ethanol
production from corn stover. Fuel, 89, S20-S28.
Keshwani, D. R., & Cheng, J. J. (2009). Switchgrass for bioethanol and other value-added
applications: a review. Bioresource technology, 100(4), 1515-1523.
Kharas, G. B., Sanchez-Riera, F., & Severson, D. K. (1994). Polymers of lactic acid. Plastics
from microbes: microbial synthesis of polymers and polymer precursors. Hanser
Publishers, Munich, Germany, 93-137.
Kim, J. W., & Mazza, G. (2008). Optimization of phosphoric acid catalyzed fractionation and
enzymatic digestibility of flax shives. Industrial crops and products, 28(3), 346-355.
Kim, S. B., & Lee, Y. Y. (1986). Kinetics in acid-catalyzed hydrolysis of hardwood
hemicellulose.

148
Kirk, T. K., & Farrell, R. L. (1987). Enzymatic" combustion": the microbial degradation of
lignin. Annual Reviews in Microbiology, 41(1), 465-501.
Knappert, D., Grethlein, H., & Converse, A. (1981, January). Partial acid hydrolysis of poplar
wood as a pretreatment for enzymatic hydrolysis. In Biotechnol. Bioeng. Symp.;(United
States) (Vol. 11, No. CONF-810554-). Dartmouth Coll., Hanover, NH.
KOBAYASHI, T., & SAKAI, Y. (1953). intended to describe the experiments con ducted on the
kinetics of hardwood pentosan hydrolysis in dilute sulfuric acid concentra. Ind. Eng, 27,
314.
Kobayashi, T., & Sakai, Y. (1956). Hydrolysis rate of pentosan of hardwood in dilute sulfuric
acid. Journal of the Agricultural Chemical Society of Japan, 20(1), 1-7.
Kothari, U. D., & Lee, Y. Y. (2011). Inhibition effects of dilute-acid prehydrolysate of corn
stover on enzymatic hydrolysis of solka floc. Applied biochemistry and biotechnology,
165(5-6), 1391-1405.
Kumar, R., & Wyman, C. E. (2009). Effect of enzyme supplementation at moderate cellulase
loadings on initial glucose and xylose release from corn stover solids pretreated by
leading technologies. Biotechnology and bioengineering, 102(2), 457-467.
Lark, N., Xia, Y., Qin, C. G., Gong, C. S., & Tsao, G. T. (1997). Production of ethanol from
recycled paper sludge using cellulase and yeast, Kluveromyces marxianus. Biomass and
Bioenergy, 12(2), 135-143.
Larsson, S., Palmqvist, E., Hahn-Hägerdal, B., Tengborg, C., Stenberg, K., Zacchi, G., &
Nilvebrant, N. O. (1999a). The generation of fermentation inhibitors during dilute acid
hydrolysis of softwood. Enzyme and Microbial Technology, 24(3), 151-159.
Larsson, S., Reimann, A., Nilvebrant, N. O., & Jönsson, L. J. (1999b). Comparison of different
methods for the detoxification of lignocellulose hydrolyzates of spruce. Applied
Biochemistry and Biotechnology, 77(1-3), 91-103.
Lau, M. W., & Dale, B. E. (2009). Cellulosic ethanol production from AFEX-treated corn stover
using Saccharomyces cerevisiae 424A (LNH-ST). Proceedings of the National Academy
of Sciences, 106(5), 1368-1373.
Lavigne, A., & Powers, S. E. (2007). Evaluating fuel ethanol feedstocks from energy policy
perspectives: A comparative energy assessment of corn and corn stover. Energy Policy,
35(11), 5918-5930.
Lee, Y. Y., & McCaskey, T. A. (1983). Hemicellulose hydrolysis and fermentation of resulting
pentoses to ethanol. Tappi;(United States), 66(5).
Lee, Y. Y., Iyer, P., & Torget, R. W. (1999). Dilute-acid hydrolysis of lignocellulosic biomass.
In Recent Progress in Bioconversion of Lignocellulosics (pp. 93-115). Springer Berlin
Heidelberg.
149
Lee, Y. Y., Lin, C. M., Johnson, T., & Chambers, R. P. (1978, January). Selective hydrolysis of
hardwood hemicellulose by acids. In Biotechnol. Bioeng. Symp.;(United States) (Vol. 8).
Auburn Univ., AL.
Litchfield, J. H. (1996). Microbiological production of lactic acid. Advances in applied
microbiology, 42, 45-95.
Lloyd, T. A., & Wyman, C. E. (2004, January). Predicted effects of mineral neutralization and
bisulfate formation on hydrogen ion concentration for dilute sulfuric acid pretreatment. In
Proceedings of the Twenty-Fifth Symposium on Biotechnology for Fuels and Chemicals
Held May 4–7, 2003, in Breckenridge, CO (pp. 1013-1022). Humana Press.
Lloyd, T. A., & Wyman, C. E. (2005). Combined sugar yields for dilute sulfuric acid
pretreatment of corn stover followed by enzymatic hydrolysis of the remaining solids.
Bioresource technology, 96(18), 1967-1977.
Mabee, W. E., Gregg, D. J., Arato, C., Berlin, A., Bura, R., Gilkes, N., ... & Saddler, J. N. (2006).
Updates on softwood-to-ethanol process development. Applied biochemistry and
biotechnology, 129(1-3), 55-70.
Malester, I. A., Green, M., & Shelef, G. (1992). Kinetics of dilute acid hydrolysis of cellulose
originating from municipal solid wastes. Industrial & engineering chemistry research,
31(8), 1998-2003.
Maloney, M. T., Chapman, T. W., & Baker, A. J. (1985). Dilute acid hydrolysis of paper birch:
Kinetics studies of xylan and acetyl ‐ group hydrolysis. Biotechnology and
bioengineering, 27(3), 355-361.
Maloney, M. T., Chapman, T. W., & Baker, A. J. (1986). An engineering analysis of the
production of xylose by dilute acid hydrolysis of hardwood hemicellulose. Biotechnology
progress, 2(4), 192-202.
Marques, S., Santos, J. A., Gírio, F. M., & Roseiro, J. C. (2008). Lactic acid production from
recycled paper sludge by simultaneous saccharification and fermentation. Biochemical
engineering journal, 41(3), 210-216.
Martinez, A., Rodriguez, M. E., Wells, M. L., York, S. W., Preston, J. F., & Ingram, L. O. (2001).
Detoxification of dilute acid hydrolysates of lignocellulose with lime. Biotechnology
Progress, 17(2), 287-293.
Martinez, A., Rodriguez, M. E., York, S. W., Preston, J. F., & Ingram, L. O. (2000). Effects of
Ca (OH) 2 treatments (“overliming”) on the composition and toxicity of bagasse
hemicellulose hydrolysates. Biotechnology and Bioengineering, 69(5), 526-536.
McCaskey, T. A., Zhou, S. D., Britt, S. N., & Strickland, R. (1994). Bioconversion of municipal
solid waste to lactic acid byLactobacillus species. Applied biochemistry and
biotechnology, 45(1), 555-568.

150
McMillan, J. D. (1994, January). Conversion of hemicellulose hydrolyzates to ethanol. In ACS
Symposium Series (Vol. 566, pp. 411-437). Washington, DC: American Chemical
Society.
Mehlberg, R., & Tsao, G. T. (1979, September). Low liquid hemicellulose hydrolysis of
hydrochloric acid. In 178th ACS National Meeting, Washington, DC.
Mosier, N., Wyman, C., Dale, B., Elander, R., Lee, Y. Y., Holtzapple, M., & Ladisch, M. (2005).
Features of promising technologies for pretreatment of lignocellulosic biomass.
Bioresource technology, 96(6), 673-686.
Moure, A., Gullón, P., Domínguez, H., & Parajó, J. C. (2006). Advances in the manufacture,
purification and applications of xylo-oligosaccharides as food additives and
nutraceuticals. Process Biochemistry, 41(9), 1913-1923.
Nabarlatz, D., Farriol, X., & Montane, D. (2004). Kinetic modeling of the autohydrolysis of
lignocellulosic biomass for the production of hemicellulose-derived oligosaccharides.
Industrial & engineering chemistry research, 43(15), 4124-4131.
Nabarlatz, D., Montané, D., Kardošová, A., Bekešová, S., Hříbalová, V., & Ebringerová, A.
(2007). Almond shell xylo-oligosaccharides exhibiting immunostimulatory activity.
Carbohydrate research, 342(8), 1122-1128.
Nee, C. I., & Yee, W. F. (1976). Hydrolysis of pentosans in bagasse pith. Journal of Applied
Chemistry and Biotechnology, 26(1), 283-287.
Nelson, D. L., Lehninger, A. L., & Cox, M. M. (2008). Lehninger principles of biochemistry.
Macmillan.
Neureiter, M., Danner, H., Madzingaidzo, L., Miyafuji, H., Thomasser, C., Bvochora, J., &
Braun, R. (2004). Lignocellulose feedstocks for the production of lactic acid. Chemical
and biochemical engineering quarterly, 18(1), 55-64.
Neureiter, M., Danner, H., Thomasser, C., Saidi, B., & Braun, R. (2002). Dilute-acid hydrolysis
of sugarcane bagasse at varying conditions. In Biotechnology for Fuels and Chemicals
(pp. 49-58). Humana Press.
Nguyen, Q. A., Tucker, M. P., Boynton, B. L., Keller, F. A., & Schell, D. J. (1998). Dilute Acid
Pretreatment of Softwoods Scientific Note. In Biotechnology for Fuels and Chemicals
(pp. 77-87). Humana Press.
Nguyen, Q. A., Tucker, M. P., Keller, F. A., & Eddy, F. P. (2000, January). Two-stage dilute-
acid pretreatment of softwoods. In Twenty-first Symposium on Biotechnology for Fuels
and Chemicals (pp. 561-576). Humana Press.
Nikitin, N. I. (1966). The chemistry of cellulose and wood.

151
NREL, 2008. Laboratory Analytical Procedure (LAP), National Renewable Energy
Laboratory,Golden,CO. Available from:
http://www.nrel.gov/biomass/analytical_procedures.html.
Oberlehner, J., Cassagnau, P., & Michel, A. (1994). Local residence time distribution in a twin
screw extruder. Chemical engineering science, 49(23), 3897-3907.
Öhgren, K., Bengtsson, O., Gorwa-Grauslund, M. F., Galbe, M., Hahn-Hägerdal, B., & Zacchi,
G. (2006). Simultaneous saccharification and co-fermentation of glucose and xylose in
steam-pretreated corn stover at high fiber content with Saccharomyces cerevisiae
TMB3400. Journal of biotechnology, 126(4), 488-498.
Öhgren, K., Rudolf, A., Galbe, M., & Zacchi, G. (2006). Fuel ethanol production from steam-
pretreated corn stover using SSF at higher dry matter content. Biomass and Bioenergy,
30(10), 863-869.
Owen, N. L., & Thomas, D. W. (1989). Infrared Studies of "Hard" and "Soft" Woods. Applied
spectroscopy, 43(3), 451-455.
Palmqvist, E., & Hahn-Hägerdal, B. (2000a). Fermentation of lignocellulosic hydrolysates. I:
inhibition and detoxification. Bioresource Technology, 74(1), 17-24.
Palmqvist, E., & Hahn-Hägerdal, B. (2000b). Fermentation of lignocellulosic hydrolysates. II:
inhibitors and mechanisms of inhibition. Bioresource technology, 74(1), 25-33.
Pandey, A. (2003). Solid-state fermentation. Biochemical Engineering Journal, 13(2), 81-84.
Parajo, J. C., Alonso, J. L., & Moldes, A. B. (1997). Production of lactic acid from lignocellulose
in a single stage of hydrolysis and fermentation. Food Biotechnology, 11(1), 45-58.
Patel, M., Ou, M., Ingram, L. O., & Shanmugam, K. T. (2004). Fermentation of sugar cane
bagasse hemicellulose hydrolysate to l (+)-lactic acid by a thermotolerant acidophilic
Bacillus sp. Biotechnology letters, 26(11), 865-868.
Perlack, R. D., Eaton, L. M., Turhollow Jr, A. F., Langholtz, M. H., Brandt, C. C., Downing, M.
E., ... & Lightle, D. (2011). US billion-ton update: biomass supply for a bioenergy and
bioproducts industry.
Prevention, I. P. (2001). Control (IPPC): Reference Document on Best Available Techniques in
the Pulp and Paper Industry. European Commission, Brussels.
Puaux, J. P., Bozga, G., & Ainser, A. (2000). Residence time distribution in a corotating twin-
screw extruder. Chemical engineering science, 55(9), 1641-1651.
Puri, V. P. (1984). Effect of crystallinity and degree of polymerization of cellulose on enzymatic
saccharification. Biotechnology and Bioengineering, 26(10), 1219-1222.

152
Ranganathan, S., MacDonald, D. S., & Bakhshi, N. N. (1985). Kinetic studies of corn stover
saccharification using sulfuric acid. Can. J. Chem. Eng, 63, 840.
Roberto, I. C., Mussatto, S. I., & Rodrigues, R. C. (2003). Dilute-acid hydrolysis for
optimization of xylose recovery from rice straw in a semi-pilot reactor. Industrial Crops
and Products, 17(3), 171-176.
Roberto, I. C., Mussatto, S. I., & Rodrigues, R. C. (2003). Dilute-acid hydrolysis for
optimization of xylose recovery from rice straw in a semi-pilot reactor. Industrial Crops
and Products, 17(3), 171-176.
Rugg, B. A., & Stanton, R. (1982). U.S. Patent No. 4,363,671. Washington, DC: U.S. Patent and
Trademark Office.
Rugg, B., & Brenner, W. (1982). Optimization of the NYU continuous cellulose hydrolysis
process. SERI Final Report.
Rugg, B., Armstrong, P., & Stanton, R. (1981). The New York University continuous acid
hydrolysis process: hemicellulose utilization: preliminary data and economics for ethanol
production [Biomass alcohol fuels].
Saeman, J. F. (1945). Kinetics of wood saccharification-hydrolysis of cellulose and
decomposition of sugars in dilute acid at high temperature. Industrial & Engineering
Chemistry, 37(1), 43-52.
Saha, B. C., Iten, L. B., Cotta, M. A., & Wu, Y. V. (2005a). Dilute acid pretreatment, enzymatic
saccharification, and fermentation of rice hulls to ethanol. Biotechnology Progress, 21(3),
816-822.
Saha, B. C., Iten, L. B., Cotta, M. A., & Wu, Y. V. (2005b). Dilute acid pretreatment, enzymatic
saccharification and fermentation of wheat straw to ethanol. Process Biochemistry,
40(12), 3693-3700.
Sannigrahi, P., Ragauskas, A. J., & Tuskan, G. A. (2010). Poplar as a feedstock for biofuels: a
review of compositional characteristics. Biofuels, Bioproducts and Biorefining, 4(2),
209-226.
Saska, M., & Ozer, E. (1995). Aqueous extraction of sugarcane bagasse hemicellulose and
production of xylose syrup. Biotechnology and bioengineering, 45(6), 517-523.
Saulnier, L., Marot, C., Chanliaud, E., & Thibault, J. F. (1995). Cell wall polysaccharide
interactions in maize bran. Carbohydrate polymers, 26(4), 279-287.
Schell, D. J., Farmer, J., Newman, M., & McMILLAN, J. D. (2003). Dilute-sulfuric acid
pretreatment of corn stover in pilot-scale reactor. In Biotechnology for Fuels and
Chemicals (pp. 69-85). Humana Press.
153
Schell, D. J., Walter, P. J., & Johnson, D. K. (1992). Dilute sulfuric acid pretreatment of corn
stover at high solids concentrations. Applied biochemistry and biotechnology, 34(1), 659-
665.
Schmidt, S., & Padukone, N. (1997). Production of lactic acid from wastepaper as a cellulosic
feedstock. Journal of Industrial Microbiology and Biotechnology, 18(1), 10-14.
Sheehan, J., Aden, A., Paustian, K., Killian, K., Brenner, J., Walsh, M., & Nelson, R. (2003).
Energy and environmental aspects of using corn stover for fuel ethanol. Journal of
Industrial Ecology, 7(3‐4), 117-146.
Shevchenko, S. M., Chang, K., Robinson, J., & Saddler, J. N. (2000). Optimization of
monosaccharide recovery by post-hydrolysis of the water-soluble hemicellulose
component after steam explosion of softwood chips. Bioresource technology, 72(3), 207-
211.
Sievers, D. A., Elander, R. T., Kuhn, E. M., Nagle, N. J., Tucker, M. P., & Weiss, N. D. (2009,
May). Investigating Residence Time Distribution and Effects on Performance in
Continuous Biomass Pretreatment Reactor Designs. In The 31st Symposium on
Biotechnology for Fuels and Chemicals.
Sims, R., Taylor, M., Saddler, J., & Mabee, W. (2008). From 1st-to 2nd-generation biofuel
technologies: an overview of current industry and RD&D activities. International Energy
Agency, 16-20.
Singh, R., Singh, S., Trimukhe, K. D., Pandare, K. V., Bastawade, K. B., Gokhale, D. V., &
Varma, A. J. (2005). Lignin–carbohydrate complexes from sugarcane bagasse:
Preparation, purification, and characterization. Carbohydrate polymers, 62(1), 57-66.
Sixta, H. (Ed.). (2006). Handbook of pulp. Wiley-vch.
Sjöström, E. (1993). Wood chemistry: fundamentals and applications. Gulf Professional
Publishing.
Socrates, G. (1994). Infrared characteristic group frequencies: tables and charts.
Spindler, D. D., Wyman, C. E., & Grohmann, K. (1989). Evaluation of thermotolerant yeasts in
controlled simultaneous saccharifications and fermentations of cellulose to ethanol.
Biotechnology and bioengineering, 34(2), 189-195.
Springer, E. L. (1985). Prehydrolysis of hardwoods with dilute sulfuric acid. Industrial &
engineering chemistry product research and development, 24(4), 614-623.
Springer, E. L., & Harris, J. F. (1982). Prehydrolysis of aspen wood with water and with dilute
aqueous sulfuric acid. Svensk papperstidning, 85(3), R152-R154.
154
Springer, E. L., & Harris, J. F. (1985). Procedures for determining the neutralizing capacity of
wood during hydrolysis with mineral acid solutions. Industrial & engineering chemistry
product research and development, 24(3), 485-489.
Sreenath, H. K., Moldes, A. B., Koegel, R. G., & Straub, R. J. (2001). Lactic acid production
from agriculture residues. Biotechnology letters, 23(3), 179-184.
Stewart, D. (1996). Fourier transform infrared microspectroscopy of plant tissues. Applied
Spectroscopy, 50(3), 357-365.
Stockton, B. C., Mitchell, D. J., Grohmann, K., & Himmel, M. E. (1991). Optimumβ-D-
glucosidase supplementation of cellulase for efficient conversion of cellulose to glucose.
Biotechnology letters, 13(1), 57-62.
Sun, Y., & Cheng, J. (2002). Hydrolysis of lignocellulosic materials for ethanol production: a
review. Bioresource technology, 83(1), 1-11.
Sun, Y., & Cheng, J. J. (2005). Dilute acid pretreatment of rye straw and bermudagrass for
ethanol production. Bioresource technology, 96(14), 1599-1606.
Taguchi, G. (1987). System of experimental design: engineering methods to optimize quality and
minimize costs (Vol. 1). White Plains, NY: UNIPUB/Kraus International Publications.
Takagi, M., Abe, S., Suzuki, S., Emert, G., & Yata, N. (1977, February). A method for
production of alcohol directly from cellulose using cellulase and yeast. In Bioconversion
Symposium; New Dehli, India (pp. 551-571).
Taniguchi, M., Suzuki, H., Watanabe, D., Sakai, K., Hoshino, K., & Tanaka, T. (2005).
Evaluation of pretreatment with Pleurotus ostreatus for enzymatic hydrolysis of rice
straw. Journal of bioscience and bioengineering, 100(6), 637-643.
Tatsumoto, K., Baker, J. O., Tucker, M. P., Oh, K. K., Mohagheghi, A., Grohmann, K., &
Hlmmel, M. E. (1988). Digestion of pretreated aspen substrates. Applied biochemistry
and biotechnology, 18(1), 159-174.
Thompson, D. R., & Grethlein, H. E. (1979). Design and evaluation of a plug flow reactor for
acid hydrolysis of cellulose. Industrial & Engineering Chemistry Product Research and
Development, 18(3), 166-169.
Tilman, D., Hill, J., & Lehman, C. (2006). Carbon-negative biofuels from low-input high-
diversity grassland biomass. Science, 314(5805), 1598-1600.
Torget, R. W., Kim, J. S., & Lee, Y. Y. (2000). Fundamental aspects of dilute acid
hydrolysis/fractionation kinetics of hardwood carbohydrates. 1. Cellulose hydrolysis.
Industrial & engineering chemistry research, 39(8), 2817-2825.

155
Tul'chinsky, V. M., Zurabyan, S. E., Asankozhoev, K. A., Kogan, G. A., & Khorlin, A. Y.
(1976). Study of the infrared spectra of oligosaccharides in the region 1,000-40 cm− 1.
Carbohydrate Research, 51(1), 1-8.
Varga, E., Klinke, H. B., Réczey, K., & Thomsen, A. B. (2004). High solid simultaneous
saccharification and fermentation of wet oxidized corn stover to ethanol. Biotechnology
and Bioengineering, 88(5), 567-574.
Vazquez, M. J., Alonso, J. L., Domínguez, H., & Parajó, J. C. (2001). Production of xylose-
containing fermentation media by enzymatic post-hydrolysis of oligomers produced by
corn cob autohydrolysis. World Journal of Microbiology and Biotechnology, 17(8), 817-
822.
Vickroy TB. (1985). Lactic acid. The Practice of Biotechnology: Commodity Products. In:
Blanch HW, Drew S, Wang DIC, editors. Elmsford, NY: Pergamon Press. 761–776.
Viikari, L., Tenkanen, M., Buchert, J., Rättö, M., Bailey, M., Siika-Aho, M., & Linko, M. (1993).
Hemicellulases for industrial applications. Biotechnology in Agriculture, 131-131.
Walch, E., Zemann, A., Schinner, F., Bonn, G., & Bobleter, O. (1992). Enzymatic
saccharification of hemicellulose obtained from hydrothermally pretreated sugar cane
bagasse and beech bark. Bioresource technology, 39(2), 173-177.
Wald, S., Wilke, C. R., & Blanch, H. W. (1984). Kinetics of the enzymatic hydrolysis of
cellulose. Biotechnology and bioengineering, 26(3), 221-230.
Wiley, D. F. (1985), Enzymatic hydrolysis of cellulose: mechanism and kinetics, Ph.D. thesis.
University of California, Berkley, CA, USA. P226
Wong, K. K., Tan, L. U., & Saddler, J. N. (1988). Multiplicity of beta-1, 4-xylanase in
microorganisms: functions and applications. Microbiological Reviews, 52(3), 305.
Wyman, C. E., Bain, R. L., Hinman, N. D., & Stevens, D. J. (1993). Ethanol and methanol from
cellulosic biomass. Renewable energy: sources for fuels and electricity., 865-923.
Wyman, C. E., Dale, B. E., Elander, R. T., Holtzapple, M., Ladisch, M. R., & Lee, Y. Y. (2005).
Coordinated development of leading biomass pretreatment technologies. Bioresource
technology, 96(18), 1959-1966.
Wyman, C. E., Spindler, D. D., Grohmann, K., & Lastick, S. M. (1986). Simultaneous
saccharification and fermentation of cellulose with the yeast Brettanomyces clausenii.
Xu, G. Q., Chu, J., Wang, Y. H., Zhuang, Y. P., Zhang, S. L., & Peng, H. Q. (2006).
Development of a continuous cell-recycle fermentation system for production of lactic
acid by Lactobacillus paracasei. Process Biochemistry, 41(12), 2458-2463.
Yat, S. C., Berger, A., & Shonnard, D. R. (2008). Kinetic characterization for dilute sulfuric acid
hydrolysis of timber varieties and switchgrass. Bioresource technology, 99(9), 3855-3863.

156
Yoon, S. H., Cullinan, H. T., & Krishnagopalan, G. A. (2010). Reductive modification of
alkaline pulping of southern pine, integrated with hydrothermal pre-extraction of
hemicelluloses. Industrial & Engineering Chemistry Research, 49(13), 5969-5976.
Yoon, S. H., Macewan, K., & Van Heiningen, A. (2008). Hot-water pre-extraction from loblolly
pine (Pinus taeda) in an integrated forest products biorefinery. Tappi Journal, 7(6), 27-32.
Zeikus, J. G., Lee, C., Lee, Y. E., & Saha, B. C. (1991, January). THERMOSTABLE
SACCHARIDASES-NEW SOURCES, USES, AND BIODESIGNS. In ACS Symposium
series (Vol. 460, pp. 36-51). 1155 16TH ST, NW, WASHINGTON, DC 20036: AMER
CHEMICAL SOC.
Zhang, Y. H. P. (2008). Reviving the carbohydrate economy via multi-product lignocellulose
biorefineries. Journal of industrial microbiology & biotechnology, 35(5), 367-375.
Zhang, Y. H. P., Ding, S. Y., Mielenz, J. R., Cui, J. B., Elander, R. T., Laser, M., ... & Lynd, L.
R. (2007). Fractionating recalcitrant lignocellulose at modest reaction conditions.
Biotechnology and Bioengineering, 97(2), 214-223.
Zhao, X., Cheng, K., & Liu, D. (2009). Organosolv pretreatment of lignocellulosic biomass for
enzymatic hydrolysis. Applied microbiology and biotechnology, 82(5), 815-827.
Zhu, Y., Lee, Y. Y., & Elander, R. T. (2007). Conversion of aqueous ammonia-treated corn
stover to lactic acid by simultaneous saccharification and cofermentation. Applied
biochemistry and biotechnology, 137(1-12), 721-738.
Zhu, Z., Sathitsuksanoh, N., Vinzant, T., Schell, D. J., McMillan, J. D., & Zhang, Y. H. P. (2009).
Comparative study of corn stover pretreated by dilute acid and cellulose solvent‐based
lignocellulose fractionation: Enzymatic hydrolysis, supramolecular structure, and
substrate accessibility. Biotechnology and bioengineering, 103(4), 715-724.


![A kinetic model of starch hydrolysis by [alpha]- and …kchbi.chtf.stuba.sk/upload_new/file/Miro/Proc problemy...Kinetics of malt starch hydrolysis by endogeneous a- and &amylases](https://static.fdocuments.us/doc/165x107/5e4bb072f0085830d17bafc7/a-kinetic-model-of-starch-hydrolysis-by-alpha-and-kchbichtfstubaskuploadnewfilemiroproc.jpg)