FUND MANAGER’S REPORT - ablamc.com2)(1).pdf · FUND MANAGER'S REPORT, JAN 2018 BASIC FUND...
16
FUND MANAGER’S REPORT JANUARY 2018 FUND FOCUS A Wholly Owned Subsidiary of
Transcript of FUND MANAGER’S REPORT - ablamc.com2)(1).pdf · FUND MANAGER'S REPORT, JAN 2018 BASIC FUND...
FUNDMANAGER’S
REPORTJANUARY 2018
FUNDFOCUS
A Wholly Owned Subsidiary of
FUND MANAGER'SREPORT, JAN 2018
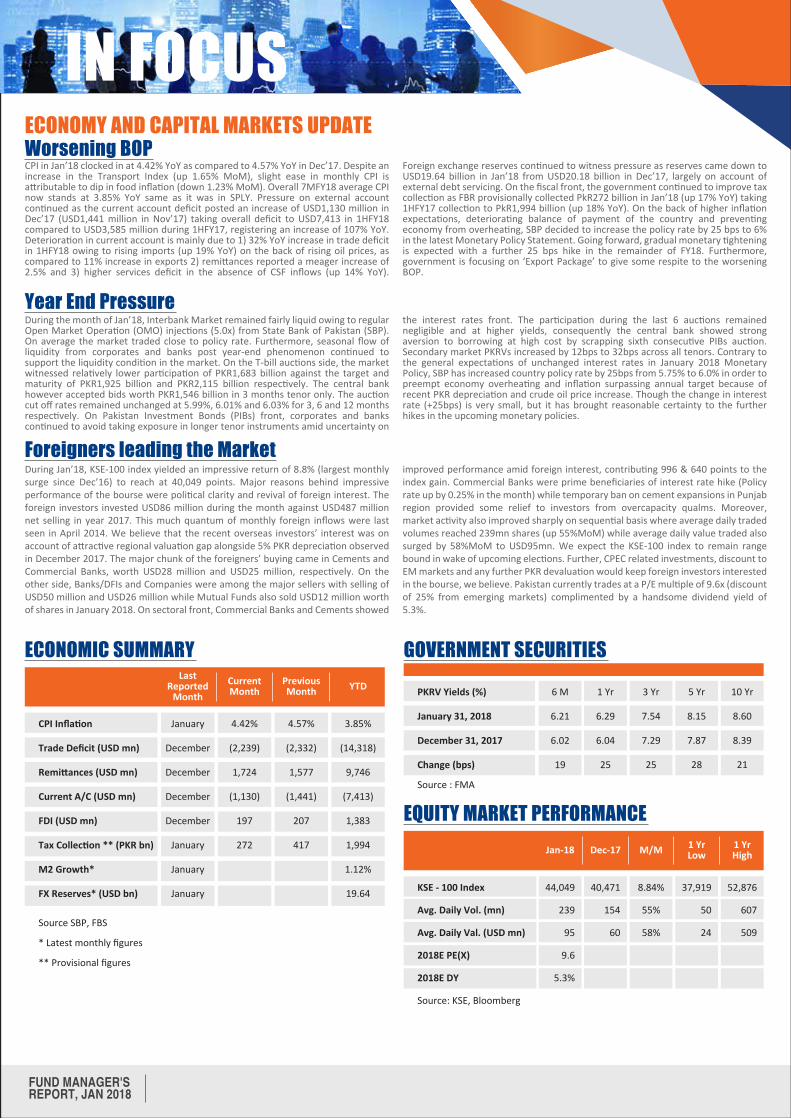
CPI in Jan’18 clocked in at 4.42% YoY as compared to 4.57% YoY in Dec’17. Despite an increase in the Transport Index (up 1.65% MoM), slight ease in monthly CPI is attributable to dip in food inflation (down 1.23% MoM). Overall 7MFY18 average CPI now stands at 3.85% YoY same as it was in SPLY. Pressure on external account continued as the current account deficit posted an increase of USD1,130 million in Dec’17 (USD1,441 million in Nov’17) taking overall deficit to USD7,413 in 1HFY18 compared to USD3,585 million during 1HFY17, registering an increase of 107% YoY. Deterioration in current account is mainly due to 1) 32% YoY increase in trade deficit in 1HFY18 owing to rising imports (up 19% YoY) on the back of rising oil prices, as compared to 11% increase in exports 2) remittances reported a meager increase of 2.5% and 3) higher services deficit in the absence of CSF inflows (up 14% YoY).
Foreign exchange reserves continued to witness pressure as reserves came down to USD19.64 billion in Jan’18 from USD20.18 billion in Dec’17, largely on account of external debt servicing. On the fiscal front, the government continued to improve tax collection as FBR provisionally collected PkR272 billion in Jan’18 (up 17% YoY) taking 1HFY17 collection to PkR1,994 billion (up 18% YoY). On the back of higher inflation expectations, deteriorating balance of payment of the country and preventing economy from overheating, SBP decided to increase the policy rate by 25 bps to 6% in the latest Monetary Policy Statement. Going forward, gradual monetary tightening is expected with a further 25 bps hike in the remainder of FY18. Furthermore, government is focusing on ‘Export Package’ to give some respite to the worsening BOP.
Worsening BOPECONOMY AND CAPITAL MARKETS UPDATE
During the month of Jan’18, Interbank Market remained fairly liquid owing to regular Open Market Operation (OMO) injections (5.0x) from State Bank of Pakistan (SBP). On average the market traded close to policy rate. Furthermore, seasonal flow of liquidity from corporates and banks post year-end phenomenon continued to support the liquidity condition in the market. On the T-bill auctions side, the market witnessed relatively lower participation of PKR1,683 billion against the target and maturity of PKR1,925 billion and PKR2,115 billion respectively. The central bank however accepted bids worth PKR1,546 billion in 3 months tenor only. The auction cut off rates remained unchanged at 5.99%, 6.01% and 6.03% for 3, 6 and 12 months respectively. On Pakistan Investment Bonds (PIBs) front, corporates and banks continued to avoid taking exposure in longer tenor instruments amid uncertainty on
the interest rates front. The participation during the last 6 auctions remained negligible and at higher yields, consequently the central bank showed strong aversion to borrowing at high cost by scrapping sixth consecutive PIBs auction. Secondary market PKRVs increased by 12bps to 32bps across all tenors. Contrary to the general expectations of unchanged interest rates in January 2018 Monetary Policy, SBP has increased country policy rate by 25bps from 5.75% to 6.0% in order to preempt economy overheating and inflation surpassing annual target because of recent PKR depreciation and crude oil price increase. Though the change in interest rate (+25bps) is very small, but it has brought reasonable certainty to the further hikes in the upcoming monetary policies.
Year End Pressure
During Jan’18, KSE-100 index yielded an impressive return of 8.8% (largest monthly surge since Dec’16) to reach at 40,049 points. Major reasons behind impressive performance of the bourse were political clarity and revival of foreign interest. The foreign investors invested USD86 million during the month against USD487 million net selling in year 2017. This much quantum of monthly foreign inflows were last seen in April 2014. We believe that the recent overseas investors’ interest was on account of attractive regional valuation gap alongside 5% PKR depreciation observed in December 2017. The major chunk of the foreigners’ buying came in Cements and Commercial Banks, worth USD28 million and USD25 million, respectively. On the other side, Banks/DFIs and Companies were among the major sellers with selling of USD50 million and USD26 million while Mutual Funds also sold USD12 million worth of shares in January 2018. On sectoral front, Commercial Banks and Cements showed
improved performance amid foreign interest, contributing 996 & 640 points to the index gain. Commercial Banks were prime beneficiaries of interest rate hike (Policy rate up by 0.25% in the month) while temporary ban on cement expansions in Punjab region provided some relief to investors from overcapacity qualms. Moreover, market activity also improved sharply on sequential basis where average daily traded volumes reached 239mn shares (up 55%MoM) while average daily value traded also surged by 58%MoM to USD95mn. We expect the KSE-100 index to remain range bound in wake of upcoming elections. Further, CPEC related investments, discount to EM markets and any further PKR devaluation would keep foreign investors interested in the bourse, we believe. Pakistan currently trades at a P/E multiple of 9.6x (discount of 25% from emerging markets) complimented by a handsome dividend yield of 5.3%.
Foreigners leading the Market
ECONOMIC SUMMARY
CPI Inflation
Trade Deficit (USD mn)
Remittances (USD mn)
Current A/C (USD mn)
FDI (USD mn)
Tax Collection ** (PKR bn)
M2 Growth*
FX Reserves* (USD bn)
January
December
December
December
December
January
January
January
4.42%
(2,239)
1,724
(1,130)
197
272
4.57%
(2,332)
1,577
(1,441)
207
417
3.85%
(14,318)
9,746
(7,413)
1,383
1,994
1.12%
19.64
LastReported
MonthCurrentMonth
PreviousMonth YTD
Source SBP, FBS
* Latest monthly figures
** Provisional figures
EQUITY MARKET PERFORMANCE
KSE - 100 Index
Avg. Daily Vol. (mn)
Avg. Daily Val. (USD mn)
2018E PE(X)
2018E DY
Source: KSE, Bloomberg
44,049
239
95
9.6
5.3%
40,471
154
60
8.84%
55%
58%
37,919
50
24
52,876
607
509
Jan-18 Dec-17 M/M 1 YrLow
1 YrHigh
IN FOCUS
GOVERNMENT SECURITIES
PKRV Yields (%)
January 31, 2018
December 31, 2017
Change (bps)
Source : FMA
6 M
6.21
6.02
19
1 Yr
6.29
6.04
25
3 Yr
7.54
7.29
25
5 Yr
8.15
7.87
28
10 Yr
8.60
8.39
21
IN FOCUS ABL INCOMEFUND
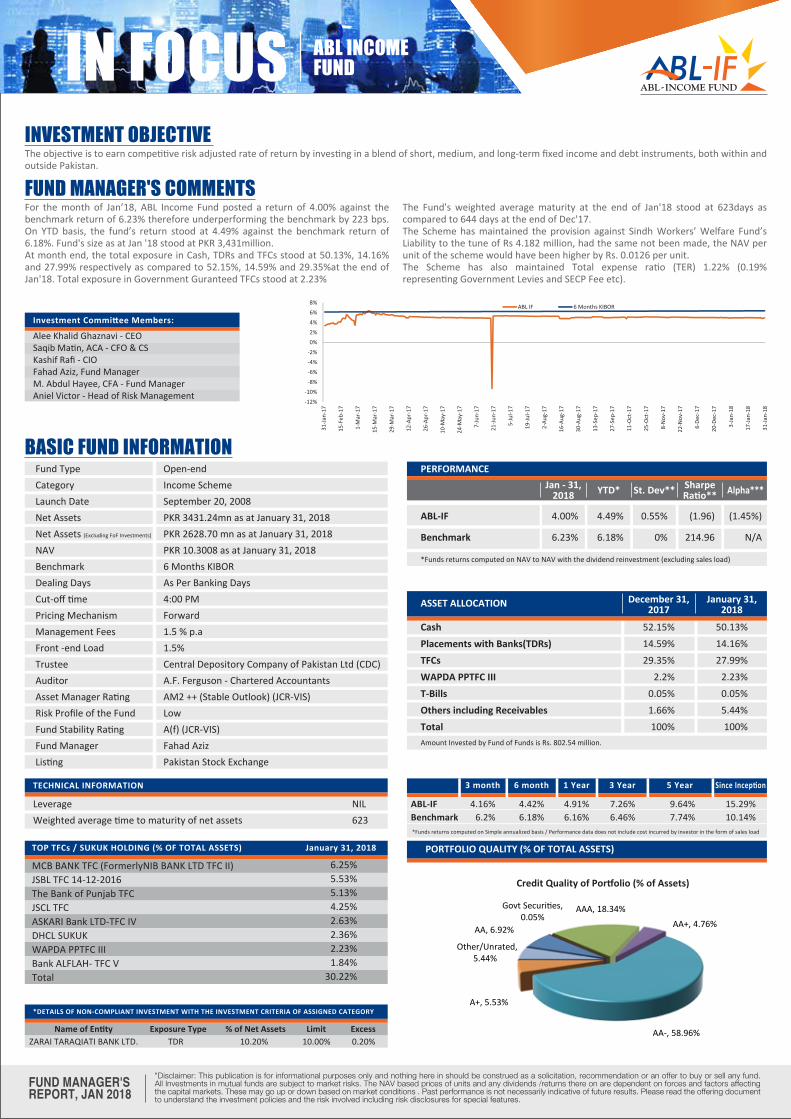
For the month of Jan’18, ABL Income Fund posted a return of 4.00% against the benchmark return of 6.23% therefore underperforming the benchmark by 223 bps. On YTD basis, the fund’s return stood at 4.49% against the benchmark return of 6.18%. Fund's size as at Jan '18 stood at PKR 3,431million.At month end, the total exposure in Cash, TDRs and TFCs stood at 50.13%, 14.16% and 27.99% respectively as compared to 52.15%, 14.59% and 29.35%at the end of Jan'18. Total exposure in Government Guranteed TFCs stood at 2.23%
The Fund's weighted average maturity at the end of Jan'18 stood at 623days as compared to 644 days at the end of Dec'17.The Scheme has maintained the provision against Sindh Workers’ Welfare Fund’s Liability to the tune of Rs 4.182 million, had the same not been made, the NAV per unit of the scheme would have been higher by Rs. 0.0126 per unit.The Scheme has also maintained Total expense ratio (TER) 1.22% (0.19% representing Government Levies and SECP Fee etc).
The objective is to earn competitive risk adjusted rate of return by investing in a blend of short, medium, and long-term fixed income and debt instruments, both within and outside Pakistan.
INVESTMENT OBJECTIVE
FUND MANAGER'S COMMENTS
Alee Khalid Ghaznavi - CEO Saqib Matin, ACA - CFO & CSKashif Rafi - CIOFahad Aziz, Fund ManagerM. Abdul Hayee, CFA - Fund ManagerAniel Victor - Head of Risk Management
Investment Committee Members:
FUND MANAGER'SREPORT, JAN 2018
BASIC FUND INFORMATIONFund TypeCategoryLaunch DateNet AssetsNet Assets (Excluding FoF Investments)
NAVBenchmarkDealing DaysCut-off timePricing MechanismManagement FeesFront -end LoadTrusteeAuditorAsset Manager RatingRisk Profile of the FundFund Stability RatingFund ManagerListing
Open-endIncome SchemeSeptember 20, 2008PKR 3431.24mn as at January 31, 2018PKR 2628.70 mn as at January 31, 2018PKR 10.3008 as at January 31, 20186 Months KIBORAs Per Banking Days4:00 PMForward1.5 % p.a1.5%Central Depository Company of Pakistan Ltd (CDC)A.F. Ferguson - Chartered AccountantsAM2 ++ (Stable Outlook) (JCR-VIS)LowA(f) (JCR-VIS)Fahad AzizPakistan Stock Exchange
"Disclaimer: This publication is for informational purposes only and nothing here in should be construed as a solicitation, recommendation or an offer to buy or sell any fund. All Investments in mutual funds are subject to market risks. The NAV based prices of units and any dividends /returns there on are dependent on forces and factors affecting the capital markets. These may go up or down based on market conditions . Past performance is not necessarily indicative of future results. Please read the offering document to understand the investment policies and the risk involved including risk disclosures for special features.
ABL-IF
Benchmark
*Funds returns computed on NAV to NAV with the dividend reinvestment (excluding sales load)
4.00%
6.23%
4.49%
6.18%
0.55%
0%
(1.96)
214.96
(1.45%)
N/A
Jan - 31,2018 YTD* St. Dev** Sharpe
Ratio** Alpha***
PERFORMANCE
3 month
ABL-IFBenchmark
4.16%6.2%
4.42%6.18%
4.91%6.16%
7.26%6.46%
9.64%7.74%
15.29%10.14%
6 month 1 Year 3 Year 5 Year Since Inception
*Funds returns computed on Simple annualized basis / Performance data does not include cost incurred by investor in the form of sales load
TECHNICAL INFORMATION
Leverage Weighted average time to maturity of net assets
NIL 623
*DETAILS OF NON-COMPLIANT INVESTMENT WITH THE INVESTMENT CRITERIA OF ASSIGNED CATEGORY
Name of Entity Exposure Type % of Net Assets Limit Excess ZARAI TARAQIATI BANK LTD. TDR 10.20% 10.00% 0.20%
TOP TFCs / SUKUK HOLDING (% OF TOTAL ASSETS) January 31, 2018
MCB BANK TFC (FormerlyNIB BANK LTD TFC II)JSBL TFC 14-12-2016The Bank of Punjab TFCJSCL TFCASKARI Bank LTD-TFC IVDHCL SUKUKWAPDA PPTFC IIIBank ALFLAH- TFC VTotal
6.25%5.53%5.13%4.25%2.63%2.36%2.23%1.84%
30.22%
CashPlacements with Banks(TDRs)TFCsWAPDA PPTFC IIIT-BillsOthers including ReceivablesTotal
52.15%14.59%29.35%
2.2%0.05%1.66%100%
50.13%14.16%27.99%
2.23%0.05%5.44%100%
December 31,2017
January 31,2018ASSET ALLOCATION
Amount Invested by Fund of Funds is Rs. 802.54 million.
PORTFOLIO QUALITY (% OF TOTAL ASSETS)
Credit Quality of Portfolio (% of Assets)
AA, 6.92%
Govt Securities, 0.05%
AAA, 18.34%AA+, 4.76%
AA-, 58.96%
A+, 5.53%
Other/Unrated, 5.44%
IN FOCUS ABL STOCKFUND
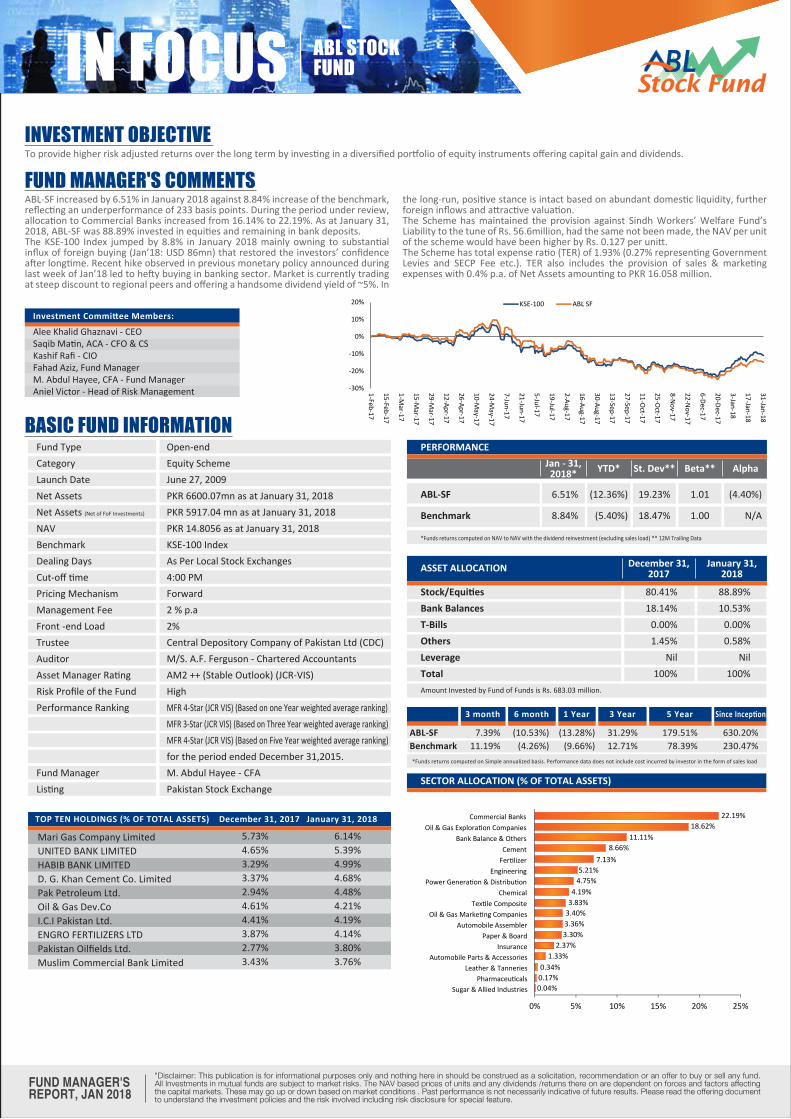
ABL-SF increased by 6.51% in January 2018 against 8.84% increase of the benchmark, reflecting an underperformance of 233 basis points. During the period under review, allocation to Commercial Banks increased from 16.14% to 22.19%. As at January 31, 2018, ABL-SF was 88.89% invested in equities and remaining in bank deposits.The KSE-100 Index jumped by 8.8% in January 2018 mainly owning to substantial influx of foreign buying (Jan’18: USD 86mn) that restored the investors’ confidence after longtime. Recent hike observed in previous monetary policy announced during last week of Jan’18 led to hefty buying in banking sector. Market is currently trading at steep discount to regional peers and offering a handsome dividend yield of ~5%. In
the long-run, positive stance is intact based on abundant domestic liquidity, further foreign inflows and attractive valuation.The Scheme has maintained the provision against Sindh Workers’ Welfare Fund’s Liability to the tune of Rs. 56.6million, had the same not been made, the NAV per unit of the scheme would have been higher by Rs. 0.127 per unitt.The Scheme has total expense ratio (TER) of 1.93% (0.27% representing Government Levies and SECP Fee etc.). TER also includes the provision of sales & marketing expenses with 0.4% p.a. of Net Assets amounting to PKR 16.058 million.
To provide higher risk adjusted returns over the long term by investing in a diversified portfolio of equity instruments offering capital gain and dividends. INVESTMENT OBJECTIVE
FUND MANAGER'S COMMENTS
FUND MANAGER'SREPORT, JAN 2018
BASIC FUND INFORMATIONOpen-endEquity SchemeJune 27, 2009PKR 6600.07mn as at January 31, 2018PKR 5917.04 mn as at January 31, 2018PKR 14.8056 as at January 31, 2018KSE-100 IndexAs Per Local Stock Exchanges4:00 PMForward2 % p.a2%Central Depository Company of Pakistan Ltd (CDC)M/S. A.F. Ferguson - Chartered AccountantsAM2 ++ (Stable Outlook) (JCR-VIS)HighMFR 4-Star (JCR VIS) (Based on one Year weighted average ranking)MFR 3-Star (JCR VIS) (Based on Three Year weighted average ranking)MFR 4-Star (JCR VIS) (Based on Five Year weighted average ranking)for the period ended December 31,2015.M. Abdul Hayee - CFAPakistan Stock Exchange
ABL-SF
Benchmark
*Funds returns computed on NAV to NAV with the dividend reinvestment (excluding sales load) ** 12M Trailing Data
6.51%
8.84%
(12.36%)
(5.40%)
19.23%
18.47%
1.01
1.00
(4.40%)
N/A
Stock/EquitiesBank BalancesT-BillsOthersLeverageTotal
80.41%18.14%
0.00%1.45%
Nil100%
88.89%10.53%
0.00%0.58%
Nil100%
December 31,2017
January 31,2018ASSET ALLOCATION
SECTOR ALLOCATION (% OF TOTAL ASSETS)
"Disclaimer: This publication is for informational purposes only and nothing here in should be construed as a solicitation, recommendation or an offer to buy or sell any fund. All Investments in mutual funds are subject to market risks. The NAV based prices of units and any dividends /returns there on are dependent on forces and factors affecting the capital markets. These may go up or down based on market conditions . Past performance is not necessarily indicative of future results. Please read the offering document to understand the investment policies and the risk involved including risk disclosure for special feature.
3 month
ABL-SFBenchmark
7.39%11.19%
(10.53%)(4.26%)
(13.28%)(9.66%)
31.29%12.71%
179.51%78.39%
630.20%230.47%
6 month 1 Year 3 Year 5 Year Since Inception
*Funds returns computed on Simple annualized basis. Performance data does not include cost incurred by investor in the form of sales load
Fund Type Category Launch Date Net Assets Net Assets (Net of FoF Investments)
NAV Benchmark Dealing Days Cut-off time Pricing Mechanism Management Fee Front -end Load Trustee Auditor Asset Manager Rating Risk Profile of the Fund Performance Ranking
Fund Manager Listing
TOP TEN HOLDINGS (% OF TOTAL ASSETS) December 31, 2017 January 31, 2018
Mari Gas Company Limited UNITED BANK LIMITED HABIB BANK LIMITED D. G. Khan Cement Co. Limited Pak Petroleum Ltd. Oil & Gas Dev.Co I.C.I Pakistan Ltd. ENGRO FERTILIZERS LTD Pakistan Oilfields Ltd. Muslim Commercial Bank Limited
6.14%5.39%4.99%4.68%4.48%4.21%4.19%4.14%3.80%3.76%
5.73%4.65%3.29%3.37%2.94%4.61%4.41%3.87%2.77%3.43%
Amount Invested by Fund of Funds is Rs. 683.03 million.
Jan - 31,2018* YTD* St. Dev** Beta** Alpha
PERFORMANCE
Alee Khalid Ghaznavi - CEO Saqib Matin, ACA - CFO & CSKashif Rafi - CIOFahad Aziz, Fund ManagerM. Abdul Hayee, CFA - Fund ManagerAniel Victor - Head of Risk Management
Investment Committee Members:
-30%
-20%
-10%
0%
10%
20%
1-Feb-17
15-Feb-17
1-Mar-17
15-Mar-17
29-Mar-17
12-Apr-17
26-Apr-17
10-May-17
24-May-17
7-Jun-17
21-Jun-17
5-Jul-17
19-Jul-17
2-Aug-17
16-Aug-17
30-Aug-17
13-Sep-17
27-Sep-17
11-Oct-17
25-Oct-17
8-Nov-17
22-Nov-17
6-Dec-17
20-Dec-17
3-Jan-18
17-Jan-18
31-Jan-18
KSE-100 ABL SF
Sugar & Allied IndustriesPharmaceuticals
Leather & TanneriesAutomobile Parts & Accessories
InsurancePaper & Board
Automobile AssemblerOil & Gas Marketing Companies
Textile CompositeChemical
Power Generation & DistributionEngineering
FertilizerCement
Bank Balance & OthersOil & Gas Exploration Companies
Commercial Banks
0% 5% 10% 15% 20% 25%
0.04%0.17%0.34%
1.33%2.37%
3.30%3.36%3.40%3.83%4.19%
4.75%5.21%
7.13%8.66%
11.11%18.62%
22.19%

IN FOCUS ABL CASHFUND
For the month of Jan'18, ABL Cash Fund posted a return of 5.26% against the benchmark return of 5.22%. On year-to-date basis, the fund posted a return of 5.34% against the benchmark return of 5.19% thereby outperforming the benchmark by 15 basis points. Fund's size as at January 31, 2018 stood at PKR 13,857.1 million.On the Asset Allocation side, exposure in cash during the month of Jan'18 stood unchanged at about 80.57% from 80.50% at the end of Dec’2017 while exposure in TDRs also remained largely unchanged at 18.60% from 18.30% at month end.Going forward the fund may shift some exposure from Cash/TDRs to short term
treasury bills in response to the 25bps increase in policy rate.At month end, fund’s weighted average maturity stood at 7.22 days.The Scheme has maintained the provision against Sindh Workers’ Welfare Fund’s Liability to the tune of Rs. 3.526 million, had the same not been made, the NAV per unit of the scheme would have been higher by Rs. 0.0026 per unit.The Scheme has also maintained Total expense ratio (TER) 0.67% (0.12% representing Government Levies and SECP Fee etc).
The objective of ABL-CF is to provide investors, consistent returns with a high level of liquidity, through a blend of money market and sovereign debt instruments.INVESTMENT OBJECTIVE
FUND MANAGER'S COMMENTS
FUND MANAGER'SREPORT, JAN 2018
BASIC FUND INFORMATIONFund TypeCategoryLaunch DateNet AssetsNet Assets (Excluding FoF investments)
NAVBenchmark Dealing DaysCut-off timePricing MechanismManagement Fees Front -end LoadTrusteeAuditorAsset Manager RatingRisk Profile of the FundFund Stability RatingFund ManagerListing
Open-endMoney Market SchemeJuly 31, 2010PKR 13857.1 mn as at January 31, 2018PKR 13857.1 mn as at January 31, 2018PKR 10.3689 as at January 31, 201870%-Avg of 3M PKRV rates + 30% 3M Avg DepositRate of 3 AA rated banksAs Per Banking Days4:00 PMBackward10% of gross earnings subject to a minimum fee of 0.75% anda maximum fee of 1.00% of average daily net assetsNilCentral Depository Company of Pakistan Ltd (CDC)A.F. Ferguson - Chartered AccountantsAM2 ++ (Stable Outlook) (JCR-VIS)LowAA(f) (JCR-VIS)Fahad AzizPakistan Stock Exchange
ABL-CF
Benchmark
*Funds returns computed on NAV to NAV with the dividend reinvestment (excluding sales load) ** 12M Trailing Data ***3MPKRV used as RFR
5.26%
5.22%
5.34%
5.19%
0.94%
0%
0.35
(257.05)
0.95%
N/A
CashPlacements with Banks(TDRs)T-BillsOthers including ReceivablesTotal
80.5%18.3%
0%1.2%
100%
80.57%18.6%
0%0.83%
100%
December 31,2017
January 31,2018ASSET ALLOCATION
PORTFOLIO QUALITY (% OF TOTAL ASSETS)
"Disclaimer: This publication is for informational purposes only and nothing here in should be construed as a solicitation, recommendation or an offer to buy or sell any fund. All Investments in mutual funds are subject to market risks. The NAV based prices of units and any dividends /returns there on are dependent on forces and factors affecting the capital markets. These may go up or down based on market conditions . Past performance is not necessarily indicative of future results. Please read the offering document to understand the investment policies and the risk involved including risk disclosures for special features.
3 month
ABL-CF Benchmark
5.27%5.21%
5.32%5.19%
6.31%5.22%
7.75%4.66%
8.98%5.43%
11.84%6.06%
6 month 1 Year 3 Year 5 Year Since Inception
*Funds returns computed on Simple annualized basis / Performance data does not include cost incurred by investor in the form of sales load
TECHNICAL INFORMATION
*DETAILS OF NON-COMPLIANT INVESTMENT WITH THE INVESTMENT CRITERIA OF ASSIGNED CATEGORY
Leverage Weighted average time to maturity of net assets
Name of Entity Exposure Type % of Net Assets Limit Excess - - - - -
- - - - -
NIL 7.22
Amount Invested by Fund of Funds is NIL.
Credit Quality of Portfolio (% of Assets)
AA, 19.80%
AAA, 52.90%
AA+, 26.46%
Other/Unrated,0.84%
Jan - 31,2018 YTD* St. Dev** Sharpe
Ratio** Alpha***
PERFORMANCE
Alee Khalid Ghaznavi - CEO Saqib Matin, ACA - CFO & CSKashif Rafi - CIOFahad Aziz, Fund ManagerM. Abdul Hayee, CFA - Fund ManagerAniel Victor - Head of Risk Management
Investment Committee Members:
IN FOCUS ABL GOVERNMENTSECURITIES FUND
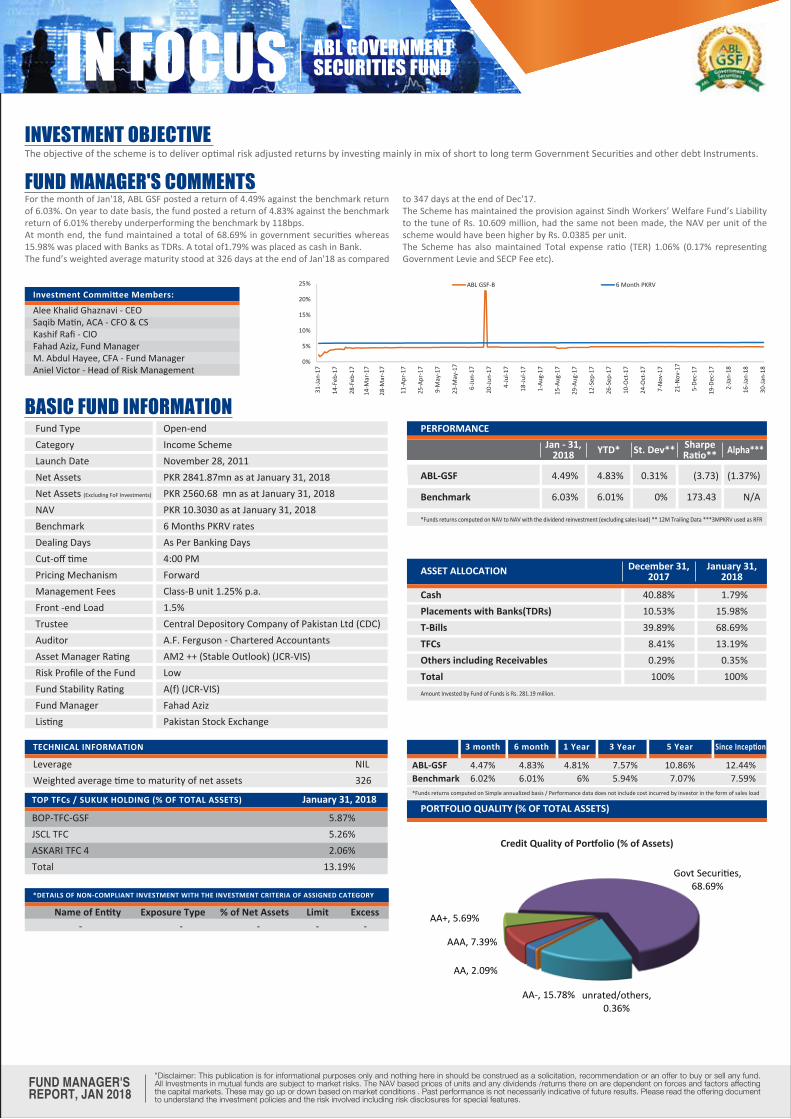
For the month of Jan'18, ABL GSF posted a return of 4.49% against the benchmark return of 6.03%. On year to date basis, the fund posted a return of 4.83% against the benchmark return of 6.01% thereby underperforming the benchmark by 118bps.At month end, the fund maintained a total of 68.69% in government securities whereas 15.98% was placed with Banks as TDRs. A total of1.79% was placed as cash in Bank.The fund’s weighted average maturity stood at 326 days at the end of Jan'18 as compared
to 347 days at the end of Dec'17.The Scheme has maintained the provision against Sindh Workers’ Welfare Fund’s Liability to the tune of Rs. 10.609 million, had the same not been made, the NAV per unit of the scheme would have been higher by Rs. 0.0385 per unit.The Scheme has also maintained Total expense ratio (TER) 1.06% (0.17% representing Government Levie and SECP Fee etc).
The objective of the scheme is to deliver optimal risk adjusted returns by investing mainly in mix of short to long term Government Securities and other debt Instruments.INVESTMENT OBJECTIVE
FUND MANAGER'S COMMENTS
FUND MANAGER'SREPORT, JAN 2018
BASIC FUND INFORMATIONFund TypeCategoryLaunch DateNet AssetsNet Assets (Excluding FoF Investments)
NAVBenchmarkDealing DaysCut-off timePricing MechanismManagement FeesFront -end LoadTrusteeAuditorAsset Manager RatingRisk Profile of the FundFund Stability RatingFund ManagerListing
Open-endIncome SchemeNovember 28, 2011PKR 2841.87mn as at January 31, 2018PKR 2560.68 mn as at January 31, 2018PKR 10.3030 as at January 31, 20186 Months PKRV ratesAs Per Banking Days4:00 PMForwardClass-B unit 1.25% p.a.1.5%Central Depository Company of Pakistan Ltd (CDC)A.F. Ferguson - Chartered AccountantsAM2 ++ (Stable Outlook) (JCR-VIS)LowA(f) (JCR-VIS)Fahad AzizPakistan Stock Exchange
CashPlacements with Banks(TDRs)T-BillsTFCsOthers including ReceivablesTotal
40.88%10.53%39.89%
8.41%0.29%100%
1.79%15.98%68.69%13.19%
0.35%100%
December 31,2017
January 31,2018ASSET ALLOCATION
Amount Invested by Fund of Funds is Rs. 281.19 million.
PORTFOLIO QUALITY (% OF TOTAL ASSETS)
"Disclaimer: This publication is for informational purposes only and nothing here in should be construed as a solicitation, recommendation or an offer to buy or sell any fund. All Investments in mutual funds are subject to market risks. The NAV based prices of units and any dividends /returns there on are dependent on forces and factors affecting the capital markets. These may go up or down based on market conditions . Past performance is not necessarily indicative of future results. Please read the offering document to understand the investment policies and the risk involved including risk disclosures for special features.
TOP TFCs / SUKUK HOLDING (% OF TOTAL ASSETS)
BOP-TFC-GSFJSCL TFCASKARI TFC 4Total
TECHNICAL INFORMATION
Leverage Weighted average time to maturity of net assets
5.87%5.26%2.06%
13.19%
NIL 326
January 31, 2018
*DETAILS OF NON-COMPLIANT INVESTMENT WITH THE INVESTMENT CRITERIA OF ASSIGNED CATEGORY
Name of Entity Exposure Type % of Net Assets Limit Excess - - - - -
3 month
ABL-GSFBenchmark
4.47%6.02%
4.83%6.01%
4.81%6%
7.57%5.94%
10.86%7.07%
12.44%7.59%
6 month 1 Year 3 Year 5 Year Since Inception
*Funds returns computed on Simple annualized basis / Performance data does not include cost incurred by investor in the form of sales load
ABL-GSF
Benchmark
*Funds returns computed on NAV to NAV with the dividend reinvestment (excluding sales load) ** 12M Trailing Data ***3MPKRV used as RFR
4.49%
6.03%
4.83%
6.01%
0.31%
0%
(3.73)
173.43
(1.37%)
N/A
Credit Quality of Portfolio (% of Assets)
AA, 2.09%
AAA, 7.39%
AA+, 5.69%
Govt Securities, 68.69%
AA-, 15.78% unrated/others, 0.36%
Jan - 31,2018 YTD* St. Dev** Sharpe
Ratio** Alpha***
PERFORMANCE
Alee Khalid Ghaznavi - CEO Saqib Matin, ACA - CFO & CSKashif Rafi - CIOFahad Aziz, Fund ManagerM. Abdul Hayee, CFA - Fund ManagerAniel Victor - Head of Risk Management
Investment Committee Members:

FUND MANAGER'SREPORT, JAN 2018
IN FOCUS ABL ISLAMICINCOME FUND
For the month of Jan’18, ABL Islamic Income Fund posted a return of 4.56% against the benchmark return of 2.52%, hence outperforming the benchmark by 204 bps. The outperformance can be attributed towards placement of funds with top Islamic banks at competitive rates along with high quality high yielding Sukuk portfolio.On YTD basis, the fund continued to outperform the benchmark of 2.50% by posting a return of 4.33%.During the month, the fund decreased its exposure in cash from 67.91% Dec'17 to 64.22% in Jan'18, the exposure in TDRs however was increased to 14.97% in Jan'18 from 12.94% in
Dec'17. Exposure in Corporate Sukuks increased to 18.89% in Jan'18 from 18.46% inDec'17.The fund’s WAM increased to 501 days in Jan’18 from 478 days in Dec'17.The Scheme has maintained the provision against Sindh Workers’ Welfare Fund’s Liability to the tune of Rs. 4.954 million, had the same not been made, the NAV per unit of the scheme would have been higher by Rs. 0.0077 per unit.The Scheme has also maintained Total expense ratio (TER) 0.86% (0.14% representing Government Levies and SWWF etc).
To provide investors with an opportunity to earn higher income over the medium to long-term by investing in a diversified portfolio consisting of different money market and debt instruments permissible under the Shariah principles.
INVESTMENT OBJECTIVE
FUND MANAGER'S COMMENTS
BASIC FUND INFORMATIONFund TypeCategoryLaunch DateNet AssetsNet Assets (Excluding FoF Investment)
NAVBenchmarkDealing DaysCut-off timePricing MechanismManagement FeesFront -end LoadTrusteeAuditorAsset Manager RatingRisk Profile of the FundFund Stability RatingFund ManagerListing
Open-endIslamic Income SchemeJuly 31, 2010PKR 6711.09mn as at January 31, 2018PKR 3493.54 mn as at January 31, 2018PKR 10.4252 as at January 31, 2018Average of 6 Month Deposit Rate of 3 A rated Islamic BanksAs Per Banking Days4:00 PMForward1 % p.a1.5%Central Depository Company of Pakistan Ltd (CDC)Deloitte - Yousuf Adil. Chartered AccountantsAM2 ++ (Stable Outlook) (JCR-VIS)LowA(f) (JCR-VIS)Kashif RafiPakistan Stock Exchange
"Disclaimer: This publication is for informational purposes only and nothing here in should be construed as a solicitation, recommendation or an offer to buy or sell any fund. All Investments in mutual funds are subject to market risks. The NAV based prices of units and any dividends /returns there on are dependent on forces and factors affecting the capital markets. These may go up or down based on market conditions . Past performance is not necessarily indicative of future results. Please read the offering document to understand the investment policies and the risk involved including risk disclosures for special features.
TECHNICAL INFORMATION
Leverage Weighted average time to maturity of net assets
NIL 501
TOP TFCs / SUKUK HOLDING (% OF TOTAL ASSETS) January 31, 2018
DHCL SUKUK 16-NOV-17 MEEZAN BANK SUKUK II IIF DIB SUKUK (14-07-2017) Total
9.36%5.76%3.77%
18.89%
*DETAILS OF NON-COMPLIANT INVESTMENT WITH THE INVESTMENT CRITERIA OF ASSIGNED CATEGORY
Name of Entity Exposure Type % of Net Assets Limit Excess - - - - -
CashPlacements with Banks(TDRs)Corporate SukukGoP Ijara SukukOthers including ReceivablesTotal
67.91%12.94%18.46%
0%0.69%100%
64.22%14.97%18.89%
0.98%0.94%100%
December 31,2017
January 31,2018ASSET ALLOCATION
Amount Invested by Fund of Funds is Rs. 3217.55 million.
3 month
ABL-IIFBenchmark
4.67%2.57%
4.45%2.52%
4.61%2.56%
6.07%4.11%
7.92%5.14%
10.64%6.08%
6 month 1 Year 3 Year 5 Year Since Inception
*Funds returns computed on Simple annualized basis / Performance data does not include cost incurred by investor in the form of sales load
ABL-IIF
Benchmark
*Funds returns computed on NAV to NAV with the dividend reinvestment (excluding sales load) ** 12M Trailing Data
4.56%
2.52%
4.33%
2.5%
0.8%
0.01%
(1.73%)
(384.24)
2.02%
N/A
PORTFOLIO QUALITY (% OF TOTAL ASSETS)
Jan - 31,2018 YTD* St. Dev** Sharpe
Ratio** Alpha***
PERFORMANCE
Alee Khalid Ghaznavi - CEO Saqib Matin, ACA - CFO & CSKashif Rafi - CIOFahad Aziz, Fund ManagerM. Abdul Hayee, CFA - Fund ManagerAniel Victor - Head of Risk Management
Investment Committee Members:
Credit Quality of Portfolio (% of Assets)
AA, 9.36%
AAA, 0.03% AA+, 0.51%
AA-, 17.06%
A+, 33.58%
A, 37.51%
unrated/others, 0.97%
Govt Securities, 0.98%
IN FOCUS ABL ISLAMICSTOCK FUND
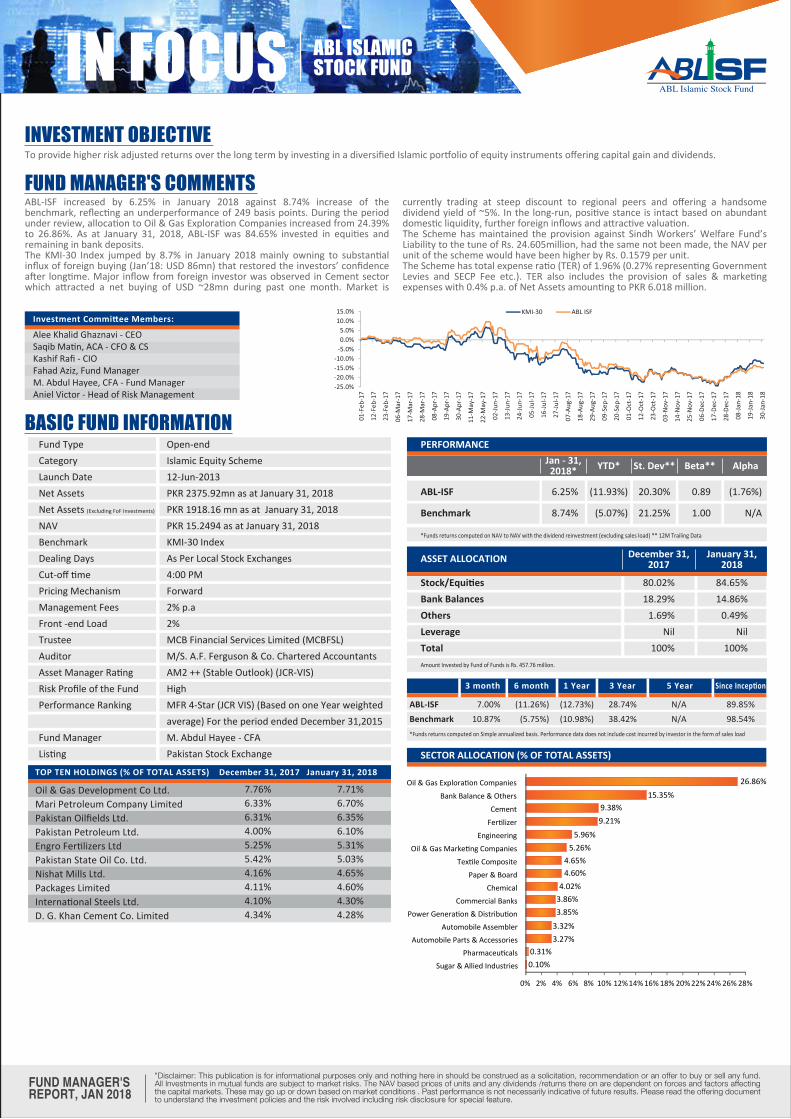
ABL-ISF increased by 6.25% in January 2018 against 8.74% increase of the benchmark, reflecting an underperformance of 249 basis points. During the period under review, allocation to Oil & Gas Exploration Companies increased from 24.39% to 26.86%. As at January 31, 2018, ABL-ISF was 84.65% invested in equities and remaining in bank deposits.The KMI-30 Index jumped by 8.7% in January 2018 mainly owning to substantial influx of foreign buying (Jan’18: USD 86mn) that restored the investors’ confidence after longtime. Major inflow from foreign investor was observed in Cement sector which attracted a net buying of USD ~28mn during past one month. Market is
currently trading at steep discount to regional peers and offering a handsome dividend yield of ~5%. In the long-run, positive stance is intact based on abundant domestic liquidity, further foreign inflows and attractive valuation.The Scheme has maintained the provision against Sindh Workers’ Welfare Fund’s Liability to the tune of Rs. 24.605million, had the same not been made, the NAV per unit of the scheme would have been higher by Rs. 0.1579 per unit.The Scheme has total expense ratio (TER) of 1.96% (0.27% representing Government Levies and SECP Fee etc.). TER also includes the provision of sales & marketing expenses with 0.4% p.a. of Net Assets amounting to PKR 6.018 million.
To provide higher risk adjusted returns over the long term by investing in a diversified Islamic portfolio of equity instruments offering capital gain and dividends.INVESTMENT OBJECTIVE
FUND MANAGER'S COMMENTS
FUND MANAGER'SREPORT, JAN 2018
TOP TEN HOLDINGS (% OF TOTAL ASSETS) December 31, 2017 January 31, 2018
Oil & Gas Development Co Ltd.Mari Petroleum Company LimitedPakistan Oilfields Ltd.Pakistan Petroleum Ltd.Engro Fertilizers LtdPakistan State Oil Co. Ltd.Nishat Mills Ltd.Packages LimitedInternational Steels Ltd.D. G. Khan Cement Co. Limited
7.71%6.70%6.35%6.10%5.31%5.03%4.65%4.60%4.30%4.28%
7.76%6.33%6.31%4.00%5.25%5.42%4.16%4.11%4.10%4.34%
Stock/EquitiesBank BalancesOthersLeverageTotal
80.02%18.29%
1.69%Nil
100%
84.65%14.86%
0.49%Nil
100%
December 31,2017
January 31,2018ASSET ALLOCATION
Amount Invested by Fund of Funds is Rs. 457.76 million.
ABL-ISF
Benchmark
*Funds returns computed on NAV to NAV with the dividend reinvestment (excluding sales load) ** 12M Trailing Data
6.25%
8.74%
(11.93%)
(5.07%)
20.30%
21.25%
0.89
1.00
(1.76%)
N/A
Jan - 31,2018* YTD* St. Dev** Beta** Alpha
PERFORMANCE
"Disclaimer: This publication is for informational purposes only and nothing here in should be construed as a solicitation, recommendation or an offer to buy or sell any fund. All Investments in mutual funds are subject to market risks. The NAV based prices of units and any dividends /returns there on are dependent on forces and factors affecting the capital markets. These may go up or down based on market conditions . Past performance is not necessarily indicative of future results. Please read the offering document to understand the investment policies and the risk involved including risk disclosure for special feature.
SECTOR ALLOCATION (% OF TOTAL ASSETS)
3 month
ABL-ISFBenchmark
7.00%10.87%
(11.26%)(5.75%)
(12.73%)(10.98%)
28.74%38.42%
N/AN/A
89.85%98.54%
6 month 1 Year 3 Year 5 Year Since Inception
*Funds returns computed on Simple annualized basis. Performance data does not include cost incurred by investor in the form of sales load
BASIC FUND INFORMATIONOpen-endIslamic Equity Scheme12-Jun-2013PKR 2375.92mn as at January 31, 2018PKR 1918.16 mn as at January 31, 2018PKR 15.2494 as at January 31, 2018KMI-30 IndexAs Per Local Stock Exchanges4:00 PMForward2% p.a2%MCB Financial Services Limited (MCBFSL)M/S. A.F. Ferguson & Co. Chartered AccountantsAM2 ++ (Stable Outlook) (JCR-VIS)HighMFR 4-Star (JCR VIS) (Based on one Year weightedaverage) For the period ended December 31,2015M. Abdul Hayee - CFAPakistan Stock Exchange
Fund TypeCategoryLaunch DateNet AssetsNet Assets (Excluding FoF Investments)
NAVBenchmarkDealing DaysCut-off timePricing MechanismManagement FeesFront -end LoadTrusteeAuditorAsset Manager RatingRisk Profile of the FundPerformance Ranking Fund ManagerListing
Alee Khalid Ghaznavi - CEO Saqib Matin, ACA - CFO & CSKashif Rafi - CIOFahad Aziz, Fund ManagerM. Abdul Hayee, CFA - Fund ManagerAniel Victor - Head of Risk Management
Investment Committee Members:
Sugar & Allied IndustriesPharmaceuticals
Automobile Parts & AccessoriesAutomobile Assembler
Power Generation & Distribution
Commercial Banks
Chemical
Paper & Board
Textile Composite
Oil & Gas Marketing Companies
Engineering
Fertilizer
Cement
Bank Balance & Others
Oil & Gas Exploration Companies
0% 2% 4% 6% 8% 10% 12%14% 16% 18% 20% 22% 24% 26% 28%
0.10%0.31%
3.27%3.32%
3.85%3.86%4.02%
4.60%4.65%
5.26%5.96%
9.21%9.38%
15.35%26.86%

IN FOCUS ABL ISLAMICDEDICATED STOCK FUND
ABL-IDSF increased by 6.43% in January 2018 against 8.74% increase of the benchmark, reflecting an underperformance of 231 basis points. During the period under review, allocation to Oil & Gas Exploration Companies increased from 24.16% to 26.78%. As at January 31, 2018, ABL-IDSF was 86.65% invested in equities and remaining in bank deposits.The KMI-30 Index jumped by 8.7% in January 2018 mainly owning to substantial influx of foreign buying (Jan’18: USD 86mn) that restored the investors’ confidence after longtime. Major inflow from foreign investor was observed in Cement sector which attracted a net buying of USD ~28mn during past one month. Market is
currently trading at steep discount to regional peers and offering a handsome dividend yield of ~5%. In the long-run, positive stance is intact based on abundant domestic liquidity, further foreign inflows and attractive valuation.The Scheme has maintained the provision against Sindh Workers’ Welfare Fund’s Liability to the tune of Rs. 1.553million, had the same not been made, the NAV per unit of the scheme would have been higher by Rs. 0.0073 per unit.The Scheme has total expense ratio (TER) of 1.94% (0.26% representing Government Levies and SECP Fee etc.). TER also includes the provision of sales & marketing expenses with 0.4% p.a. of Net Assets amounting to PKR 4.833 million.
To provide capital appreciation to investors of ‘Fund of Funds’ schemes by investing in Shariah compliant equity securities.INVESTMENT OBJECTIVE
FUND MANAGER'S COMMENTS
FUND MANAGER'SREPORT, JAN 2018
"Disclaimer: This publication is for informational purposes only and nothing here in should be construed as a solicitation, recommendation or an offer to buy or sell any fund. All Investments in mutual funds are subject to market risks. The NAV based prices of units and any dividends /returns there on are dependent on forces and factors affecting the capital markets. These may go up or down based on market conditions . Past performance is not necessarily indicative of future results. Please read the offering document to understand the investment policies and the risk involved including risk disclosure for special feature.
BASIC FUND INFORMATIONFund TypeCategoryLaunch DateNet AssetsNet Assets (Net of FoF Investments)
NAVBenchmarkDealing DaysCut-off timePricing MechanismManagement FeesFront -end LoadTrusteeAuditorAsset Manager RatingRisk Profile of the FundPerformance RankingFund ManagerListing
Open-endIslamic Equity SchemeDecember 20, 2016Rs 1897.53mn as at January 31, 2018NIL as at January 31,2018Rs.8.9250 as at January 31,2018KMI-30 IndexAs Per Local Stock Exchanges4:00 PMForward2% p.aNILMCB Financial Services Limited(MCBFSL)M/S. A.F. Ferguson & Co, Chartered AccountantsAM2++ (Stable outlook) (JCR-VIS)HighN/AM. Abdul Hayee, CFAPakistan Stock Exchange
Stock/EquitiesBank BalancesOthersLeverageTotal
79.24%18.15%
2.60%NIL
100.00%
86.65%12.94%
0.40%NIL
100.00%
December 31,2017
January 31,2018ASSET ALLOCATION
Note: Amount invested by Fund of Fund is Rs. 1,897.53mn
3 month
ABL-IDSFBenchmark
6.97%10.87%
(11.07%)(5.75%)
(13.34%)(10.98%)
N/AN/A
N/AN/A
(8.97%)(7.57%)
6 month 1 Year 3 Year 5 Year Since Inception
ABL-IDSF
Benchmark
*Funds returns computed on NAV to NAV with the dividend reinvestment (excluding sales load) ** 12M Trailing Data
6.43%
8.74%
(11.50%)
(5.07%)
20.70%
21.25%
0.91
1.00
(2.36%)
N/A
Jan - 31,2018* YTD* St. Dev** Beta Alpha
PERFORMANCE
TOP TEN HOLDINGS (% OF TOTAL ASSETS) December 31, 2017 January 31, 2018
Mari Petroleum Company LimitedOil and Gas Development Co. Ltd.Pakistan Petroleum LimitedD.G. Khan Cement Company LimitedPakistan State Oil Company LimitedPakistan Oilfields LimitedI.C.I. Pakistan LimitedPackages LimitedEngro Corporation LimitedNishat Mills Limited
8.25%6.94%6.45%5.27%5.24%5.14%4.81%4.78%4.51%4.47%
7.78%6.97%4.70%4.48%5.42%4.72%4.61%4.26%2.86%3.99%
SECTOR ALLOCATION (% OF TOTAL ASSETS)
*Funds returns computed on Absolute basis. Performance data does not include cost incurred by investor in the form of sales load.
Leather & TanneriesSugar & Allied Industries
PharmaceuticalsAutomobile Parts & Accessories
Power Generation & DistributionCommercial BanksTextile Composite
Automobile AssemblerPaper & Board
ChemicalOil & Gas Marketing Companies
EngineeringFertilizerCement
Bank Balance & OthersOil & Gas Exploration Companies
0.00% 4.00% 8.00% 12.00% 16.00% 20.00%
0.04%0.09%
0.36%3.11%3.21%
4.14%4.47%4.56%4.78%4.81%
5.24%6.44%
8.79%9.83%
13.35%26.78%
Alee Khalid Ghaznavi - CEO Saqib Matin, ACA - CFO & CSKashif Rafi - CIOFahad Aziz, Fund ManagerM. Abdul Hayee, CFA - Fund ManagerAniel Victor - Head of Risk Management
Investment Committee Members:
TECHNICAL INFORMATION APF-DSF APF-ESF
Fund Size (PKR Millions)NAV
98.839170.5810
75.329141.1880
APF-MMSF
51.843116.4184
IN FOCUS ABL PENSIONFUND
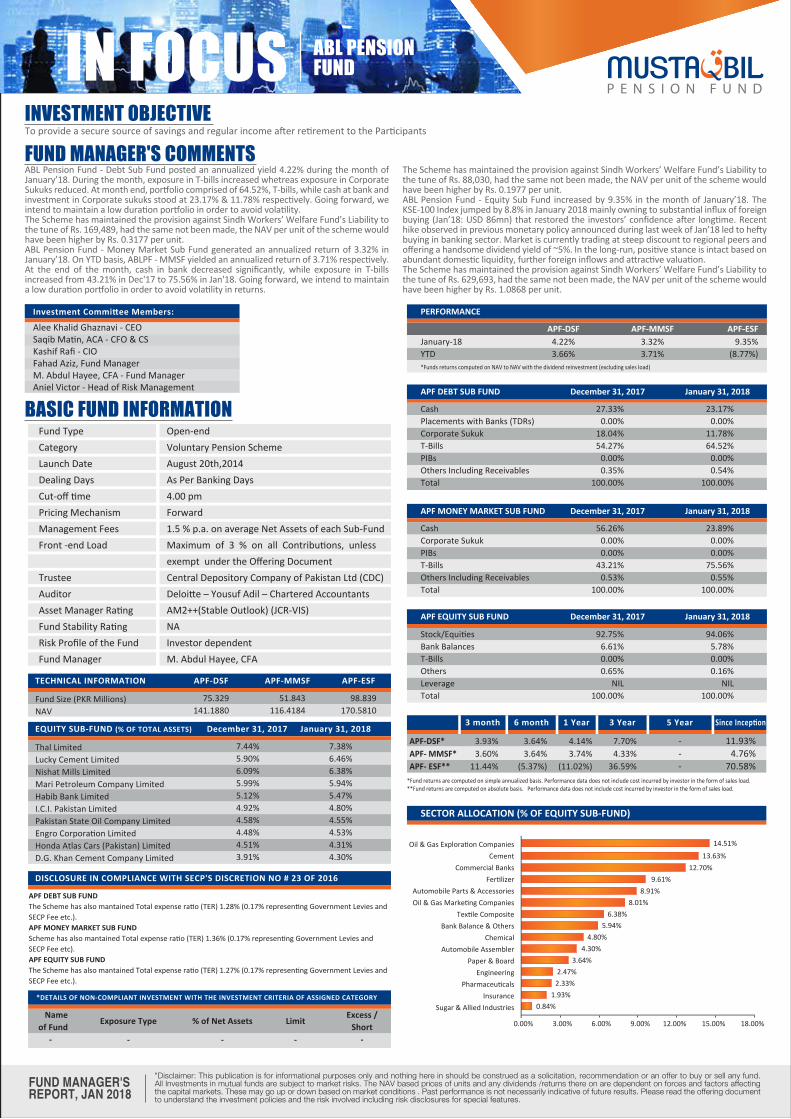
ABL Pension Fund - Debt Sub Fund posted an annualized yield 4.22% during the month of January’18. During the month, exposure in T-bills increased whetreas exposure in Corporate Sukuks reduced. At month end, portfolio comprised of 64.52%, T-bills, while cash at bank and investment in Corporate sukuks stood at 23.17% & 11.78% respectively. Going forward, we intend to maintain a low duration portfolio in order to avoid volatility.The Scheme has maintained the provision against Sindh Workers’ Welfare Fund’s Liability to the tune of Rs. 169,489, had the same not been made, the NAV per unit of the scheme would have been higher by Rs. 0.3177 per unit.ABL Pension Fund - Money Market Sub Fund generated an annualized return of 3.32% in January’18. On YTD basis, ABLPF - MMSF yielded an annualized return of 3.71% respectively. At the end of the month, cash in bank decreased significantly, while exposure in T-bills increased from 43.21% in Dec'17 to 75.56% in Jan'18. Going forward, we intend to maintain a low duration portfolio in order to avoid volatility in returns.
The Scheme has maintained the provision against Sindh Workers’ Welfare Fund’s Liability to the tune of Rs. 88,030, had the same not been made, the NAV per unit of the scheme would have been higher by Rs. 0.1977 per unit.ABL Pension Fund - Equity Sub Fund increased by 9.35% in the month of January’18. The KSE-100 Index jumped by 8.8% in January 2018 mainly owning to substantial influx of foreign buying (Jan’18: USD 86mn) that restored the investors’ confidence after longtime. Recent hike observed in previous monetary policy announced during last week of Jan’18 led to hefty buying in banking sector. Market is currently trading at steep discount to regional peers and offering a handsome dividend yield of ~5%. In the long-run, positive stance is intact based on abundant domestic liquidity, further foreign inflows and attractive valuation.The Scheme has maintained the provision against Sindh Workers’ Welfare Fund’s Liability to the tune of Rs. 629,693, had the same not been made, the NAV per unit of the scheme would have been higher by Rs. 1.0868 per unit.
To provide a secure source of savings and regular income after retirement to the ParticipantsINVESTMENT OBJECTIVE
FUND MANAGER'S COMMENTS
FUND MANAGER'SREPORT, JAN 2018
BASIC FUND INFORMATIONOpen-endVoluntary Pension SchemeAugust 20th,2014As Per Banking Days4.00 pmForward1.5 % p.a. on average Net Assets of each Sub-FundMaximum of 3 % on all Contributions, unlessexempt under the Offering DocumentCentral Depository Company of Pakistan Ltd (CDC)Deloitte – Yousuf Adil – Chartered AccountantsAM2++(Stable Outlook) (JCR-VIS)NAInvestor dependentM. Abdul Hayee, CFA
Cash Placements with Banks (TDRs) Corporate Sukuk T-Bills PIBs Others Including ReceivablesTotal
27.33%0.00%
18.04%54.27%
0.00%0.35%
100.00%
23.17%0.00%
11.78%64.52%
0.00%0.54%
100.00%
December 31, 2017APF DEBT SUB FUND January 31, 2018
CashCorporate SukukPIBsT-BillsOthers Including ReceivablesTotal
56.26%0.00%0.00%
43.21%0.53%
100.00%
23.89%0.00%0.00%
75.56%0.55%
100.00%
December 31, 2017APF MONEY MARKET SUB FUND January 31, 2018
Stock/EquitiesBank BalancesT-BillsOthersLeverageTotal
92.75%6.61%0.00%0.65%
NIL100.00%
94.06%5.78%0.00%0.16%
NIL100.00%
December 31, 2017APF EQUITY SUB FUND January 31, 2018
EQUITY SUB-FUND (% OF TOTAL ASSETS) December 31, 2017 January 31, 2018
Thal LimitedLucky Cement LimitedNishat Mills LimitedMari Petroleum Company LimitedHabib Bank LimitedI.C.I. Pakistan LimitedPakistan State Oil Company LimitedEngro Corporation LimitedHonda Atlas Cars (Pakistan) LimitedD.G. Khan Cement Company Limited
7.38%6.46%6.38%5.94%5.47%4.80%4.55%4.53%4.31%4.30%
7.44%5.90%6.09%5.99%5.12%4.92%4.58%4.48%4.51%3.91%
DISCLOSURE IN COMPLIANCE WITH SECP'S DISCRETION NO # 23 OF 2016
SECTOR ALLOCATION (% OF EQUITY SUB-FUND)
"Disclaimer: This publication is for informational purposes only and nothing here in should be construed as a solicitation, recommendation or an offer to buy or sell any fund. All Investments in mutual funds are subject to market risks. The NAV based prices of units and any dividends /returns there on are dependent on forces and factors affecting the capital markets. These may go up or down based on market conditions . Past performance is not necessarily indicative of future results. Please read the offering document to understand the investment policies and the risk involved including risk disclosures for special features.
3 month
APF-DSF*APF- MMSF*APF- ESF**
3.93%3.60%
11.44%
3.64%3.64%
(5.37%)
4.14%3.74%
(11.02%)
7.70%4.33%
36.59%
- - -
11.93%4.76%
70.58%
6 month 1 Year 3 Year 5 Year Since Inception
Fund TypeCategoryLaunch DateDealing DaysCut-off timePricing MechanismManagement FeesFront -end Load Trustee AuditorAsset Manager RatingFund Stability RatingRisk Profile of the FundFund Manager
*Fund returns are computed on simple annualized basis. Performance data does not include cost incurred by investor in the form of sales load.**Fund returns are computed on absolute basis. Performance data does not include cost incurred by investor in the form of sales load.
APF DEBT SUB FUNDThe Scheme has also mantained Total expense ratio (TER) 1.28% (0.17% representing Government Levies and SECP Fee etc.).APF MONEY MARKET SUB FUNDScheme has also mantained Total expense ratio (TER) 1.36% (0.17% representing Government Levies and SECP Fee etc).APF EQUITY SUB FUNDThe Scheme has also mantained Total expense ratio (TER) 1.27% (0.17% representing Government Levies and SECP Fee etc.).
*DETAILS OF NON-COMPLIANT INVESTMENT WITH THE INVESTMENT CRITERIA OF ASSIGNED CATEGORY
Nameof Fund -
Exposure Type
-
% of Net Assets
-
Limit
-
Excess /Short
-
January-18YTD *Funds returns computed on NAV to NAV with the dividend reinvestment (excluding sales load)
4.22%3.66%
3.32%3.71%
9.35%(8.77%)
APF-DSF APF-MMSF APF-ESF
PERFORMANCE
Alee Khalid Ghaznavi - CEO Saqib Matin, ACA - CFO & CSKashif Rafi - CIOFahad Aziz, Fund ManagerM. Abdul Hayee, CFA - Fund ManagerAniel Victor - Head of Risk Management
Investment Committee Members:
0.00% 3.00% 6.00% 9.00% 12.00% 15.00% 18.00%
Sugar & Allied IndustriesInsurance
PharmaceuticalsEngineering
Paper & BoardAutomobile Assembler
ChemicalBank Balance & Others
Textile CompositeOil & Gas Marketing CompaniesAutomobile Parts & Accessories
FertilizerCommercial Banks
CementOil & Gas Exploration Companies
0.84%1.93%
2.33%2.47%
3.64%4.30%
4.80%5.94%
6.38%8.01%
8.91%9.61%
12.70%13.63%
14.51%

IN FOCUS ABL ISLAMICPENSION FUND
ABL Islamic Pension fund - Debt Sub Fund posted a return of 1.20% in January’18. Other than GoP Ijarah Sukuk, portfolio comprised of 7.89% allocated in Corporate Sukuk and 7.06% placed as cash at banks. Going forward, we intend to maintain the current portfolio allocations as we expect price appreciation in Corporate Sukuks in the near term owing to the lack of shariah complaint instruments in the market.The Scheme has maintained the provision against Sindh Workers’ Welfare Fund’s Liability to the tune of Rs. 73,755, had the same not been made, the NAV per unit of the scheme wouldhave been higher by Rs. 0.1797 per unit.ABL Islamic Pension Fund - Money Market SubFund generated an annualized return of 2.04% in January’18. Fund size remained largely stable and closed at PKR 36.98 million. During the month significant allocation was maintained as bank deposits (i.e. 71.15%) owing to better deposit rates offered by banks while remaining 28.26% of the portfolio was placed in GoP Ijarah Sukuks.The Scheme has maintained the provision against Sindh Workers’ Welfare Fund’s Liability to
the tune of Rs. 39,909, had the same not been made, the NAV per unit of the scheme wouldhave been higher by Rs. 0.1212 per unit.ABL Islamic Pension Fund - Equity Sub Fund increased by 9.94% in the month of January’18. The KMI-30 Index jumped by 8.7% in January 2018 mainly owning to substantial influx of foreign buying (Jan’18: USD 86mn) that restored the investors’ confidence after longtime. Major inflow from foreign investor was observed in Cement sector which attracted a net buying of USD ~28mn during past one month. Market is currently trading at steep discount to regional peers and offering a handsome dividend yield of ~5%. In the long-run, positive stance is intact based on abundant domestic liquidity, further foreign inflows and attractive valuation.The Scheme has maintained the provision against Sindh Workers’ Welfare Fund’s Liability to the tune of Rs. 633,377, had the same not been made, the NAV per unit of the schemewould have been higher by Rs. 1.4618 per unit.
To provide a secure source of savings and regular income after retirement to the ParticipantsINVESTMENT OBJECTIVE
FUND MANAGER'S COMMENTS
FUND MANAGER'SREPORT, JAN 2018
BASIC FUND INFORMATIONOpen-endVoluntary Pension SchemeAugust 20th,2014As Per Banking Days4.00 pmForward1.5 % p.a. on average Net Assets of each Sub-FundMaximum of 3 % on all Contributions, unlessexempt under the Offering DocumentCentral Depository Company of Pakistan Ltd (CDC)Deloitte – Yousuf Adil – Chartered AccountantsAM2++ (Stable Outlook) (JCR-VIS)NAInvestor dependentM. Abdul Hayee, CFA
Cash GoP Ijarah Sukuk Corporate Sukuk Others Including ReceivablesTotal
7.11%80.03%12.11%
0.75%100.00%
7.06%83.88%
7.89%1.16%
100.00%
December 31, 2017APF ISLAMIC DEBT SUB FUND January 31, 2018
CashGoP Ijarah SukukCorporate SukukOthers Including ReceivablesTotal
71.15%28.37%
0.00%0.47%
100.00%
71.15%28.26%
0.00%0.59%
100.00%
December 31, 2017APF ISLAMIC MONEY MARKET SUB FUND January 31, 2018
Shariah Compliant EquitiesBank BalancesOthersLeverageTotal
94.49%4.18%1.33%
NIL100.00%
94.89%4.71%0.40%
NIL100.00%
December 31, 2017APF ISLAMIC EQUITY SUB FUND January 31, 2018
TECHNICAL INFORMATION APF-IDSF APF-IESF
Fund Size (PKR Millions)NAV
76.5262176.6220
47.1749114.9602
APF-IMMSF
36.9835112.3010
EQUITY SUB-FUND (% OF TOTAL ASSETS) December 31, 2017 January 31, 2018
Mari Petroleum Company LimitedThal LimitedLucky Cement LimitedNishat Mills LimitedI.C.I. Pakistan LimitedEngro Fertilizers LimitedOil and Gas Development Co. Ltd.D.G. Khan Cement Company LimitedPackages LimitedPakistan State Oil Company Limited
8.23%7.86%7.75%7.39%6.06%6.05%6.03%5.32%5.12%4.87%
8.41%8.02%7.17%7.15%6.30%6.47%6.56%4.90%4.94%4.98%
DISCLOSURE IN COMPLIANCE WITH SECP'S DISCRETION NO # 23 OF 2016
SECTOR ALLOCATION (% OF EQUITY SUB-FUND)
"Disclaimer: This publication is for informational purposes only and nothing here in should be construed as a solicitation, recommendation or an offer to buy or sell any fund. All Investments in mutual funds are subject to market risks. The NAV based prices of units and any dividends /returns there on are dependent on forces and factors affecting the capital markets. These may go up or down based on market conditions . Past performance is not necessarily indicative of future results. Please read the offering document to understand the investment policies and the risk involved including risk disclosures for special features.
3 month
APF-IDSF*APF- IMMSF*APF- IESF**
2.30%1.85%
11.63%
1.73%1.80%
(4.18%)
1.68%1.91%
(9.34%)
3.88%3.07%
44.22%
- - -
4.33%3.56%
76.62%
6 month 1 Year 3 Year 5 Year Since Inception
Fund TypeCategoryLaunch DateDealing DaysCut-off timePricing MechanismManagement FeesFront -end Load TrusteeAuditorAsset Manager RatingFund Stability RatingRisk Profile of the FundFund Manager
*Fund returns are computed on simple annualized basis. Performance data does not include cost incurred by investor in the form of sales load.**Fund returns are computed on Absolute Basis. Performance data does not include cost incurred by investor in the form of sales load.
APF ISLAMIC DEBT SUB FUNDThe Scheme has also mantained Total expense ratio (TER) 1.39% (0.17% representing Government Levies and SECP Fee etc).APF ISLAMIC MONEY MARKET SUB FUNDThe Scheme has also mantained Total expense ratio (TER) 1.45% (0.17% representing Government Levies and SECP Fee etc).APF ISLAMIC EQUITY SUB FUNDThe Scheme has also mantained Total expense ratio (TER) 1.55% (0.17% representing Government Levies and SECP Fee etc).
*DETAILS OF NON-COMPLIANT INVESTMENT WITH THE INVESTMENT CRITERIA OF ASSIGNED CATEGORY
Nameof Fund -
Exposure Type
-
% of Net Assets
-
Limit
-
Excess /Short
-
January-18YTD*Funds returns computed on NAV to NAV with the dividend reinvestment (excluding sales load)
1.20%0.96%
2.04%1.59%
9.94%(5.53%)
APF-IDSF APF-IMMSF APF-IESF
PERFORMANCE
Alee Khalid Ghaznavi - CEO Saqib Matin, ACA - CFO & CSKashif Rafi - CIOFahad Aziz, Fund ManagerM. Abdul Hayee, CFA - Fund ManagerAniel Victor - Head of Risk Management
Investment Committee Members:
0.00% 4.00% 8.00% 12.00% 16.00% 20.00% 24.00%
Sugar & Allied Industries
Pharmaceuticals
Engineering
Bank Balance & Others
Paper & Board
Chemical
Textile Composite
Fertilizer
Oil & Gas Marketing Companies
Automobile Parts & Accessories
Cement
Oil & Gas Exploration Companies
1.07%
3.16%
3.48%
5.11%
5.12%
6.06%
7.39%
9.70%
9.71%
10.29%
16.84%
22.06%
IN FOCUS ABL FINANCIALPLANNING FUND
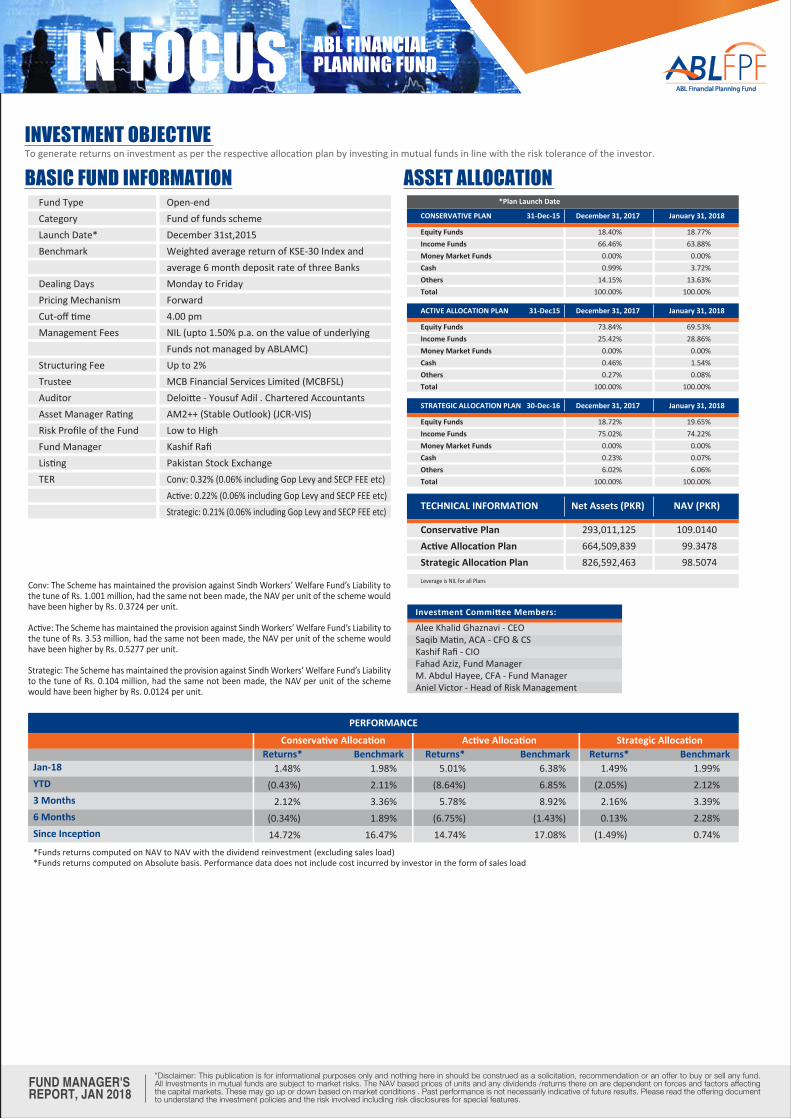
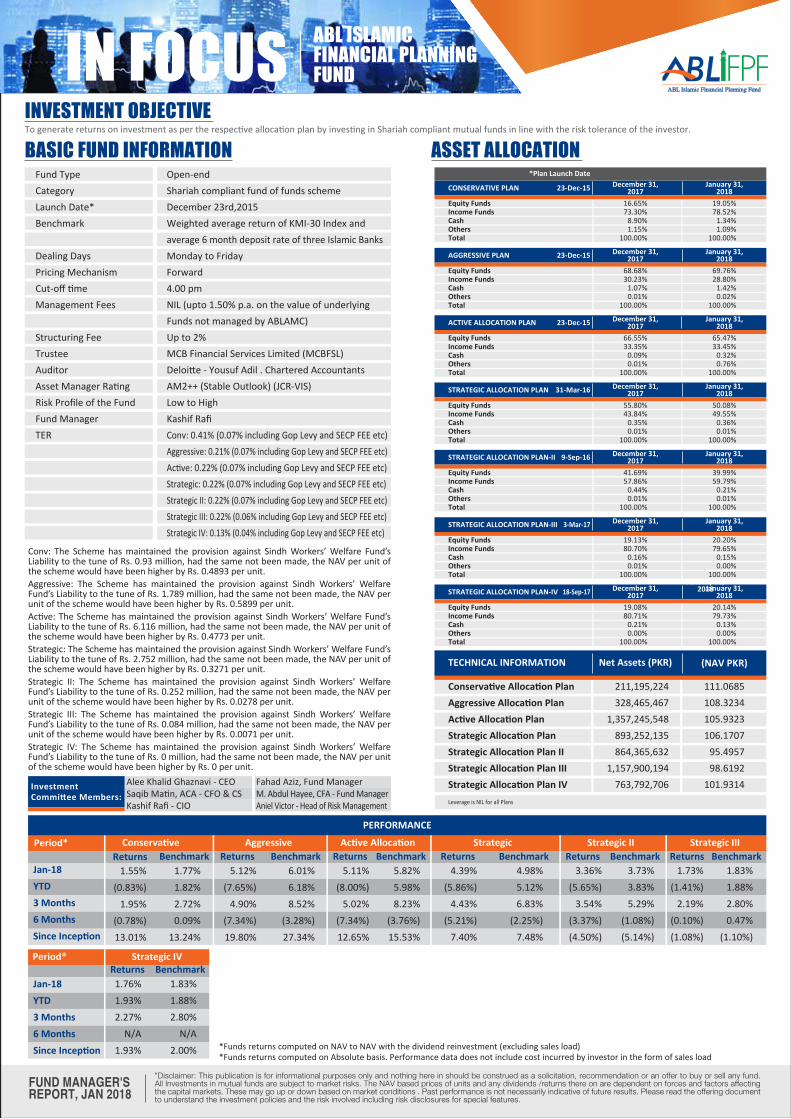
To generate returns on investment as per the respective allocation plan by investing in mutual funds in line with the risk tolerance of the investor.INVESTMENT OBJECTIVE
FUND MANAGER'SREPORT, JAN 2018
BASIC FUND INFORMATION ASSET ALLOCATIONOpen-endFund of funds schemeDecember 31st,2015Weighted average return of KSE-30 Index andaverage 6 month deposit rate of three BanksMonday to FridayForward4.00 pmNIL (upto 1.50% p.a. on the value of underlyingFunds not managed by ABLAMC)Up to 2%MCB Financial Services Limited (MCBFSL)Deloitte - Yousuf Adil . Chartered AccountantsAM2++ (Stable Outlook) (JCR-VIS)Low to HighKashif RafiPakistan Stock ExchangeConv: 0.32% (0.06% including Gop Levy and SECP FEE etc)Active: 0.22% (0.06% including Gop Levy and SECP FEE etc)Strategic: 0.21% (0.06% including Gop Levy and SECP FEE etc)
Leverage is NIL for all Plans
*Funds returns computed on NAV to NAV with the dividend reinvestment (excluding sales load)*Funds returns computed on Absolute basis. Performance data does not include cost incurred by investor in the form of sales load
Equity FundsIncome FundsMoney Market FundsCashOthersTotal
18.40%66.46%
0.00%0.99%
14.15%100.00%
18.77%63.88%
0.00%3.72%
13.63%100.00%
December 31, 2017 January 31, 2018CONSERVATIVE PLAN 31-Dec-15
Equity FundsIncome FundsMoney Market FundsCashOthersTotal
73.84%25.42%
0.00%0.46%0.27%
100.00%
69.53%28.86%
0.00%1.54%0.08%
100.00%
December 31, 2017 January 31, 2018ACTIVE ALLOCATION PLAN 31-Dec15
Equity FundsIncome FundsMoney Market FundsCashOthersTotal
18.72%75.02%
0.00%0.23%6.02%
100.00%
19.65%74.22%
0.00%0.07%6.06%
100.00%
December 31, 2017 January 31, 2018STRATEGIC ALLOCATION PLAN 30-Dec-16
Conservative PlanActive Allocation PlanStrategic Allocation Plan
293,011,125664,509,839826,592,463
109.014099.347898.5074
Net Assets (PKR) NAV (PKR)TECHNICAL INFORMATION
"Disclaimer: This publication is for informational purposes only and nothing here in should be construed as a solicitation, recommendation or an offer to buy or sell any fund. All Investments in mutual funds are subject to market risks. The NAV based prices of units and any dividends /returns there on are dependent on forces and factors affecting the capital markets. These may go up or down based on market conditions . Past performance is not necessarily indicative of future results. Please read the offering document to understand the investment policies and the risk involved including risk disclosures for special features.
Fund TypeCategoryLaunch Date*Benchmark
Dealing DaysPricing MechanismCut-off timeManagement Fees Structuring Fee TrusteeAuditorAsset Manager RatingRisk Profile of the FundFund ManagerListingTER
Conv: The Scheme has maintained the provision against Sindh Workers’ Welfare Fund’s Liability to the tune of Rs. 1.001 million, had the same not been made, the NAV per unit of the scheme would have been higher by Rs. 0.3724 per unit. Active: The Scheme has maintained the provision against Sindh Workers’ Welfare Fund’s Liability to the tune of Rs. 3.53 million, had the same not been made, the NAV per unit of the scheme would have been higher by Rs. 0.5277 per unit. Strategic: The Scheme has maintained the provision against Sindh Workers’ Welfare Fund’s Liability to the tune of Rs. 0.104 million, had the same not been made, the NAV per unit of the scheme would have been higher by Rs. 0.0124 per unit.
Jan-18YTD3 Months6 MonthsSince Inception
1.48%(0.43%)
2.12%(0.34%)14.72%
1.98%2.11%3.36%1.89%
16.47%
5.01%(8.64%)
5.78%(6.75%)14.74%
6.38%6.85%8.92%
(1.43%)17.08%
1.49%(2.05%)
2.16%0.13%
(1.49%)
1.99%2.12%3.39%2.28%0.74%
Returns* Benchmark Returns* Benchmark Returns* BenchmarkConservative Allocation Active Allocation Strategic Allocation
PERFORMANCE
*Plan Launch Date
Alee Khalid Ghaznavi - CEO Saqib Matin, ACA - CFO & CSKashif Rafi - CIOFahad Aziz, Fund ManagerM. Abdul Hayee, CFA - Fund ManagerAniel Victor - Head of Risk Management
Investment Committee Members:
IN FOCUS ABL ISLAMICFINANCIAL PLANNINGFUND
To generate returns on investment as per the respective allocation plan by investing in Shariah compliant mutual funds in line with the risk tolerance of the investor.INVESTMENT OBJECTIVE
FUND MANAGER'SREPORT, JAN 2018
BASIC FUND INFORMATION ASSET ALLOCATIONOpen-endShariah compliant fund of funds schemeDecember 23rd,2015Weighted average return of KMI-30 Index andaverage 6 month deposit rate of three Islamic BanksMonday to FridayForward4.00 pmNIL (upto 1.50% p.a. on the value of underlyingFunds not managed by ABLAMC)Up to 2%MCB Financial Services Limited (MCBFSL)Deloitte - Yousuf Adil . Chartered AccountantsAM2++ (Stable Outlook) (JCR-VIS)Low to HighKashif RafiConv: 0.41% (0.07% including Gop Levy and SECP FEE etc)Aggressive: 0.21% (0.07% including Gop Levy and SECP FEE etc)Active: 0.22% (0.07% including Gop Levy and SECP FEE etc)Strategic: 0.22% (0.07% including Gop Levy and SECP FEE etc)Strategic II: 0.22% (0.07% including Gop Levy and SECP FEE etc)Strategic III: 0.22% (0.06% including Gop Levy and SECP FEE etc)Strategic IV: 0.13% (0.04% including Gop Levy and SECP FEE etc)
Leverage is NIL for all Plans
*Funds returns computed on NAV to NAV with the dividend reinvestment (excluding sales load)*Funds returns computed on Absolute basis. Performance data does not include cost incurred by investor in the form of sales load
Equity FundsIncome FundsCashOthersTotal
68.68%30.23%
1.07%0.01%
100.00%
69.76%28.80%
1.42%0.02%
100.00%
December 31,2017
January 31,2018AGGRESSIVE PLAN 23-Dec-15
Equity FundsIncome FundsCashOthersTotal
66.55%33.35%
0.09%0.01%
100.00%
65.47%33.45%
0.32%0.76%
100.00%
December 31,2017
January 31,2018ACTIVE ALLOCATION PLAN 23-Dec-15
Equity FundsIncome FundsCashOthersTotal
55.80%43.84%
0.35%0.01%
100.00%
50.08%49.55%
0.36%0.01%
100.00%
December 31,2017
January 31,2018STRATEGIC ALLOCATION PLAN 31-Mar-16
Equity FundsIncome FundsCashOthersTotal
41.69%57.86%
0.44%0.01%
100.00%
39.99%59.79%
0.21%0.01%
100.00%
December 31,2017
January 31,2018STRATEGIC ALLOCATION PLAN-II 9-Sep-16
Equity FundsIncome FundsCashOthersTotal
19.13%80.70%
0.16%0.01%
100.00%
20.20%79.65%
0.15%0.00%
100.00%
December 31,2017
January 31,2018STRATEGIC ALLOCATION PLAN-III 3-Mar-17
Equity FundsIncome FundsCashOthersTotal
19.08%80.71%
0.21%0.00%
100.00%
20.14%79.73%
0.13%0.00%
100.00%
December 31,2017
January 31,2018STRATEGIC ALLOCATION PLAN-IV 18-Sep-17
Conservative Allocation PlanAggressive Allocation PlanActive Allocation PlanStrategic Allocation PlanStrategic Allocation Plan IIStrategic Allocation Plan IIIStrategic Allocation Plan IV
211,195,224 328,465,467
1,357,245,548 893,252,135 864,365,632
1,157,900,194 763,792,706
111.0685108.3234105.9323106.1707
95.495798.6192
101.9314
Net Assets (PKR) (NAV PKR)TECHNICAL INFORMATION
"Disclaimer: This publication is for informational purposes only and nothing here in should be construed as a solicitation, recommendation or an offer to buy or sell any fund. All Investments in mutual funds are subject to market risks. The NAV based prices of units and any dividends /returns there on are dependent on forces and factors affecting the capital markets. These may go up or down based on market conditions . Past performance is not necessarily indicative of future results. Please read the offering document to understand the investment policies and the risk involved including risk disclosures for special features.
Fund TypeCategoryLaunch Date*Benchmark
Dealing DaysPricing MechanismCut-off timeManagement Fees Structuring Fee TrusteeAuditorAsset Manager RatingRisk Profile of the FundFund ManagerTER
Conv: The Scheme has maintained the provision against Sindh Workers’ Welfare Fund’s Liability to the tune of Rs. 0.93 million, had the same not been made, the NAV per unit of the scheme would have been higher by Rs. 0.4893 per unit.Aggressive: The Scheme has maintained the provision against Sindh Workers’ Welfare Fund’s Liability to the tune of Rs. 1.789 million, had the same not been made, the NAV per unit of the scheme would have been higher by Rs. 0.5899 per unit.Active: The Scheme has maintained the provision against Sindh Workers’ Welfare Fund’s Liability to the tune of Rs. 6.116 million, had the same not been made, the NAV per unit of the scheme would have been higher by Rs. 0.4773 per unit.Strategic: The Scheme has maintained the provision against Sindh Workers’ Welfare Fund’s Liability to the tune of Rs. 2.752 million, had the same not been made, the NAV per unit of the scheme would have been higher by Rs. 0.3271 per unit.Strategic II: The Scheme has maintained the provision against Sindh Workers’ Welfare Fund’s Liability to the tune of Rs. 0.252 million, had the same not been made, the NAV per unit of the scheme would have been higher by Rs. 0.0278 per unit.Strategic III: The Scheme has maintained the provision against Sindh Workers’ Welfare Fund’s Liability to the tune of Rs. 0.084 million, had the same not been made, the NAV per unit of the scheme would have been higher by Rs. 0.0071 per unit.Strategic IV: The Scheme has maintained the provision against Sindh Workers’ Welfare Fund’s Liability to the tune of Rs. 0 million, had the same not been made, the NAV per unit of the scheme would have been higher by Rs. 0 per unit.
Period*
Period* Strategic IV
ReturnsJan-18YTD3 Months6 MonthsSince Inception
Jan-18YTD3 Months6 MonthsSince Inception
1.55%(0.83%)
1.95%(0.78%)13.01%
1.76%1.93%2.27%
N/A1.93%
1.83%1.88%2.80%
N/A2.00%
1.77%1.82%2.72%0.09%
13.24%
5.12%(7.65%)
4.90%(7.34%)19.80%
6.01%6.18%8.52%
(3.28%)27.34%
5.11%(8.00%)
5.02%(7.34%)12.65%
5.82%5.98%8.23%
(3.76%)15.53%
4.39%(5.86%)
4.43%(5.21%)
7.40%
4.98%5.12%6.83%
(2.25%)7.48%
3.36%(5.65%)
3.54%(3.37%)(4.50%)
3.73%3.83%5.29%
(1.08%)(5.14%)
1.73%(1.41%)
2.19%(0.10%)(1.08%)
1.83%1.88%2.80%0.47%
(1.10%)
Benchmark
Returns Benchmark
Returns Benchmark Returns Benchmark Returns Benchmark Returns Benchmark Returns BenchmarkConservative Aggressive Active Allocation Strategic Strategic II Strategic III
PERFORMANCE
InvestmentCommittee Members:
Alee Khalid Ghaznavi - CEOSaqib Matin, ACA - CFO & CSKashif Rafi - CIO
Fahad Aziz, Fund ManagerM. Abdul Hayee, CFA - Fund ManagerAniel Victor - Head of Risk Management
Equity FundsIncome FundsCashOthersTotal
16.65%73.30%
8.90%1.15%
100.00%
19.05%78.52%
1.34%1.09%
100.00%
December 31,2017
January 31,2018
January 31,2018CONSERVATIVE PLAN 23-Dec-15
*Plan Launch Date

FUND MANAGER'SREPORT, JAN 2018
"Disclaimer: This publication is for informational purposes only and nothing here in should be construed as a solicitation, recommendation or an offer to buy or sell any fund. All Investments in mutual funds are subject to market risks. The NAV based prices of units and any dividends /returns there on are dependent on forces and factors affecting the capital markets. These may go up or down based on market conditions . Past performance is not necessarily indicative of future results. Please read the offering document to understand the investment policies and the risk involved including risk disclosures for special features.
ABL IFBenchmark
FY’139.88%9.96%
8.19%9.81%
14.20%9.01%
7.19%6.54%
5.85%6.10%
FY’14 FY’15 FY’16 FY’17
ABL CF
Benchmark
9.13%
6.62%
8.18%
6.57%
9.37%
6.06%
5.78%
3.81%
5.41%
4.96%
ABL SFBenchmark
55.87%35.95%
32.90%25.96%
27.11%5.67%
9.91%0.37%
33.21%22.44%
ABL IIFBenchmark
9.22%6.63%
8.88%6.78%
8.69%6.61%
5.82%5.10%
5.68%3.05%
ABL GSFBenchmark
11.79%8.84%
9.17%8.82%
15.14%8.00%
8.03%5.67%
5.10%5.85%
ABL ISFBenchmark
(3.24%)(2.30%)
24.66%29.89%
29.03%20.10%
5.58%15.53%
31.18%18.80%
ABL IDSFBenchmark
--
--
--
--
2.86%(2.62%)
ABL PFDSFMMSFESF
---
---
20.92%6.14%
28.79%
12.14%4.15%
10.56%
4.42%3.89%
31.31%
ABL IPFDSFMMSFESF
---
---
6.56%6.31%
30.84%
3.52%2.24%
11.31%
4.52%3.22%
28.01%
4.41%4.17%5.29%6.99%
10.35%9.44%
19.28%13.56%0.57%
(0.25%)
ABL FPFConservative PlanBenchmarkActive PlanBenchmarkSAPBenchmark
ABL IFPFSAPBenchmarkConservative PlanBenchmarkAggressive FundBenchmarkActive PlanBenchmarkSAP IIBenchmarkSAP IIIBencmark
------
--------
-
-
--------
-
-
--------
-
-
------
------
1.69%4.00%3.52%5.92%6.46%
14.58%3.53%
10.27%
12.18%5.73%
10.08%6.51%
21.85%14.12%18.26%10.06%1.22%
(2.84%)0.34%
(0.95%)
FY’09 FY’10 FY’1112.26%13.05%
11.29%12.90%
14.34%13.48%
13.16%12.87%
13.50%12.26%
13.50%11.84%
15.24%11.42%
15.16%10.79%
15.60%10.48%
FY’12 FY’13 FY’14 FY’15 FY’16 FY’17
71.06%52.39%
32.43%25.69%
(0.17%)(0.42%)
116.12%56.81%
236.86%113.18%
347.69%168.52%
469.07%183.75%
525.44%184.79%
733.15%248.70%
10.16%9.30%
--
--
11.12%8.34%
11.15%7.75%
11.30%7.51%
11.56%7.32%
11.15%6.94%
10.90%6.38%
--
--
--
10.68%10.52%
11.85%9.46%
11.48%9.21%
13.75%8.87%
13.37%8.17%
12.88%7.76%
--
--
--
--
(3.24%)(2.30%)
20.63%26.90%
55.64%52.40%
64.32%76.07%
115.56%109.16%
--
--
--
--
--
--
--
--
2.86%(2.62%)
---
---
---
---
---
---
20.92%6.14%
28.79%
17.37%5.18%
42.39%
13.35%4.86%
86.97%
---
---
---
---
---
---
6.56%6.31%
30.84%
5.03%4.18%
45.65%
5.00%3.93%
86.96%
------
------
------
------
------
------
------
4.41%4.17%5.29%6.99%
15.22%14.01%25.59%20.32%0.57%
(0.25%)
1.69%4.00%3.52%5.92%6.46%
14.58%3.53%
10.27%
14.08%9.37%
13.96%12.82%29.72%30.77%22.44%19.88%1.22%
(2.84%)0.34%
(0.95%)
11.88%
7.49%
-
-
-
-
12.18%
7.49%
11.87%
7.19%
11.65%
7.03%
12.06%
6.83%
11.58%
6.32%
12.01%
6.13%
--------
-
-
--------
-
-
--------
-
-
--------
-
-
--------
-
-
--------
-
-
--------
-
-
Last 5 Years Performance Since Inception Performance
IN FOCUS DISCLOSURE ASPER SECP’S SCDCIRCULAR. 16, 2014

Plot # 24-B Mezznine Floor,Main Market Gulberg 111, LahoreTel: 0423-5750953Mobile: 0345-4268272,0335-4184426
LAHORE2nd Floor, Main Khayaban-e-Ittehad DHA, KarachiTel: 0213-5311001Mobile: 0300-2441896,0332-3081021
KARACHIPlot # 171 A-1 Phase 1DHA, RawalpindiTel: 051-5788728Fax: 051-5789382Mobile: 0333-8505435
RAWALPINDI15 Club Road, Main FaisalLane, Off Club Road, CilvilLines, FaislabadTel: 041-2409413, 041-2409420Mobile: 0301-845066
FAISALABAD
Plot No. 14. Sector MB, DHA, Phase 6, LahoreREGISTERED ADDRESS
Rating as per JCR-VIS
SMSCallEmailWebsite
::::
‘INVEST’ to 82620800 ABL-AM (0800 225 26)[email protected]
ABLAssetManagement
ABLAssetManagement
ablamcl