Fund Manager Report February 2018 Feb - 18 (Final...Cement sector substantially underperformed...
14
Fund Manager Report February 2018
Transcript of Fund Manager Report February 2018 Feb - 18 (Final...Cement sector substantially underperformed...

Fund Manager Report February 2018
Fund Manager Review – February 2018
Macroeconomic Overview
During Feb-18, YoY CPI inflation clocked in at 3.80% YoY, 62bps lower than YoY CPI inflation recorded Jan-18 as average prices fell 0.31% MoM . 8MFY18 CPI inflation has averaged 3.84%. The MoM decline CPI index was primarily driven by a 1.1% dip in food prices in Feb-18, which fell for the third consecutive month in a row.
Non-food inflation clocked in at 4.9% YoY while core NFNE inflation stood at 5.2% YoY in Feb-18, both indices unchanged from the last month while MoM increase in both slowed down to 0.2% MoM from 0.8% in Jan-18.
Post currency devaluation in Dec-17 and a pre-emptive hike in the policy rate by SBP, CPI inflation has remained low in Feb-18 as well, due to lower food prices. The PKR remained virtually unchanged against the USD during Feb-18, hovering between 110.54 - 110.59. Ex-food price instability, CPI inflation may pick up in the coming months owing to impact of currency devaluation in December-17. We continue to anticipate CPI inflation to clock in at 4.3% YoY in FY18.
On the external front, Current Account Deficit (CAD) jumped to USD 1.6bn or 6.0% of GDP for the month of Jan-18 according to latest data available from SBP. This led to 7MFY18 CAD to clock in at 4.7% of GDP compared to 3.5% of GDP during 7MFY17. The increase in deficit was primarily driven by a 20.6%
MoM increase in deficit in Balance on trade of Goods, which increased to 10.2% of GDP in Jan-18, compared to 8.4% in Dec-17. Financial account inflows also recorded a large MoMdecrease owing to high base effect from Sukuk/Eurobond inflows of USD 2.5bn during Dec-17.
Fixed Income Review
Secondary market yields were pushed up by 20-25 bps across short term papers during Feb-18, with yields on 3m, 6m and 1yr paper closing the month at 6.21%, 6.36% and 6.62%. Yields on 3yr and 5yr PIBs rose by 31/25bps to 7.81% and 8.35% respectively. Yield on 10yr PIB edged up 15bps to 8.64%. In the two T-Bill auctions conducted during the month of Feb-18, SBP raised a total of PKR 1,374bn against a target of PKR 1,450bn and maturity of PKR 1,404.6bn. All bids in the PIB auction held during Feb-18 were rejected, against a target of PKR 50bn and maturity of PKR 8.1bn.
Equity Market Review
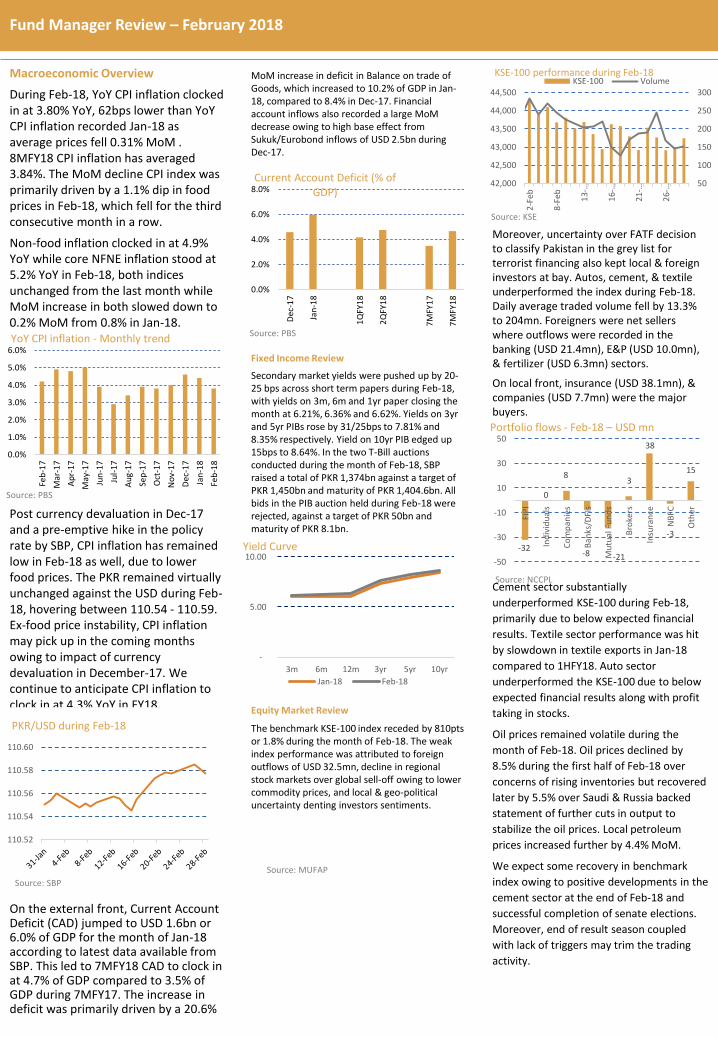
The benchmark KSE-100 index receded by 810pts or 1.8% during the month of Feb-18. The weak index performance was attributed to foreign outflows of USD 32.5mn, decline in regional stock markets over global sell-off owing to lower commodity prices, and local & geo-political uncertainty denting investors sentiments.
Moreover, uncertainty over FATF decision to classify Pakistan in the grey list for terrorist financing also kept local & foreign investors at bay. Autos, cement, & textile underperformed the index during Feb-18. Daily average traded volume fell by 13.3% to 204mn. Foreigners were net sellers where outflows were recorded in the banking (USD 21.4mn), E&P (USD 10.0mn), & fertilizer (USD 6.3mn) sectors.
On local front, insurance (USD 38.1mn), & companies (USD 7.7mn) were the major buyers.
Cement sector substantially
underperformed KSE-100 during Feb-18,
primarily due to below expected financial
results. Textile sector performance was hit
by slowdown in textile exports in Jan-18
compared to 1HFY18. Auto sector
underperformed the KSE-100 due to below
expected financial results along with profit
taking in stocks.
Oil prices remained volatile during the
month of Feb-18. Oil prices declined by
8.5% during the first half of Feb-18 over
concerns of rising inventories but recovered
later by 5.5% over Saudi & Russia backed
statement of further cuts in output to
stabilize the oil prices. Local petroleum
prices increased further by 4.4% MoM.
We expect some recovery in benchmark
index owing to positive developments in the
cement sector at the end of Feb-18 and
successful completion of senate elections.
Moreover, end of result season coupled
with lack of triggers may trim the trading
activity.
-
5.00
10.00
3m 6m 12m 3yr 5yr 10yr
Yield Curve
Jan-18 Feb-18
Source: MUFAP
Source: KSE
50
100
150
200
250
300
42,000
42,500
43,000
43,500
44,000
44,500
2-F
eb
8-F
eb 13
-…
16
-…
21
-…
26
-…
KSE-100 VolumeKSE-100 performance during Feb-18
-32
0
8
-8 -21
3
38
-3
15
-50
-30
-10
10
30
50
FIP
I
Ind
ivid
ual
s
Co
mp
anie
s
Ban
ks/D
FIs
Mu
tual
Fu
nd
s
Bro
kers
Insu
ran
ce
NB
FC
Oth
er
Portfolio flows - Feb-18 – USD mn
Source: NCCPL
0.0%
1.0%
2.0%
3.0%
4.0%
5.0%
6.0%
Feb
-17
Mar
-17
Ap
r-17
May
-17
Jun
-17
Jul-
17
Au
g-17
Sep
-17
Oct
-17
No
v-17
Dec
-17
Jan
-18
Feb
-18
YoY CPI inflation - Monthly trend
Source: PBS
110.52
110.54
110.56
110.58
110.60
PKR/USD during Feb-18
Source: SBP
0.0%
2.0%
4.0%
6.0%
8.0%
Dec
-17
Jan
-18
1Q
FY1
8
2Q
FY1
8
7M
FY1
7
7M
FY1
8
Current Account Deficit (% of GDP)
Source: PBS

0.00%
96.57%
3.43%
89.16%
10.35%0.49%
0.00%
50.00%
100.00%
150.00%
T-Bills Cash Other incl. receivables
31 jan 2018 28 feb 2018
Asset Allocation (% of Total Assets)
Leverage: Nil
Key Statistics
NAV (PKR/Unit) 103.6330
Net Assets (PKR mn) 522.797
Duration (Days) 63
Weighted Average Maturity (Days) 63
Expense Ratio (Annualized) 1.35%
Levy Ratio (Annualized) 0.26%
Since Inception Return 10.09%
Fund Information
Fund Objective
The objective of the Fund is to provide the investors with a high level of liquidity along with extremely low credit and price volatility. The Fund shall provide the facility to invest in an underlying portfolio primarily comprising of government securities (Treasury Bills) and other Authorized Investments which shall enable the investor to manage their liquidity efficiently.
Type of Scheme Open-end
Nature of Scheme Money Market Fund
Inception Date 18-Sept-09
Benchmark70% average 3 month PKRV + 30% Average 3-month deposit rate as selected by MUFAP
Dealing Day/cut off time
Monday – Friday 10.00 am
Pricing Mechanism Backward
Minimum Investment PKR 5,000
Front end load 0.00%
Back end load 0.00%
Management Fee 0.50% p.a.
Trustee Central Depository Company of Pakistan Ltd. (CDC)
Auditor KPMG Taseer Hadi & Co.
Registrar Askari Investment Management Ltd.
Listing Pakistan Stock Exchange
Askari Cash Fund (Formerly Askari Sovereign Cash Fund)
IC Members:
CEO Adeel Ahmed Khan
CFO Adeel Shahid
Fund Manager Faisal Raza
Monthly Review
In the month of Feb-18, Askari Cash Fund posted a return of 5.50% ascompared to its benchmark return of 5.29%. Assets under management ofthe fund closed the month at PKR 522 million as compared to PKR 534million in previous month. During the month funds were mostly invested ascash due to worthwhile rates offered by Banks. By month end, duration ofthe funds stood at 63 day as compared to 01 day in previous month.
February - 2018
MUFAP RECOMMENDED FORMAT
Performance* YTD MoM 365-Days 3-Years 5-Years
ACF 4.92% 5.50% 5.21% 7.00% 7.55%
Benchmark 5.21% 5.29% 5.17% 5.70% 7.00%
Historical Returns
FY13 FY14 FY15 FY16 FY17
ACF 9.24% 8.07% 8.86% 5.56% 8.49%
Benchmark 8.83% 8.88% 8.35% 5.87% 5.25%
Risk Profile of the Fund
AMC Rating “AM 3”
Fund Stability Rating AA+ by JCR-VIS
Risk Profile Low
Disclosures
SWWF (As per Circular 17 of 2012): The Scheme has maintained provisions against Sindh Workers’ Welfare Fund’s liability to the tune of Rs.1.77million, if the same were not made the NAV per unit/ YTD return of Scheme would be higher by Rs.0.3526 / 0.35%.
AAA, 99.50%
N.R., 0.50%
AAA N.R.
Portfolio Quality (% of Total Assets)
Disclaimer: This publication is for informational purposes only and nothing herein should be construed as a solicitation, recommendation or an offer to buy or sell any fund. All investments in mutual funds are subject to market risks. Past performance is not necessarily indicative of future results. Please read the Offering Document to understand the investment policies and risks involved. The performance reported is net of management fee & all other expenses and based on dividend reinvestment gross of with-holding tax where applicable. The performance reported is net of management fee & all other expenses and based on dividend reinvestment gross of with-holding tax where applicable. The calculation of performance does not include cost of front end load .Notes:*Operational Bank Account1) The calculation of performance does not include cost of front end load. 2) Taxes apply. Further, tax credit also available as per section 62 of the Income Tax Ordinance, 2001.
*Adjusted for dividend

Key Statistics
NAV (PKR/Unit) 51.8000
Net Assets (PKR mn) 127.458
Expense Ratio (Annualized) 3.89%
Levy Ratio (Annualized) 0.34%
Since Inception Return 96.51%
PAKOMAN Advantage Asset Allocation FundFebruary - 2018
Monthly Review
In the Month of Feb-18, Pak Oman Advantage Asset Allocation Fund showeda return of -2.17% against the benchmark return of -0.57%,. During themonth , Sector with major exposure were Cement, Oil and gas exploration,Banks ad automobile which closed at the month at 13.80%, 12.38%, 7.11%and 7.87% respectively. By the month end, equity exposure stood at 62.06%as compare to 50.20% in the previous month. Exposure against debts closedat 17.26% as compare to 18.13% in the previous month. Remaining fundsmaintained I Bank accounts ad receivable .
Top 10 holdings (% of Total Assets)
DG Khan Cement Co. Ltd. 5.23%
Indus Motor Company Limited 5.03%
Habib Bank Limited 4.69%
Hub Power Co. Ltd. 4.05%
Cherat Cement Co. Ltd. 3.79%
Pakistan Petroleum Limited 3.44%
Oil and Gas Development Co. Ltd. 3.32%
Engro Corporation Limited 3.27%
Pak Elektron Limited 3.12%
Pakistan Oil Fields Limited 2.86%
Equity Sector Allocation (% of Total Assets)
Cements 13.80%
Oil and Gas Exploration
12.38%
Automobile Assemblers
7.87%
Commercial Banks 7.11%
Power Generation and Distribution
4.05%
Others 13.19%
50.20%
29.09%
18.13%
2.59%
62.06%
2.37%
17.26% 18.31%
0.00%
20.00%
40.00%
60.00%
80.00%
Equities Cash* TFCs/Sukuks Others incl.receivables
31 jan 2018 28 feb 2018
Asset Allocation (% of Total Assets)
Leverage: Nil
Historical Returns
FY13 FY14 FY15 FY16 FY17
POAAF 31.82% 8.74% 12.62% 7.76% 19.89%
Benchmark 31.06% 25.49% 12.50% 8.19% 10.21%
Performance(%)
YTD MoM 365-Days 3-Years 5-Years
POAAF -18.86% -2.17% -22.55% 12.38% 44.76%
Benchmark* -5.68% -0.57% -13.93% 13.57% 55.26%
IC Members:
CEO Adeel Ahmed Khan
CFO Adeel Shahid
Fund Manager Muneeb Sikander
Disclaimer: This publication is for informational purposes only and nothing herein should be construed as a solicitation, recommendation or an offer to buy or sell any fund. All investments in mutual funds are subject to market risks. Past performance is not necessarily indicative of future results. Please read the Offering Document to understand the investment policies and risks involved. The performance reported is net of management fee & all other expenses and based on dividend reinvestment gross of with-holding tax where applicable. The performance reported is net of management fee & all other expenses and based on dividend reinvestment gross of with-holding tax where applicable. The calculation of performance does not include cost of front end load .Notes:*Operational Bank Account1) The calculation of performance does not include cost of front end load. 2) Taxes apply. Further, tax credit also available as per section 62 of the Income Tax Ordinance, 2001.
*Adjusted for dividend
Fund Information
Fund Objective
POAAAF shall invent in a diversified portfolio of Securities such as equities, profit bearing securities and other instruments, including securities available for investments outside Pakistan, subject to applicable laws.
Type of Scheme Open-end
Nature of Scheme Asset Allocation
Inception Date 30-Oct-08
BenchmarkBenchmark WA return of KSE-30 index + WA return of 6M KIBOR on actual proportion.
Dealing Day/cut off time
Mon – Fri 9:00am / 3:30 pm
Pricing Mechanism Forward
Minimum Investment PKR 5,000
Front end load 2.50%
Back end load 2.00%
Management Fee 2.00 % p.a.
Trustee MCB Financial Services Ltd.
Auditor Deloitte Yousuf Adil Co. Ltd.
Registrar Jwafs Registrar
Listing Pakistan Stock Exchange
MUFAP RECOMMENDED FORMAT
Risk Profile of the Fund
AMC Rating “AM 3”
Fund Ranking 3 Star (short term) PACRA / 3 Star (Long term) PACRA
Risk Profile Medium
Top Exposures (As on 28-Feb 2018)
Instrument Price % of Total Assets
TPL Corporation Limited TFC (14-Dec-17) 100.0000 6.00%
International Brands Limited (15-Nov-17) 100.0000 11.26%
Disclosures:
SWWF (As per Circular 17 of 2012): The scheme has maintained provision against SWWF amounting Rs. 1.56 million. If the above recognition had not been made, the net asset value per unit/YTD return of the Scheme would be higher by 0.6374 per unit / 0.99 percent.
Key Statistics
NAV (PKR/Unit) 54.2600
Net Assets (PKR mn) 215.938
Expense Ratio (Annualized) 3.72%
Levy Ratio (Annualized) 0.44%
Since Inception Return 75.51%
PAKOMAN Islamic Asset Allocation FundFebruary - 2018
Monthly Review
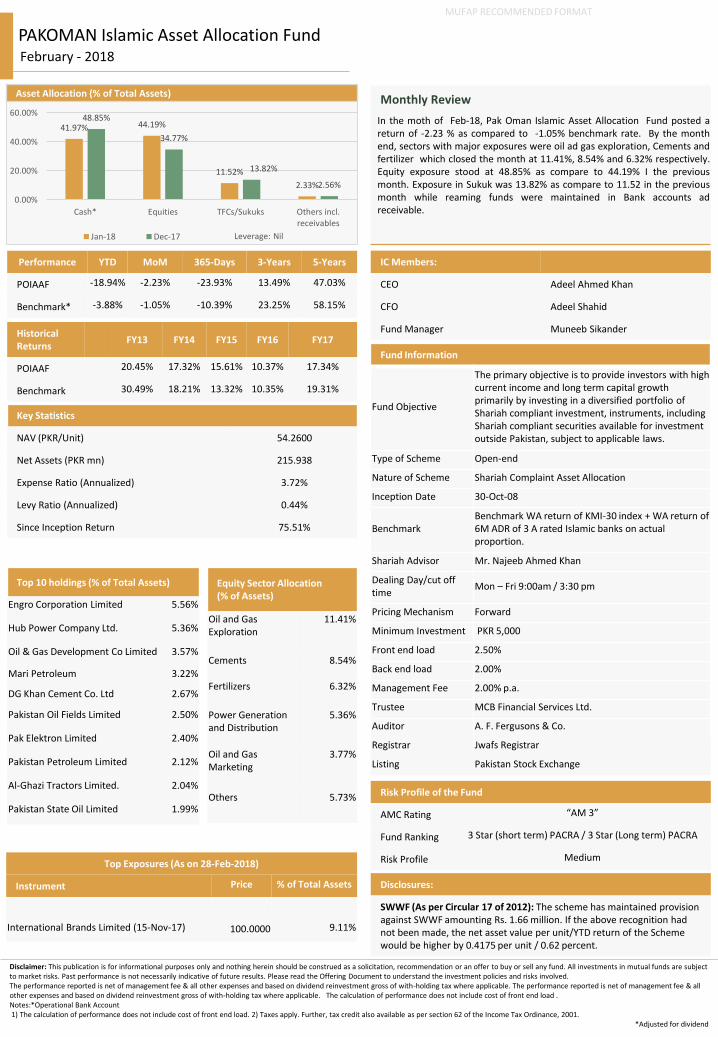
In the moth of Feb-18, Pak Oman Islamic Asset Allocation Fund posted areturn of -2.23 % as compared to -1.05% benchmark rate. By the monthend, sectors with major exposures were oil ad gas exploration, Cements andfertilizer which closed the month at 11.41%, 8.54% and 6.32% respectively.Equity exposure stood at 48.85% as compare to 44.19% I the previousmonth. Exposure in Sukuk was 13.82% as compare to 11.52 in the previousmonth while reaming funds were maintained in Bank accounts adreceivable.
Disclaimer: This publication is for informational purposes only and nothing herein should be construed as a solicitation, recommendation or an offer to buy or sell any fund. All investments in mutual funds are subject to market risks. Past performance is not necessarily indicative of future results. Please read the Offering Document to understand the investment policies and risks involved. The performance reported is net of management fee & all other expenses and based on dividend reinvestment gross of with-holding tax where applicable. The performance reported is net of management fee & all other expenses and based on dividend reinvestment gross of with-holding tax where applicable. The calculation of performance does not include cost of front end load .Notes:*Operational Bank Account1) The calculation of performance does not include cost of front end load. 2) Taxes apply. Further, tax credit also available as per section 62 of the Income Tax Ordinance, 2001.
*Adjusted for dividend
41.97% 44.19%
11.52%
2.33%
48.85%
34.77%
13.82%
2.56%
0.00%
20.00%
40.00%
60.00%
Cash* Equities TFCs/Sukuks Others incl.receivables
Jan-18 Dec-17
Asset Allocation (% of Total Assets)
Leverage: Nil
Performance YTD MoM 365-Days 3-Years 5-Years
POIAAF -18.94% -2.23% -23.93% 13.49% 47.03%
Benchmark* -3.88% -1.05% -10.39% 23.25% 58.15%
IC Members:
CEO Adeel Ahmed Khan
CFO Adeel Shahid
Fund Manager Muneeb Sikander
Top 10 holdings (% of Total Assets)
Engro Corporation Limited 5.56%
Hub Power Company Ltd. 5.36%
Oil & Gas Development Co Limited 3.57%
Mari Petroleum 3.22%
DG Khan Cement Co. Ltd 2.67%
Pakistan Oil Fields Limited 2.50%
Pak Elektron Limited 2.40%
Pakistan Petroleum Limited 2.12%
Al-Ghazi Tractors Limited. 2.04%
Pakistan State Oil Limited 1.99%
Equity Sector Allocation (% of Assets)
Oil and Gas Exploration
11.41%
Cements 8.54%
Fertilizers 6.32%
Power Generation and Distribution
5.36%
Oil and Gas Marketing
3.77%
Others 5.73%
Fund Information
Fund Objective
The primary objective is to provide investors with high current income and long term capital growth primarily by investing in a diversified portfolio of Shariah compliant investment, instruments, including Shariah compliant securities available for investment outside Pakistan, subject to applicable laws.
Type of Scheme Open-end
Nature of Scheme Shariah Complaint Asset Allocation
Inception Date 30-Oct-08
BenchmarkBenchmark WA return of KMI-30 index + WA return of 6M ADR of 3 A rated Islamic banks on actual proportion.
Shariah Advisor Mr. Najeeb Ahmed Khan
Dealing Day/cut off time
Mon – Fri 9:00am / 3:30 pm
Pricing Mechanism Forward
Minimum Investment PKR 5,000
Front end load 2.50%
Back end load 2.00%
Management Fee 2.00% p.a.
Trustee MCB Financial Services Ltd.
Auditor A. F. Fergusons & Co.
Registrar Jwafs Registrar
Listing Pakistan Stock Exchange
Risk Profile of the Fund
AMC Rating “AM 3”
Fund Ranking 3 Star (short term) PACRA / 3 Star (Long term) PACRA
Risk Profile Medium Top Exposures (As on 28-Feb-2018)
Instrument Price % of Total Assets
International Brands Limited (15-Nov-17) 100.0000 9.11%
Disclosures:
SWWF (As per Circular 17 of 2012): The scheme has maintained provision against SWWF amounting Rs. 1.66 million. If the above recognition had not been made, the net asset value per unit/YTD return of the Scheme would be higher by 0.4175 per unit / 0.62 percent.
MUFAP RECOMMENDED FORMAT
Historical Returns
FY13 FY14 FY15 FY16 FY17
POIAAF 20.45% 17.32% 15.61% 10.37% 17.34%
Benchmark 30.49% 18.21% 13.32% 10.35% 19.31%

22.30% 19.92%
55.11%
2.67%
32.33%
19.82%
44.95%
2.90%
0.00%
20.00%
40.00%
60.00%
Cash Bank Placements Sukuk Other incl.receivables
31 jan 2018 28 feb 2018
Asset Allocation (% of Total Assets)
Leverage: Nil
15.85%
14.70%
14.40%19.82%
32.33%
2.90%
AA AA- A+
A A- N.R.
Portfolio Quality (% of Total Assets)
Performance YTD MoM 365-Days 3-Years 5-Years
POAIIF 5.00% 6.60% 4.94% 4.88% 4.79%
Benchmark* 2.47% 2.50% 2.48% 3.78% 5.10%
Key Statistics
NAV (PKR/Unit) 54.1550
Net Assets (PKR mn) 248.759
Duration (Days) 0.20
Weighted Average Maturity (Years) 1.95
Expense Ratio (Annualized) 2.41%
Levy Ratio (Annualized) 0.36%
Since Inception Return 6.33%
Fund Information
Fund Objective
The primary Objective is to provide investor(s) with competitive current income and long term capital growth primarily by investing in a diversified portfolio of shariah compliant securities available for investment outside Pakistan subject to applicable laws.
Type of Scheme Open-end
Nature of Scheme Shariah Complaint Income Scheme
Inception Date 30-Oct-08
BenchmarkBenchmark 6 month average deposit rates of 3 A rated scheduled Islamic Banks.
Shariah Advisor Mr. Najeeb Ahmed Khan
Dealing Day/cut off time
Mon – Fri 9:00am / 3:30 pm
Pricing Mechanism Forward
Minimum Investment PKR 5,000
Front end load 1.00%
Back end load 2.00%
Management Fee 1.50% p.a.
Trustee MCB Financial Services Ltd.
Auditor A. F. Fergusons & Co.
Registrar Jwafs Registrar
Listing Pakistan Stock Exchange
PAKOMAN Advantage Islamic Income Fund
IC Members:
CEO Adeel Ahmed Khan
CFO Adeel Shahid
Fund Manager Sumaira Shaukat
Monthly Review
In the month of Feb-18, Pak Oman Advantage Islamic Income Fund posted areturn of 6.60% against its benchmark of 2.50%. Net Asset of the Fund wasPKR 248 million as compared to PKR 247 million. By the month end,exposure against sukuk stood at 44.95% as compared to 55.11% in theprevious month. Exposure against bank Placement closed at 19.82% ascompared to 19.92% in the previous month. Remaining Funds of the fundwere invested as cash with Islamic Bank/ Islamic windows of commercialBanks.
February - 2018
MUFAP RECOMMENDED FORMAT
Historical Returns
FY13 FY14 FY15 FY16 FY17
POAIIF 7.34% 3.43% 4.77% 4.37% 6.42%
Benchmark 6.57% 6.54% 6.55% 4.89% 2.92%
Top Exposures (As on 28-Feb-2018)
Instrument Price % of Total Assets
International Brands Limited (15-Nov-17) 100.0000 15.85%
TPL Trakker Limited (13-Apr-16) 103.8000 14.40%
Dawood Hercules Corp. Limited (28-Feb-18) 100.0000 7.93%
Dawood Hercules Corp. Limited II (16-Nov-17) 100.6000 6.78%
Risk Profile of the Fund
AMC Rating “AM 3”
Fund Stability Rating A (f) PACRA
Risk Profile of the Fund Low to Medium
Disclosures
SWWF (As per Circular 17 of 2012): The scheme has maintained provision against SWWF amounting Rs. 0.705 million. If the above recognition had not been made, the net asset value per unit/YTD return of the Scheme would be higher by 0.1537 per unit/0.29 Percent.
Disclaimer: This publication is for informational purposes only and nothing herein should be construed as a solicitation, recommendation or an offer to buy or sell any fund. All investments in mutual funds are subject to market risks. Past performance is not necessarily indicative of future results. Please read the Offering Document to understand the investment policies and risks involved. The performance reported is net of management fee & all other expenses and based on dividend reinvestment gross of with-holding tax where applicable. The performance reported is net of management fee & all other expenses and based on dividend reinvestment gross of with-holding tax where applicable. The calculation of performance does not include cost of front end load .Notes:*Operational Bank Account1) The calculation of performance does not include cost of front end load. 2) Taxes apply. Further, tax credit also available as per section 62 of the Income Tax Ordinance, 2001.
*Adjusted for dividend

1.65%
70.14%
18.49%8.81%
0.91%7.16%
69.37%
18.30%
4.55% 0.62%
0.00%
20.00%
40.00%
60.00%
80.00%
Cash* T-Bill TFCs Term Deposits Other incl.receivables
31 jan 2018 28 feb 2018
Asset Allocation (% of Total Assets)
Leverage: Nil
69.37%
8.89%
13.96%
7.16%
AAA AA+ A+ A-
Portfolio Quality (% of Total Assets)
Performance YTD MoM 365-Days 3-Years 5-Years
POGSF 4.65% 3.81% 4.63% 5.88% 6.63%
Benchmark* 6.00% 6.23% 6.03% 6.20% 7.26%
Key Statistics
NAV (PKR/Unit) 10.9453
Net Assets (PKR mn) 282.160
Duration (Days) 61 Days
Weighted Average Maturity (Years) 1.04 Years
Expense Ratio (Annualized) 1.96%
Levy Ratio (Annualized) 0.32%
Since Inception Return 7.62%
Fund Information
Fund Objective
The primary objective of Pak Oman Government Securities Fund (POGSF) is to provide its unit holders competitive returns from portfolio of investment with low credit risk with maximum possible preservation of capital via investing in Government Securities.
Type of Scheme Open-end
Nature of Scheme Income
Inception Date 28-July-11
Benchmark Average 6M PKRV rates.
Dealing Day/cut off time
Mon – Fri 9:00am / 3:30 pm
Pricing Mechanism Forward
Minimum Investment PKR 5,000
Front end load 0.00%
Back end load 2.00%
Management Fee 1.10 % p.a.
Trustee MCB Financial Services Ltd.
Auditor Deloitte Yousuf Adil Co. Ltd.
Registrar Jwafs Registrar
Listing Pakistan Stock Exchange
PAKOMAN Government Securities Fund
IC Members:
CEO Adeel Ahmed Khan
CFO Adeel Shahid
Fund Manager Faisal Raza
MUFAP RECOMMENDED FORMAT
Monthly Review
In the month of Feb-18, Pak Oman Government Security Fund posted areturn of 3.81% against its benchmark 6.23%. On YTD basis, the fund posteda return of 4.65% as compared to benchmark return of 6.00% . By monthend, exposure against treasury bills stood at 69.37% against 70.14% in theprevious month. Exposure against term deposit were 4.55% against 8.81% inthe previous moth. Exposure against Term Finance Certificates TFCs weremaintained at 18.30% against 18.49% I the previous month while reamingfunds were invested in Cash.
February - 2018
Historical Returns
FY13 FY14 FY15 FY16 FY17
POGSF 9.22% 7.08% 8.63% 8.75% 4.28%
Benchmark 8.67% 8.67% 8.12% 5.84% 5.64%
Top Exposures (As on 28-Feb-2018)
Instrument Price % of Total Assets
JS Bank Limited (14-Dec-16) 99.6075 9.41%
Jehangir Siddiqui Company Limited (18-July-17) 101.6315 8.89%
Risk Profile of the Fund
AMC Rating “AM 3”
Fund Stability Rating A+ (f) PACRA
Risk Profile of Fund Low to Medium
Disclosures
SWWF (As per Circular 17 of 2012): The scheme has maintained provision against SWWF amounting Rs. 1.10 million. If the above recognition had not been made, the net asset value per unit/YTD return of the Scheme would be higher by 0.0427 per unit / 0.40 percent.
Disclaimer: This publication is for informational purposes only and nothing herein should be construed as a solicitation, recommendation or an offer to buy or sell any fund. All investments in mutual funds are subject to market risks. Past performance is not necessarily indicative of future results. Please read the Offering Document to understand the investment policies and risks involved. The performance reported is net of management fee & all other expenses and based on dividend reinvestment gross of with-holding tax where applicable. The performance reported is net of management fee & all other expenses and based on dividend reinvestment gross of with-holding tax where applicable. The calculation of performance does not include cost of front end load .Notes:*Operational Bank Account1) The calculation of performance does not include cost of front end load. 2) Taxes apply. Further, tax credit also available as per section 62 of the Income Tax Ordinance, 2001.
*Adjusted for dividend

41.24%
36.98%
13.36%
5.10%0.00% 0.00%
3.32%
42.60%
36.09%
9.16%
1.21% 0.20%
10.73%
0.00%
10.00%
20.00%
30.00%
40.00%
50.00%
TFCs Cash TDR PIB T-Bills Ready Future O.Receivables
31 jan 2018 28 feb 2018
Asset Allocation (% of Total Assets)
Leverage: Nil
8.44%
5.09%
5.50%
19.50%
38.57%3.05%
7.70%
1.22%
0.20%10.73%
AAAAA+AAAA-A+AA-BBB+Ready Future
Portfolio Quality (% of Total Assets)
Performance* YTD MoM 365-Days 3-Years 5-Years
AHYS 4.25% 4.04% 4.70% 6.30% 8.97%
Benchmark 6.51% 6.74% 6.50% 6.56% 7.89%
Key Statistics
NAV (PKR/Unit) 104.5528
Net Assets (PKR mn) 4,831.434
Duration (Years) 0.14
Weighted Average Maturity (Years) 2.32
Expense Ratio (Annualized) 2.22%
Levy Ratio (Annualized) 0.34%
Since Inception Return 6.13%
Risk Profile of the Fund
AMC Rating “AM 3”
Fund Stability Rating A by JCR-VIS
Risk Profile of Fund Medium
Fund Information
Fund Objective
The objective of the Fund is to provide investors an opportunity to make competitive returns from fixed income securities while targeting a portfolio duration of six months.
Type of Scheme Open-end
Nature of Scheme Aggressive Fixed Income Scheme
Inception Date 16-Mar-06
Benchmark Average 1 Year KIBOR
Dealing Day/cut off time
Mon – Fri 9:00am / 4:30 pm
Pricing Mechanism Forward
Minimum Investment PKR 5,000
Front end load 2.00%
Back end load 1.00%
Management Fee 1.50 % p.a.
Trustee Central Depository Company of Pakistan Ltd. (CDC)
Auditor KPMG Taseer Hadi & Co.
Registrar Askari Investment Management Ltd.
Listing Pakistan Stock Exchange
Askari High Yield Scheme
IC Members:
CEO Adeel Ahmed Khan
CFO Adeel Shahid
Fund Manager Sumaira Shaukat
Monthly Review
In the month of Feb-18, Askari High Yield Scheme posted a return of 4.04%as benchmark return of 6.74%. During the moth fund underperform itsbenchmark due to mark to market loss In TFCs held in portfolio. Asset undermanagement closed at PKR 4,831 millions as compared PKR 4,415 inprevious month. By month end, exposure against Term Finance Certificate(TFCs) were 42.60% as compared to 41.24% in previous month. Exposureagainst Term Deposits were closed at 9.16% of the total fund size.Remaining funds were invested as Cash with A ad above rated Banks.
February - 2018
Top Exposures (As on 28-Feb-2018)
Instrument Price% of Total
Assets
Dawood Hercules Corp. Ltd. (28-Feb-18) 100.0000 7.33%
International Brands Limited (15-Nov-17) 100.0000 5.50%
JS Bank Limited (29-Dec-17) 100.0000 4.07%
MCB Bank Ltd (19-06-2014) 100.8266 4.01%
Soneri Bank Ltd (08-07-2015) 100.9928 3.92%
Bank of Punjab Ltd. (23-12-2016) 99.2619 3.79%
Jehangir Siddiqui Co. Limited – TFC (18-07-2017) 101.6315 3.10%
Byco Petroleum Ltd (18-01-2017) 99.9166 2.93%
TPL Corp Ltd. (Formerly TPL Trakker – 14-Dec-17) 100.0000 2.44%
K-Electric Ltd - (17-06-15) 101.3938 1.71%
MUFAP RECOMMENDED FORMAT
Historical Returns
FY13 FY14 FY15 FY16 FY17
AHYS 1.61% 11.63% 12.16% 8.23% 5.34%
Benchmark 9.93% 9.83% 8.97% 6.53% 6.33%
Disclosures
SWWF (As per Circular 17 of 2012): The Scheme has maintained provisions against Sindh Workers’ Welfare Fund’s liability to the tune of Rs. 10.398 million, if the same were not made the NAV per unit/ YTD return of Scheme would be higher by Rs 0.2250 / 0.22%.
Disclaimer: This publication is for informational purposes only and nothing herein should be construed as a solicitation, recommendation or an offer to buy or sell any fund. All investments in mutual funds are subject to market risks. Past performance is not necessarily indicative of future results. Please read the Offering Document to understand the investment policies and risks involved. The performance reported is net of management fee & all other expenses and based on dividend reinvestment gross of with-holding tax where applicable. The performance reported is net of management fee & all other expenses and based on dividend reinvestment gross of with-holding tax where applicable. The calculation of performance does not include cost of front end load .Notes:*Operational Bank Account1) The calculation of performance does not include cost of front end load. 2) Taxes apply. Further, tax credit also available as per section 62 of the Income Tax Ordinance, 2001.
*Adjusted for dividend

55.13%
29.05%
11.20%4.62%
63.65%
17.23% 15.29%
3.83%
0.00%
20.00%
40.00%
60.00%
80.00%
Corporate Sukuk Cash Bank Placement Other incl.receivables
31 jan 2018 28 feb 2018
Asset Allocation (% of Total Assets)
Leverage: Nil
Performance* YTD MoM 365-Days 3-Years 5-Years
AIIF 4.97% 5.65% 4.82% 5.19% 6.16%
Benchmark 2.47% 2.50% 2.48% 3.78% 5.10%
Key Statistics
NAV (PKR/Unit) 104.4936
Net Assets (PKR mn) 379.687
Duration (Years) 0.23
Weighted Average Maturity (Years) 2.58
Expense Ratio (Annualized) 2.04%
Levy Ratio (Annualized) 0.33%
Since Inception Return 8.57%
Risk Profile of the Fund
AMC Rating “AM 3”
Fund Stability Rating A+ by JCR-VIS
Risk Profile of the Fund Low to Medium
Fund Information
Fund Objective
The objective of the Fund is to provide investors a Shariah compliant product with stable halal income. The fund would target on capitalizing available opportunities in the Shariah compliant income generating instruments. The Fund will focus on superior quality portfolio compared with average portfolio quality of Islamic income funds in the industry and enhanced returns over a 3 month horizon.
Type of Scheme Open-end
Nature of Scheme Shariah Complaint Islamic Income
Inception Date 18-Sept-09
BenchmarkAverage 6 months Placement (Deposit) rate as selected by MUFAP.
Shariah Advisor Mr. Najeeb Ahmed Khan
Dealing Day/cut off time
Monday – Friday 9.00 am to 4.30 pm
Pricing Mechanism Forward
Minimum Investment PKR 5,000
Front end load 1.00%
Back end load 1.00%
Management Fee 1.10 % p.a.
Trustee MCB Financial Services Ltd.
Auditor KPMG Taseer Hadi & Co.
Registrar Askari Investment Management Ltd.
Listing Pakistan Stock Exchange
Askari Islamic Income Fund
IC Members:
CEO Adeel Ahmed Khan
CFO Adeel Shahid
Fund Manager Sumaira Shaukat
Monthly Review
In the month of Feb-18, Askari Islamic Income Fund posted a return of 5.65%as compared to its benchmark of 2.50%. Asset Under management wereclosed at PKR 379 millions as compared to PKR 517 millions in the previousmonth. By the month end, exposure against Corporate Sukuk were kept at63.65% as compared 55.13% in the previous month. During the monthexposure against Term Deposits was kept at 15.29% as compared to 11.20%in the previous month. Around 17.23% of the fund size were invested asCash with A ad above rated Islamic Banks/ Islamic windows of CommercialBanks.
February - 2018
Top Exposures (As on 28-Feb-2018)
Instrument Price % of Total Assets
International Brands Limited (15-Nov-17) 100.0000 15.29%
TPL Trakker Limited (13-Apr-16) 103.8000 12.70%
Dawood Hercules Corp. Limited II (28-Feb-18) 100.0000 10.20%
Byco Petroleum Limited (18-Jan-17) 99.9166 10.19%
K-Electric Ltd (17-06-15) 101.3938 5.32%
Dawood Hercules Corp. Limited II (16-Nov-17) 100.6000 3.85%
Engro Fertilizer Limited (09-Jul-2014) 102.4187 3.56%
Fatima Fertilizer Limited (28-Nov-16) 101.9092 2.55%
MUFAP RECOMMENDED FORMAT
Historical Returns
FY13 FY14 FY15 FY16 FY17
AIIF 8.74% 7.93% 6.52% 5.08% 5.49%
Benchmark 6.65% 7.34% 6.41% 4.31% 2.92%
Disclosures
SWWF (As per Circular 17 of 2012): The Scheme has maintained provisions against Sindh Workers’ Welfare Fund’s liability to the tune of Rs.1.17 million, if the same were not made the NAV per unit/YTD return of Scheme would be higher by Rs.0.3242 / 0.32%.
10.19%
5.32%
15.29%
20.15%12.70%
15.29%
17.23%
3.83%AAAAA+AAAA-A+AA-N.R.
Portfolio Quality (% of Total Assets)
Disclaimer: This publication is for informational purposes only and nothing herein should be construed as a solicitation, recommendation or an offer to buy or sell any fund. All investments in mutual funds are subject to market risks. Past performance is not necessarily indicative of future results. Please read the Offering Document to understand the investment policies and risks involved. The performance reported is net of management fee & all other expenses and based on dividend reinvestment gross of with-holding tax where applicable. The performance reported is net of management fee & all other expenses and based on dividend reinvestment gross of with-holding tax where applicable. The calculation of performance does not include cost of front end load .Notes:*Operational Bank Account1) The calculation of performance does not include cost of front end load. 2) Taxes apply. Further, tax credit also available as per section 62 of the Income Tax Ordinance, 2001.
*Adjusted for dividend

11.15%
69.11%
2.85%
16.09%
0.80%
12.34%
76.21%
1.75%8.95%
0.75%
0.00%
20.00%
40.00%
60.00%
80.00%
100.00%
TFCs T-Bill Cash Term Deposits Other incl.receivables
31 jan 2018 28 feb 2018
Asset Allocation (% of Total Assets)
Leverage: Nil
Performance* YTD MoM 365-Days 3-Years 5-Years
ASYE 4.00% 3.41% 4.12% 6.35% 7.99%
Benchmark 6.00% 6.23% 6.03% 6.20% 7.26%
Key Statistics
NAV (PKR/Unit) 104.7147
Net Assets (PKR mn) 186.905
Duration (Years) 0.20
Weighted Average Maturity (Years) 1.29
Expense Ratio (Annualized) 2.42%
Levy Ratio (Annualized) 0.34%
Since Inception Return 8.81%
Risk Profile of the Fund
AMC Rating “AM 3”
Fund Stability Rating A+ by JCR-VIS
Risk Profile of the Fund Low to Medium
Fund Information
Fund Objective
The objective of the Fund is to generate relatively higher yield than the conventional bank deposits, from a portfolio constituted of credit worthy sovereign instruments and banking sector fixed income instruments and deposits.
Type of Scheme Open-end
Nature of Scheme Income Scheme
Inception Date 07-May-12
Benchmark Average 6 month PKRV
Dealing Day/cut off time
Mon – Fri 9:00am / 4:30 pm
Pricing Mechanism Forward
Minimum Investment PKR 5,000
Front end load 1.25%
Back end load 0.00%
Management Fee 1.35% p.a.
Trustee Central Depository Company of Pakistan Ltd. (CDC)
Auditor KPMG Taseer Hadi & Co.
Registrar Askari Investment Management Ltd.
Listing Pakistan Stock Exchange
Askari Sovereign Yield Enhancer
IC Members:
CEO Adeel Ahmed Khan
CFO Adeel Shahid
VP- Fund Management Faisal Raza
Monthly Review
In the month of Feb-18, Askari Sovereign Yield Enhancer posted a return of3.41% against a benchmark of 6.23%. On year to date basis fund posted areturn of 4.00% as compared to benchmark return of 6.00%. By month end,exposure against Treasury Bills were kept at 76.21% against 69.11% in theprevious month. During the month Term Finance Certificate were stood at12.34% as compared to 11.15% in the previous month. Exposure againstBanks placement were closed at 16.09% while remaining fund were investedas Cash with Banks.
February - 2018
Top Exposures (As on 28 Feb 2018)
Instrument Price % of Total Assets
Bank of Punjab TFC 99.2619 12.34%
MUFAP RECOMMENDED FORMAT
Historical Returns
FY13 FY14 FY15 FY16 FY17
ASYE 10.98% 8.83% 10.74% 9.21% 4.83%
Benchmark 8.92% 8.09% 8.33% 5.31% 6.10%
Disclosures
SWWF (As per Circular 17 of 2012): The Scheme has maintained provisions against Sindh Workers’ Welfare Fund’s liability to the tune of Rs.2.22 million, if the same were not made the NAV per unit/ YTD return of Scheme would be higher by Rs.1.24 / 1.22%.
AAA, 76.21%
AA-, 12.34%
A+, 8.95%
AAA
AA-
A+
Portfolio Quality (% of Total Assets)
Disclaimer: This publication is for informational purposes only and nothing herein should be construed as a solicitation, recommendation or an offer to buy or sell any fund. All investments in mutual funds are subject to market risks. Past performance is not necessarily indicative of future results. Please read the Offering Document to understand the investment policies and risks involved. The performance reported is net of management fee & all other expenses and based on dividend reinvestment gross of with-holding tax where applicable. The performance reported is net of management fee & all other expenses and based on dividend reinvestment gross of with-holding tax where applicable. The calculation of performance does not include cost of front end load .Notes:*Operational Bank Account1) The calculation of performance does not include cost of front end load. 2) Taxes apply. Further, tax credit also available as per section 62 of the Income Tax Ordinance, 2001.
*Adjusted for dividend

Key Statistics
NAV (PKR/Unit) 44.4654
Net Assets (PKR mn) 154.709
Expense Ratio (Annualized) 4.73%
Levy Ratio (Annualized) 0.54%
Since Inception Return** 28.35%
Askari Asset Allocation FundFebruary - 2018
Top 10 holdings (% of Assets)
The Searl Company Limited 4.48%
D.G. Khan Cement Limited 2.64%
International Steel Limited 2.08%
Oil and Gas Development Limited 1.76%
Ghani Gasses Limited 1.74%
Pak Electron Limited 1.66%
Nishat Chunian Limited 1.53%
Loads Limited 1.30%
Al-Ghazi Tractors Limited 1.21%
Askari Bank Limited 1.04%
Equity Sector Allocation (% of Assets)
Pharmaceuticals 4.48%
Cements 2.88%
Oil and Gas Exploration
2.74%
Engineering 2.50%
Chemicals 1.74%
Others 5.31%
11.38%
52.62%
12.76%
23.25%21.32%
53.67%
16.05%8.96%
0.00%
20.00%
40.00%
60.00%
Equitiy Cash TFCs/Sukuk Other receivables
31 jan 2018 28 feb 2018
Asset Allocation (% of Total Assets)
Leverage: Nil
Historical Returns
FY13 FY14 FY15 FY16 FY17
AAAF 39.87% 19.31% 15.40% -6.25% 10.49%
Benchmark 22.73% 18.24% 17.85% 3.84% 10.03%
Performance* YTD MoM 365-Days 3-Years 5-Years
AAAF -15.72% -0.76% -19.93% -8.91% 42.89%
Benchmark -10.00% -0.06% -14.59% 2.76% 62.69%
IC Members:
CEO Adeel Ahmed Khan
CFO Adeel Shahid
Fund Information
Fund Objective
The objective of the Fund is to provide investors, an investment solution through disciplined and structured investment techniques. The Fund shall target capitalizing on opportunities available in both fixed income and equity markets using in-house research and proprietary investment matrix.
Type of Scheme Open-end
Nature of Scheme Asset Allocation Fund
Inception Date 10-Sept-07
Benchmark
Weighted Average Daily Return of KSE-30 Index and 6 month KIBOR as per amount investment in equities and fixed income investments including cash and cash equivalents respectively.
Dealing Day/cut off time
Mon – Fri 9:00am / 4:30 pm
Pricing Mechanism Forward
Minimum Investment PKR 5,000
Front end load 2.50%
Back end load 2.50%
Management Fee 2.00 % p.a.
Trustee Central Depository Company of Pakistan Ltd. (CDC)
Auditor KPMG Taseer Hadi & Co.
Registrar Askari Investment Management Ltd.
Listing Pakistan Stock Exchange
MUFAP RECOMMENDED FORMAT
Risk Profile of the Fund
AMC Rating “AM 3”
Fund Ranking 1 Year - 2 Star, 3 Year – 2 Star, 5 Year - 2 Star by JCR-VIS
Risk Profile Medium
Disclosures:
SWWF (As per Circular 17 of 2012): The Scheme has maintained provisions against Sindh Workers’ Welfare Fund’s liability to the tune of Rs.0.674 million, if the same were not made the NAV per unit/ YTD Return of Scheme would be higher by Rs.0.1939 / 0.36%.
Monthly Review
In the month of Feb-18, Askari Asset Allocation Fund posted a return of -0.76% as compared to benchmark return of -0.06%. Net Asset of the Fundsstood at PKR 154 million as compared to PKR 192 million in the previousmonth. By the month end, equity exposure was increased to 21.32% ascompared to 11.38% in the previous month. Cash was Maintained at 53.67%of the total fund size.
Disclaimer: This publication is for informational purposes only and nothing herein should be construed as a solicitation, recommendation or an offer to buy or sell any fund. All investments in mutual funds are subject to market risks. Past performance is not necessarily indicative of future results. Please read the Offering Document to understand the investment policies and risks involved. The performance reported is net of management fee & all other expenses and based on dividend reinvestment gross of with-holding tax where applicable. The performance reported is net of management fee & all other expenses and based on dividend reinvestment gross of with-holding tax where applicable. The calculation of performance does not include cost of front end load .Notes:*Operational Bank Account1) The calculation of performance does not include cost of front end load. 2) Taxes apply. Further, tax credit also available as per section 62 of the Income Tax Ordinance, 2001.
**Absolute *Adjusted for dividend
Top Exposures (As on 28-Feb-2018)
Instrument Price% of Total
Assets
TPL Corp. Ltd. (Formerly TPL Trakker Ltd. ) (14-Dec-17) 100.0000 7.41%
JS Bank Limited (29-Dec-17) 100.0000 8.64%

Key Statistics
NAV (PKR/Unit) 98.0301
Net Assets (PKR mn) 169.595
Expense Ratio (Annualized) 5.29
Levy Ratio (Annualized) 0.57
Since Inception Return** 90.52%
Askari Islamic Asset Allocation FundFebruary - 2018
Top 10 holdings (% of Total Assets)
Engro Corporation Limited 9.36%
Oil & Gas Development Co Limited 6.50%
Pakistan Petroleum Ltd. 5.57%
Mari Petroleum Limited 5.44%
D.G Khan Cement Co. Limited 5.40%
Hub Power Company Limited 5.08%
Al-Ghazi Tractors Limited 3.68%
Pak Elektron Limited 3.20%
Pakistan Oil Fields Limited 3.13%
Pioneer Cement Limited 2.42%
Equity Sector Allocation (% of Assets)
Oil and Gas Exploration
20.64%
Cements 13.12%
Fertilizers 11.13%
Automobile Assemblers
5.44%
Power Generationand Distribution
5.08%
Others 11.52%
72.22%
23.36%
4.41%
70.30%
25.94%
3.76%
0.00%
20.00%
40.00%
60.00%
80.00%
Equitiy Cash Others receivables
31 jan 2018 28 feb 2018
Asset Allocation (% of Total Assets)
Leverage: Nil
Historical Returns
FY13 FY14 FY15 FY16 FY17
AIAAF 30.80% 12.53% 12.32% -2.82% 13.08%
Benchmark 27.51% 17.21% 12.44% 9.54% 10.03%
Performance* YTD MoM 365-Days 3-Years 5-Years
AIAAF -17.21% -3.11% -19.96% -4.49% 28.84%
Benchmark -6.63% -1.66% -10.04% 21.45% 55.60%
IC Members:
CEO Adeel Ahmed Khan
CFO Adeel Shahid
Disclaimer: This publication is for informational purposes only and nothing herein should be construed as a solicitation, recommendation or an offer to buy or sell any fund. All investments in mutual funds are subject to market risks. Past performance is not necessarily indicative of future results. Please read the Offering Document to understand the investment policies and risks involved. The performance reported is net of management fee & all other expenses and based on dividend reinvestment gross of with-holding tax where applicable. The performance reported is net of management fee & all other expenses and based on dividend reinvestment gross of with-holding tax where applicable. The calculation of performance does not include cost of front end load .Notes:*Operational Bank Account1) The calculation of performance does not include cost of front end load. 2) Taxes apply. Further, tax credit also available as per section 62 of the Income Tax Ordinance, 2001.
**Absolute *Adjusted for dividend
Fund Information
Fund Objective
The objective of the Fund is to provide investors a Shariah compliant investment solution through disciplined and structured investment techniques. The fund shall target capitalizing on opportunities available in both Shariah compliant debt and equity markets using in-house research and proprietary investment matrix.
Type of Scheme Open-end
Nature of Scheme Shariah Complaint Asset Allocation
Inception Date 18-Sept-09
Benchmark
Weighted Average Daily Return of KMI- 30 Index and 6 month average deposit rate of 3 Islamic Banks as per amount invested in equities and fixed income investments including cash & cashequivalents respectively.
Shariah Advisor Mr. Najeeb Ahmed Khan
Dealing Day/cut off time
Mon – Fri 9:00am / 4:30 pm
Pricing Mechanism Forward
Minimum Investment PKR 5,000
Front end load 2.50%
Back end load 5.00%
Management Fee 2.00% p.a.
Trustee MCB Financial Services Ltd.
Auditor KPMG Taseer Hadi & Co.
Registrar Askari Investment Management Ltd.
Listing Pakistan Stock Exchange
MUFAP RECOMMENDED FORMAT
Risk Profile of the Fund
AMC Rating “AM 3”
Fund Ranking 1 Year – 3 Star, 3 Year – 1 Star, 5 Year - 2 Star by JCR-VI
Risk Profile Medium
Disclosures:
SWWF (As per Circular 17 of 2012): The Scheme has maintained provisions against Sindh Workers’ Welfare Fund’s liability to the tune of Rs.0.399 million, if the same were not made the NAV per unit/ YTD return of Scheme would be higher by 0.2309 / 0.19%.
Monthly Review
In the month of Feb-18, Askari Islamic Asset Allocation Fund posted areturn of -3.11% as against the benchmark return of -1.66%. Net Assets ofthe fund stood at PKR 169 million as compared to the PKR 124 million inthe previous month. During the month equity exposure stood at 70.30% ascompared to the 72.22% in the previous month. At the month end, Cashwas maintained at 25.94% of the total fund size as compared to the 23.36%of the previous month, where as there was no fresh exposure in Ijara Sukukwitnessed.

Key Statistics
NAV (PKR/Unit) 101.2893
Net Assets (PKR mn) 133.012
Expense Ratio (Annualized) 4.86%
Levy Ratio (Annualized) 0.55%
Since Inception Return** 92.17%
Askari Equity FundFebruary - 2018
Top 10 holdings (% of Total Assets)
Indus Motor Company Limited 7.88%
Hub Power Company Limited. 6.61%
Habib Bank Limited 6.06%
DG Khan Cement Co. Limited. 5.71%
Oil & Gas Development Co Limited 4.63%
Engro Corporation Limited 4.27%
Mari Petroleum Limited. 4.16%
Pakistan Petroleum Limited. 3.85%
Pak Elektron Limited 3.12%
MCB Bank Limited 3.10%
Equity Sector Allocation (% of Assets)
Oil and Gas Exploration
15.21%
Cements 14.68%
Automobile Assemblers
11.23%
Commercial Banks 10.77%
Power Generation and Distribution
6.61%
Others 14.33%
80.38%
17.14%
2.45%
77.09%
19.74%
3.17%
0.00%
20.00%
40.00%
60.00%
80.00%
100.00%
Equity Cash Others Receivables
31 jan 2018 28 feb 2018
Asset Allocation (% of Total Assets)
Leverage: Nil
Historical Returns
FY13 FY14 FY15 FY16 FY17
AEF 42.07% 28.73% 17.59% -5.25% 14.80%
Benchmark 35.95% 25.96% 5.67% 0.37% 12.00%
Performance* YTD MoM 365-Days 3-Years 5-Years
AEF -17.59% -3.30% -22.78% -4.25% 55.90%
Benchmark -10.29% -1.74% -17.34% 3.44% 49.01%
IC Members:
CEO Adeel Ahmed Khan
CFO Adeel Shahid
Fund Manager Muneeb Sikander
Disclaimer: This publication is for informational purposes only and nothing herein should be construed as a solicitation, recommendation or an offer to buy or sell any fund. All investments in mutual funds are subject to market risks. Past performance is not necessarily indicative of future results. Please read the Offering Document to understand the investment policies and risks involved. The performance reported is net of management fee & all other expenses and based on dividend reinvestment gross of with-holding tax where applicable. The performance reported is net of management fee & all other expenses and based on dividend reinvestment gross of with-holding tax where applicable. The calculation of performance does not include cost of front end load .Notes:*Operational Bank Account1) The calculation of performance does not include cost of front end load. 2) Taxes apply. Further, tax credit also available as per section 62 of the Income Tax Ordinance, 2001.
**Absoulute *Adjusted for dividend
Fund Information
Fund Objective
The objective of Askari Equity Fund (AEF) is to provide equity investors a vehicle for their long term investment needs, capable of locking in capital appreciation and securing reasonable dividends from listed equity securities. The Fund would seek to replicate benchmark returns and reduce volatility compared with the benchmark through efficient equity allocations, enhancing “Risk Adjusted Returns”.
Type of Scheme Open-end
Nature of Scheme Equity Fund
Inception Date 30-Mar-12
Benchmark KSE-30 Index
Shariah Advisor Mr. Najeeb Ahmed Khan
Dealing Day/cut off time
Mon – Fri 9:00am / 4:30 pm
Pricing Mechanism Forward
Minimum Investment PKR 5,000
Front end load 2.00%
Back end load 0.00%
Management Fee 2.00 % p.a.
Trustee Central Depository Company of Pakistan Ltd. (CDC)
Auditor KPMG Taseer Hadi & Co.
Registrar Askari Investment Management Ltd.
Listing Pakistan Stock Exchange
MUFAP RECOMMENDED FORMAT
Risk Profile of the Fund
AMC Rating “AM 3”
Fund Ranking1 Year - 2 Star, 3 Year – 1 Star, 5 Year – 1 Star by
JCR-VIS
Risk Profile of Fund Medium to High
Disclosures:
SWWF (As per Circular 17 of 2012): The Scheme has maintained provisions against Sindh Workers’ Welfare Fund’s liability to the tune of Rs.0.459 million, if the same were not made the NAV per unit/YTD return of Scheme would be higher by Rs.0.3499 / 0.28%.
Monthly Review
In the month of Feb-18, Askari Equity Fund posted a return of -3.30% ascompared to its benchmark KSE-30 return of -1.74%. Net Assets of the fundstood at PKR 133 million as compared to PKR 137 million in the previousmonth. By the month end, equity exposure was 77.09% as compared to80.38% of the previous month. Cash and cash equivalent closed the monthat 19.74% % as compared to 17.14% in the previous month.

Non Compliant Exposures / Assets in Askari High Yield SchemeFebruary - 2018
Name Of Non Compliant InvestmentType of
Investment
Value of Investment
Before Provisioning
Provision held if any
Value of Investment
After Provisioning
Suspended Markup
% of Net Assets% of Gross
Assets
Saudi Pak Leasing TFA 15,000,000 15,000,000 - - 0% 0%
Trust Investment Bank TFA 129,111,798 129,111,798 - 62,730,846 0% 0%
Pace Pakistan Limited TFC 74,895,000 74,895,000 - 51,871,317 0% 0%
Agritech Limited (30-11-2007) TFC 59,952,000 59,952,000 - 39,430,381 0% 0%
Agritech Limited (01-01-2012) TFC 11,875,000 11,875,000 - 7,078,801 0% 0%
New Allied Electronics (LG) PPTFC 10,221,613 10,221,613 - 14,300,909 0% 0%
Trust Investment Bank Limited TFC 18,742,500 18,742,500 - 10,962,447 0% 0%
Dewan Cement Limited TFC 125,000,000 125,000,000 - 167,150,856 0% 0%
World call Telecom Limited TFC 8,994,598 8,994,598 - - - -
Security Leasing Company Limited TFC 12,322,907 12,322,907 - - 0% 0%
Total 483,083,794 479,665,874 3,417,920 353,525,557 0.00% 0.00%
Disclaimer: This publication is for informational purposes only and nothing herein should be construed as a solicitation, recommendation or an offer to buy or sell any fund. All investments in mutual funds are subject to market risks. Past performance is not necessarily indicative of future results. Please read the Offering Document to understand the investment policies and risks involved. The performance reported is net of management fee & all other expenses and based on dividend reinvestment gross of with-holding tax where applicable. The performance reported is net of management fee & all other expenses and based on dividend reinvestment gross of with-holding tax where applicable. The calculation of performance does not include cost of front end load .
MUFAP RECOMMENDED FORMAT
Below are the details of non-complaint exposure/assets in our funds. These non-compliant exposures/assets include non-performing assets which have been classified in line with the applicable SECP circulars and the provisioning policy** (available on our web site) approved by the Board of Directors of Askari Investment Management Limited.
**Presents market value of shares