Functionalization of Quantum Rods with … · Functionalization of Quantum Rods with...
27
Functionalization of Quantum Rods with Oligonucleotides for Programmable Assembly with DNA Origami Supplemental Information Tennyson L. Doane, a Rabeka Alam, a,b Mathew M. Maye* a a Department of Chemistry, Syracuse University, Syracuse, NY 13215. b Current Address: Department of Chemistry and Biochemistry, Notre Dame University, Notre Dame Indiana, 46556, U.S.A. *[email protected] Materials: Single stranded DNA was purchased from Integrated DNA Technologies. M13mp18 was purchased from New England Biolabs. Sodium hydroxide and chloroform were purchased from Fisher. Cadmium oxide (CdO, ≥99.99%), sulfur (reagent grade, 100 mesh), selenium powder (Se, reagent grade ≥99.999), 1-octadecene (ODE 90%), trioctylphosphine oxide (TOPO, 90%), hexadecylamine (HDA, 98%), trioctylphosphine (TOP, 97%), tris acetate, magnesium chloride, ethyldiaminetetracetic acid, toluene, ethidium bromide, 10x TAE buffer, 10x TBE buffer. rhodamine 6G, pentamethylethylenediamine (PEMED), and ammonium persulfate (APS) were purchased from Sigma Aldrich. GelSafe Green and GelSafe Red (Biotinium) were purchased from VWR. Octadecylphosphonic acid (ODPA, 98%), n-decylphosphonic acid (DPA, 97%) and hexylphosphonic acid (HPA, 98%) were purchased from Strem Chemicals. All chemicals were used without further purification. Both Ethanol (Pharmco-AAPer) and 40% acrylamide/bisacrylamide monomer solution (Baker) were purchased and used without further purification. Instrumentation: Optical absorption measurements were preformed using either a Varian Cary 50 Bio spectrometer or a Cary 100 spectrometer, the latter of which was equipped with a multicell peltier heating accessory. The photoluminescence and anisotropy measurements were conducted with a Fluoromax4 spectrofluorometer equipped with automated excitation and emission polarizers. Quantum yield measurements were preformed on dilute samples (O.D. λ Excite < 0.1) and excitation of the core structure alone (λ = 500 nm) versus Rhodamine 6G in ethanol as the standard. 1 Additional PL were obtained using a Varian Cary Eclipse spectrometer that was equipped with a plate reader. AFM imaging was performed on a Digital Instrument Nanoscope IIIa using an E-scanner and silicon AFM tips (μMasch, HG:NSC14 / AlBs) that had a typical resonance frequency of ~160 Hz. Imaging was performed on Mica substrates (Ted Pella) that were freshly cleaved and pre-soaked with 35 μL of 0.1M magnesium acetate (20~30 min) before being rinsed with 35 μL of 10 mM Tris Acetate buffer. Typically, a 5 μL sample solution was added to the surface, and diluted with 30 μL of 10 mM TA buffer. The substrate was subsequently allowed to sit for 15 minutes, and the solution was wicked away using filter paper and dried for 90s with argon gas. The dried samples were imaged in tapping mode. The confocal microscopy was performed on a Zeiss LSM-710 microscope. For these experiments, the 15μL of purified QR+origami conjugates were incubated with 1x GelSafe Green for ~10 minutes and then 2 μL of a 40% acrylamide-bisacrylamide solution (29:1) was added. A stock solution of 10% ammonium persulfate was prepared and 1 μL was added to the mixture, followed rapidly by pentamethylethylenediamine to give a 0.25% concentration, and the gel was sandwiched between two pre-cleaned microscopy cover slips. Electronic Supplementary Material (ESI) for Nanoscale. This journal is © The Royal Society of Chemistry 2015
Transcript of Functionalization of Quantum Rods with … · Functionalization of Quantum Rods with...
Functionalization of Quantum Rods with Oligonucleotides for Programmable Assembly with DNA Origami
Supplemental Information
Tennyson L. Doane,a Rabeka Alam,a,b Mathew M. Maye*a
aDepartment of Chemistry, Syracuse University, Syracuse, NY 13215. bCurrent Address: Department of Chemistry and Biochemistry, Notre Dame University, Notre Dame Indiana, 46556, U.S.A. *[email protected]
Materials: Single stranded DNA was purchased from Integrated DNA Technologies. M13mp18 was purchased from New England Biolabs. Sodium hydroxide and chloroform were purchased from Fisher. Cadmium oxide (CdO, ≥99.99%), sulfur (reagent grade, 100 mesh), selenium powder (Se, reagent grade ≥99.999), 1-octadecene (ODE 90%), trioctylphosphine oxide (TOPO, 90%), hexadecylamine (HDA, 98%), trioctylphosphine (TOP, 97%), tris acetate, magnesium chloride, ethyldiaminetetracetic acid, toluene, ethidium bromide, 10x TAE buffer, 10x TBE buffer. rhodamine 6G, pentamethylethylenediamine (PEMED), and ammonium persulfate (APS) were purchased from Sigma Aldrich. GelSafe Green and GelSafe Red (Biotinium) were purchased from VWR. Octadecylphosphonic acid (ODPA, 98%), n-decylphosphonic acid (DPA, 97%) and hexylphosphonic acid (HPA, 98%) were purchased from Strem Chemicals. All chemicals were used without further purification. Both Ethanol (Pharmco-AAPer) and 40% acrylamide/bisacrylamide monomer solution (Baker) were purchased and used without further purification.
Instrumentation: Optical absorption measurements were preformed using either a Varian Cary 50 Bio spectrometer or a Cary 100 spectrometer, the latter of which was equipped with a multicell peltier heating accessory. The photoluminescence and anisotropy measurements were conducted with a Fluoromax4 spectrofluorometer equipped with automated excitation and emission polarizers. Quantum yield measurements were preformed on dilute samples (O.D.λ Excite < 0.1) and excitation of the core structure alone (λ = 500 nm) versus Rhodamine 6G in ethanol as the standard.1 Additional PL were obtained using a Varian Cary Eclipse spectrometer that was equipped with a plate reader. AFM imaging was performed on a Digital Instrument Nanoscope IIIa using an E-scanner and silicon AFM tips (µMasch, HG:NSC14 / AlBs) that had a typical resonance frequency of ~160 Hz. Imaging was performed on Mica substrates (Ted Pella) that were freshly cleaved and pre-soaked with 35 μL of 0.1M magnesium acetate (20~30 min) before being rinsed with 35 μL of 10 mM Tris Acetate buffer. Typically, a 5 μL sample solution was added to the surface, and diluted with 30 μL of 10 mM TA buffer. The substrate was subsequently allowed to sit for 15 minutes, and the solution was wicked away using filter paper and dried for 90s with argon gas. The dried samples were imaged in tapping mode. The confocal microscopy was performed on a Zeiss LSM-710 microscope. For these experiments, the 15μL of purified QR+origami conjugates were incubated with 1x GelSafe Green for ~10 minutes and then 2 μL of a 40% acrylamide-bisacrylamide solution (29:1) was added. A stock solution of 10% ammonium persulfate was prepared and 1 μL was added to the mixture, followed rapidly by pentamethylethylenediamine to give a 0.25% concentration, and the gel was sandwiched between two pre-cleaned microscopy cover slips.
Electronic Supplementary Material (ESI) for Nanoscale.This journal is © The Royal Society of Chemistry 2015

Quantum Rod Synthesis & Phase Transfer: CdSe/CdS QRs was synthesized using previously published seeded growth approaches with modification. CdSe QR seeds was synthesized by injecting Se-TOP (0.7 mmol) into a hot mixture of CdO (0.5 mmol) dissolved in purified TOPO (8.0 mmol), phosphonic acid (0.9 mmol) and octadecene (2 ml) at 350 °C in an inert atmosphere and allowing growth of CdSe QRs to occur for 10 minutes before quenching the reaction by cooling to room temperature. CdSe QRs with l/w = 2.5 ± 0.3 (l = 9.9 ± 0.9 nm, w = 2.5 ± 0.3 nm) for seeded growth of QR(615) were prepared by using DPA (0.9 mmol) and CdSe QRS with l/w = 4.1 ± 0.4 (l = 19.4 ± 1.6 nm, w = 4.7 ± 0.3 nm) for seeded growth of QR(650) was prepared by using a mixture of MPA (0.1 mmol) and ODPA (0.8 mmol). Before using CdSe QRs for seeded growth of CdS QRs, CdSe QRs were purified by precipitating QRs in a combination of toluene and methanol via centrifugation two to three times. Concentration of QRs was quantified using previously reported method.2 For seeded growth of CdS, a solution of CdSe QR seeds (10 nmol) and S (2.0 mmol) dispersed in TOP (2 ml) was injected into a mixture of CdO (0.5 mmol) dissolved in TOPO (8.0 mmol), HPA (0.2 mmol), ODPA (0.4 mmol) and octadecene (2 ml) at 350 °C and allowing growth of QRs to occur for 10 minutes before quenching the reaction by cooling to room temperature. CdSe/CdS QRs was purified via precipitation as described above and stored in toluene. A set of TEM images and statistical analyses is shown in Fig. S1. Phase transfer of the QRs was accomplished using a histidine-mediated phase transfer route.3 In a typical experiment, 400 µL of 4.55 µM of the QR solution in toluene was dried to a thin film using a nitrogen stream, and then re-suspended in 200 µL of chloroform. Then 200 µL of 114 mM L-Histidine was added and the solution was vortexed, with immediate phase transfer. Next, 200 µL of 10 mM Tris-acetate buffer (pH 8.2) was added and again the solution was vortexed. The lower chloroform layer was extracted, and the solution was cleaned 3 times with excess chloroform for complete removal of organic ligands. The final aqueous layer was transferred to a 3 kDa molecular weight cutoff (MWCO, Amicon) filter and centrifuged at 6000 rpm for 5 minutes. Experimentally, repeating this step to ensure complete removal of histidine resulted in significant loss of His-QRs. The remaining solution was collected and diluted to 200 µL as a stock solution. We observed that to achieve the best stability, a reaction ratio of histidine such that the ligand:QR surface area was 40-50 / nm2 was needed. DNA Functionalization: In a typical reaction, the U-type ssDNA and it’s complementary protecting strands (U’1 and U’2 for example) were incubated in 10 mM tris acetate buffer with 100 mM NaCl at 4°C to ensure complete protection of the outermost 15 bases. This solution was mixed with the QR at a ratio of 100:1 (typical QR concentration ~0.9 μM) at 4°C. Salt aging was employed, moving from a nominal ionic strength of 30 mM to a final ionic strength of 100 mM over the period of three hours. The reaction was allowed to proceed for >48 hours to ensure maximum DNA coverage. Purification of the dsDNA coated QRs was conducted using centrifugation-induced precipitation at 13,000g for 15 minutes. Successive centrifugations after dilution with 10 mM tris acetate both decreased the overall DNA concentration and lowered the ionic strength, leading to favorable melting temperatures for dehybridizing the dsDNA. In the case of the T series, a 30% isopropanol:tris acetate buffer solution could be used to lower the melting temperature for dsDNA,4 and also induce better rod precipitation. In later experiments, we used ultracentrifugation to substantially increase particle pelleting for more thorough purification.

DNA Quantification: The quantification of ssDNA grafted to the QR was conducted using a modified Cy 3 methodology we have used in previous work.5 A 100 kDa MWCO filter was used for separating bound and unbound Cy3, with the bound Cy3 modified QRs remaining in the above solution. The filters were first pretreated with a 1% Triton 100x solution in Tris-Acetate buffer to avoid non specific absorption (Fig. S3). In this step, the filters were first loaded with 400 µL of Triton and centrifuged at 12,700 RPM for 3 minutes, with the process repeated 2 additional times. The tubes were then washed with 400 µL of 0.75M NaCl in 10 mM Tris-Acetate Buffer to remove any excess Triton X. Hybridization of the U’ – Cy 3 ssDNA to the U ssDNA coated QRs was achieved by mixing the two components at 50:1 ratio (QR ~ 100 nM) in 10 mM Tris-acetate with 100 mM NaCl at room temperature overnight and compared to a control solution of Cy 3 under identical conditions. The resulting solutions were then diluted with 200 µL of 0.75M NaCl, transferred to freshly prepared Triton-treated MWCO filters, and centrifuged at 12,700 rpm for 3 minutes with cooling. The filtered solutions (i.e. free U’-Cy3) were then transferred to a quartz cuvette and both absorbance and fluorescence measurements were recorded as a function of serial dilution to establish a calibration curve. The equation of the lines for both calibration curves were used to calculate the amount of Cy 3 in the original solution, and taking into account the dilution during centrifugation, the amount of Cy 3 that did not transfer was calculated. In later experiments, ultracentrifugation could also be used for particle pelleting and the supernatant was examined to determine unbound Cy 3.
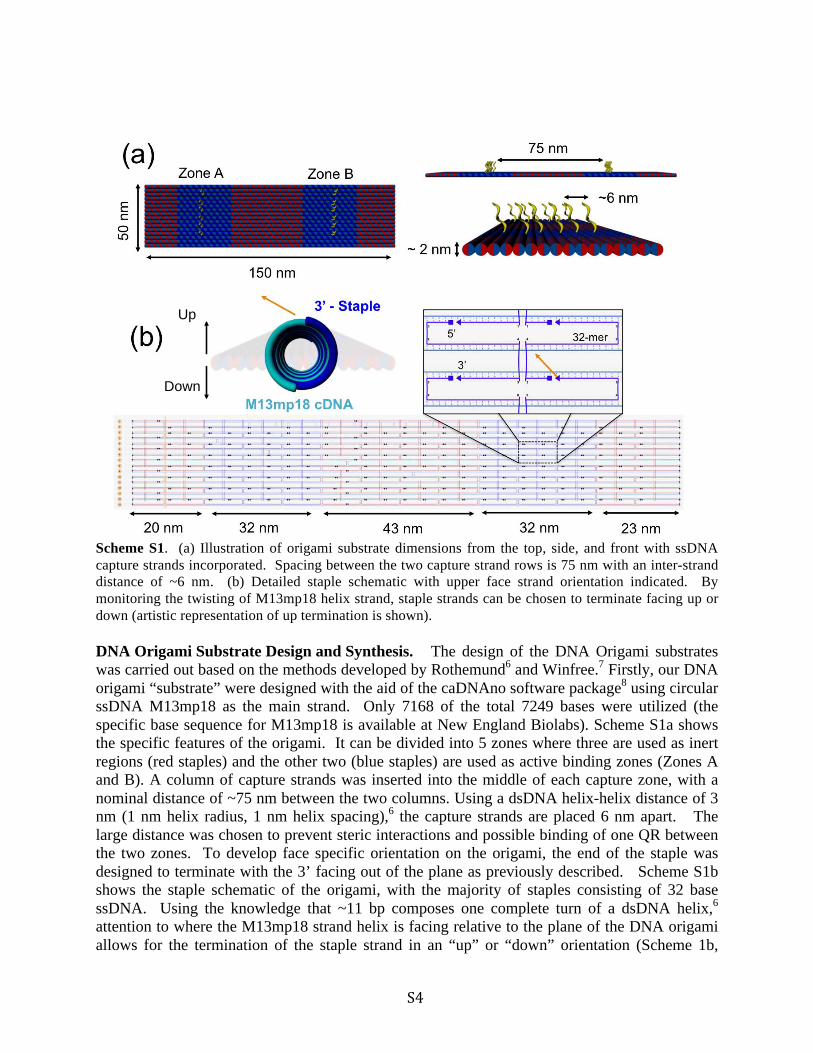
Scheme S1. (a) Illustration of origami substrate dimensions from the top, side, and front with ssDNA capture strands incorporated. Spacing between the two capture strand rows is 75 nm with an inter-strand distance of ~6 nm. (b) Detailed staple schematic with upper face strand orientation indicated. By monitoring the twisting of M13mp18 helix strand, staple strands can be chosen to terminate facing up or down (artistic representation of up termination is shown).
DNA Origami Substrate Design and Synthesis. The design of the DNA Origami substrates was carried out based on the methods developed by Rothemund6 and Winfree.7 Firstly, our DNA origami “substrate” were designed with the aid of the caDNAno software package8 using circular ssDNA M13mp18 as the main strand. Only 7168 of the total 7249 bases were utilized (the specific base sequence for M13mp18 is available at New England Biolabs). Scheme S1a shows the specific features of the origami. It can be divided into 5 zones where three are used as inert regions (red staples) and the other two (blue staples) are used as active binding zones (Zones A and B). A column of capture strands was inserted into the middle of each capture zone, with a nominal distance of ~75 nm between the two columns. Using a dsDNA helix-helix distance of 3 nm (1 nm helix radius, 1 nm helix spacing),6 the capture strands are placed 6 nm apart. The large distance was chosen to prevent steric interactions and possible binding of one QR between the two zones. To develop face specific orientation on the origami, the end of the staple was designed to terminate with the 3’ facing out of the plane as previously described. Scheme S1b shows the staple schematic of the origami, with the majority of staples consisting of 32 base ssDNA. Using the knowledge that ~11 bp composes one complete turn of a dsDNA helix,6 attention to where the M13mp18 strand helix is facing relative to the plane of the DNA origami allows for the termination of the staple strand in an “up” or “down” orientation (Scheme 1b,
150 nm ~ 2 nm
50 n
m
75 nm
~6 nm
75 nm
6 nm
5’
3’
32-mer
M13mp18 cDNA
3’ - Staple
(a)
(b)
20 nm 32 nm 43 nm 32 nm 23 nm
Zone A Zone B
Up
Down

helix illustration). In both Zones A and B, strands are allowed to periodically terminate in the up face to allow the display of a capture strand. These capture strands are integrated into the substrate and leave dangling a 5b poly-T spacer, followed by the complementary sequences (i.e. U’). Importantly, the origami design allows for more rigorous investigations on the relation between complimentary ssDNA display (number and position) and rod capture efficiency (orientation and yield), which we are actively pursuing. A more detailed schematic and full list of staple strands are shown in Appendix S1 and S2, respectively. The assembly of the substrates was achieved as follows: 0.5 μL of a 150μM stock of each capture strand was added to a small PCR tube (212 strands × 0.5 μL = 106 μL), and diluted to 1060 μL; 106 μL of this solution was combined with 15 μL of 52.5 nM M13mp18 to obtain a final concentration of 60 nM staple / 5 nM M13mp18. The solution was also composed of 40 mM Tris-Acetate, 10 mM magnesium acetate, and 1 mM ethylendiaminetetraacetic acid (EDTA), with a total volume of 153 µL. The mixture was then heated in a Techne TC-3000 temperature cycler according to the temperature profile previously reported.7 After reaching 25°C, the solution was transferred to a 100 kDa MWCO filter and ~300 μL of 0.75M NaCl in 10 mM Tris Acetate was added. The solution was centrifuged at 12,000 G for 2 min, and then refrigerated for 5-10 minutes. This process was repeated three more times (50 µL hold up volume, 350 µL of 0.75M NaCl added), and finally 350 µL of 10 mM Tris Acetate buffer was added to remove excess salt. Monitoring the filtrate via UV-Vis absorbance confirmed that this removed the majority of excess DNA (data not shown). The solution was stored in the fridge and used as required. QR-Origami Assembly & Gel Electrophoresis Assessment. The loading of QR onto the origami substrates was conducted at 25°C for a period of 1-2.5 hrs in the presence of 100 mM NaCl and 10 mM tris acetate. The introduction of rigidity to a longer poly T spacer region (URigid, SI Table 1) using a polyA sequence resulted in better hybridization (see SI Fig. 7). Assessment of the QR-Origami substrates was achieved via gel electrophoresis of DNA-QR conjugates using standard agarose gel electrophoresis protocols. Briefly, a 0.5% w/w percent agarose gel was prepared by dissolving 0.25 g of agarose in 50 mL of a 0.5x TBE buffer solution with subsequent heating in a conventional microwave and poured in to a VWR Mini-cast gel system with a subsequent cooling time of 40 minutes. The gel was then submerged under 0.5x TBE buffer, and each well was loaded with 20 μL of sample loaded with 15-25 v/v% glycerol. The gel was run at room temperature for 20-40 min with a constant applied voltage of 80V. In the experiment shown in Fig. 5, the samples were injected at two different well comb positions and run simultaneously; the gel was then split and one half was stained with GelSafe Red. The other half was cut into 3 slices and imaged using a Cary Eclipse equipped with a well plate reader accessory. Imaging of the stained gel segment was conducted using a 300 nm excitation source (VWR) and a digital camera (Cannon). The optimization of gel electrophoresis showed that increasing agarose concentration increased separation efficiencies at both shorter (Fig. S4a) and longer (Fig. S4b) run times; thus, a short gel electrophoresis experiment (15 minutes) with higher agarose concentration (0.75%) was used to separate excess QRs from the resulting conjugates (Fig. S4c). After centrifugation through a Freeze N’ Squeeze centrifugal filter (Bio-Rad) to extract the conjugates and concentration through a MWCO filter, photoluminescence measurements (Fig. S4c.) showed that the optical properties of the rod were still intact.

QR-Origami Assembly and Orientation Statistics. AFM images for multiple assembly were utilized, typically encompassing 10-12 different sampled areas. Unpurified reaction mixtures were utilized to determine the extent of hybridization, and often agglomerated structures were visible but uncounted. The criteria for counting included: A) structures which could be identified individually (no structures with two or more origami in indistinguishable contact), B) origami with dimensions expected based on caDNAno predictions (~150 nm ± 15 nm) and rectangular shape, and C) raised heights ≥ QR width. All statistics reported were for assembly populations ≥ 99 origami. Orientation of the QR on the DNA origami was determined by measuring the angles of the origami and of the assembled QR relative to the horizontal axis of the image, and taking the difference of two (0-90°). QR angle was determined by finding the long z-axis given the asymmetric shape; QRs which could not be easily distinguished were excluded from orientation calculations. Ultracentrifugation: Purification of the QR-origami assembly solutions could be carried out via gradient ultracentrifugation. A density gradient which has previously been shown to be successful at separating folded origami from free strands and larger aggregates was used.9 In a typical experiment, a ultracentrifuge tube loaded with a 15%-65% sucrose gradient (w/v) was prepared by successively adding heavier solutions from the bottom of the tube up, and the solutions were allowed to set at 4oC overnight to form a continuous gradient. A concentrated solution of QR+origami assembly solutions was prepared with a 20:1 QR excess at 100 mM NaCl concentration for 4 hours at ~14°C (to protect the DNA strands and improve hybridization) under mild stirring using a Eppendorf Thermomixer. A control solution of QRs at the same concentration was mixed as well. Ultracentrifugation was conducted at 131,000g for 30 minutes at 4°C using a Beckman Coulter Optima Max XP Ultracentrifuge. The tubes were imaged using a digital camera (Canon EOS Rebel T5 EOS 1200D) and under UV excitation. The separated regions after ultracentrifugation could be collected either via a pipette, or via a needle penetrating the tube. After collection, the solutions were dialyzed against 100 mM NaCl with 10 mM tris acetate for ~ 15 hours at 4oC with two buffer exchanges to remove excess sucrose. FRET Calculations and Simulations of Orientation Dependence: The potential energy transfer between QR(615) and QR(650) was assessed using Förster resonance energy transfer (FRET) based calculations. The FRET efficiency (E) is given by:10
where r is the donor-acceptor distance and R0 is defined as the Förster distance at which energy transfer is 50%, found using the following relation:10
with D is the donor quantum yield, 2 is the dipole orientation factor, N is Avagadro’s number, n is the refractive index, and J(λ) is the spectral overlap integral, which relates the normalized donor fluorescence (fD) and acceptor absorbance extinction coefficients (εA) at each corresponding wavelength , defined as:10

Modeling DNA Origami Mechanical Properties: The twisting and bending of the DNA origami was computed using the CanDo software package developed by Bathe and colleagues.13,14 The default properties parameters were utilized (Table S2) with fine model resolution. The results of the modeling are summarized in SI Figure 8. Supporting Tables
Table S1: QR DNA
Type Sequence (* = Phosphorothioate bases) Tm
S/S'1/S'2
(°C)
U T*T*T* T*T*T TTT TTA CTC ACC TAT ATC A
16.5 U'1 GTG AGT A
U'2 TGA TAT AG
U'3 TGA TAT AGG TGA GTA
U Rigid G*G*G* G*G*T TTT TTT TTT TTT TTT ACT CAC CTA TAT CA
T T*T*T* T*T*T TTT TTC ACG ACA CAC TTT G
27 T'1 GTC GTG A
T'2 CAA AGT GT
T'3 CAA AGT GTG TCG TGA Tm Experimentally obtained, 100 mM NaCl, pH 8.3 [S],[S’1],[S’2] = 1μM
Table S2: Modeling Parameters for DNA Origami Mechanical Properties used in CanDo simulations.13,14
Property Value
Axial Rise per base Pair 0.34 pN
Helix Diameter 2.25 nm
Crossover Spacing 10.5 bp
Axial Stiffness 1100 pN
Bending Stiffness 230 pN m2
Torsional Stiffness 460 pN m2
Nick Stiffness Factor 0.01

Supporting Figures
Figure S1. TEM images (i) of QR(615) (a) and QR(650) (b) with statistical analysis (ii-iv). The QR(615) have an average l/w = 6.8 ± 0.8 (l = 32.3 ± 2.9 nm, w = 4.7 ± 0.3 nm) and the QR(650) have an average l/w = 8.8 ± 1.4 (l = 50.1 ± 6.1 nm, w = 5.7 ± 0.4 nm).
(a) (i) (ii) (iii)
(iv)
Cou
nt
0
5
10
15
Aspect Ratio0 5 10 15
Cou
nt
0
20
Width (nm)0 5 10
Cou
nt
0
10
20
Length (nm)0 20 40 60
Cou
nt
0
10
20
30
Aspect Ratio0 10 20
Cou
nt
0
20
Width (nm)0 5 10
Cou
nt
0
10
20
Length (nm)0 50
(b) (i) (ii) (iii)
(iv)

Figure S2. (a) Normalized optical absorption (solid lines) and emission (dotted lines) spectra at 500 nm excitation for QR(615) and QR(650) CdSe/CdS QR. Insets show full absorption spectra. The quantum yields (ϕ) of the CdSe/CdS QRs in toluene and after DNA functionalization for QR(615) were 0.3 and 0.17, respectively, while the corresponding values for QR(650) were 0.2 and 0.07. (b) Fluorescence anisotropy measurements of the as-synthesized QR(615) and QR(650) showing excitation dependent polarized emission.
Figure S3. Comparison of the absorbance and fluorescence (a and b) of remaining Cy3 after hybridization to unprotected and protected U-ssDNA coated QR 615Ls relative to a control solution (shown in figure 1d). A dilution calibration curve was used to assess how much Cy3-U’ did not hybridize. Hybridization conditions: 50:1 Cy-3 to QR concentration (QR = ~80nM) with100 mM NaCl in 10 mM NaCl incubated overnight at 25°C. Subsequent analysis revealed a nearly two fold increase in the amount of DNA when using protected strands (c).
Wavelength (nm)300 400 500 600 700 800
Wavelength (nm)300 400 500 600 700 800
No
rmal
ized
Op
tica
l Res
po
nse QR(615)
QR(650)
0
2
0
2
Wavelength (nm)
550 600 650 700 750 800
QR(615)
QR(650)
PL
An
iso
tro
py
(r)
0.1
0.2
0.3
0.1
0.2
0.3
Wavelength (nm)
350 400 450 500 550 600 650
Control ssDNA17% Diff
Protected ssDNA 32% Diff
Dilution
Ab
sorb
ance
in S
up
ern
atan
t
0
0.1
0.2
0.3
λ(nm)
500 600
λ(nm)
500 600
λ(nm)
500 600
Control ssDNA17% Diff
Protected ssDNA 29% Diff
Dilution
Flu
ore
scen
ce (
CP
S)
0
2
4
6×10⁶
λ(nm)
550 600 650
λ(nm)
550 600 650
λ(nm)
550 600 650
AbsorbanceFluorescence
DNA/QR
0
2
4
6
8
10
12
14
16
18
ssDNA Protected ssDNA
(a) (b)
(a) (b)
(c)

Figure S4. (a-d) Additional AFM images of the DNA origami on Mica.
(a) (b)
(c) (d)

Figure S5. Additional AFM images of URigid-QR(615)-origami conjugates. Statistical analysis found that 70% of origami contained at least one rod, with 29% having two per origami (N =148) after 2.5 hr incubation.
(a)
(c)
(e)
(b)
(d)
(f)

Figure S6. Representative large scan range (4x4 μm) AFM images of unpurified URigid-QR(615)-origami conjugates used for assessing assembly yields and orientation control. Unpurified products contain significant number of aggregates in addition to free-standing origami. Only individual origami were counted for assembly yields and relative orientations.
(a) (b)
(c) (d)

Figure S7. AFM images (517 x 517 nm) in height (a and c), phase (b and d) mode for two different QR(615)-origami revealing variations in orientations of the QR.
Figure S8. Statistical analysis of AFM images for the number of QRs per origami for different DNA configurations and times.
n = 150 n = 99 n = 148
Nu
mb
er (
%)
0
10
20
30
40
50
60
70
80
# QRs
0 1 2
# QRs
0 1 2
# QRs
0 1 2
Time = 1 hr Time = 1 hr Time = 2.5 hr
U U Urigid + (A)15

Figure S9. Detailed orientation analysis of (a) all assembled rods (n = 142) and (b) dual-functionalized origami rods (n = 32) as a function of angle relative to the main axis of the rectangular origami. Roughly 90% of dual modified species contained at least one rod >60°, and nearly 40% had both rods correctly oriented. The average height of the origami was found to be 2.6 ± 0.4 nm and the raised height of the assembled QRs were found to be 11.6 ± 3.8 nm.
Figure S10. Normalized fluorescence spectra of extracted Origami+dye gel segments for control experiments probing the binding of zone-A and Zone-B, T-Cy3+Origami (i) (λEx = 500 nm), U-Atto 647N+Origami (iii) (λEx = 590 nm), and for origami containing both T-Cy3 and U-Atto647N (iii), (λEx = 500 nm & 590 nm).
0-30°
30-60°
60-90°
Plank Axis
Capture Strands
(i)
(ii)
(iii)
Inte
nsity
(a.
u.)
0
1
2
3
Wavelength (nm)500 600 700 800
(a)
(b)

Figure S11. (a) Comparison of the migration of stained origami, QR 650, and QR615-origami reaction mixtures in gels of different agarose concentrations in 0.5X TBE with 80V running voltage for 15 minutes. Increasing the running time to 40 minutes (b) shows a greater separation between free QR and conjugates. (c) Due to fluorescence loss at long running times, however, a short running time experiment was used; subsequent Freeze ‘n Squeeze extraction was utilized to confirm retention of QR optical absorption (dotted line) and fluorescence (solid line, λExc = 400 nm) of the excess QR615 and the conjugates relative to the original solution, Electrophoresis conditions: 0.75% agarose, 0.5x TBE, 80V, 15 minutes.
Figure S12. Images of the static origami as designed in caDNAno (a) and after CanDo modeling as viewed from the y, x, and z axes (b,c, and d, respectively). Significant bending is observed at the ends of the origami which likely displaces the capture strands from the idealized “row” anticipated in the static structure.
Origami QR 650 QR 615 + Origami
0.25% 0.5% 0.75% 0.25% 0.5% 0.75% 0.25% 0.5% 0.75%
(a)
(b)
0.50% 0.75%
QR 615 + Origami (c)
x
z
y
(a) (b)
(c) (d)
y-axis
X-axis
z-axis

Figure S13. Representative (a) 2% uranyl acetate stained TEM and (b) AFM images showing the degree of flexibility of the DNA origami. in agreement with CanDo modeling agreements. Red arrows indicate high deformed structures while white arrows show flat orgami. Deposition conditions were in 12 and 100 mM Mg2+ concentration for TEM and AFM, respectively.
(a) (b)

Appendix S1. Enlarged Origami Schematics
Origami Left
1 2 3 4 5 6 7 8
9
16
15
14
13
12
11
10
17
18
19
20
21
22
23
24
25
26
27
28
29
30
31
1 58

Capture Zone A
32
33
34
35
36
37
38
39
40
41
42
43
44
45
46
47
48
49
50
51
52
53
54
206
205
204
203
202
201
55
56 57
58
59
60
61
62
63
64
65
66
67 68
69
70
59
154

Origami Middle
155
282
71
72
73
74
77
78
75
76
79
80
81
82
83
84
85
86
87
88
89
90
91
92
93
94
95
96
97
98
99
100
101
102
103
104
105
106
107
108
109
110
111
112
113
114
115
116
117
118
119
120
121
122
123
124
125
126
127
128
129
130

Capture Zone B
283
378
131
132
133
134
135
136
137
139
140
141
142
143
144
145
138
146
147
148
149
150
151
152
153
207
208
209
210
211
212
154
155
156
157
158
159
160
161
162
163
164
165
166
167
168
169

Origami Right
379
447
170
171
172
173
174
175
176
177
178
179
180
181
182
183
184
185
186
187
188
189
190
191
192
193
194
195
196
197
198
199
200

Appendix S2. DNA Origami Staple Strands 1 GACAGATGAACCTTCATCAAGA 2 GTAATCTTGACTCAACTTTAAT 3 CATTGTGAATTTAACCCTCGTT 4 TACCAGACGACCCTTTAATTGC 5 TCCTTTTGATAAATGCCTGAGT 6 AATGTGTAGGTATCGCACTCCA 7 GCCAGCTTTCCACCGTCTATCA 8 TAAAGGGAGCCCCCGATTTAGAGCTTGCGTCA 9 AAGGGCGAAAAGGCACCGCTTC 10 CAGGCGAACCGAACTGACCAACTTTGAAAGAG 11 ATTCAGCATAGGCTGGCTGACGGTGTACAGAC 12 TTTTATTGAGATGGTTTAATTAAGAACCGGAT 13 AAATAAAGAGCAACACTATCAACCTTATGCGA 14 TTGCGTCAGGATTAGAGAGTAGATAAAAACCA 15 AGGGTCATATATTTTAAATGCAGAGGTCATTT 16 TGGTGTATCGGCCTCAGGAAGAAAGATTCAAA 17 AAGGCGTACTCAGGAGGTTTGGAATAGGTGTA 18 TCACTTACCCAAATCAACGTGAGTAGTAAATT 19 GGGCAGAACTGGCTCATTATAATTACGAGGCA 20 TAGTGCGAGAGGCTTTTGCAAGCAAACTCCAA 21 CAGGGATGGCTTAGAGCTTAAAATTTTTAGAA 22 CCCTGAGAAAGGCCGGAGACGAGGGGACGACG 23 ACAGCCGGAAACCAGGCAAAAGAACGTGGACT 24 CCAAACGGGGAAAGCCGGCGAACGTGGCGAGAAAGGAAGAGTCCACTA 25 GCCCAGTACCGCCACCCTCACCGGAACGAGGCGCAGACGGTCAATCAT 26 GAACAACAAAGCTGCTCATTGATATAAGTATA 27 AAGGACCAGTCAGGACGTTGCGAGAAACACCA 28 CGGAAAAGAAGTTTTGCCAGACATAACGCCAA 29 ATAAATTGCTGAATATAATGAGCGAACCAGAC 30 GTTTAGTCAAATCACCATCATTCAACGCAAGG 31 TTAAGCGCCATTCGCCATTCGTGCATCTGCCA 32 CTTAGGAACCGCCACCCTCAGTGCCGTCGAGA 33 GGGTTCAGTGAATAAGAAGACCGCCAGCTTGC 34 CCTGAGGAAGAAAAATCTACGTTCAACTAATG 35 CAGATAGGGGGTAATAGTAAATTAATTCGAGC 36 TTCAACTGTAGCTCAACATGTCGGGAGAAGCC 37 TTTATATATGATATTCAACCGTGGGCGCATCG 38 TAACCAGGCTGCGCAACTGTTTGTTCCAGTTT 39 GGAACAAGGGAAGAAAGCGAAAGGAGCGGGCGCTAGGAGATAGGGTTG 40 ATAAGAACCGCCACCCTCAGATCGAAATCCGCGACCTGCTCCATGTTA 41 ACCAGAAAAGGGCGACATTCAGTACCAGGCGG

42 CCACATTAATAAAACGAACTATCATATGGTTT 43 GCGTTATGTTTAGACTGGATAATTTAGGAATA 44 TTTTGTTTAAATATGCAACTACTTCAAATATC 45 GTAGATTCTAGCTGATAAATTCCCTGTAATAC 46 AGTGTGGGAAGGGCGATCGGTGTCACGTTGGT 47 TTGTGGCCACCACCCTCATTTAGCGGGGTTTT 48 GCTCAACCGATTGAGGGAGGGACAATCAATAG 49 AAAATACGGAACAACATTATTAGATTCATCAG 50 TTGAGGCGTCCAATACTGCGGGAGGAAGCCCG 51 AAAGAAAGTACGGTGTCTGGAACCAAAAACAT 52 TATGAAATGCCGGAGAGGGTAGACCGTAATGG 53 GATAGGCGGGCCTCTTCGCTATCAAAAGAATA 54 GCCCGGCGCTGGCAAGTGTAGCGGTCACGCTGCGCGTCAAAATCCCTT 55 GGATTTCAGGGATAGCAAGCCCGGAGATTTGTATCATCGCCTGATAAA 56 TACAACAATAGGAACCCATGTGGCTGAGACTC 57 CTCAAGAAATTATTCATTAAAGCAAAGACACC 58 ACGGAGCGCCCAATAGCAAGCAGCAAGCCGTT 59 TTTATCATTGAATCCCCCTCAAGAAGCAAAGC 60 GGATTACAGTTGATTCCCAATAAAGCCTCAGA 61 GCATACTACAAAGGCTATCAGGTCGGATTCTC 62 CGTGGAAGGGGGATGTGCTGCGTGGTTCCGAA 63 ATCGGAACCACCACACCCGCCGCGCTTAATGCGCCGCAAAATCCTGTT 64 TAAGAACCGTAACACTGAGTTAGCGATTATACCAAGCGCGAAACAAAG 65 GAAACGGTGAATTATCACCGTCATGAAAGTAT 66 GAACAAAATCAGATATAGAAGAACATATAAAA 67 TAGTCAATGCTTTAAACAGTTGCACTCATCGA 68 GCAATTCTGCGAACGAGTAGACCTGACTATTA 69 AACCCGTCATTGCCTGAGAGTAGCAAAATTAA 70 TGATGAAGGCGATTAAGTTGGGAGCGAGTAAC 71 CCCCTCGTCACCAGTACAAAACCTATTATTCT 72 GAAACACCGACTTGAGCCATCATACATAAAGG 73 TGGCGCTTATCCGGTATTCTTATTAAACCAAG 74 TACCCAGAAAACGAGAATGACCATATTTTAAC 75 ACATTAAATGTGTAACGCCAGGGTTTTTTTGC 76 CCCAGCAGGCGTACAGGGCGCGTACTATGGTT 77 TCAGGTCTTTACTTTAGTTTGACCATTAGGCA 78 AGGCAAAGAATTCTGGAGCAAACAAGAGCATCA 79 ATTTCGCAAATAGAGACTACCTAATCAAAAA 80 ATGAACGGTAATCCAATAAATCATACAGATAC 81 TCACGACGTTGTCCTGTAGCCAGCTTTAATCG 82 GCTTTGACGAGAAGCGGTCCACGCTGGCCCAG 83 TAGCAGAATACACTAAAACACTCATCTTTGAC 84 GCCACCCTGCCTATTTCGGACTACAACGCCTG

85 CGTTGCAAACGTAGAAAATATTGGGAATTAGA 86 CTCCTCATTCCAAGAACGGGAAGAACGCGAGG 87 CAAAATTCCACAGACAGCCCATAAACAGTTAA 88 TGCCGCAAAATCACCAGTAGATTACGCAGTAT 89 GTTATTAGCGAACCTCCCGACGGCTGTCTTTC 90 CTTAGGCTTAGGTTGGGTTACAAAATCATAGG 91 TCTGGGTCAATAACCTGTTTAGTAGTAGCATT 92 AACATCGTAAAACTAGCATGAATTCGCGTCTG 93 GCCTTAAAACGACGGCCAGTCTGAGAGAGTTG 94 CAGCCACGTATAACGTGCTTTCCTCGTTAGAATCAGCCTTCACCGCCT 95 CCGTTCATAGTTAGCGTAACCGAAGGCACCAACCTAAAACGAAAGAGG 96 CCTTCACCATTACCATTAGCGAGTAACAGTGC 97 TAATCTTGCGGGAGGTTTTGATGATTAAGACT 98 TTATTATAACTATATGTAAAGAAACCAATCAA 99 TAATAGCTATATTTTCATTTTCAATAGTGAAT 100 AAATTCAATCATATGTACCCCATCAATTCTAC 101 GGCCGCCAAGCTTGCATGCCGAACGCCATCAA 102 ACTAGATCTAAAGTTTTGTCACGGGGTCAGTG 103 CCTTAAGGCCGGAAACGTCAACCCAAAAGAAC 104 TGGCAAGCCTTAAATCAAGAAATTTACGAGCA 105 TGTATGCTGATGCAAATCCAAAGACGCTGAGA 106 AGAGGGGGCGCGAGCAATCCTGATTGTTTGGATTATAGCGATAGCTTA 107 GTGGCGGTTGATAATCAGAAATTTTTTAACCA 108 ATAGTGCAGGTCGACTCTAGGGCAACAGCTGA 109 TTGCAGCGGGAGCTAAACAGGAGGCCGATTAAAGGGTTTCACCAGTGA 110 TTTAGTCTTTCCAGACGTTACCATTAAACGGGTAAAATACGTAATGCC 111 GAATCCAATGAAACCATCGACTGGTAATAAGT 112 TCCTTTAGTTGCTATTTTGCGCAATAATAACG 113 GATTATCGCAAGACAAAGAAAATAATATCCCA 114 GCTCAAGCCCCAAAAACAGGATGATGGCAATTCATCAATATTGAAAAG 115 GACGAGGATCCCCGGGTACCTTTGTTAAATCA 116 GTTTGTAAATGAATTTTCTGATGATACAGGAG 117 TGTATAGCAGCACCGTAATCAGGAAACCGAGG 118 AAACACCCAGCTACAATTTTAGTCCTGAACAA 119 GAAACGCGAGAAAACTTTTTGAATCCTTGAAA 120 ACATACTTCTGAATAATGGATATTCCTGATTA 121 TCAGAAGATTGTATAAGCAAAAATTCGCATTA 122 AATTGAGCTCGAATTCGTAACCAGGGTGGTTT 123 TTCTATTTTAGACAGGAACGGTACGCCAGAATCCTGGTTTGCGTATTG 124 TTTGTATGGGATTTTGCTAATGAGGACTAAAGACTTTTTCATGAGGAA 125 CAGAAGTAGCGACAGAATCATCATACATGGCT 126 GATAATCCTGAATCTTACCAGAACAAAGTTAC 127 CTTACAAATATATTTTAGTTTTATCAACAATA

128 ATCAAGGGTTAGAACCTACCAATTAATTTTCC 129 GTTAATATTTAAATTGTAAAAGCGGAATTATC 130 GGCGTCATGGTCATAGCTGTCGTTAATATTTT 131 GGCTTACAACTTTCAACAGTTACCGTTCCAGT 132 AAGCGAGTTTGCCTTTAGCGTAAGTAAGCAGA 133 TAGCCACGCTAACGAGCGTCTTGCAGAACGCG 134 CCTGTAATTTCATCTTCTGACGTAAATCGTCG 135 CTATTATATCAAAATTATTTGAGAAACCACCA 136 GAAGGGCCTGCAACAGTGCCAGGTCAGTATTA 137 ACACCTTCCTGTGTGAAATTGCGCGCGGGGAG 138 AGGCGAGAAGTGTTTTTATAATCAGTGAGGCCACCGATTAATGAATCG 139 AATTTTCAGCGGAGTGAGAATCGGAACGAGGGTAGCAACGGCTACAGA 140 AAGAACAGACTGTAGCGCGTTCGCAGTCTCTG 141 GCTAATTCCAGAGCCTAATTTAAGCCCTTTTT 142 CTTCTCTAAATTTAATGGTTTCAACATGTTCA 143 AACAACACGTAAAACAGAAATGAATAACCTTG 144 GAGGCCGCTGAGAGCCAGCAGTCATTTTGCGG 145 GCCAATTATCCGCTCACAATTAAAACAGAGGT 146 AGCATAGAAAGGAACAACTAAAAGCCAGAATG 147 GAAAGTTCATCGGCATTTTCGAATAGCTATCT 148 TACCGGCCAGTTACAAAATAAAGACGACGACA 149 ATAAAGAAATACCGACCGTGTATCAATATATG 150 TGAGTAAAGAAATTGCGTAGAAGTTTGAGTAA 151 CATTACAAATGAAAAATCTAAACCACCAGCAG 152 AAGATCCACACAACATACGAGTGTCGTGCCAG 153 CTGCAGTAAAAGAGTCTGTCCATCACGCAAATTAACCTTCCAGTCGGG 154 CATTAAGGAATTGCGAATAATGGATCGTCACCCTCAGCAGCGAAAGAC 155 TTGCGAATTTTTTCACGTTGACTTGATATTCA 156 CAAACTAGCGTTTGCCATCTTCCAATAATAAG 157 AGCAATCCCAATCCAAATAAGAAGTACCGACA 158 AAAGGAATAAGAATAAACACCGAATTACCTTT 159 TTTAACAGATGAATATACAGTAAATCCTTTGC 160 CCGAAACCTCAAATATCAAACCCTAAAACATC 161 GCCATTAAAGCCTGGGGTGCCGCGCTCACTGC 162 CCGCTGTTGTAGCAATACTTCTTTGATTAGTAATAACTCACATTAATT 163 TTGGCAAATCTCCAAAAAAAAAGGCTTGCAGGGAGTTAAAGGCCGCTT 164 TAAGCTTCATAATCAAAATCAAGGTCAGACGA 165 ATATAAAACGATTTTTTGTTTAAGAATTGAGT 166 CATTTGGAATCATAATTACTAGTAATAAGAGA 167 GTATTAACAGTACCTTTTACATTTAACAATTT 168 ATAGCCCTCAATCAATATCTGTTCGACAACTC 169 GCGTTTAATGAGTGAGCTAACTGCGCGAACTG 170 GCTGGGCTCCAAAAGGAGCCGACAGGAGGTTG

171 AGGCCCGGAACCAGAGCCACCAGAGAGATAAC 172 CCACAACGTCAAAAATGAAAAGGCATTTTCGA 173 GCCAGAAAAAGCCTGTTTAGAACAAAATTAAT 174 TACATCGGGAGAAACAATAATAGACTTTACAA 175 ACAAGTCAGTTGGCAAATCAGGCTATTAGTCT 176 TTAAATTTACATTGGCAGATTCGTCTGAAATG 177 GATTATCACTTGCCTGAGTAGAAGAACTCAAACTATACATTTTGACGC 178 CATTTTTAATTGTATCGGTTCGCCCACGCATAACCGATATATTCGGTC 179 ATATCACCGGAACCGCCTCCAGCCGCCGCCAG 180 GCAGATAGCAGCCTTTACAGAATTGAGCGCTA 181 AGAATATCATATGCGTTATACATGTAATTTAG 182 GTATCGGATTCGCCTGATTGAAACAAACATCA 183 GAATACAGTTGAAAGGAATTGAGGATTTAGAA 184 TCAATCACCAGTCACACGACGACAATATTTTT 185 ACCATTATCAGCTTGCTTTCGCCAGAACCACC 186 ACCAGCTCAGAGCCGCCACCCAACAAAGTCAG 187 AGGGTAGAGAATAACATAAAATATTTAACAAC 188 GCCAACAAATTCTTACCAGTAGCAAAAGAAGA 189 TGATGCTTTGAATACCAAGTTAATAGATAATA 190 CATTTGAGGAAGGTTATCTAAAAGAATACGTG 191 GCACACAGTAATAAAAGGGACGCTCATGGAAA 192 TACCTCGGCCTTGCTGGTAATATCCAGAACAATATTACCGCC 193 TGATACCGATAGTTGCGCCGACAATGACAACA 194 CCACCACCCTCAGAGCCGCCAAGGTGAATTTCTTAAACAGCT 195 GAGAATTAACTGAACACCCTGTCAGAACCGCCACCCTCAGAG 196 GGGCTTAATTGAGAATCGCCAACAGGGAAGCGCATTAGACGG 197 TTATTCATTTCAATTACCTGATAAAGCCAACGCTCAACAGTA 198 AACTAATAGATTAGAGCCGTCACAAAATCGCGCAGAGGCGAA 199 ACCCTTCTGACCTGAAAGCGTAATATCTTTAGGAGCACTAAC 200 AGCCATTGCAACAGGAAAAACATTCTGGCCAACAGAGATAGA
DNA Origami Capture Strands
201 TTGTCAAGGTAAATATTGACGGAGAAGGATTA TTTTT TGATATAGGTGAGTA
202 TAGAAACAGGGAATCATTACCATAAGTTTATT TTTTT TGATATAGGTGAGTA
203 ATTAAAATCGTCATAAATATTTTTCATCGTAG TTTTT TGATATAGGTGAGTA
204 GTTGTAGTTTCATTCCATATAGCATCAAAAAG TTTTT TGATATAGGTGAGTA
205 GGATTGCTATTTTTGAGAGATAAGCTAAATCG TTTTT TGATATAGGTGAGTA 206 ATAAATTACGCCAGCTGGCGAGAACAAACGGC TTTTT TGATATAGGTGAGTA
207 ATAGCGTCATAGCCCCCTTATAAATAAATCCT TTTTT TGATATAGGTGAGTA
208 TGTCCACAGCCATATTATTTAGAAACAATGAA TTTTT TGATATAGGTGAGTA

209 CATAAGATAAATAAGGCGTTATAAAGTAATTC TTTTT TGATATAGGTGAGTA
210 TTAAATTTTCAGGTTTAACGTTGGAAACAGTA TTTTT TGATATAGGTGAGTA
211 AACGAAGCATCACCTTGCTGACGTTATTAATT TTTTT TGATATAGGTGAGTA
212 AAACCCCGGAAGCATAAAGTGTAAAAATACCG TTTTT TGATATAGGTGAGTA
Supporting References (1) Magde, D.; Wong, R.; Seybold, P. G. Photochem. Photobiol. 2002, 75, 327–334. (2) Shaviv, E.; Salant, A.; Banin, U. ChemPhysChem 2009, 10, 1028–1031. (3) Zylstra, J.; Amey, J.; Miska, N. J.; Pang, L.; Hine, C. R.; Langer, J.; Doyle, R. P.; Maye, M.
M. Langmuir 2011, 27, 4371–4379. (4) Smith, B. D.; Liu, J. J. Am. Chem. Soc. 2010, 132, 6300–6301. (5) Alexander, C. M.; Dabrowiak, J. C.; Maye, M. M. Bioconjug. Chem. 2012, 23, 2061–2070. (6) Rothemund, P. W. K. Nature 2006, 440, 297–302. (7) Maune, H. T.; Han, S.; Barish, R. D.; Bockrath, M.; Iii, W. A. G.; Rothemund, P. W. K.;
Winfree, E. Nat. Nanotechnol. 2009, 5, 61–66. (8) Douglas, S. M.; Marblestone, A. H.; Teerapittayanon, S.; Vazquez, A.; Church, G. M.;
Shih, W. M. Nucleic Acids Res. 2009, 37, 5001–5006. (9) Lin, C.; Perrault, S. D.; Kwak, M.; Graf, F.; Shih, W. M. Nucleic Acids Res. 2013, 41, e40–
e40. (10) Lakowicz, J. R. Principles of fluorescence spectroscopy; 2nd ed.; Kluwer
Academic/Plenum: New York, 1999. (11) Scholes, G. D. Annu. Rev. Phys. Chem. 2003, 54, 57–87. (12) Van Der Meer, B. W.; Coker III, G.; Chen, S. S. Y. Resonance energy transfer: theory and
data.; Vch -Wiley: New York, 1994. (13) Castro, C. E.; Kilchherr, F.; Kim, D.-N.; Shiao, E. L.; Wauer, T.; Wortmann, P.; Bathe, M.;
Dietz, H. Nat. Methods 2011, 8, 221–229. (14) Kim, D.-N.; Kilchherr, F.; Dietz, H.; Bathe, M. Nucleic Acids Res. 2012, 40, 2862–2868.