Functional Genomics: Using Reverse Genetics to Test ...
28
Functional Genomics: Using Reverse Genetics to Test Bioinformatics Predictions Resource Type: Curriculum: Laboratory Publication Date: 11/7/2006 Authors Brad Goodner Department of Biology Hiram College Hiram, OH 44234 USA Email: [email protected] Cathy Wheeler Department of Biology Hiram College Hiram, OH 44234 USA Email: [email protected] Abstract In this project, students (i) amplify by PCR and clone an internal portion of a selected gene from Agrobacterium tumefaciens, (ii) use restriction enzymes and gel electrophoresis to verify that they have cloned the correct DNA fragment, (iii) transform the cloned DNA fragment into wildtype A. tumefaciens and select for crossover recombinants in which the gene of interest is disrupted, and (iv) use the mutant A. tumefaciens strain to test the bioinformatics-predicted function of the gene of interest. The focus is on student involvement in original research. Activity Invitation for User Feedback. If you have used the activity and would like to provide feedback, please send an e-mail to [email protected]. Feedback can include ideas which complement the activity and new approaches for implementing the activity. Your comments will be added to the activity under a separate section labeled "Feedback." Comments may be edited. Learning Objectives. By completing this project, students will: develop the ability to design an experiment to test the predicted function of a protein based on sequence homology and learn how to draw conclusions based on experimental data; understand the importance of functional genomics in testing bioinformatics-based gene predictions; understand the connection between a DNA sequence, a restriction map, and a DNA molecule; understand the basics of recombinant DNA cloning; understand how homologous recombination can be used to generate a mutation in a specific gene; and gain experience in using PCR, recombinant DNA cloning, restriction enzymes, gel electrophoresis, DNA purification, and transformation to isolate and characterize DNA sequences. Background. For this project, students either need some prior basic knowledge of PCR, plasmids, recombinant DNA cloning, restriction enzymes, gel electrophoresis, transformation, and the gene-protein relationship or they can do the project concurrently with learning those concepts. Basic skills in handling bacteria with sterile technique, spread plating, and using micropipettors are all that are needed. Materials. Genomic DNA source. Overnight culture of Agrobacterium tumefaciens strain C58. A. tumefaciens C58 can be obtained directly from the authors or from the American Type Culture Collection [www.atcc.org] (ATCC #33970 for wildtype C58 that is still virulent on plants or ATCC #51350 for avirulent derivative A136 that lacks the Ti plasmid). 1. Genomic DNA isolation reagents. There are many protocols for isolating total bacterial DNA. We use a commercial kit that is very fast, convenient, and safe (DNAEasy Tissue Extraction Kit purchased from QIAGEN [www.qiagen.com]). Isolation of genomic DNA from one culture of A. tumefaciens C58 yields enough for hundreds of PCR reactions, but you may want to have each group isolate their own genomic DNA. 2. Microcentrifuge (there are many brands available). 3. Water baths or temperature blocks that can be set at 42 o C, 55 o C, and 70 o C (there are many brands available). 4. Vortexer (there are many brands available). 5. MicrobeLibrary http://archive.microbelibrary.org/edzine/details_print.asp?id=2391&lang= 1 of 10 3/13/2012 1:48 PM
Transcript of Functional Genomics: Using Reverse Genetics to Test ...
Functional Genomics: Using Reverse Genetics to Test BioinformaticsPredictions
Resource Type: Curriculum: Laboratory
Publication Date: 11/7/2006
AuthorsBrad GoodnerDepartment of BiologyHiram CollegeHiram, OH 44234USAEmail: [email protected]
Cathy WheelerDepartment of BiologyHiram CollegeHiram, OH 44234USAEmail: [email protected]
Abstract
In this project, students (i) amplify by PCR and clone an internal portion of a selected gene from Agrobacteriumtumefaciens, (ii) use restriction enzymes and gel electrophoresis to verify that they have cloned the correct DNA fragment,(iii) transform the cloned DNA fragment into wildtype A. tumefaciens and select for crossover recombinants in which thegene of interest is disrupted, and (iv) use the mutant A. tumefaciens strain to test the bioinformatics-predicted function ofthe gene of interest. The focus is on student involvement in original research.
Activity
Invitation for User Feedback. If you have used the activity and would like to provide feedback, please send an e-mail [email protected]. Feedback can include ideas which complement the activity and new approaches forimplementing the activity. Your comments will be added to the activity under a separate section labeled "Feedback."Comments may be edited.
Learning Objectives. By completing this project, students will:
develop the ability to design an experiment to test the predicted function of a protein based on sequence homologyand learn how to draw conclusions based on experimental data;understand the importance of functional genomics in testing bioinformatics-based gene predictions; understand the connection between a DNA sequence, a restriction map, and a DNA molecule;understand the basics of recombinant DNA cloning; understand how homologous recombination can be used to generate a mutation in a specific gene; andgain experience in using PCR, recombinant DNA cloning, restriction enzymes, gel electrophoresis, DNA purification,and transformation to isolate and characterize DNA sequences.
Background.For this project, students either need some prior basic knowledge of PCR, plasmids, recombinant DNA cloning, restrictionenzymes, gel electrophoresis, transformation, and the gene-protein relationship or they can do the project concurrently withlearning those concepts. Basic skills in handling bacteria with sterile technique, spread plating, and using micropipettors areall that are needed.
Materials.
Genomic DNA source. Overnight culture of Agrobacterium tumefaciens strain C58. A. tumefaciens C58 can beobtained directly from the authors or from the American Type Culture Collection [www.atcc.org] (ATCC #33970 forwildtype C58 that is still virulent on plants or ATCC #51350 for avirulent derivative A136 that lacks the Ti plasmid).
1.
Genomic DNA isolation reagents. There are many protocols for isolating total bacterial DNA. We use a commercial kitthat is very fast, convenient, and safe (DNAEasy Tissue Extraction Kit purchased from QIAGEN [www.qiagen.com]).Isolation of genomic DNA from one culture of A. tumefaciens C58 yields enough for hundreds of PCR reactions, but youmay want to have each group isolate their own genomic DNA.
2.
Microcentrifuge (there are many brands available).3.
Water baths or temperature blocks that can be set at 42oC, 55oC, and 70oC (there are many brands available).4.
Vortexer (there are many brands available).5.
MicrobeLibrary http://archive.microbelibrary.org/edzine/details_print.asp?id=2391&lang=
1 of 10 3/13/2012 1:48 PM

Micropipettors in the 1-10 ul, 10-100 ul, and 100-1000 ul ranges (there are many brands available).6.
100% Isopropanol (available from many suppliers).7.
PCR Reagents - To control contamination and conserve reagents, we use Ready-to-Go PCR Beads purchased from GEHealthcare [www.amershambiosciences.com]. We design primers using the Primer3 website [http://frodo.wi.mit.edu/cgi-bin/primer3/primer3.cgi/] and order primers from Invitrogen [www.invitrogen.com]. Typically, we have each group usea different pair of primers. You can design your own or use some of those given in the notes and hints section of thefaculty version of the procedure.
8.
PCR Thermocycler (there are many brands available).9.
DNA Gel Elution Reagents – We use a commercial kit that is very fast, convenient, and safe (QIAQuick DNA PurificationKit purchased from QIAGEN [www.qiagen.com]). You will need a separate gel elution for each PCR reaction that is runout on an agarose gel.
10.
Microbalance able to accurately measure in the milligram range (there are many brands available).11.
3 M Sodium Acetate.12.
Cloning Vector – We use the plasmid pCR2.1TOPO, purchased from Invitrogen [www.invitrogen.com], that comespreviously cut in order to have a 3’ overhang of a single T residue on each end. Topoisomerase I from Vaccinia virus,which has ligase activity,is covalently linked to the cut plasmid. pCR2.1 carries a ampicillin/carbenicillin resistance geneand the cloning site is situated within a lacZ gene to allow for blue-white screening. The salt solution needed for ligationof PCR products to pCR2.1TOPO (1.2 M NaCl, 0.6 M MgCl2) comes with the cloning vector. You will need enough vector tocover one ligation for each separate PCR product to be cloned.
13.
Chemically competent E. coli cells - Many genotypes will allow for blue-white screening, but we use TOP-10 competentcells purchases from Invitrogen [www.invitrogen.com] along with the pCR2.1TOPO cloning kit. These cells allow forblue-white screening without the need for IPTG. You will need one tube of competent cells for each ligation.
14.
SOC broth (see recipes).15.
LB + Ampicillin (50 ug/ml) + Xgal plates (see recipes; may have to add IPTG if E. coli strain is lacI+).16.
LB + Ampicillin (50 ug/ml) broth (see recipes).17.
Plasmid Isolation Reagents – There are many protocols for plasmid DNA isolation. We use the QIASpin MiniPrep PlasmidIsolation Kit purchased from QIAGEN [www.qiagen.com]. If each group picks 2-3 separate transformants to check forplasmid vectors containing PCR inserts, then you will need 2-3 times the number of transformations performed.
18.
Sterile Toothpicks – Flat toothpicks work better than round pointed toothpicks.19.
Spread Plating Spreaders – Bent glass or metal rods that are sterilized in 95% ethanol, flamed to remove the ethanol,and used to spread bacteria cultures across solid media.
20.
95% Ethanol for sterilizing spreaders.21.
Restriction Enzymes.22.
Agarose Gel Electrophoresis Equipment.23.
5X Gel Loading Buffer (see recipes).24.
Safe DNA Visualization Stain – Molecular Probes [www.molecularprobes.com] makes some nice alternatives to ethidiumbromide such as SYBR Green and SYBR Safe.
25.
Electrocompetent A. tumefaciens C58 cells (see recipes; you will have to make these yourself).26.
Electroporator & Electroporation Cuvettes (we use a Bio-Rad MicroPulser Electroporator and Gene Pulse/MicroPulserCuvettes with 0.1 cm gap).
27.
MG/L broth (see recipes).28.
LB + Carbenicillin (50 ug/ml) plates (see recipes).29.
Materials and protocols requested by students for their independent experiments to test their mutant strains (usuallygrowth media, enzyme assay materials).
30.
Procedure—Student Version.Available as a PDF
Procedure—Faculty Version.
There is no doubt that genomics and bioinformatics have revolutionized biology over the past few years. However, theirimpact on education has lagged and a new revolution is possible in the undergraduate curriculum. For example, thepublication of the complete genome sequence of the bacterial pathogen Agrobacterium tumefaciens strain C58 had 11undergraduates as authors (6) and that work built upon a genetic and physical map of A. tumefaciens C58 constructed byeight undergraduates (5). This multiweek lab project takes the next step by putting undergraduates in charge of testing
MicrobeLibrary http://archive.microbelibrary.org/edzine/details_print.asp?id=2391&lang=
2 of 10 3/13/2012 1:48 PM
predicted gene function through original experiments within the confines of a course. The project was originally written forstudents in a molecular and cellular biology course, but it could also be done in a genetics, microbiology, or biotechnologycourse. Also, the general strategy of mutant generation and student-driven experimental design and mutant testing shouldpotentially apply to a wide range of bacteria.
The project can be done as written over 6 to 8 weeks of lab with some outside time required. The methods in the studentversion involve several commercially available kits, but these could be substituted with kits from other manufacturers orhome-grown protocols that accomplish the same tasks. The method section is repeated below with explanations forinstructors in italics and additional notes and hints at the end.
Methods
General microbiology techniques:For fastest growth, A. tumefaciens and E. coli cultures should be maintained at 25 to 30°C and 37°C, respectively, withaeration (shaking for liquid cultures). LB broth or agar medium works well for both bacterial species, but special medium(SOC for E. coli and MG/L for A. tumefaciens) is needed for cell recovery after transformation. Where needed, the antibioticsampicillin and carbenicillin should be used at final concentrations of 50 µg/ml and 20 µg/ml, respectively. Liquid culturescan be grown in a temperature-controlled shaker incubator while plate cultures can be grown in a standard incubator. Iftemperature-controlled conditions are unavailable, growth at room temperature is okay, but you should expect longer growthtimes.
Timeline of basic steps (assuming one 3-hour lab session per week plus 0.5 to 1 hour extra outside of designated lab time):
Week 1 – Isolation of genomic DNA, PCR amplification of internal gene fragment, and gel electrophoresis of PCR reactions(outside of lab time)
Week 2 – Purification of PCR product from gel, ligation of PCR product into plasmid, and transformation of ligation intocompetent E. coli (part of transformation takes place outside of lab)
Week 3 – Inoculation of transformant E. coli colonies into growth medium (outside of lab time), isolation of plasmid DNA,restriction endonuclease digestion of plasmid DNA, and gel electrophoresis of restriction digestions (outside of lab time)
Week 4 – Analysis of gel electrophoresis results and transformation of positive plasmid clone DNAs into competent A.tumefaciens C58 (part of transformation takes place outside of lab)
Week 5 – Restreaking of transformant A. tumefaciens C58 gene disruption mutants, brainstorming on possible experimentsto test predicted gene function, and preparation of experimental materials
Weeks 6 and 7 – Experiments to test predicted gene function in A. tumefaciens C58 gene disruption mutants
Genomic DNA Isolation (instructions modified from QIAGEN DNAEasy kit manual; buffer ATL, proteinase K, buffer AL, bufferAW1, buffer AW2, and buffer AE solutions are included with the kit):
1. Transfer 1.5 ml of an overnight culture of A. tumefaciens C58 into a microcentrifuge tube and spin down the cells for 1minute at maximum speed (16,000 rpm). The bacterial culture can be started 1 to 2 days before this procedure.
2. Discard the culture supernatant by gently pouring it into a biohazard bag (keep the pellet on the high side of the tube toavoid losing cells). Resuspend the cell pellet in 180 ul of buffer ATL. This is just a standard physiological buffer.
3. Add 20 µl of proteinase K solution and mix by vortexing briefly. Incubate the mixture at 55°C for 15 minutes. Proteinase Khelps degrade the bacterial cell wall.
4. Vortex the tube for 15 seconds. Add 200 ul of buffer AL to the sample and mix thoroughly by vortexing, then incubate thesample at 70°C for 10 minutes. Buffer AL contains guanidine hydrochloride, a chaotropic salt which disrupts membranes andsolubilizes lipids and proteins. (If you see a white precipitate after adding buffer AL, don’t worry. Vortex the sample well andthe material should dissolve during the incubation at 70°C. The precipitate does not interfere with genomic DNA isolation.)
5. Add 200 µl of ethanol (96 to 100%) to the sample and mix thoroughly by vortexing. The ethanol helps with thesolubilization of cellular materials that will allow the cell lysate to pass through the DNA-binding column easily.
6. Pipette the entire mixture into a DNAEasy spin column placed in a 2-ml collection tube (make sure you label the top ofthe spin column). Centrifuge the tube at 8,000 rpm (~6,000 x g) for 1 minute. The spin column contains specially-treatedtiny silica beads which will bind nucleic acids preferentially under high salt conditions (which we have here).
7. Discard the flowthrough and collection tube into a biohazard bag, but DO NOT THROW AWAY THE SPIN COLUMN (ITHAS YOUR GENOMIC DNA). Place the spin column in a new 2-ml collection tube, add 500 µl of buffer AW1, and centrifuge at8,000 rpm for 1 minute. Buffer AW1 is a wash buffer containing guanidine hydrochloride, ethanol, and high salt to wash awayunwanted proteins, etc., while allowing the genomic DNA to stay attached to the column material.
8. Discard the flowthrough and collection tube into a biohazard bag, but DO NOT THROW AWAY THE SPIN COLUMN (ITHAS YOUR GENOMIC DNA). Place the spin column in a new 2-ml collection tube, add 500 µl of buffer AW2, and centrifuge at8,000 rpm for 3 minutes. Buffer AW2 is a high salt and ethanol wash buffer without guanidine hydrochloride. The extra spintime ensures that the wash buffer is removed completely before the elution step.
9. Very carefully, discard the flowthrough and collection tube into a biohazard bag (you don’t want any liquid on the spincolumn). Place the spin column in a sterile microcentrifuge tube (properly labeled) and pipette 200 µl of buffer AE directlyonto the top surface membrane of the spin column. Buffer AE is a very low salt buffer. Incubate at room temperature for 1minute, then centrifuge for 1 minute at 8,000 rpm to elute the DNA from the column. NOW YOU WANT TO KEEP THESOLUTION, SO THROW AWAY ONLY THE SPIN COLUMN AND KEEP THE TUBE CONTAINING THE DNA SOLUTION.
MicrobeLibrary http://archive.microbelibrary.org/edzine/details_print.asp?id=2391&lang=
3 of 10 3/13/2012 1:48 PM
PCR Amplification of Internal Gene Fragments:1. Transfer a Ready-to-Go PCR bead to an appropriately-sized tube for your PCR thermocycler. Label the tube with the nameof the gene for which you are amplifying an internal fragment. The Ready-to-Go PCR beads are very hygroscopic and must bemaintained in a tightly sealed container containing Dri-Rite or similar drying agents. Beads that appear much smaller thannormal have already absorbed some water from the atmosphere and will probably not work.
2. To the PCR bead, add 22 µl of sterile distilled water, 1 µl of primer #1 for your gene of interest, 1 µl of primer #2 for yourgene of interest, and finally 1 µl of Agrobacterium genomic DNA. Put your tube on ice until everyone is ready to place theirtubes in the PCR thermocycler. After cycling is completed, reaction mixtures will be stored at –20°C. Adding the genomicDNA last after putting all the other materials away helps ensure that your PCR primers never get contaminated withgenomic DNA.
3. Set up the PCR thermocycler for 1 cycle of 94°C, 3 minutes; then 30 cycles of 94°C, 30 seconds, 60°C, 30 seconds, 72°C,1 minute; 1 cycle of 72°C, 5 minutes; and finally a 4°C hold. Start the run. Once the thermocycler heat block comes up to80°C in the first cycle, add all the PCR reaction tubes to the heat block (be careful!). This is known as a hot start to ensurethat all the genomic DNA denatures at the same time and the PCR primers bind to the proper targets at the first annealingstep. These PCR conditions are optimal for the PCR primers that we have designed, but you may need to change theannealing temperature if you design your own primers.
Gel Electrophoresis:1. Add 5 µl of 5X loading buffer to each of your PCR reactions, mix, and spin down briefly in a microcentrifuge. Loading bufferconsists of three components: (i) EDTA, which chelates magnesium, stopping any reaction of DNA with enzymes, (ii)glycerol, to make the density of the sample greater than the salt solution so that the sample will sink to the bottom of thehole, and (iii) a negatively charged blue dye (bromophenol blue) which enables you to monitor the loading process and theprogress of the electrophoresis.
2. Practice loading samples into wells using the gel marked “practice” and the solution marked “practice sample.” Don’t worryabout loading under buffer, the loading buffer makes the sample dense enough to sink to the bottom of a well. Load 25 µlinto each of a couple of wells. Try to hold the end of your pipettor tip just into the top of the well. Don’t jam it into thebottom of the well. Gently expel the sample into the well. When finished, keep your thumb depressed on the pipettor whileyou lift your hand up.
3. Load your PCR reactions (a total of 30 µl per reaction) into separate wells on the gel. Obviously, it is essential to recordcarefully which sample went into which well! After everyone has loaded their samples and DNA standards have been loadedin additional wells, the gel is closed and the electricity is turned on. You won’t be able to see the DNA move, but the bluedye will move towards the positive pole at about the same speed as a DNA molecule of 300 bp in size. When the dye nearsthe end of the gel, it is done. The gel is then stained with a fluorescent dye that binds to DNA and RNA. The gel is thenstained with the fluorescent dye, ethidium bromide, which binds to DNA and RNA. The gel is ready to be photographed. Theelectrophoresis takes several hours and the staining another 10 or 15 minutes. You therefore will probably not be around tosee what happened to your gel, but you will get a picture of your gel results. REMIND YOUR INSTRUCTOR NOT TO THROWOUT THE GEL BECAUSE YOU WILL NEED TO CUT OUT SOME DNA FRAGMENTS LATER! A 1% agarose gel works well for DNAfragments of 200 bp up to 5 kbp. Nontoxic alternatives to ethidium bromide, such as SYBR Green from Molecular Probes,should be used to visualize DNA in agarose gels. Stress to students the need to be ever vigilant when staining andphotographing gels using ultraviolet (UV) light sources.
Cleanup of PCR Product (instructions modified from QIAGEN QIAQuick kit manual; buffer QG, buffer PE, and buffer EBsolutions are included with the kit):
1. Looking at your stained gel, determine the fragment that represents your correct PCR product. Carefully using a safetyscalpel or other approved safe cutting instrument, previously sterilized by ethanol wipe or dip, cut out the region you desire(REMEMBER THE WARNING ABOUT UV SOURCES—YOU WILL HAVE TO DO THIS WEARING A UV-OPAQUE FACE MASK WITHYOUR GEL ILLUMINATED BY A UV BOX). Transfer the gel slice(s) into a fresh labeled microcentrifuge tube. Always take anopportunity to stress lab safety to students.
2. Use an empty microcentrifuge tube to tare a microbalance, then weigh your tube. If your gel slice weighs more than 300mg, then you need to cut it in half, split it between two tubes, and reweigh the tubes.
3. Add 3 gel volumes of buffer QG. This means that if your gel slice weighed 200 mg, you would add 3 x 200 = 600 µl ofbuffer QG to your tube. Incubate your tube at 55°C for 10 minutes or until your gel slice is fully dissolved, vortexing yourtube briefly every 3 minutes.
4. Check the color of your solution. It should be yellow. If it is orange or violet, then add 10 µl of 3 M NaOAc, pH 5 (sodiumacetate) to your tube to lower the pH. The binding of the DNA to the QIAquick column membrane is most efficient at a pH <7.5. Buffer QC has a pH-sensitive color indicator.
5. Add 1 gel volume of isopropanol to your tube and mix by vortexing briefly. Place a QIAquick spin column in a collectiontube, then pour your sample into the spin column.
6. Spin the tubes in a microcentrifuge at full speed for 1 minute to bind the DNA to the column matrix (silica-based materialthat binds DNA under high salt conditions).
7. Pull out the spin column and hold onto it while pouring the flowthrough into the sink. Return the spin column to thecollection tube, then pipette 500 µl of buffer QC into the spin column. This wash will help eliminate any last tiny pieces ofagarose. Spin in a microcentrifuge at full speed for 1 minute.
8. Pull out the spin column and hold onto it while pouring the flowthrough into a biohazard bag. Return the spin column tothe collection tube, then add 500 µl of buffer PE to each spin column and let the column stand for 5 minutes. This wash
MicrobeLibrary http://archive.microbelibrary.org/edzine/details_print.asp?id=2391&lang=
4 of 10 3/13/2012 1:48 PM
helps remove some of the salt while keeping the DNA bound to the column matrix. Spin in a microcentrifuge at full speed for1 minute. Discard the flowthrough from the catch tube, return the spin column to the catch tube, and respin for 1 moreminute.
9. Label a fresh sterile microcentrifuge tube. Throw away the catch tube and any flowthrough it contains into a biohazardbag and place the dried spin column into the fresh tube.
10. Add 20 µl of buffer EB to the spin column and let stand for at least 1 minute. The no-salt conditions of buffer EB bumpthe DNA off of the glass beads. Spin in a microcentrifuge at full speed for 1 minute. Throw away the spin column and closethe microcentrifuge tube. You now have purified DNA ready for ligation.
Ligation of PCR Products into Plasmid Cloning Vector:1. To a sterile microcentrifuge tube, add 4 µl of cleaned up Agrobacterium PCR product, 1 µl of salt solution (1.2 M NaCl,0.06 M MgCl2), and finally 1 µl of pCR2.1 plasmid vector (cut to expose 3’ T overhangs and with topoisomerase alreadyadded to perform ligase function). Mix the solution very gently by moving your pipettor tip around, not by pipetting up anddown. You do not have to add DNA ligase to this reaction because the pCR2.1 plasmid vector sold in the TOPO cloning kitsalready has a DNA topoisomerase added to it. DNA topoisomerases can carry out the ligation function similar to DNA ligase.
2. Incubate at room temperature for at least 30 minutes (overnight is okay as well).
Transformation of Ligation Mixture into E. coli:1. Thaw out a tube of chemically competent E. coli cells on top of ice (not in the ice) until liquidy, then place the tube intothe ice.
2. Add 3 µl of ligation mixture to competent cells and mix very gently by moving your pipettor tip around, not by pipetting upand down.
3. Incubate transformation mixture on ice for 15 to 30 minutes.
4. Walk your ice bucket over to a heat block set at 42°C. Transfer your tube from the ice to the heat block for exactly 30seconds and then place the tube back in the ice for 2 minutes.
5. Add 250 µl of SOC broth medium to the tube and shake the tube at 37°C for 1 hour.
6. Obtain 2 LB-Amp–X-Gal plates and label them on the bottom with your initials and the date.
7. Pipette 50 µl of the transformation mix onto one plate and the remainder onto the other plate. Sterilize a spreader andspread the liquid evenly over each plate surface. Incubate the plates at 37°C for 1 to 2 days. The pCR2.1 plasmid vector hasthe lacZ gene in which the cloning site is situated. For most PCR products >300 bp, ligation of the insert into the vectorleads to a white colony on X-Gal–containing medium because the lacZ gene is disrupted by the insertion. However, thestudents will probably get quite a few blue colonies in which the plasmid has probably come back together on itself in someway.
Isolation of Plasmid DNA (instructions modified from QIAGEN QIASpin kit manual; buffer P1, buffer P2, buffer N3, buffer PB,and buffer PE solutions are included with the kit):The day before lab. Find three well-isolated large white colonies. For each colony, use a sterile toothpick to pick up a portion ofthe colony and inoculate a tube of LB broth containing 50 µg/ml ampicillin. Incubate the tubes in the shaking incubatorovernight.
1. For each culture, label a sterile microcentrifuge tube (#1 through 3). Transfer the cultures into the microcentrifuge tubes.
2. Pellet the cells by spinning the tubes in a microcentrifuge for 1 minute at full speed (16,000 rpm).
3. Pour the supernatant into an autoclave bag. Resuspend each pellet in 250 µl of buffer P1. Buffer P1 is a weak buffer atphysiological pH (7.5) and salt concentration. It also contains RNase that will degrade RNAs once the bacterial cells arebroken.
4. Add 250 µl of buffer P2 to each tube and mix by gently inverting the tubes several times. The cell suspension shouldbecome viscous. The high pH and sodium dodecyl sulfate (SDS) detergent in this buffer disrupt membranes and bacterial cellwalls, and the detergent solubilizes proteins and lipids. The broken pieces of bacterial chromosome will denature at high pHand the strands will float away from each other. The two strands of the intact circular plasmid molecules cannot separatefrom each other very far (topologically linked).
5. Add 350 µl of buffer N3 to each tube and mix by gently inverting the tubes several times. The quanidinium salts in bufferN3 and the lowered pH (back to ~7.5) leads the SDS-solubilized material to form insoluble complexes and fall out ofsolution, accounting for the snowstorm going on in your microcentrifuge tubes. The huge single-stranded pieces of thebacterial chromosome will get caught up in the precipitating complexes, but the much smaller intact plasmid molecules willstay in solution and renature to a double helix conformation.
6. Spin the tubes in a microcentrifuge at full speed for 10 minutes to pellet the unwanted cell debris (proteins, lipids, andchromosome fragments). While tubes are spinning, label three spin columns and place each in a catch tube.
7. Carefully pour each supernatant into a spin column (sitting in a catch tube). The double-stranded plasmid DNA will bind tothe tiny glass beads in the spin column under the high salt conditions of buffer P3, while RNA, ssDNA, proteins, and othercell components will not. Spin in a microcentrifuge at full speed for 30 seconds. Discard the flowthrough from the catch tubeinto a biohazard bag.
8. Add 500 µl of buffer PB to each spin column. This high salt wash helps clean away any contaminants from the boundplasmid DNA. Spin in a microcentrifuge at full speed for 30 seconds. Discard the flowthrough from the catch tube into abiohazard bag.
MicrobeLibrary http://archive.microbelibrary.org/edzine/details_print.asp?id=2391&lang=
5 of 10 3/13/2012 1:48 PM
9. Add 750 µl of buffer PE to each spin column. This high salt and ethanol wash further cleans the bound plasmid DNA. Spinin a microcentrifuge at full speed for 30 seconds. Discard the flowthrough from the catch tube into a biohazard bag.
10. Without adding any additional buffer, spin the tubes in a microcentrifuge at full speed for 1 minute. Throw away thecatch tube and any flowthrough it contains into a biohazard bag and place the dried spin column in a labeled sterilemicrocentrifuge tube.
11. Add 50 µl of sterile water to each spin column and let stand for at least 1 minute. The low ionic strength conditions ofthe sterile water bumps the plasmid DNA off of the glass beads. Spin in a microcentrifuge at full speed for 1 minute. Throwaway the spin column into a biohazard bag and close the microcentrifuge tube. You now have purified plasmid DNA!
Restriction Enzyme Digestion of Plasmid DNA:1. For each of your plasmid clones, label one tube with your initials and “Eco.”
2. For each of your plasmid clones, add 17 µl of the plasmid clone solution to a labeled tube.
3. For each labeled tube, add 3 µl of the appropriate enzymes-plus-buffer mix (EcoRI in EcoRI digestion buffer). Incubate alltubes at 37°C for at least 2 to 3 hours.
Gel Electrophoresis:1. Add 5 µl of 5X gel loading buffer to each of your digested DNA samples, mix, and spin down briefly in a microcentrifuge.
2. Load your PCR reactions (total of 25 µl per reaction) into separate wells on the gel. Obviously, it is essential to recordcarefully which sample went into which well! After everyone has loaded their samples and DNA standards have been loadedin additional wells, the gel is closed and the electricity is turned on. Again, stress to students the importance of proper safetywhen staining and photographing gels using UV light sources.
Electroporation of Plasmid DNA into A. tumefaciens C58:1. Once you have verified that one or more of your plasmid clones contains the proper insert fragment, place one of thecorresponding uncut plasmid tubes on ice. Thaw out a tube of electrocompetent A. tumefaciens C58 cells on top of ice (notin the ice) until liquidy, then place the tube into the ice.
2. Add 3 µl of uncut plasmid DNA to the competent cells and mix very gently by gently tapping the tube on the bench top 2to 3 times, not by pipetting up and down. Return cells to ice immediately and incubate on ice for 5 to 10 minutes.
3. Obtain an electroporation cuvette and place on ice. Transfer the cell-plus-DNA mixture into the cuvette, making sure topipette the mixture into the small gap between the metal sides. Take your ice bucket over to the electroporator. Have apartner pick up 250 µl of sterile MG/L medium with a micropipette. Turn the electroporator on and bring the setting to “AGR”(or whatever corresponding setting works for A. tumefaciens on your electroporator). Transfer the electroporation cuvette outof the ice bucket and into the cuvette holder (the ridge on one plastic side of the cuvette will fit into the notch of thecuvette holder). Push the holder into the covered electroporator until the metal sides of the cuvette snap into place betweenthe electrodes. Press and hold the pulse button until you hear a beep (and hopefully see no lightning bolt arc within yourcuvette), then quickly remove the cuvette from the electroporator, add the 250 µl of sterile MG/L medium to the cells andthen transfer the cell mixture to a clean microfuge tube or test tube. Label the tube and incubate the transformed cellmixture at 25 to 30°C for 2 to 3 hours with shaking. Using the “AGR” setting on the Bio-Rad MicroPulser and cuvettes with0.1 cm gaps, there will be 1.8 kV dropped across the gap and the time constant should optimally be around 4.5milliseconds. As long as you do not get a visible arc across the gap (and a corresponding “pop”), you will still be successfulwith lower time constants down to around 2 milliseconds.
4. Obtain two LB-plus-carbenicillin plates and label them on the bottom with your initials and the date.
5. Pipette 50 µl of the transformation mixture onto one plate and the remainder onto the other plate. Sterilize a spreaderand spread the liquid evenly over each plate surface. Incubate the plate upside down at 25 to 30°C for 3 to 5 days untilcolonies appear. These will be your mutant A. tumefaciens C58 cells in which your gene of interest has been disrupted. Ifyou see heavy growth within 1 to 2 days, contamination or not enough carbenicillin in the medium could be your problem. A.tumefaciens colonies will be cream-colored with smooth edges. The students should restreak potential crossoverrecombinants onto fresh LB-plus-carbenicillin plates to confirm their identity and then grow cultures to start theirexperiments (and preferably to make permanents for long-term storage as well).
Experimental design:Your job over the next couple of weeks is to work with the A. tumefaciens C58 gene disruption mutant you generated. Howhas the biology of A. tumefaciens C58 been affected by its inability to produce a specific protein? You and your partner(s)need to first design one or two experiments to test your mutant strain and determine whether or not gene function has beentruly knocked out. To get some ideas for your experiments, go to the research literature (in the library or on the Internet)and see how past researchers have tested the function of your gene of interest. Look for assays that are doable using thetime, space, equipment, and supplies available to you. Good experiments might involve a growth curve using differentmedia, sensitivity to different inhibitors, enzyme assays, and motility tests. Once you have some good ideas, sketch out anexperimental plan and a list of materials needed. These will need to be checked off by your instructor before you proceedwith your experiments. Good luck with your experiments and remember that you are learning something new about thisorganism! Really stress to students that they do not need to reinvent the wheel in terms of experiments to test the functionof their genes of interest. At the same time, encourage some creativity as well.
Notes and Hints.
(a) The timeline calls for 7 to 8 weeks as written, but you can expand it if you add in time for the students to design theirown PCR primers or you can shorten it if you have already done the PCR ahead of time. (b) The key to this project is picking genes that you know, or at least can envision, have assays available for their encodedproteins. They do not have to be direct enzymatic activity assays, although those are nice too. We have used a wide variety
MicrobeLibrary http://archive.microbelibrary.org/edzine/details_print.asp?id=2391&lang=
6 of 10 3/13/2012 1:48 PM
of growth curves, sensitivity tests, auxotrophic characterization, and motility tests. Again, it depends on the genes you pick.
(c) While you could pick almost any gene in A. tumefaciens C58 for this project, here are a few genes (with gene ID numberscorresponding to Wood et al.; also check gene names and numbers at www.ncbi.nlm.nih.gov/genomes/lproks.cgi or athttp://agro.vbi.vt.edu, username is "agro," password is "s4k84") that we have used for this project in the past with success.The appropriate PCR primers and size of expected amplification products are given for each gene. All of these primer pairsare designed to work in PCR reactions with annealing temperatures of 60°C.
Choline dehydrogenase (Atu0830) 5’-aatccgctgttccacgccttcatt-3’ 5’-tggtggagacttgctggaaataaaa-3’ amplifies a fragment of 454 bpAconitase A (Atu2685) 5’-cggcatacttcgtttcataaagctc-3’ 5’-gtgttggtggtatcgaggctgag-3’ amplifies a fragment of 1,155 bpAconitase B (Atu4734) 5’-gtctcgtcctcggaaatgcagat-3’ 5’-caacctcaagaactgggtgaagaag-3’ amplifies a fragment of 1,050 bpRibulose phosphate-3-epimerase (Atu1839) 5’-atcgaacccgtcgatccctatct-3’ 5’-atcttgtcgagcatggcgggaat-3’ amplifies a fragment of 263 bp
To save time, we always design the PCR primers ourselves and have them made (we use Invitrogen [www.invitrogen.com])before the course begins. You could do the same or if you had the time and the desire, you could have the students designtheir own primers. Either way, the best primer prediction program available is the Primer3 website (http://frodo.wi.mit.edu/cgi-bin/primer3/primer3.cgi/). Paste in the sequence of the gene of interest. Choose the middle fifth of the gene as the target,a product size that would leave 200 to 400 bp on either side of the fragment within the gene, a primer size range of 21 to 25nucleotides, a primer Tm range of 55 to 75oC, and a primer %GC of 55 to 75%. Optimal primers should have “any” scores of <7and “3” scores < 4 for each primer as well as for the two primers together.
(d) We use the DNAeasy genomic DNA isolation kit from QIAGEN [www.qiagen.com], but equivalent kits are available fromBioneer [www.bioneer.com], EPICENTRE [www.epibio.com], Fermentas [www.fermentas.com], Idaho Technology[www.idahotech.com], Invitrogen [www.invitrogen.com], Mo Bio Laboratories [www.mobio.com], Promega[www.promega.com], and Sigma-Aldrich [www.sigmaaldrich.com], just to name a few.
(e) We use the Ready-to-Go PCR beads from GE Healthcare [www.amershambioscience.com] because the lyophilized beadslast a long time under proper dessication and you do not have to worry about cross contaminating PCR buffer, nucleotides, orDNA polymerase solutions. That said, you could purchase the individual reagents from numerous vendors.
(f) We use the QIAQuick DNA purification kit from QIAGEN for purification of DNA fragments out of gels, but equivalent kitsare available from Ambion [www.ambion.com], Bioneer, Bio-Rad [www.discover.bio-rad.com], EPICENTRE, Invitrogen, Mo BioLaboratories, Novagen [www.novagen.com], Sigma-Aldrich, and Stratagene [www.stratagene.com], just to name a few.
(g) We use pCR2.1-TOPO from Invitrogen to easily clone Taq DNA polymerase-amplified fragments, but similar plasmids forcloning PCR products are available from Lucigen [www.lucigen.com] and Promega. If you wanted to do the cloning entirely“in-house,” then you should use a DNA polymerase other than Taq so that you will get blunt-ended amplification productsthat could be cloned into any blunt-end restriction site on a high-copy-number, ColE1 origin-of-replication plasmid. In orderto select for the recombination of the plasmid into A. tumefaciens C58, an ampicillin-carbenicillin resistance gene or akanamycin resistance gene works best.
(h) We use the QIASpin plasmid miniprep kit from QIAGEN, but equivalent kits are available from Bioneer, Bio-Rad,EPICENTRE, Invitrogen, Mo Bio Laboratories, Novagen, Sigma-Aldrich, and Stratagene, just to name a few. If you wanted todo the plasmid isolation entirely in-house, then you should use a miniprep version of an alkaline lysis procedure.
(i) We use EcoRI to digest the plasmid DNA clones to check for inserts because it cuts on both sides of the potential insert.If EcoRI is not available, you can also use a combination of BamHI + HindIII which accomplishes the same goal. The pCR2.1plasmid fragment is 3.9 kbp in size and the insert fragment size will depend on the specific PCR product being cloned. (j) If you do not have an electroporation device, you can still transform your plasmid DNA clones into A. tumefaciens C58using cells made chemically competent (12). While we have not used this technique for this project ourselves, severalcolleagues have highly recommended it. The protocol is reproduced in the recipes section.
(k) The basic strategy of mutant generation used here should apply to many other bacterial species as long as you canintroduce DNA into them, the pCR2.1 plasmid does not replicate in them, and there is some evidence for homologousrecombination occurring in them.
Safety Issues.There are no special safety issues associated with this project. Standard lab safety in terms of dealing with biohazardouswaste (bacterial cultures) and gel electrophoresis waste are all that are needed. The substitution of safer nontoxic DNAvisualization stains such as SYBR Green eliminates the hazardous waste issue of ethidium bromide. However, using anyfluorescent DNA visualization stain still involves the use of UV light sources. You need to remind your students to be carefularound UV sources such as transilluminators. When not shielded by a camera hood or UV-opaque screen, these sources emitUV light that can be mutagenic to your cells. Always wear a face shield, lab coat, and gloves to protect yourself.
MicrobeLibrary http://archive.microbelibrary.org/edzine/details_print.asp?id=2391&lang=
7 of 10 3/13/2012 1:48 PM
Suggestions for Assessment.We have used quizzes at the beginning of lab periods to assess student’s preparation for that day’s lab and understandingof past lab activities and results. The gel electrophoresis data lends itself nicely to homework assignments for analysis andinterpretation. We usually have the students do a couple of small lab writeups on the first half of the project, up throughrestriction analysis of their plasmid DNA clones. These writeups require the students to generate a standard curve of theirgel electrophoresis results and interpret their gel results (assignments 1 and 2). Since the project can span multipleiterations of a course and still use new genes each time, no one set of students will see the same data sets so you cankeep quizzes and homework assignments fresh. For the latter half of the project that is truly novel for each group in terms ofexperimental design and the actual experimental results they obtain, we usually have the student groups prepare andpresent 10-minute Powerpoint talks in which they have to tell us what the predicted function of their assigned gene was,how they decided to test that predicted function, their experimental setup, results, and conclusions (Powerpoint examples 1and 2 are from student talks; Powerpoint examples 3 and 4 are from student posters). Student DataPowerpoint Example 1Powerpoint Example 2Powerpoint Example 3Powerpoint Example 4 Results Observed.From 2003 to 2005, we have run five iterations of this project with students in the Molecular and Cellular biology course atHiram College. Those students, as a whole, have studied the function of 38 different genes in A. tumefaciens C58 using thisproject strategy. Students have used a wide variety of experiments: enzyme assays (e.g., measuring breakdown of hydrogenperoxide by catalase), growth curves and assays (e.g., testing nitrate reductase and nitric oxide reductase mutants forgrowth with nitrate as a sole nitrogen source and for growth anaerobically with nitrate as electron acceptor), motility assays,and chemotaxis assays (e.g., in response to plant-derived compounds). For the four genes for which PCR primers are given in the Notes and Hints section, here are some of the results we haveobserved. A mutation in the choline dehydrogenase, which is involved in using choline as a carbon source and in synthesizingthe osmoprotectant glycine betaine, leads to osmotic sensitivity (9). A mutation in the aconitase A gene leads to auxotrophyin minimal media and a hypermotile phenotype on LB plates (even with 1.5% agar). A mutation in the aconitase B genedoes not lead to any noticeable growth defect and only a slight hypomotile phenotype on LB plates with 0.3% agar.Aconitases are known to have two roles, one as an enzyme in the tricarboxylic acid cycle and another as oxidative stress-sensitive RNA-binding proteins that impact other cellular processes such as motility (11). Finally, a mutation in the ribulosephosphate-3-epimerase (rpe) gene abolishes growth with glucose, fructose, and sucrose as carbon sources (all work well forwildtype), but still allows growth with succinate, glycerol, or casamino acids as carbon sources. Rpe acts in the pentosephosphate branch off of glycolysis which is a major route for metabolic carbon utilization in A. tumefaciens (4, 8).
In most cases, groups had enough time to run an experiment and then make adjustments and redo the experiment or do afollow-up experiment based on the results of the first experiment. At the end of each iteration of this project, severalstudents have requested the opportunity to continue working on “their” mutant after the course through independentresearch.
Possibilities for Further Studies.
1. This project strategy can be used on a wide variety of genes, as long as there is some possible direct or indirect assay forthe function of interest.
2. This project strategy can be used on a wide variety of organisms or for comparative studies between organisms.
3. This project strategy can take place after a complete genome sequence becomes available or can occur earlier (once thesequence of the gene of interest becomes available).
4. This project strategy works great for genes with predicted functions, but it can also be used for hypothetical genes orgenes with only general ideas of function. For example, student groups could use a common set of growth assays andmicroscopic studies to categorize the functional role (e.g., cell division, building block biosynthesis, not essential) of eachhypothetical gene. Alternatively, each student group could do a different set of tests on the same batch of mutants. In thelatest iteration of this project at Hiram College, students constructed mutations in 10 different response regulator genes(part of two-component regulatory systems) and each group then tested all 10 mutants under a particular set of conditions(e.g., range of pH).
5. If one picks the right plasmid vector and cloning strategy, then the generation of the gene disruption mutant cansimultaneously generate a lacZ fusion that allows for gene expression studies as well with the mutant strain.
6. Once a mutant has been made, the possible follow-up studies are numerous and not limited to just one course.
References.
1. Allardet-Servent, A., S. Michaux-Charachon, E. Jumas-Bilak, L. Karayan, and M. Ramuz. 1993. Presence of one linearand one circular chromosome in the Agrobacterium tumefaciens C58 genome. J. Bacteriol. 175:7869–7874.
2. Braun, A. C. 1958. A physiological basis for autonomous growth of the crown-gall tumor cell. Proc. Natl. Acad. Sci. USA 44:344–349.
3. Chilton, M.-D., M. H. Drummond, D. J. Merlo, D. Sciaky, A. L. Montoya, M. P. Gordon, and E. W. Nester. 1977. Stableincorporation of plasmid DNA into higher plant cells: the molecular basis of crown gall tumorigenesis. Cell 11:263–271. 4. Fuhrer, T., E. Fischer, and U. Sauer, 2005. Experimental identification and quantification of glucose metabolism inseven bacterial species. J. Bacteriol. 187:1581–1590.
5. Goodner, B. W., B. P. Markelz, M. C. Flanagan, C. B. Crowell, J. L. Racette, B. A. Schilling, L. M. Halfon, J. S.
MicrobeLibrary http://archive.microbelibrary.org/edzine/details_print.asp?id=2391&lang=
8 of 10 3/13/2012 1:48 PM

Mellors, and G. Grabowski. 1999. Combined genetic and physical map of the complex genome of Agrobacteriumtumefaciens. J. Bacteriol. 181:5160–5166.
6. Goodner, B., G. Hinkle, S. Gattung, N. Miller, M. Blanchard, B. Qurollo, B. S. Goldman, Y. Cao, M. Askenazi, C.Halling, L. Mullin, K. Houmiel, J. Gordon, M. Vaudin, O. Iartchouk, A. Epp, F. Liu, C. Wollam, M. Allinger, D. Doughty, C.Scott, C. Lappas, B. Markelz, C. Flanagan, C. Crowell, J. Gurson, C. Lomo, C. Sear, G. Strub, C. Cielo, and S. Slater.2001. Genome sequence of the plant pathogen and biotechnology agent Agrobacterium. Science 294:2323–2328.
7. Jumas-Bilak, E., S. Michaux-Charachon, G. Bourg, M. Ramuz, and A. Allerdet-Servent. 1998. Unconventional genomicorganization in the alpha subgroup of the Proteobacteria. J. Bacteriol. 180:2749–2755.
8. Lyngstadaas, A., G. A. Sprenger, and E. Boyle, 1998. Impaired growth of an Escherichia coli rpe mutant lackingribulose-5-phosphate epimerase activity. Biochim Biophys Acta 1381:319–330.
9. Mandon, K., M. Osteras, E. Boncompagni, J. C. Trinchant, G. Spennato, M. C. Poggi, and D. LeRudulier. 2003. TheSinorhizobium meliloti glycine betaine biosynthetic genes (betICBA) are induced by choline and highly expressed inbacteroids. Mol. Plant-Microbe Interact. 16:709–719.
10. Smith, E. F., and C. O. Townsend. 1907. A plant tumor of bacterial origin. Science 25:671–673.
11. Tang, Y., J. R. Guest, P. J. Artymiuk, R. C. Read, and J. Green. 2004. Post-transcriptional regulation of bacterialmotility by aconitase proteins. Mol. Microbiol. 51:1817–1826.
12. Tzfira, T., C. S. Jensen, W. Wang, A. Zuker, B. Vinocur, A. Altman, and A. Vainstein. 1997. Transgenic Populustremula: a step-by-step protocol for its Agrobacterium-mediated transformation. Plant Mol. Biol. Reporter 15:219–235.
13. Wood, D. W., J. C. Setubal, R. Kaul, D. E. Monks, J. P. Kitajima, V. K. Okura, Y. Zhou, L. Chen, G. E. Wood, N. F.Almeida Jr., L. Woo, Y. Chen, I. T. Paulsen, J. A. Eisen, P. D. Karp, D. Bovee Sr., P. Chapman, J. Clendenning, G.Deatherage, W. Gillet, C. Grant, T. Kutyavin, R. Levy, M.-J. Li, E. McClelland, A. Palmieri, C. Raymond, G. Rouse, C.Saenphimmachak, Z. Wu, P. Romero, D. Gordon, S. Zhang, H. Yoo, Y. Tao, P. Biddle, M. Jung, W. Krespan, M. Perry,B. Gordon-Kamm, L. Liao, S. Kim, C. Hendrick, Z.-Y. Zhao, M. Dolan, F. Chumley, S. V. Tingey, J.-F. Tomb, M. P.Gordon, M. V. Olson, and E. W. Nester. 2001. The genome of the natural genetic engineer Agrobacterium tumefaciensC58. Science 294:2317–2323.
Recipes.
LB broth (per liter): Mix 10 g of tryptone, 5 g of yeast extract, and 5 g of NaCl, then autoclave.
LB agar for plates (per liter): Same as LB broth with 15 g of agar added, then autoclave. Add antibiotics, if needed, afterautoclaving and mix before pouring plates.
SOC (per liter): Mix 20 g of tryptone, 5 g of yeast extract, 0.5 g of NaCl, and 10 ml of 250 mM KCl, then adjust pH to 7 andautoclave. After autoclaving, add 20 ml of sterile 1 M glucose and 5 ml of sterile 2 M magnesium chloride. 1,000X ampicillin stock: Add 50 mg of ampicillin sulfate per ml of water. Filter sterilize and store frozen, then add to mediaas needed at 1 ul per ml of medium.
1,000X carbenicillin stock: Add 20 mg of carbenicillin per ml of water. Filter sterilize and store frozen in the dark, then add tomedia as needed at 1 ul per ml of medium.
1X TBE: 10.8 g of Tris base, 5.5 g of boric acid, and 4 ml of 0.5 M EDTA (pH 8).
5X Gel Loading Buffer: 0.25% bromophenol blue, 0.25% xylene cyanol FF, 30% glycerol.
MG/L broth (per liter): Mix 500 ml of LB broth, 460 ml of deionized water, 5 g of mannitol, 1.2 g of sodium glutamate, 0.25 gof KH2PO4, 0.1 g of NaCl, and 0.1 g of MgSO4. Adjust pH to 7.0 and adjust volume to 1 liter, then autoclave.
Electrocompetent A. tumefaciens cells:1. Pick a single colony of A. tumefaciens C58 off of a plate culture and inoculate a 2-ml LB broth culture. Grow overnight at25 to 30°C with shaking. 2. Late in the evening, inoculate 1,000 ml of MG/L broth with the 2-ml overnight culture. Grow at 25 to 30°C with shaking for12 hours.
3. Early the next morning, chill the culture on ice for 10 minutes, then pour the culture into two chilled 500-ml centrifugebottles, balance the bottles against each other, and centrifuge at 3,000xg for 10 minutes in a chilled centrifuge.
4. Discard the supernatant into another bottle (for later autoclaving) and resuspend each pellet in 500 ml of ice cold 10%glycerol. Balance the bottles against each other and centrifuge at 3,000xg for 10 minutes in a chilled centrifuge.
5. Discard the supernatant into another bottle (for later autoclaving) and resuspend each pellet in 10 ml of ice cold 10%glycerol. Balance the bottles against each other and centrifuge at 3,000xg for 10 minutes in a chilled centrifuge.
6. Discard the supernatant into another bottle (for later autoclaving) and resuspend each pellet in 250 µl of ice cold 1 Msorbitol. Dispense 50 µl aliquots into chilled microcentrifuge tubes. The tubes can be frozen at -80°C at this point or useddirectly for transformation as per the protocol given earlier.
Alternative chemically-competent A. tumefaciens C58 cells (12):1. Pick a single colony of A. tumefaciens C58 off of a plate culture and inoculate a 2-ml LB broth culture. Grow overnight at25 to 30°C with shaking.
MicrobeLibrary http://archive.microbelibrary.org/edzine/details_print.asp?id=2391&lang=
9 of 10 3/13/2012 1:48 PM

2. Inoculate 50 ml of LB broth with the 2-ml overnight culture. Grow at 25 to 30°C with shaking for 5 hours.
3. Chill the culture on ice for 10 minutes, then pour the culture into centrifuge tubes, balance the tubes, and centrifuge at3,000xg for 5 minutes in a chilled centrifuge.
4. Discard the supernatant into an autoclave bag and resuspend the pellet in 1 ml of ice cold 20 mM CaCl2. Dispense 100 µlaliquots into chilled microcentrifuge tubes. The tubes can be frozen at -80°C at this point or used directly for transformation.
5. Add >50 ng of plasmid DNA to a tube of thawed but ice cold competent cells.
6. Freeze the tube in liquid nitrogen.
7. Thaw the cells at 37°C for 5 minutes.
8. Add 1 ml of LB to the tube and incubate at 25 to 30°C for 3 hours with gentle shaking.
9. Centrifuge the tubes for 30 seconds, then discard most of the supernatant leaving around 100 µl. Resuspend the cells inthe remaining liquid and spread onto a LB-plus-carbenicillin plate. Incubate the plate at 25 to 30°C for 3 to 5 days untilcolonies appear.
MicrobeLibrary http://archive.microbelibrary.org/edzine/details_print.asp?id=2391&lang=
10 of 10 3/13/2012 1:48 PM

1
Functional Genomics: Using Reverse Genetics to Test Bioinformatics Predictions Procedure – Student Version: This project involves the techniques of bacterial genetics and recombinant DNA cloning, but its goal is connected to a much larger scientific effort—to understand what a complete genome sequence can tell us about the biology of a particular bacterium. As you already know, a gene is a segment of DNA that says “make a particular protein at a particular time and place.” Over most of the last 50 years, scientists have studied genes and the proteins they encode one at a time. While this approach has been highly successful, there are questions that are best addressed by looking at many or all of the genes of an organism at the same time. All the genes of an organism are known collectively as its genome, and the study of genomes is called genomics. Genomics not only can answer questions about known genes, but the determination of the entire DNA sequence of an organism also exposes hundreds to thousands of “new” genes and just as many new questions for future research. A few years ago, two parallel efforts resulted in the determination of the complete genome sequence for of the common soil bacterium and plant pathogen Agrobacterium tumefaciens strain C58 (Goodner et al., 2001; Wood et al., 2001). Now a sequence alone is just a string of A’s, C’s, G’s, and T’s unless you know how to read it. Over the past decade, the rules of molecular genetics have been used to design computer algorithms for the analysis, or annotation, of DNA sequences (where genes are, what proteins they code for, their putative roles in the biology of the organism). This exciting area of biology is known as bioinformatics, and hopefully you will get a chance to use those tools yourself at another time. For now, we are going to take the genome sequence annotation already done for A. tumefaciens C58 and use it for what it is worth as a large set of testable hypotheses. Now for the really fun part! We want to start connecting genes to real experimentally-verified functions. This is known as functional genomics. Now the first question you might ask is why we care about a common bacterium that is found in temperate soils worldwide? Great question. It turns out that Agrobacterium tumefaciens is a very unique bacterium in many respects. It was identified at the turn of the century as the causal agent of a tumor-like disease found on many plants called crown gall (Smith and Townsend, 1907). It was later found that the bacterial cells did not have to be around all the time in order for the disease to occur. If the bacterial cells were allowed to infect a wound on the plant for a few hours, one could kill the bacterial cells and a tumor would still form weeks later at the wound site (Braun, 1958). The bacteria had somehow transformed the plant cells at the wound site! What was the transforming principle? (Where have we heard that before and what did it mean then?) In 1977, it was finally proven that A. tumefaciens transfers of piece of DNA from itself into a plant cell, and it is the expression of genes within the transferred DNA that leads to the disease state (Fig. 1) (Chilton et al., 1977). We know of no other example of such a virulence mechanism.
2
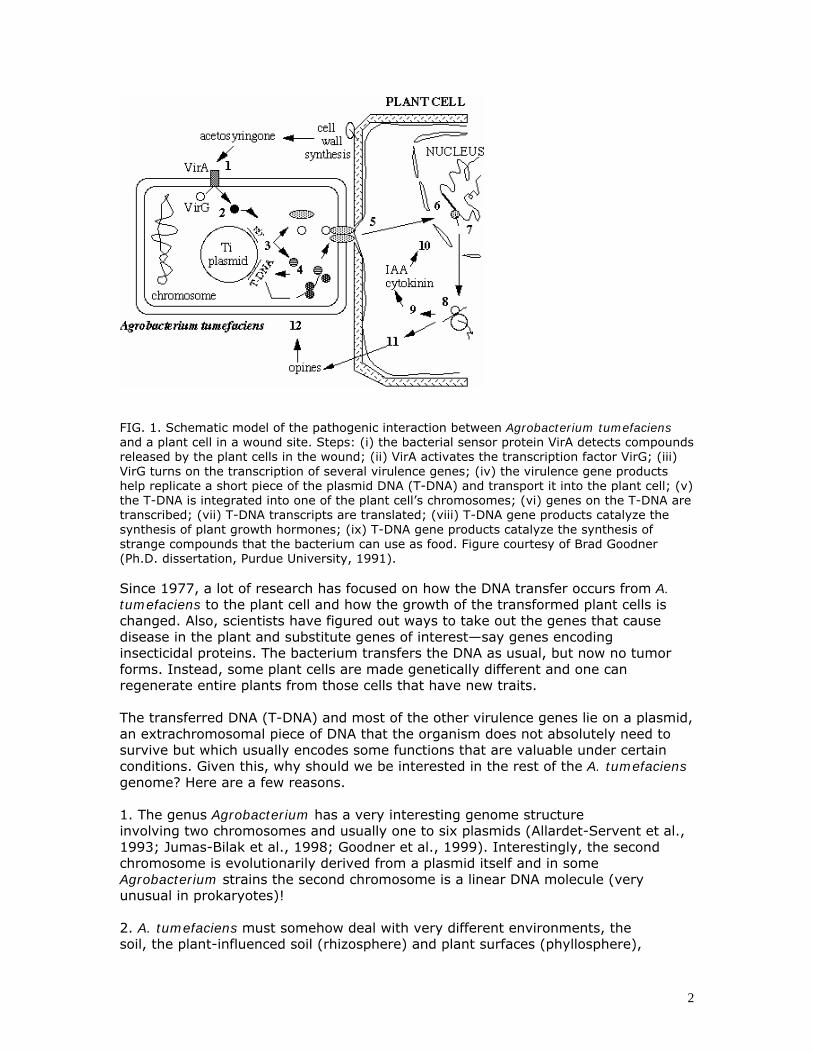
FIG. 1. Schematic model of the pathogenic interaction between Agrobacterium tumefaciens and a plant cell in a wound site. Steps: (i) the bacterial sensor protein VirA detects compounds released by the plant cells in the wound; (ii) VirA activates the transcription factor VirG; (iii) VirG turns on the transcription of several virulence genes; (iv) the virulence gene products help replicate a short piece of the plasmid DNA (T-DNA) and transport it into the plant cell; (v) the T-DNA is integrated into one of the plant cell’s chromosomes; (vi) genes on the T-DNA are transcribed; (vii) T-DNA transcripts are translated; (viii) T-DNA gene products catalyze the synthesis of plant growth hormones; (ix) T-DNA gene products catalyze the synthesis of strange compounds that the bacterium can use as food. Figure courtesy of Brad Goodner (Ph.D. dissertation, Purdue University, 1991). Since 1977, a lot of research has focused on how the DNA transfer occurs from A. tumefaciens to the plant cell and how the growth of the transformed plant cells is changed. Also, scientists have figured out ways to take out the genes that cause disease in the plant and substitute genes of interest—say genes encoding insecticidal proteins. The bacterium transfers the DNA as usual, but now no tumor forms. Instead, some plant cells are made genetically different and one can regenerate entire plants from those cells that have new traits. The transferred DNA (T-DNA) and most of the other virulence genes lie on a plasmid, an extrachromosomal piece of DNA that the organism does not absolutely need to survive but which usually encodes some functions that are valuable under certain conditions. Given this, why should we be interested in the rest of the A. tumefaciens genome? Here are a few reasons. 1. The genus Agrobacterium has a very interesting genome structure involving two chromosomes and usually one to six plasmids (Allardet-Servent et al., 1993; Jumas-Bilak et al., 1998; Goodner et al., 1999). Interestingly, the second chromosome is evolutionarily derived from a plasmid itself and in some Agrobacterium strains the second chromosome is a linear DNA molecule (very unusual in prokaryotes)! 2. A. tumefaciens must somehow deal with very different environments, the soil, the plant-influenced soil (rhizosphere) and plant surfaces (phyllosphere),
3
possibly inside plant wounds, and possibly inside plant tumors. These environments differ in nutrient availability and in the level and sources of physiological stress. The bacterium must adjust its gene expression and metabolism accordingly. Also, the bacterium will encounter and have to deal with competitors (other bacteria and fungi), predators (other bacteria, fungi, and invertebrates), and parasites (e.g., viruses). 3. A. tumefaciens has a diverse and interesting metabolism. Chromosomally-encoded pathways allow it to utilize a wide array of compounds as carbon and nitrogen sources. It can also synthesize several large carbohydrate polymers. Finally, it can deal with a wide variety of environmental stresses. Now, you may be interested in studying how cells interact with their surroundings via membrane receptors, or how certain biochemical reactions regulate cellular processes, or even how cells grow or divide. Ultimately, a big part of what determines how cells act is their genome, their genetic make-up. We hear a lot about genomes, sequencing genomes, and identifying putative genes within genomes. However, it is the expression of a genome (production of gene products, i.e., proteins) that gives a cell its unique qualities. Testing the function of putative genes is called functional genomics. One way that biologists study cellular processes is to alter the gene expression of cells. Let’s say we are interested in how a pathogenic bacterium is capable of invading a host cell. What types of proteins (structural, enzymatic) are necessary for the process to occur? How many different proteins are involved? What is the role of each protein? One way to study the roles of various gene products involved in invasion is to see what happens when certain genes are not expressed. In other words, we could look at mutant forms of the bacteria in which a specific gene has been inactivated, and ask the question how does the disruption of this gene affect invasion? You are going to do something similar during this project. During the next few weeks, you will use PCR and recombinant DNA techniques to clone a DNA fragment that will be used to make a mutation in one predicted gene of the Agrobacterium tumefaciens C58 genome. Once you have verified that you have cloned an internal portion of your gene of interest, we will use that clone to generate a mutation back in A. tumefaciens. Amazingly, the bacterium will do the work for us through a process called homologous recombination. If two DNA molecules carry the same sequence, even if it is only a few hundred base pairs, then those two molecules can physically exchange segments through the shared sequence via a cut-and-paste mechanism that involves specific proteins. You have seen homologous recombination before during prophase I of meiosis, but it also occurs to differing levels in various eukaryotic and prokaryotic microbes. Good enough, you say, but how does exchanging segments of identical DNA sequence lead to the generation of a mutation in a specific gene? Here is where the fact that you cloned an internal portion of the gene of interest comes into play (Fig. 2). The plasmid you will use in your cloning cannot replicate in A. tumefaciens. Therefore, if you introduce your plasmid clone into A. tumefaciens (we will use an electric voltage to induce the cells to take up DNA), the only way the plasmid can stay around is if it becomes part of another DNA molecule that can replicate such as one of the chromosomes. The perfect sequence homology between the internal portion of the gene you cloned and the corresponding segment from the entire gene provides a site for homologous recombination to take place. Don’t rely on your mind’s eye, so draw it out. Use your finger or a pencil to walk around the recombination event. Starting on the chromosome, you move right into the gene of interest, cross over into the plasmid

4
clone, hit a breakpoint in the gene, go all the way around the plasmid clockwise, then reenter the gene of interest part way down its length and on to the rest of the chromosome. The plasmid has become integrated into the chromosome, but the gene of interest is disrupted into two nonfunctional parts. This is a rare event, but we can select for those rare events using the ampicillin-carbenicillin resistance gene carried on the plasmid. Cells that did not take up the plasmid or took it up but did not recombine it into the chromosome will die in the presence of carbenicillin.
gene of interest in A. tumefaciens genome Carbr portion plasmid portion plasmid pCR2.1 of gene sequences of gene cannot replicate in Agrobacterium Carbr FIG. 2. Schematic diagram of construction of gene disruption. Carbr represents a gene conferring resistance to carbenicillin. Once you have cloned a portion of a gene of interest and used it to generate a gene disruption mutation in that gene within A. tumefaciens, your next job, later in the semester, will be to use that mutant strain to determine the function of the protein encoded by the gene of interest. In other words, how has the biology of A. tumefaciens been affected by its inability to produce a specific protein? You will work in small groups to design an experiment or set of experiments to test your mutant strain (usually with the wild type as a control) and determine whether or not gene function has been truly knocked out. These experiments do not have to come out of thin air. Why not make use of information gleaned by other scientists studying proteins like yours in other organisms. Where do you find such information—journal articles in the primary scientific literature. In addition to knowledge from work done in other organisms, you can and should make use of what we know about the biology of A. tumefaciens. Lots of work has been done on how A. tumefaciens transfers DNA into plant cells, but there is still much to learn about other parts of the interaction with plants and other aspects of the life of this soil bacterium. Here is your chance to make a significant contribution. Methods Timeline for Experiments: Week 1 – Isolation of genomic DNA, PCR amplification of internal gene fragment, and gel electrophoresis of PCR reactions (outside of lab time) Week 2 – Purification of PCR product from gel, ligation of PCR product into plasmid, and transformation of ligation into competent E. coli (part of transformation takes place outside of lab) Week 3 – Inoculation of transformant E. coli colonies into growth medium (outside of lab time), isolation of plasmid DNA, restriction endonuclease digestion of plasmid DNA, and gel electrophoresis of restriction digestions (outside of lab time)
5
Week 4 – Analysis of gel electrophoresis results and transformation of positive plasmid clone DNAs into competent A. tumefaciens C58 (part of transformation takes place outside of lab) Week 5 – Restreaking of transformant A. tumefaciens C58 gene disruption mutants, brainstorming on possible experiments to test predicted gene function, and preparation of experimental materials Weeks 6 and 7 – Experiments to test predicted gene function in A. tumefaciens C58 gene disruption mutants Week 8 – Presentations on project Genomic DNA Isolation: Genomic DNA Isolation (instructions modified from QIAGEN DNAEasy kit manual; buffer ATL, proteinase K, buffer AL, buffer AW1, buffer AW2, and buffer AE solutions are included with the kit): 1. Transfer 1.5 ml of an overnight culture of A. tumefaciens C58 into a microcentrifuge tube and spin down the cells for 1 minute at maximum speed (16,000 rpm). 2. Discard the culture supernatant by gently pouring it into a biohazard bag (keep the pellet on the high side of the tube to avoid losing cells). Resuspend the cell pellet in 180 ul of buffer ATL. This is just a standard physiological buffer. 3. Add 20 μl of proteinase K solution and mix by vortexing briefly. Incubate the mixture at 55°C for 15 minutes. Proteinase K helps degrade the bacterial cell wall. 4. Vortex the tube for 15 seconds. Add 200 μl of buffer AL to the sample and mix thoroughly by vortexing, then incubate the sample at 70°C for 10 minutes. Buffer AL contains guanidine hydrochloride, a chaotropic salt which disrupts membranes and solubilizes lipids and proteins. (If you see a white precipitate after adding buffer AL, don’t worry. Vortex the sample well and the material should dissolve during the incubation at 70°C. The precipitate does not interfere with genomic DNA isolation). 5. Add 200 μl of ethanol (96 to 100%) to the sample, and mix thoroughly by vortexing. The ethanol helps with the solubilization of cellular materials that will allow the cell lysate to pass through the DNA-binding column easily. 6. Pipette the entire mixture into a DNAEasy spin column placed in a 2-ml collection tube (make sure you label the top of the spin column). Centrifuge the tube at 8,000 rpm (~6,000 x g) for 1 minute. The spin column contains specially-treated tiny silica beads which will bind nucleic acids preferentially under high salt conditions (which we have here). 7. Discard the flowthrough and collection tube into a biohazard bag, but DO NOT THROW AWAY THE SPIN COLUMN (IT HAS YOUR GENOMIC DNA). Place the spin column in a new 2-ml collection tube, add 500 μl of buffer AW1, and centrifuge at 8,000 rpm for 1 minute. Buffer AW1 is a wash buffer containing guanidine hydrochloride, ethanol, and high
6
salt to wash away unwanted proteins, etc., while allowing the genomic DNA to stay attached to the column material. 8. Discard the flowthrough and collection tube into a biohazard bag, but DO NOT THROW AWAY THE SPIN COLUMN (IT HAS YOUR GENOMIC DNA). Place the spin column in a new 2-ml collection tube, add 500 μl of buffer AW2, and centrifuge at 8,000 rpm for 3 minutes. Buffer AW2 is a high salt and ethanol wash buffer without guanidine hydrochloride. The extra spin time ensures that the wash buffer is removed completely before the elution step. 9. Very carefully, discard flowthrough and collection tube into a biohazard bag, (you don’t want any liquid on the spin column). Place the spin column in a sterile microcentrifuge tube (properly labeled) and pipette 200 μl of buffer AE directly onto the top surface membrane of the spin column. Buffer AE is a very low salt buffer. Incubate at room temperature for 1 minute, then centrifuge for 1 minute at 8,000 rpm to elute the DNA from the column. NOW YOU WANT TO KEEP THE SOLUTION, SO THROW AWAY ONLY THE SPIN COLUMN AND KEEP THE TUBE CONTAINING THE DNA SOLUTION. PCR Amplification of Internal Gene Fragments (Your instructor has already designed PCR primers for your gene of interest.): 1. Transfer a Ready-to-Go PCR bead to an appropriately-sized tube for your PCR thermocycler. Label the tube with the name of the gene for which you are amplifying an internal fragment. 2. To the PCR bead, add 22 μl of sterile distilled water, 1 μl of primer #1 for your gene of interest, 1 μl of primer #2 for your gene of interest, and finally 1 μl of Agrobacterium genomic DNA. Put your tube on ice until everyone is ready to place their tubes in the PCR thermocycler. After cycling is completed, reaction mixtures will be stored at –20°C. 3. Set up the PCR thermocycler for 1 cycle of 94°C, 3 minutes; then 30 cycles of 94°C, 30 seconds, 60°C, 30 seconds, 72°C, 1 minute; 1 cycle of 72°C, 5 minutes, and finally a 4°C hold. Start the run. Once the thermocycler heat block comes up to 80°C in the first cycle, add all the PCR reaction tubes to the heat block (be careful!). This is known as a hot start to ensure that all the genomic DNA denatures at the same time and the PCR primers bind to the proper targets at the first annealing step. Gel Electrophoresis: 1. Add 5 μl of 5X loading buffer to each of your PCR reactions, mix, and spin down briefly in a microcentrifuge. Loading buffer consists of three components: (i) EDTA, which chelates magnesium, stopping any reaction of DNA with enzymes, (ii) glycerol, to make the density of the sample greater than the salt solution so that the sample will sink to the bottom of the hole, and (iii) a negatively charged blue dye (bromophenol blue) which enables you to monitor the loading process and the progress of the electrophoresis. 2. Practice loading samples into wells using the gel marked “practice” and the solution marked “practice sample.” Don’t worry about loading under buffer; the loading buffer makes the sample dense enough to sink to the bottom of a well. Load 25 μl into each of a couple of wells. Try to hold the end of your pipettor tip just into the top of the well. Don’t jam it into the bottom of the well. Gently expel the sample
7
into the well. When finished, keep your thumb depressed on the pipettor while you lift your hand up. 3. Load your PCR reactions (total of 30 μl per reaction) into separate wells on the gel. Obviously, it is essential to record carefully which sample went into which well! After everyone has loaded their samples and DNA standards have been loaded in additional wells, the gel is closed and the electricity is turned on. You won’t be able to see the DNA move, but on a 1% agarose gel the blue dye will move towards the positive pole at about the same speed as a DNA fragment of 300 bp. When the dye nears the end of the gel, it’s done. The gel is then stained with the fluorescent dye SYBR Green, a safer alternative to ethidium bromide, which binds to DNA and RNA. The gel is then ready to be photographed. PLEASE BE CAREFUL AROUND ULTRAVIOLET (UV) SOURCES SUCH AS TRANSILLUMINATORS. WHEN NOT SHIELDED BY A CAMERA HOOD OR UV-OPAQUE SCREEN, THESE SOURCES EMIT UV LIGHT THAT CAN BE MUTAGENIC TO YOUR CELLS. ALWAYS WEAR A FACE SHIELD, LAB COAT, AND GLOVES TO PROTECT YOURSELF. The electrophoresis takes several hours and the staining another 10 or 15 minutes. You therefore will probably not be around to see what happened to your gel, but you will get a picture of your gel results. REMIND YOUR INSTRUCTOR NOT TO THROW OUT THE GEL BECAUSE YOU WILL NEED TO CUT OUT SOME DNA FRAGMENTS LATER! Cleanup of PCR Product (instructions modified from QIAGEN QIAQuick kit manual; buffer QG, buffer PE, and buffer EB solutions are included with the kit): 1. Looking at your stained gel, determine the fragment that represents your correct PCR product. Carefully using a safety scalpel or other approved safe cutting instrument, previously sterilized by ethanol wipe or dip, cut out the region you desire (REMEMBER THE WARNING ABOUT UV SOURCES—YOU WILL HAVE TO DO THIS WEARING A UV-OPAQUE FACE MASK WITH YOUR GEL ILLUMINATED BY A UV BOX). Transfer the gel slice(s) into a fresh labeled microcentrifuge tube. 2. Use an empty microcentrifuge tube to tare a microbalance, then weigh your tube. If your gel slice weighs more than 300 mg, you need to cut it in half, split it between two tubes, and reweigh the tubes. 3. Add 3 gel volumes of buffer QG. This means that if your gel slice weighed 200 mg, you would add 3 x 200 = 600 μl of buffer QG to your tube. Incubate your tube at 55°C for 10 minutes or until your gel slice is fully dissolved, vortexing your tube briefly every 3 minutes. 4. Check the color of your solution. It should be yellow. If it is orange or violet, then add 10 μl of 3 M NaOAc, pH 5 (sodium acetate) to your tube to lower the pH. The binding of the DNA to the QIAquick column membrane is most efficient at a pH Less than 7.5. Buffer QC has a pH-sensitive color indicator. 5. Add 1 gel volume of isopropanol to your tube and mix by vortexing briefly. Place a QIAquick spin column in a collection tube, then pour your sample into the spin column. 6. Spin the tubes in a microcentrifuge at full speed for 1 minute to bind the DNA to the column matrix (silica-based material that binds DNA under high salt conditions). 7. Pull out the spin column and hold onto it while pouring the flowthrough into a biohazard bag. Return the spin column to the collection tube, then

8
pipette 500 μl of buffer QG into the spin column. This wash will help eliminate any last tiny pieces of agarose. Spin in a microcentrifuge at full speed for 1 minute. 8. Pull out the spin column and hold onto it while discarding the flowthrough into a biohazard bag. Return the spin column to the collection tube, then add 500 μl of buffer PE to each spin column and let the column stand for 5 minutes. This wash helps remove some of the salt while keeping the DNA bound to the column matrix. Spin in a microcentrifuge at full speed for 1 minute. Discard the flowthrough from the collection tube, return the spin column to the collection tube, and respin for 1 more minute. 9. Label a fresh sterile microcentrifuge tube. Throw away the collection tube and any flowthrough it contains into a biohazard bag, and place the dried spin column into a fresh sterile microfuge tube. 10. Add 20 μl of buffer EB to the spin column and let stand for at least 1 minute. The no-salt conditions of buffer EB bump the DNA off of the glass beads. Spin in a microcentrifuge at full speed for 1 minute. Throw away the spin column into a biohazard bag and close the microcentrifuge tube. You now have purified DNA ready for ligation. Ligation of PCR Products into Plasmid Cloning Vector: 1. To a sterile microcentrifuge tube, add 4 μl of cleaned-up Agrobacterium PCR product, 1 μl of salt solution (1.2 M NaCl, 0.06 M MgCl2), and finally 1 μl of pCR2.1 plasmid vector (cut to expose 3’ T overhangs and with topoisomerase already added to perform ligase function). Mix the solution very gently by moving your pipettor tip around, not by pipetting up and down. 2. Incubate at room temperature for at least 30 minutes (overnight is okay as well). Transformation of Ligation Mixture into E. coli: 1. Thaw out a tube of chemically competent E. coli cells on top of ice (not in the ice) until liquidy, then place the tube into the ice. 2. Add 3 μl of ligation mixture to competent cells and mix very gently by moving your pipettor tip around, not by pipetting up and down. 3. Incubate transformation mixture on ice for 15 to 30 minutes. 4. Walk your ice bucket over to a heat block set at 42°C. Transfer your tube from the ice to the heat block for exactly 30 seconds and then place the tube back in the ice for 2 minutes. 5. Add 250 μl of SOC broth medium to the tube and shake the tube at 37°C for 1 hour. 6. Obtain two LBAmp + Xgal plates and label them on the bottom with your initials and the date. 7. Pipette 50 μl of the transformation mix onto one plate and the remainder onto the other plate. Sterilize a spreader and spread the liquid evenly over each plate surface. Incubate the plates at 37°C for 1 to 2 days.

9
Isolation of Plasmid DNA (instructions modified from QIAGEN QIASpin kit manual; buffer P1, buffer P2, buffer N3, buffer PB, and buffer PE solutions are included with the kit): The day before lab. find three well-isolated large white colonies. For each colony, use a sterile toothpick to pick up a portion of the colony and inoculate a tube of LB broth containing 50 µg/ml ampicillin. Incubate the tubes in the shaking incubator overnight. 1. For each culture, label a sterile microcentrifuge tube (#1 through 3). Transfer the cultures into the microcentrifuge tubes. 2. Pellet the cells by spinning the tubes in a microcentrifuge for 1 minute at full speed (16,000 rpm). 3. Pour the supernatant into an autoclave bag. Resuspend each pellet in 250 μl of buffer P1. Buffer P1 is a weak buffer at physiological pH (7.5) and salt concentration. It also contains RNase that will degrade RNAs once the bacterial cells are broken. 4. Add 250 μl of buffer P2 to each tube and mix by gently inverting the tubes several times. The cell suspension should become viscous. The high pH and sodium dodecyl sulfate detergent in this buffer disrupt membranes and bacterial cell walls, and the detergent solubilizes proteins and lipids. The broken pieces of bacterial chromosome will denature at high pH and the strands will float away from each other. The two strands of the intact circular plasmid molecules cannot separate from each other very far (topologically linked). 5. Add 350 μl of buffer N3 to each tube and mix by gently inverting the tubes several times. The quanidinium salts in buffer N3 and the lowered pH (back to ~7.5) leads the sodium dodecyl sulfate-solubilized material to form insoluble complexes and fall out of solution, accounting for the snowstorm going on in your microcentrifuge tubes. The huge single-stranded pieces of the bacterial chromosome will get caught up in the precipitating complexes, but the much smaller intact plasmid molecules will stay in solution and renature to a double helix conformation. 6. Spin the tubes in a microcentrifuge at full speed for 10 minutes to pellet the unwanted cell debris (proteins, lipids, and chromosome fragments). While tubes are spinning, label three spin columns and place each in a catch tube. 7. Carefully pour each supernatant into a spin column (sitting in a collection tube). The double-stranded plasmid DNA will bind to the tiny glass beads in the spin column under the high salt conditions of buffer P3, while RNA, ssDNA, proteins, and other cell components will not. Spin in a microcentrifuge at full speed for 30 seconds. Discard the flowthrough from the tube. 8. Add 500 μl of buffer PB to each spin column. This high salt wash helps clean away any contaminants from the bound plasmid DNA. Spin in a microcentrifuge at full speed for 30 seconds. Discard the flowthrough from the collection tube. 9. Add 750 μl of buffer PE to each spin column. This high salt and ethanol wash further cleans the bound plasmid DNA. Spin in a microcentrifuge at full speed for 30 seconds. Discard the flowthrough from the collection tube. 10. Without adding any additional buffer, spin the tubes in a microcentrifuge at full speed for 1 minute. Throw away the collection tube and any flowthrough it contains
10
and place the dried spin column in a labeled sterile microcentrifuge tube. 11. Add 50 μl of sterile water to each spin column and let stand for at least 1 minute. The low ionic strength conditions of the sterile water bump the plasmid DNA off of the glass beads. Spin in a microcentrifuge at full speed for 1 minute. Throw away the spin column, close the microcentrifuge tube. You now have purified plasmid DNA! Restriction Enzyme Digestion of Plasmid DNA: 1. For each of your plasmid clones, label one tube with your initials and “Eco.” 2. For each of your plasmid clones, add 17 μl of the plasmid clone solution to a labeled tube. Store the remainder of the DNA at -20°C until you are ready to transform Agrobacterium. 3. For each labeled tube, add 3 μl of the appropriate enzymes-plus-buffer mix (EcoRI in EcoRI digestion buffer). Incubate all tubes at 37°C for at least 2 to 3 hours. Gel Electrophoresis: 1. Add 5μl of 5X gel loading buffer to each of your digested DNA samples, mix, and spin down briefly in a microcentrifuge. 2. Load your restriction digests (total of 25 μl per reaction) into separate wells on the gel. Obviously, it is essential to record carefully which sample went into which well! After everyone has loaded their samples and DNA standards have been loaded in additional wells, the gel is closed and the electricity is turned on. As noted with the previous gel electrophoresis description, please follow all safety precautions when staining and photographing gels. Electroporation of Plasmid DNA into A. tumefaciens C58: 1. Once you have verified that one or more of your plasmid clones contains the proper insert fragment, place one of the corresponding uncut plasmid tubes on ice. Thaw out a tube of electrocompetent A. tumefaciens C58 cells on top of ice (not in the ice) until liquidy, then place the tube into the ice. 2. Add 3 μl of uncut plasmid DNA into the competent cells and mix very gently by gently tapping the tube on the bench top two or three times, not by pipetting up and down. Return cells to ice immediately and incubate on ice for 5 to 10 minutes. 3. Obtain an electroporation cuvette and place on ice. Transfer the cell-plus-DNA mixture into the cuvette, making sure to pipette the mixture into the small gap between the metal sides. Take your ice bucket over to the electroporator. Have a partner pick up 250 μl of sterile MG/L medium with a micropipette. Turn the electroporator on and bring the setting to “AGR” (or whatever corresponding setting works for A. tumefaciens on your electroporator). Transfer the electroporation cuvette out of the ice bucket and into the cuvette holder (the ridge on one plastic side of the cuvette will fit into the notch of the cuvette holder). Push the holder into the covered electroporator until the metal sides of the cuvette snap into place between the electrodes. Press and hold the pulse button until you hear a beep (and hopefully see no lightning bolt arc within your cuvette), then quickly remove the cuvette from the electroporator, add the 250 μl of sterile MG/L medium to the cells and then transfer the cell mixture to a clean microfuge tube or test tube. Label the
11
tube and incubate the transformed cell mixture at 25 to 30°C for 2 to 3 hours with shaking. 5. Obtain two LB-plus-carbenicillin plates and label them on the bottom with your initials and the date. 6. Pipette 50 µl onto one plate and the remainder of the transformation mix onto the other plate. Sterilize a spreader and spread the liquid evenly over each plate surface. Incubate the plate upside down at 25-30°C for 3-5 days until colonies appear. These will be your mutant A. tumefaciens C58 cells in which your gene of interest has been disrupted. Experimental design: Your job over the next couple of weeks is to work with the A. tumefaciens C58 gene disruption mutant you generated. How has the biology of A. tumefaciens C58 been affected by its inability to produce a specific protein? You and your partner(s) need to first design 1-2 experiments to test your mutant strain and determine whether or not gene function has been truly knocked out. To get some ideas for your experiments, go to the research literature (in the library or on the Internet) and see how past researchers have tested the function of your gene of interest. Look for assays that are doable using the time, space, equipment, and supplies available to you. Good experiments might involve a growth curve using different media, sensitivity to different inhibitors, enzyme assays, and motility tests. Once you have some good ideas, sketch out an experimental plan and a list of materials needed. These will need to be checked off by your instructor before you proceed with your experiments. Good luck with your experiments and remember that you are learning something new about this organism! References: Goodner, B., G. Hinkle, S. Gattung, N. Miller, M. Blanchard, B. Qurollo, B. S. Goldman, Y. Cao, M. Askenazi, C. Halling, L. Mullin, K. Houmiel, J. Gordon, M. Vaudin, O. Iartchouk, A. Epp, F. Liu, C. Wollam, M. Allinger, D. Doughty, C. Scott, C. Lappas, B. Markelz, C. Flanagan, C. Crowell, J. Gurson, C. Lomo, C. Sear, G. Strub, C. Cielo, and S. Slater. 2001. Genome sequence of the plant pathogen and biotechnology agent Agrobacterium. Science 294:2323–2328. Wood, D. W., J. C. Setubal, R. Kaul, D. E. Monks, J. P. Kitajima, V. K. Okura, Y. Zhou, L. Chen, G. E. Wood, N. F. Almeida Jr., L. Woo, Y. Chen, I. T. Paulsen, J. A. Eisen, P. D. Karp, D. Bovee Sr., P. Chapman, J. Clendenning, G. Deatherage, W. Gillet, C. Grant, T. Kutyavin, R. Levy, M.-J. Li, E. McClelland, A. Palmieri, C. Raymond, G. Rouse, C. Saenphimmachak, Z. Wu, P. Romero, D. Gordon, S. Zhang, H. Yoo, Y. Tao, P. Biddle, M. Jung, W. Krespan, M. Perry, B. Gordon-Kamm, L. Liao, S. Kim, C. Hendrick, Z.-Y. Zhao, M. Dolan, F. Chumley, S. V. Tingey, J.-F. Tomb, M. P. Gordon, M. V. Olson, and E. W. Nester. 2001. The genome of the natural genetic engineer Agrobacterium tumefaciens C58. Science 294:2317–2323.
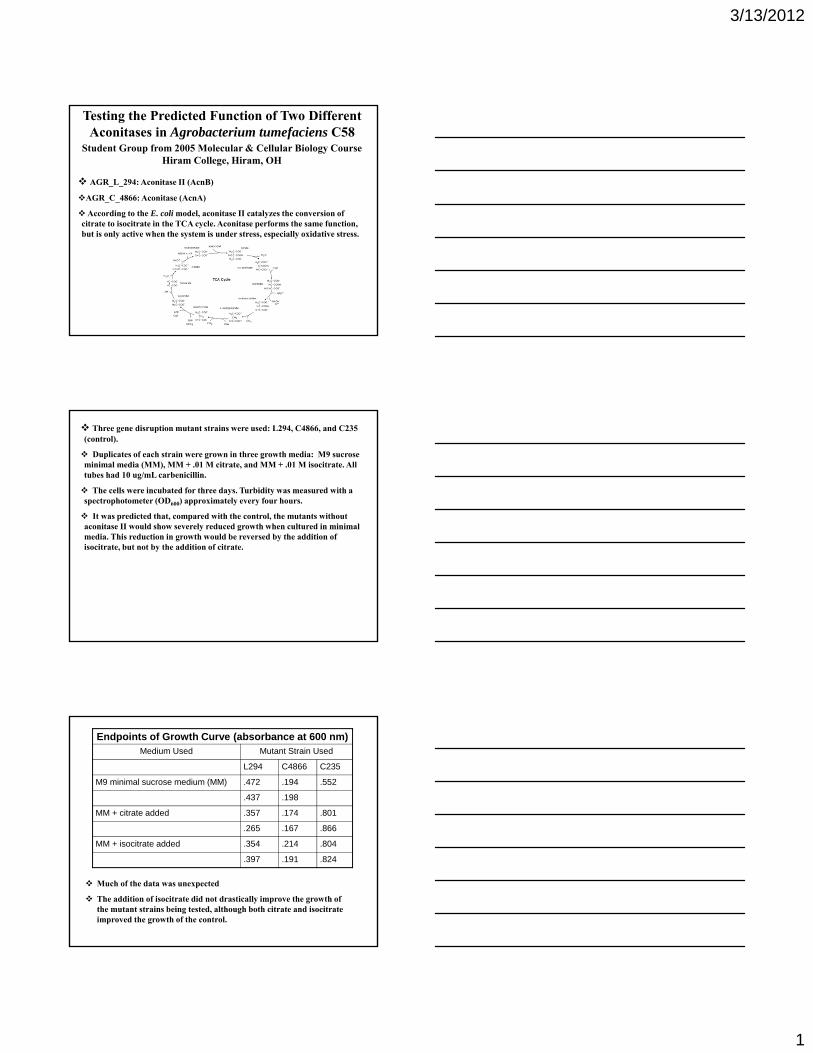
3/13/2012
1
Testing the Predicted Function of Two Different Aconitases in Agrobacterium tumefaciens C58
Student Group from 2005 Molecular & Cellular Biology CourseHiram College, Hiram, OH
AGR_L_294: Aconitase II (AcnB)
AGR_C_4866: Aconitase (AcnA)
According to the E. coli model, aconitase II catalyzes the conversion of citrate to isocitrate in the TCA cycle. Aconitase performs the same function, but is only active when the system is under stress, especially oxidative stress.
Three gene disruption mutant strains were used: L294, C4866, and C235 (control).
Duplicates of each strain were grown in three growth media: M9 sucrose minimal media (MM), MM + .01 M citrate, and MM + .01 M isocitrate. All tubes had 10 ug/mL carbenicillin.
The cells were incubated for three days. Turbidity was measured with a spectrophotometer (OD600) approximately every four hours.
It was predicted that, compared with the control, the mutants without aconitase II would show severely reduced growth when cultured in minimal media. This reduction in growth would be reversed by the addition of isocitrate, but not by the addition of citrate.
Endpoints of Growth Curve (absorbance at 600 nm)Medium Used Mutant Strain Used
L294 C4866 C235
M9 minimal sucrose medium (MM) .472 .194 .552
.437 .198
MM + citrate added .357 .174 .801
.265 .167 .866
MM + isocitrate added .354 .214 .804
.397 .191 .824
Much of the data was unexpected
The addition of isocitrate did not drastically improve the growth of the mutant strains being tested, although both citrate and isocitrate improved the growth of the control.
3/13/2012
2
The addition of citrate and isocitrate may have inhibited the growth of the mutants being tested.
This may be due to the deleterious effect of increased citrate concentrations. Some literature suggests that the cell detects oxidative stress by increased citrate levels. This would explain the reversed growth patterns of the L294 and C4866 strains.
The control may have reduced the effect of the increased citrate levels by the formation of glutamate (by transamination of α-ketoglutarate). There is
literature support for this mechanism, though it is somewhat sketchy.
References
• Sugden A. C. et al. “Fuel-sensing mechanisms integrating lipid and carbohydrate utilization.” Biochem. Soc. Trans. (2001) 29, (272–278) (Printed in Great Britain) http://www.biochemsoctrans.org/bst/029/0272/bst0290272.htm
• Helling, R. B. “Pathway Choice in Glutamate Synthesis in Escherichia coli.” J Bacteriol. 1998 September; 180(17): 4571–4575.
http://www.pubmedcentral.nih.gov/articlerender.fcgi?artid=107469

3/13/2012
1
Testing the Possibility that Aconitases Control Motility in Agrobacterium tumefaciens C58
Student Group from 2005 Molecular & Cellular Biology CourseHiram College, Hiram, OH
AGR_C_4866 encodes AcnA, AGR_L_294 encodes AcnB
Aconitase is a monomeric iron_sulphur protein that catalyzes interconversion of citrate to isocitrate in the citric acid cycle. A second function is a post-transcriptional regulation of Aconitase’s own synthesis and of other cellular activities such as motility.
Hypothesis: Based on the E. coli model, one or both of the Agrobacteriumaconitase mutants will have less motility than wildtype.
Figure 1: Regulatory pathwayfor FliC production in E. coli.An acnB- mutant of E. coli ishypomotile compared to wildtype.
Methods for Measuring MotilityOvernight cultures of wildtype, C4866- mutant, & L294- mutant were
adjusted to same OD, spun down in microfuge, and resuspended in buffer
Bridge Method:Prepared three 1.5% agar plates, each divided with half water agar and
half LB agarTwo filter strips per plate were placed as bridges over the two mediaCells from each strain were spotted on opposing ends of filter paper and
incubated under room temperature for a few days
Swarm Method:Prepared three 0.3% agar platesCells from each strain was spotted three times on the plate and incubated
at room temperature for a few days
Stab Method:Motility agar is a deep tube of solid growth medium with low agar %Motility agar contains TTC as an indicator to help see cellsCells from each strain inoculated with needles in a vertical stab and
incubated at room temperature for a few days
If one or both of the aconitases in Agrobacterium act like aconitase from E. coli, then mutating their gene will stop the function of the protein, and so the mutant strain will show less motility.
Table 1: Average Diameters of Growth Spots For Each Strain on Swarm Plates.
Strain Average Diameter (N = 3) After Two Days (mm)
Average Diameter (N = 3) After Three Days (mm)
C58 wildtype 3.7 6.6
AGR_L_294-mutant
3.4 4.9
AGR_C_4866-mutant
Too large to measure, circles merged together!
Too large to measure, circles merged together!
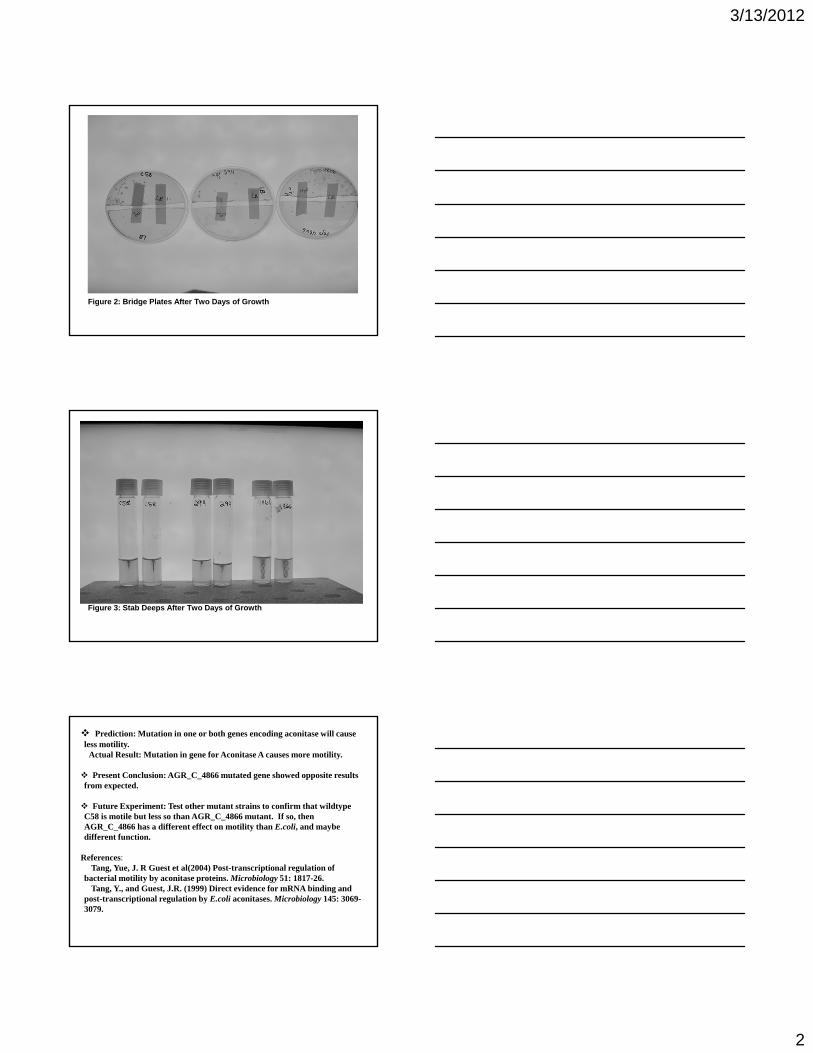
3/13/2012
2
Figure 2: Bridge Plates After Two Days of Growth
Figure 3: Stab Deeps After Two Days of Growth
Prediction: Mutation in one or both genes encoding aconitase will cause less motility.
Actual Result: Mutation in gene for Aconitase A causes more motility.
Present Conclusion: AGR_C_4866 mutated gene showed opposite results from expected.
Future Experiment: Test other mutant strains to confirm that wildtype C58 is motile but less so than AGR_C_4866 mutant. If so, then AGR_C_4866 has a different effect on motility than E.coli, and maybe different function.
References:Tang, Yue, J. R Guest et al(2004) Post-transcriptional regulation of
bacterial motility by aconitase proteins. Microbiology 51: 1817-26.Tang, Y., and Guest, J.R. (1999) Direct evidence for mRNA binding and
post-transcriptional regulation by E.coli aconitases. Microbiology 145: 3069-3079.
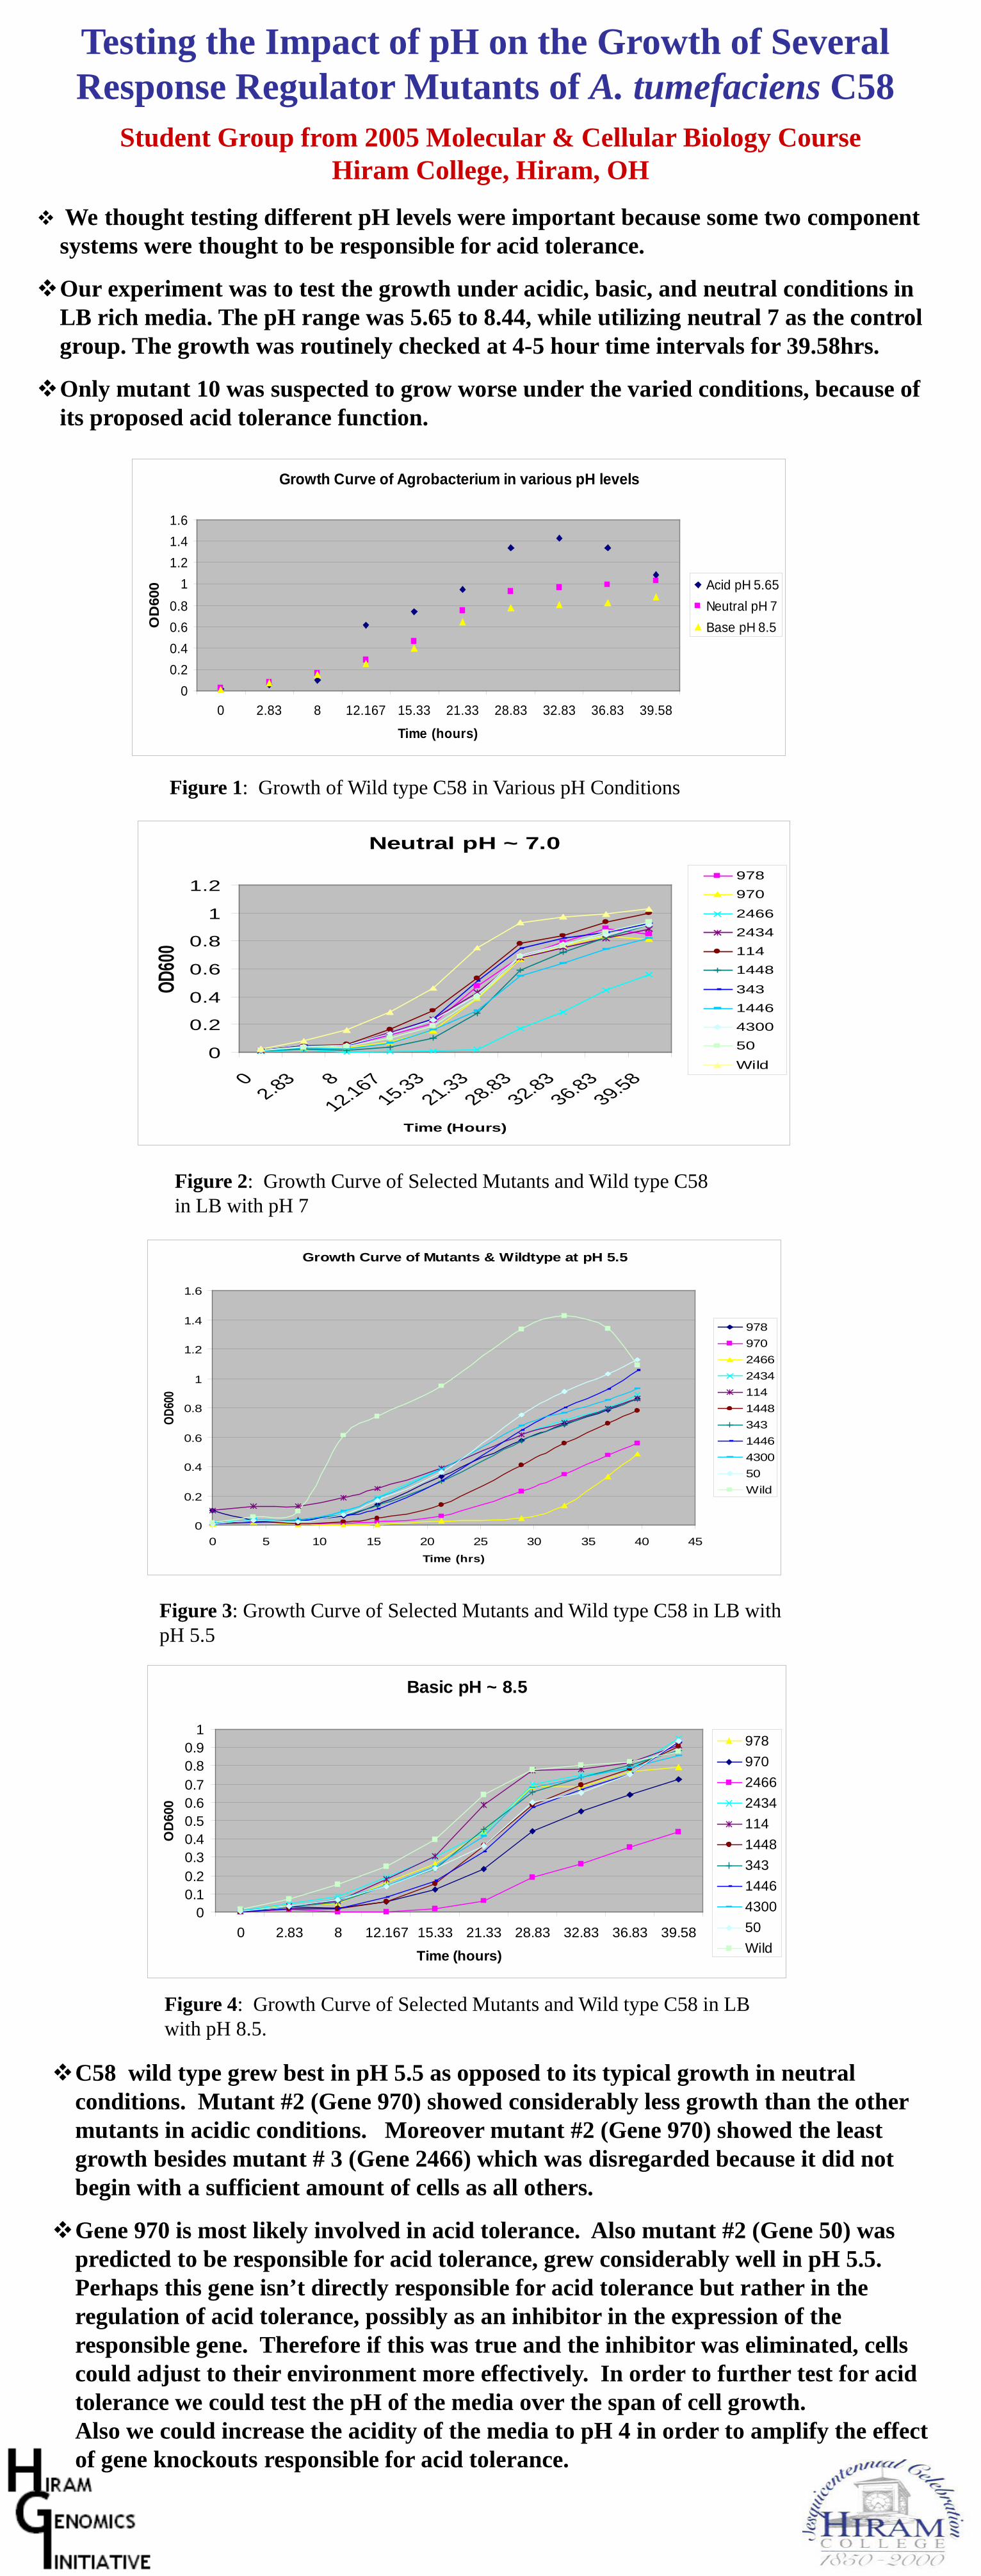
Testing the Impact of pH on the Growth of Several Response Regulator Mutants of A. tumefaciens C58
Student Group from 2005 Molecular & Cellular Biology Course Hiram College, Hiram, OH
We thought testing different pH levels were important because some two component systems were thought to be responsible for acid tolerance.
Our experiment was to test the growth under acidic, basic, and neutral conditions in LB rich media. The pH range was 5.65 to 8.44, while utilizing neutral 7 as the control group. The growth was routinely checked at 4-5 hour time intervals for 39.58hrs.
Only mutant 10 was suspected to grow worse under the varied conditions, because of its proposed acid tolerance function.
C58 wild type grew best in pH 5.5 as opposed to its typical growth in neutral conditions. Mutant #2 (Gene 970) showed considerably less growth than the other mutants in acidic conditions. Moreover mutant #2 (Gene 970) showed the least growth besides mutant # 3 (Gene 2466) which was disregarded because it did not begin with a sufficient amount of cells as all others.
Gene 970 is most likely involved in acid tolerance. Also mutant #2 (Gene 50) was predicted to be responsible for acid tolerance, grew considerably well in pH 5.5. Perhaps this gene isn’t directly responsible for acid tolerance but rather in the regulation of acid tolerance, possibly as an inhibitor in the expression of the responsible gene. Therefore if this was true and the inhibitor was eliminated, cells could adjust to their environment more effectively. In order to further test for acid tolerance we could test the pH of the media over the span of cell growth. Also we could increase the acidity of the media to pH 4 in order to amplify the effect of gene knockouts responsible for acid tolerance.
.
Growth Curve of Agrobacterium in various pH levels
0
0.2
0.4
0.6
0.8
1
1.2
1.4
1.6
0 2.83 8 12.167 15.33 21.33 28.83 32.83 36.83 39.58
Time (hours)
OD
600 Acid pH 5.65
Neutral pH 7
Base pH 8.5
Figure 1: Growth of Wild type C58 in Various pH Conditions
Neutral pH ~ 7.0
0
0.2
0.4
0.6
0.8
1
1.2
02.83 8
12.16715.33
21.3328.83
32.8336.83
39.58
Time (Hours)
OD60
0
978
970
2466
2434
114
1448
343
1446
4300
50
Wild
Figure 2: Growth Curve of Selected Mutants and Wild type C58 in LB with pH 7
Growth Curve of Mutants & Wildtype at pH 5.5
0
0.2
0.4
0.6
0.8
1
1.2
1.4
1.6
0 5 10 15 20 25 30 35 40 45
Time (hrs)
OD
600
978
970
2466
2434
114
1448
343
1446
4300
50
Wild
Figure 3: Growth Curve of Selected Mutants and Wild type C58 in LB with pH 5.5
Basic pH ~ 8.5
00.10.20.30.40.50.60.70.80.9
1
0 2.83 8 12.167 15.33 21.33 28.83 32.83 36.83 39.58
Time (hours)
OD
600
978
970
2466
2434
114
1448
343
1446
4300
50
Wild
Figure 4: Growth Curve of Selected Mutants and Wild type C58 in LB with pH 8.5.
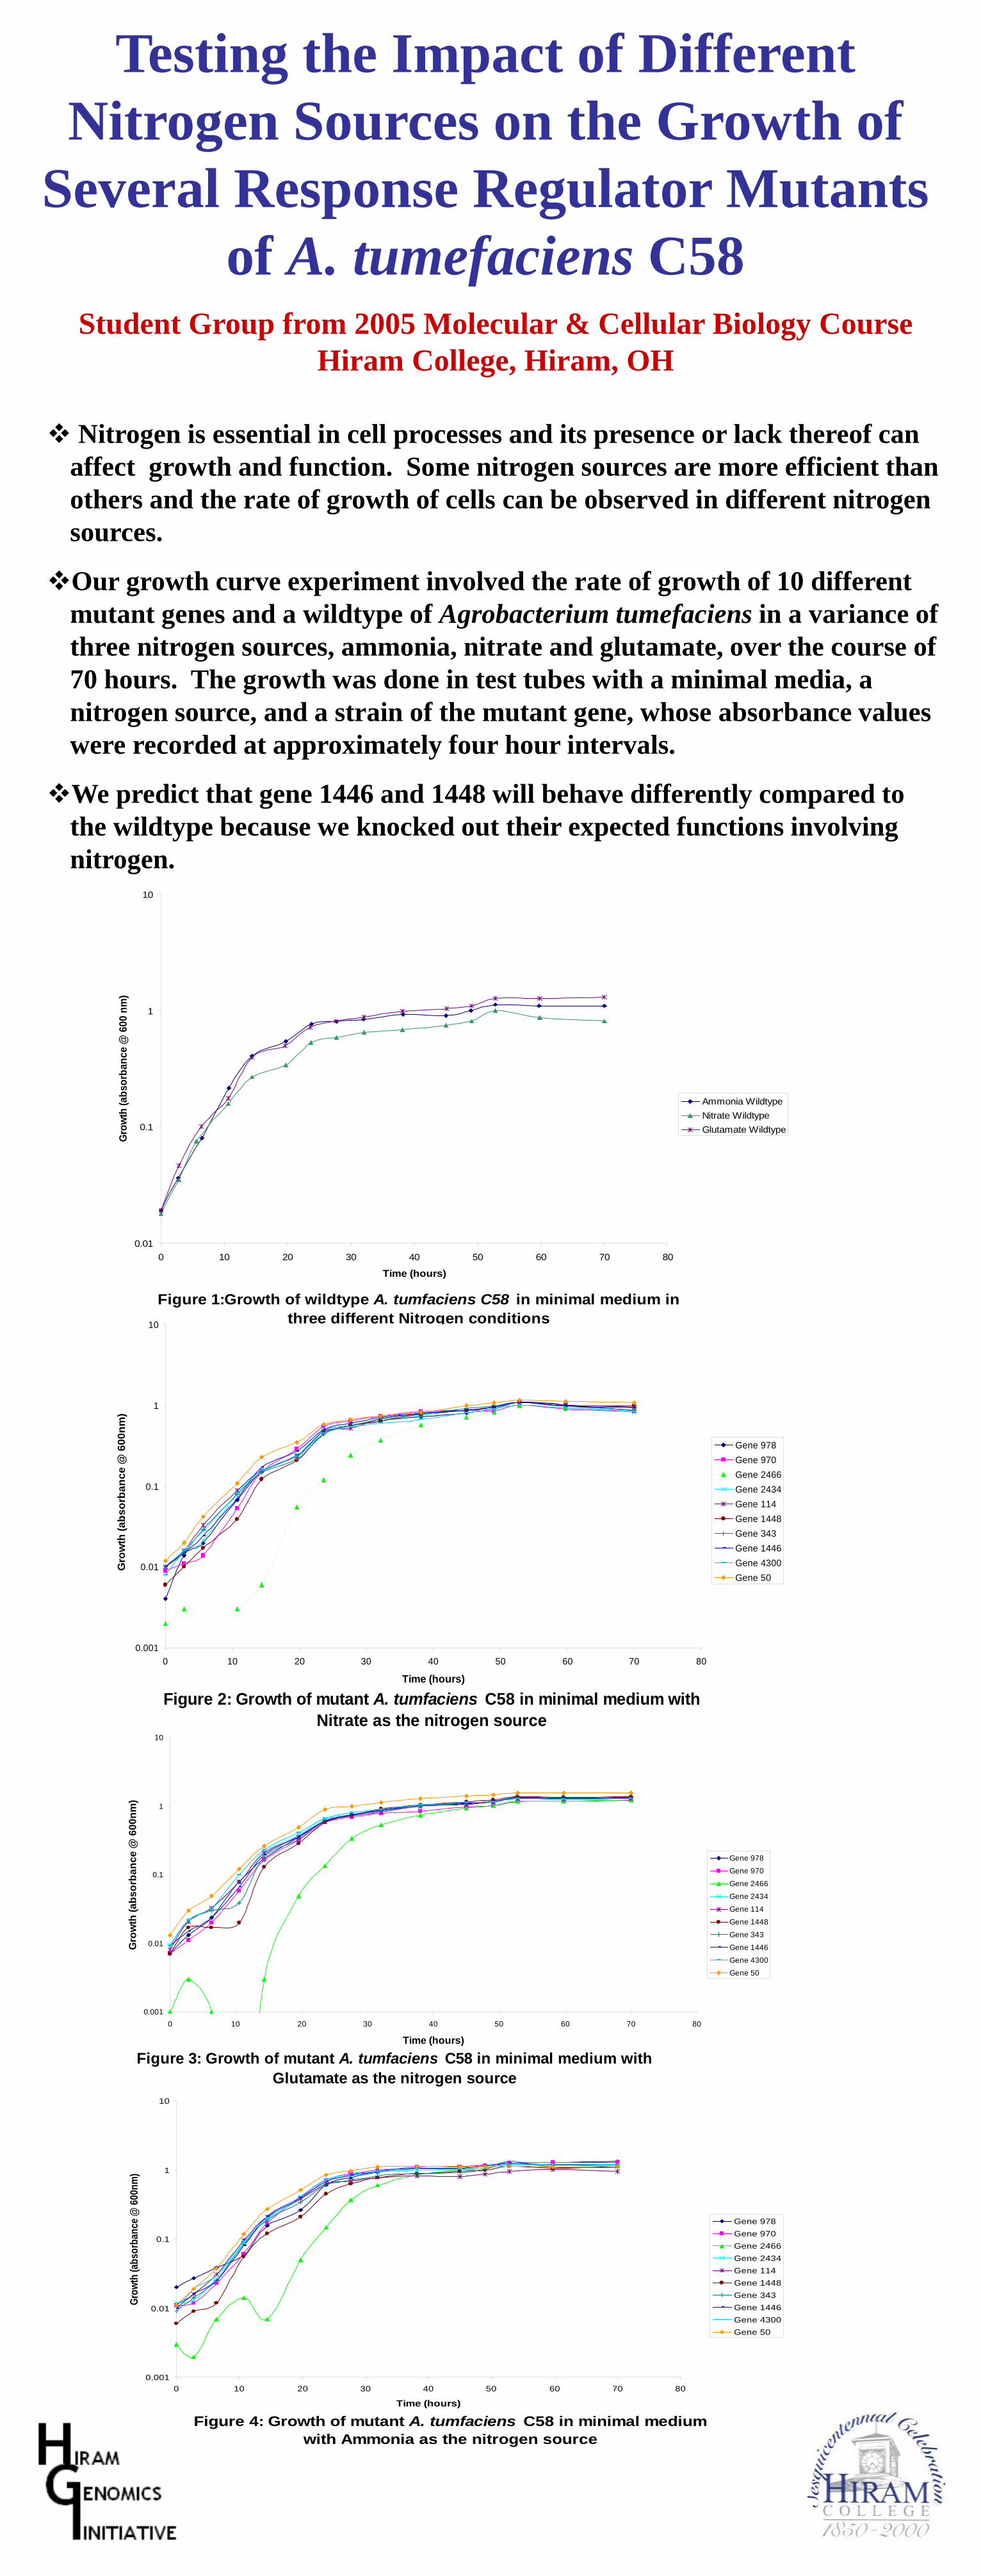
Testing the Impact of Different Nitrogen Sources on the Growth of
Several Response Regulator Mutants of A. tumefaciens C58
Student Group from 2005 Molecular & Cellular Biology Course Hiram College, Hiram, OH
Nitrogen is essential in cell processes and its presence or lack thereof can
affect growth and function. Some nitrogen sources are more efficient than others and the rate of growth of cells can be observed in different nitrogen sources.
Our growth curve experiment involved the rate of growth of 10 different mutant genes and a wildtype of Agrobacterium tumefaciens in a variance of three nitrogen sources, ammonia, nitrate and glutamate, over the course of 70 hours. The growth was done in test tubes with a minimal media, a nitrogen source, and a strain of the mutant gene, whose absorbance values were recorded at approximately four hour intervals.
We predict that gene 1446 and 1448 will behave differently compared to the wildtype because we knocked out their expected functions involving nitrogen.
Figure 1:Growth of wildtype A. tumfaciens C58 in minimal medium in three different Nitrogen conditions
0.01
0.1
1
10
0 10 20 30 40 50 60 70 80
Time (hours)
Gro
wth
(ab
sorb
ance
@ 6
00 n
m)
Ammonia Wildtype
Nitrate Wildtype
Glutamate Wildtype
Figure 2: Growth of mutant A. tumfaciens C58 in minimal medium with Nitrate as the nitrogen source
0.001
0.01
0.1
1
10
0 10 20 30 40 50 60 70 80
Time (hours)
Gro
wth
(a
bs
orb
an
ce
@ 6
00
nm
)
Gene 978
Gene 970
Gene 2466
Gene 2434
Gene 114
Gene 1448
Gene 343
Gene 1446
Gene 4300
Gene 50
Figure 3: Growth of mutant A. tumfaciens C58 in minimal medium with Glutamate as the nitrogen source
0.001
0.01
0.1
1
10
0 10 20 30 40 50 60 70 80
Time (hours)
Gro
wth
(a
bs
orb
an
ce
@ 6
00
nm
)
Gene 978
Gene 970
Gene 2466
Gene 2434
Gene 114
Gene 1448
Gene 343
Gene 1446
Gene 4300
Gene 50
Figure 4: Growth of mutant A. tumfaciens C58 in minimal medium with Ammonia as the nitrogen source
0.001
0.01
0.1
1
10
0 10 20 30 40 50 60 70 80
Time (hours)
Gro
wth
(abs
orba
nce
@ 6
00nm
)
Gene 978
Gene 970
Gene 2466
Gene 2434
Gene 114
Gene 1448
Gene 343
Gene 1446
Gene 4300
Gene 50

All of the mutant genes as well as the wildtype grew exponentially and then leveled off after about 50 hours in all of the nitrogen sources. Gene 2466 was noticeably slower, but still achieved the same growth over time. Also Gene 50 grew at the fastest rate, but higher in glutamate, followed by nitrate, and then ammonia compared to the wildtype which also grew fastest in glutamate, but had a higher rate in ammonia than in nitrate.
From our data, we can conclude that gene behavior did not differ greatly from wild type behavior in any of the three nitrogen sources. We expected that gene 1446 and 1448 would be affected because of their proposed function in nitrogen uptake. However these genes grew in a similar manner as the other mutated genes. Therefore it can be concluded that the type of nitrogen source did not greatly affect growth. Furthermore, a follow up experiment can be done concerning why gene 50 grew faster in nitrate than in ammonia, compared to the opposite behavior of the wildtype. Also, we could explore other nitrogen sources, as well as other genes of Agrobacterium.