

Functional Foods and Health Benefits
36
Health Benefits: Looking at the Next Big Functional Foods
-
Upload
frost-sullivan -
Category
Health & Medicine
-
view
4.916 -
download
0
Transcript of Functional Foods and Health Benefits

Health Benefits: Looking at the Next Big Functional Foods
2
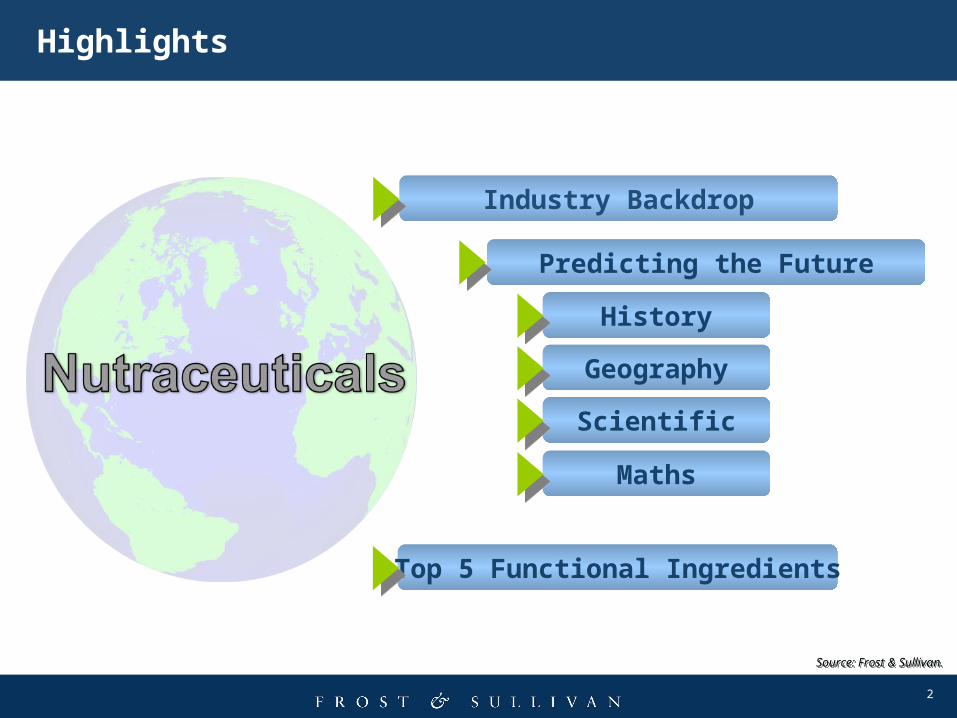
Industry Backdrop
History
Predicting the Future
Top 5 Functional Ingredients
Highlights
Source: Frost & Sullivan.Source: Frost & Sullivan.
Geography
Scientific
Maths

3
Nutraceuticals – Industry Backdrop
4
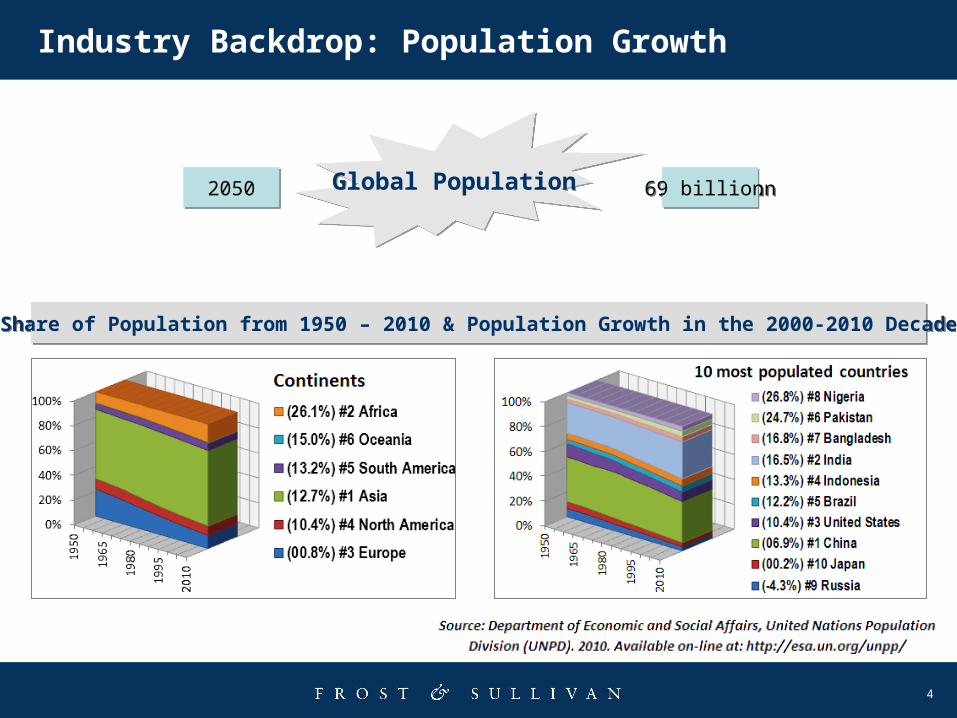
Industry Backdrop: Population Growth
Global PopulationGlobal Population20102010 6.8 billion6.8 billion20502050 9 billion9 billion
Share of Population from 1950 – 2010 & Population Growth in the 2000-2010 DecadeShare of Population from 1950 – 2010 & Population Growth in the 2000-2010 Decade
5
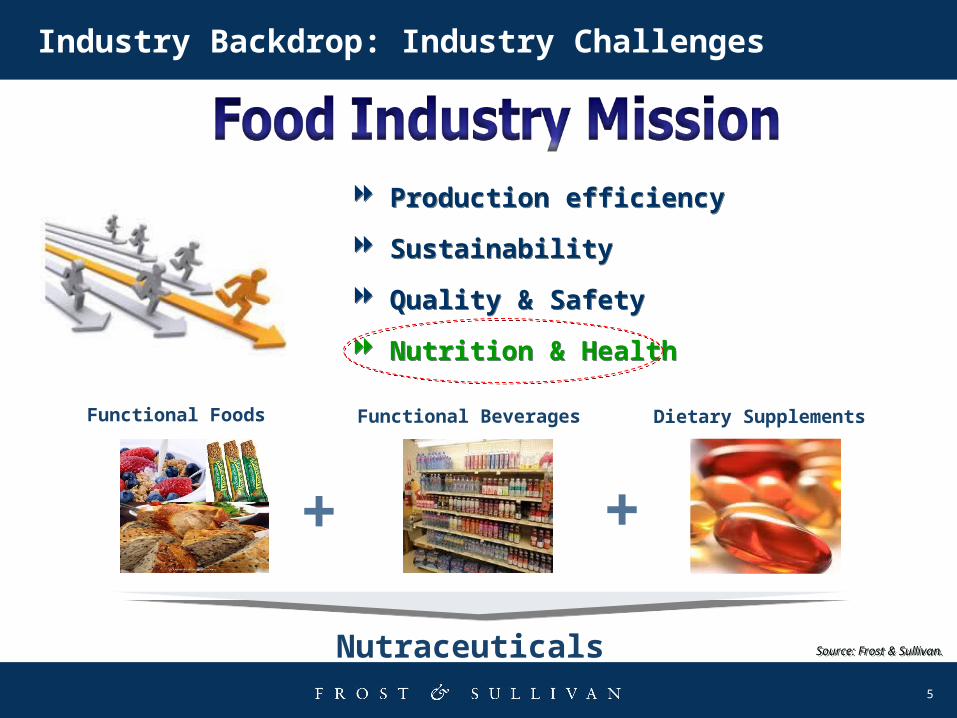
Industry Backdrop: Industry Challenges
Production efficiency
Sustainability
Quality & Safety
Nutrition & Health
Production efficiency
Sustainability
Quality & Safety
Nutrition & Health
Dietary SupplementsFunctional BeveragesFunctional Foods
Nutraceuticals
+ +
Source: Frost & Sullivan.Source: Frost & Sullivan.
6
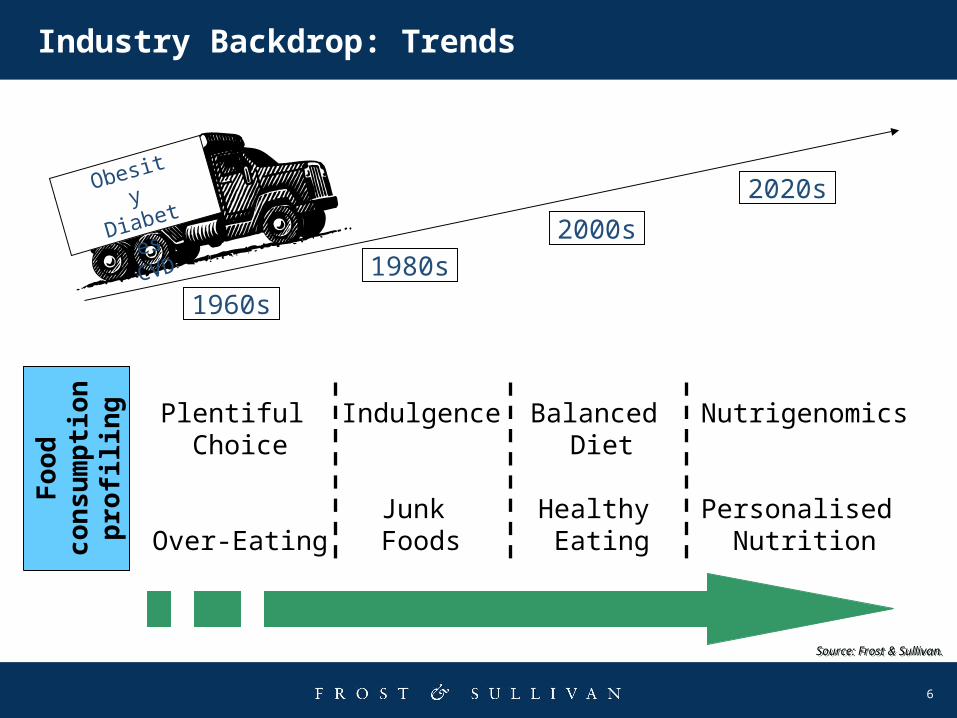
Plentiful Choice
Over-Eating
Food
con
su
mp
tio
n p
rofi
lin
g Indulgence
Junk Foods
Balanced Diet
Healthy Eating
Nutrigenomics
Personalised Nutrition
1960s
2020s
2000s1980s
Obesity
Diabete
sCVD
Industry Backdrop: Trends
Source: Frost & Sullivan.Source: Frost & Sullivan.

7
Nutraceuticals – Predicting the Future
8
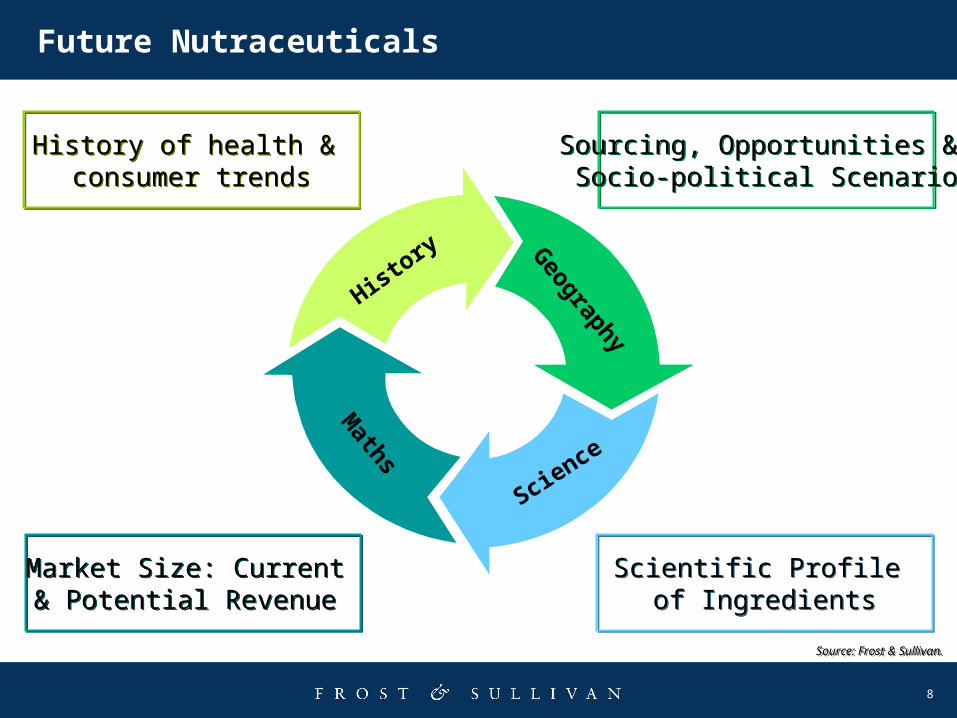
Future Nutraceuticals
History
Geography
Science
Maths
History of health & consumer trends
History of health & consumer trends
Sourcing, Opportunities & Socio-political Scenario
Sourcing, Opportunities & Socio-political Scenario
Market Size: Current & Potential Revenue Market Size: Current & Potential Revenue
Scientific Profile of Ingredients
Scientific Profile of Ingredients
Source: Frost & Sullivan.Source: Frost & Sullivan.
9
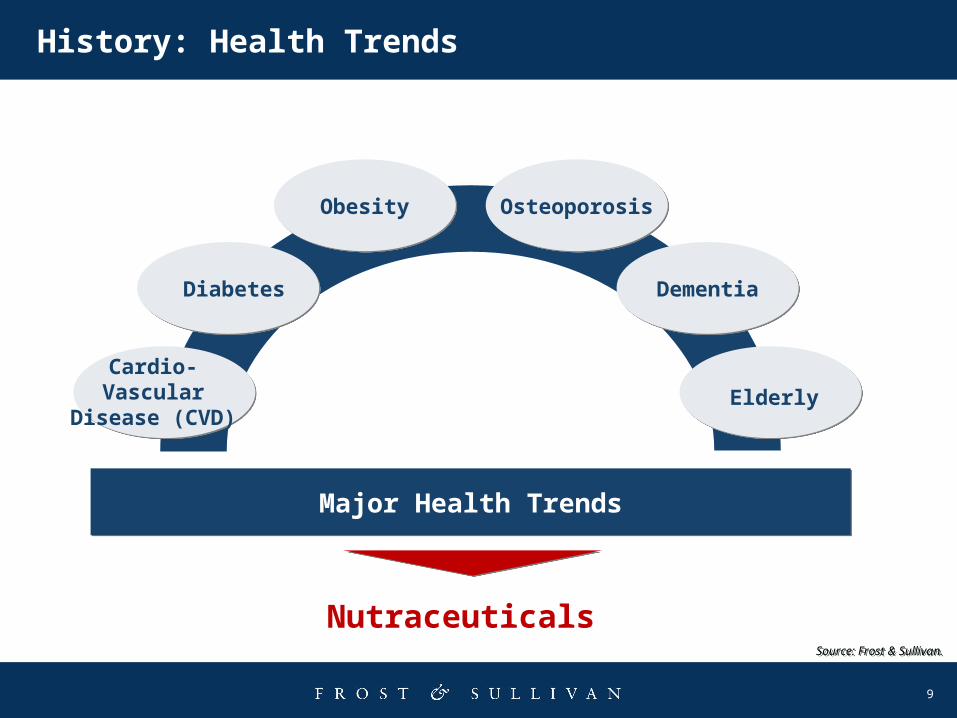
History: Health Trends
Cardio-Vascular
Disease (CVD)
Diabetes
Obesity
Elderly
Dementia
Osteoporosis
Major Health TrendsMajor Health Trends
NutraceuticalsSource: Frost & Sullivan.Source: Frost & Sullivan.
10
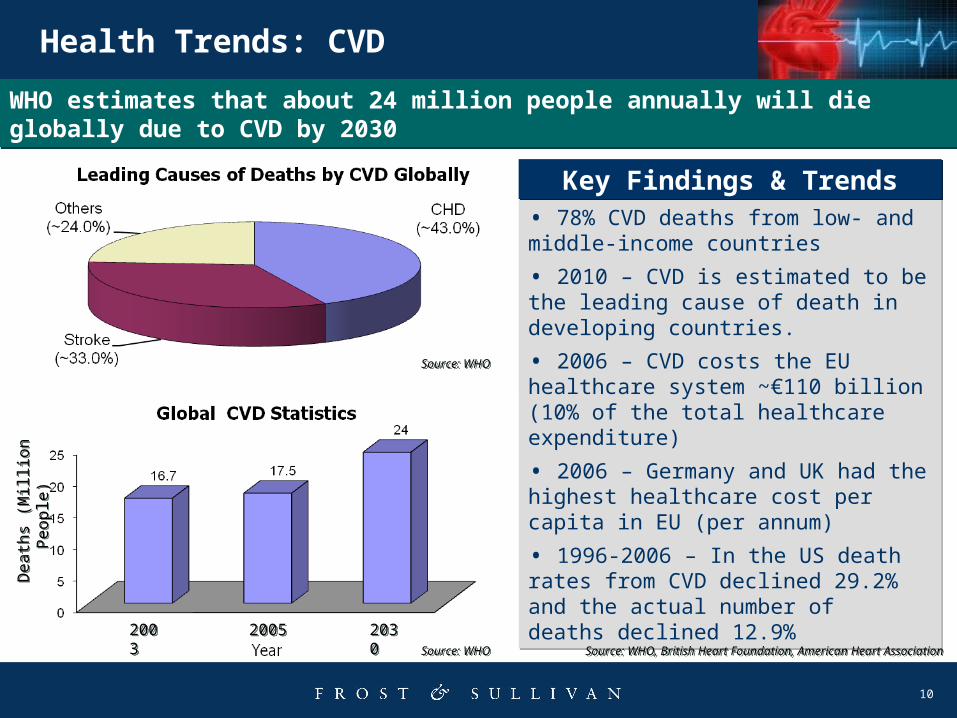
Health Trends: CVD
WHO estimates that about 24 million people annually will die globally due to CVD by 2030WHO estimates that about 24 million people annually will die globally due to CVD by 2030
• 78% CVD deaths from low- and middle-income countries
• 2010 – CVD is estimated to be the leading cause of death in developing countries.
• 2006 – CVD costs the EU healthcare system ~€110 billion (10% of the total healthcare expenditure)
• 2006 – Germany and UK had the highest healthcare cost per capita in EU (per annum)
• 1996-2006 – In the US death rates from CVD declined 29.2% and the actual number of deaths declined 12.9%
Key Findings & TrendsKey Findings & Trends
Source: WHOSource: WHO
Source: WHO, British Heart Foundation, American Heart AssociationSource: WHO, British Heart Foundation, American Heart AssociationSource: WHOSource: WHO
Death
s (M
illio
n P
eople
) D
eath
s (M
illio
n P
eople
)
20032003
20052005 20302030
11
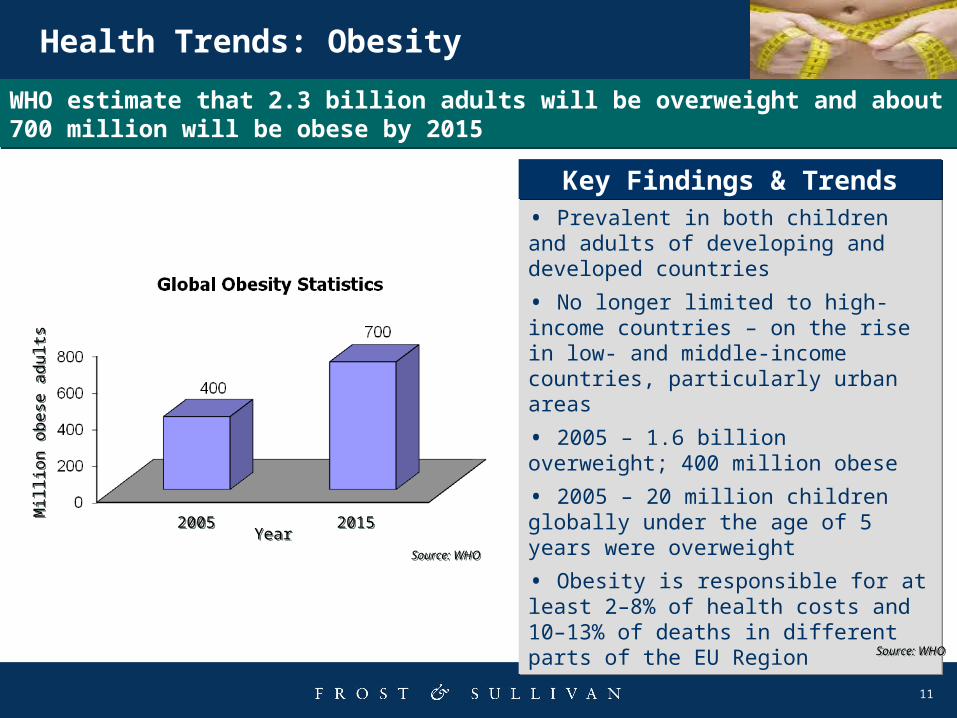
Health Trends: Obesity
• Prevalent in both children and adults of developing and developed countries
• No longer limited to high-income countries – on the rise in low- and middle-income countries, particularly urban areas
• 2005 – 1.6 billion overweight; 400 million obese
• 2005 – 20 million children globally under the age of 5 years were overweight
• Obesity is responsible for at least 2–8% of health costs and 10–13% of deaths in different parts of the EU Region
WHO estimate that 2.3 billion adults will be overweight and about 700 million will be obese by 2015WHO estimate that 2.3 billion adults will be overweight and about 700 million will be obese by 2015
Key Findings & TrendsKey Findings & Trends
Mill
ion
ob
ese
ad
ults
Mill
ion
ob
ese
ad
ults
20052005 20152015YearYear
Source: WHOSource: WHO
Source: WHOSource: WHO
12
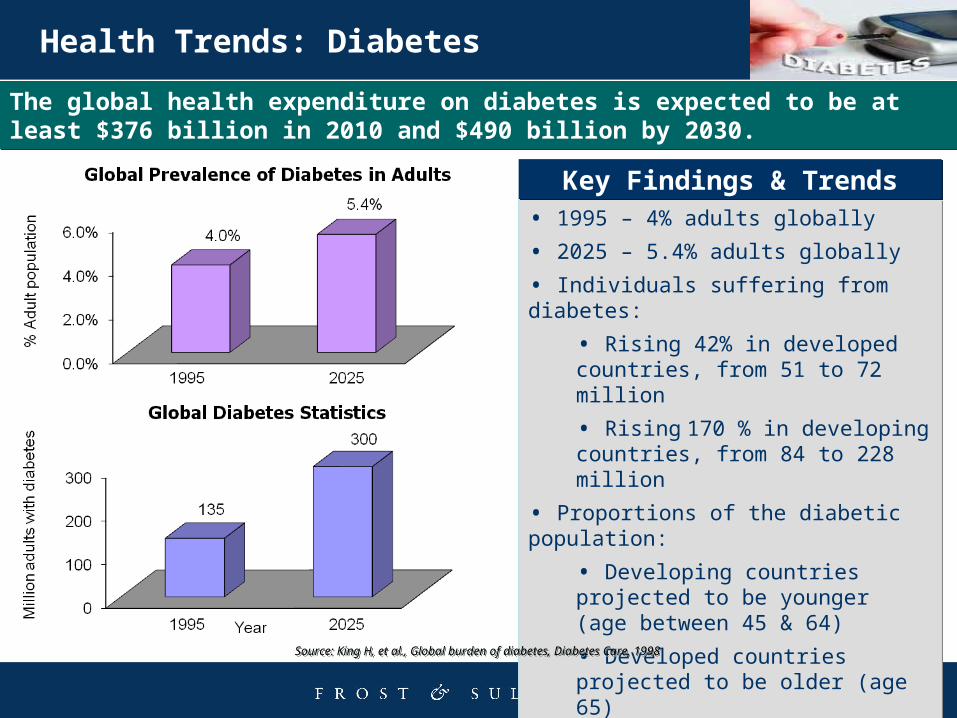
Health Trends: Diabetes
• 1995 – 4% adults globally
• 2025 – 5.4% adults globally
• Individuals suffering from diabetes:
• Rising 42% in developed countries, from 51 to 72 million
• Rising 170 % in developing countries, from 84 to 228 million
• Proportions of the diabetic population:
• Developing countries projected to be younger (age between 45 & 64)
• Developed countries projected to be older (age 65)
The global health expenditure on diabetes is expected to be at least $376 billion in 2010 and $490 billion by 2030. The global health expenditure on diabetes is expected to be at least $376 billion in 2010 and $490 billion by 2030.
Key Findings & TrendsKey Findings & Trends
Source: King H, et al., Global burden of diabetes, Diabetes Care. 1998Source: King H, et al., Global burden of diabetes, Diabetes Care. 1998
13
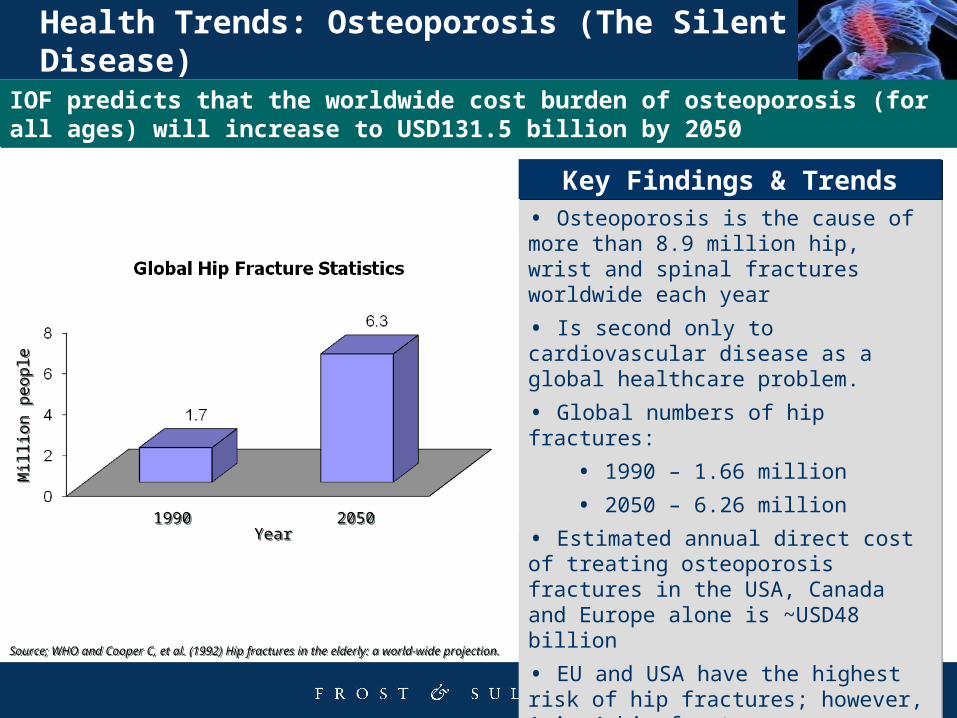
• Osteoporosis is the cause of more than 8.9 million hip, wrist and spinal fractures worldwide each year
• Is second only to cardiovascular disease as a global healthcare problem.
• Global numbers of hip fractures:
• 1990 – 1.66 million
• 2050 – 6.26 million
• Estimated annual direct cost of treating osteoporosis fractures in the USA, Canada and Europe alone is ~USD48 billion
• EU and USA have the highest risk of hip fractures; however, 1 in 4 hip fractures now occur in Asia and Latin America. This is set to increase to 1 in 2 by 2050
Health Trends: Osteoporosis (The Silent Disease)
IOF predicts that the worldwide cost burden of osteoporosis (for all ages) will increase to USD131.5 billion by 2050IOF predicts that the worldwide cost burden of osteoporosis (for all ages) will increase to USD131.5 billion by 2050
Key Findings & TrendsKey Findings & Trends
Source; WHO and Cooper C, et al. (1992) Hip fractures in the elderly: a world-wide projection.Source; WHO and Cooper C, et al. (1992) Hip fractures in the elderly: a world-wide projection.
Mill
ion
pe
op
leM
illio
n p
eo
ple
19901990 20502050YearYear
14
Health Trends: Dementia
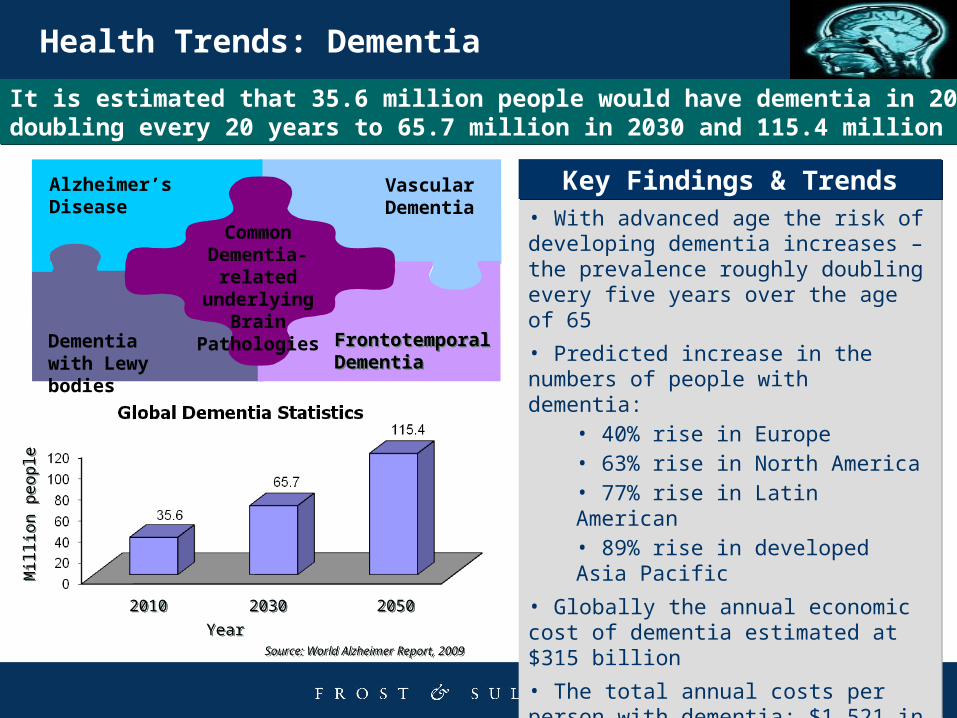
• With advanced age the risk of developing dementia increases – the prevalence roughly doubling every five years over the age of 65
• Predicted increase in the numbers of people with dementia:
• 40% rise in Europe• 63% rise in North America• 77% rise in Latin American • 89% rise in developed Asia Pacific
• Globally the annual economic cost of dementia estimated at $315 billion
• The total annual costs per person with dementia; $1,521 in a low income countries and up to $17,964 in high income countries.
Alzheimer’s Disease
Dementia with Lewy bodies
Vascular Dementia
Frontotemporal DementiaFrontotemporal Dementia
CommonDementia-related underlying Brain
Pathologies
It is estimated that 35.6 million people would have dementia in 2010, nearly doubling every 20 years to 65.7 million in 2030 and 115.4 million in 2050. It is estimated that 35.6 million people would have dementia in 2010, nearly doubling every 20 years to 65.7 million in 2030 and 115.4 million in 2050.
Key Findings & TrendsKey Findings & Trends
Source: World Alzheimer Report, 2009Source: World Alzheimer Report, 2009
Mill
ion
pe
op
leM
illio
n p
eo
ple
20102010 20502050
YearYear
20302030
15
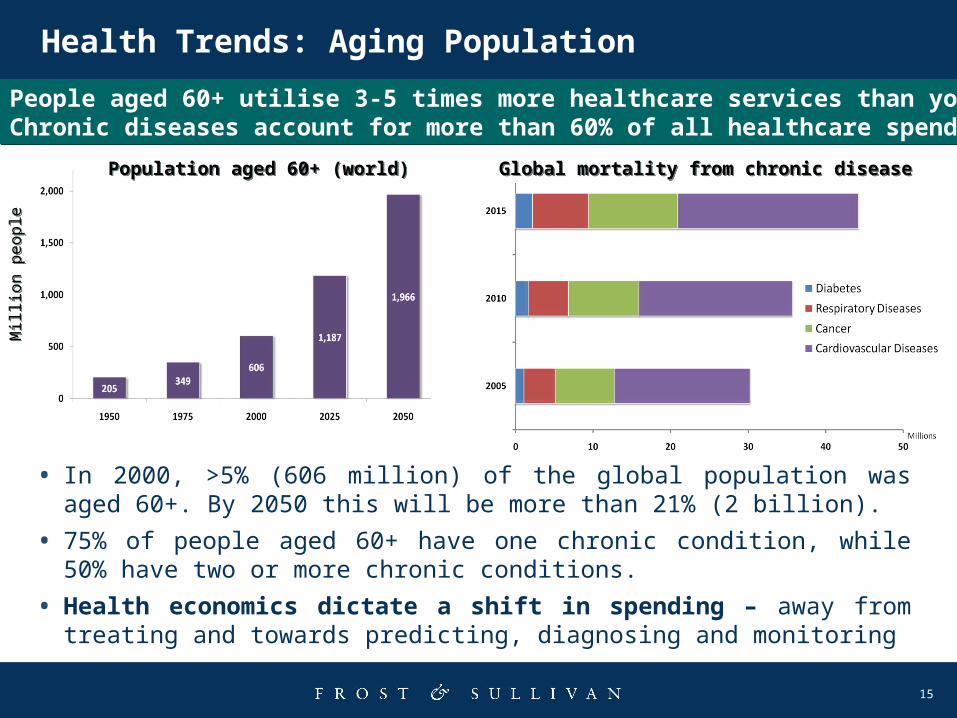
• In 2000, >5% (606 million) of the global population was aged 60+. By 2050 this will be more than 21% (2 billion).
• 75% of people aged 60+ have one chronic condition, while 50% have two or more chronic conditions.
• Health economics dictate a shift in spending – away from treating and towards predicting, diagnosing and monitoring
Health Trends: Aging Population
People aged 60+ utilise 3-5 times more healthcare services than younger peopleChronic diseases account for more than 60% of all healthcare spendingPeople aged 60+ utilise 3-5 times more healthcare services than younger peopleChronic diseases account for more than 60% of all healthcare spending
Mill
ion
pe
op
leM
illio
n p
eo
ple
Population aged 60+ (world)Population aged 60+ (world) Global mortality from chronic diseaseGlobal mortality from chronic disease
16
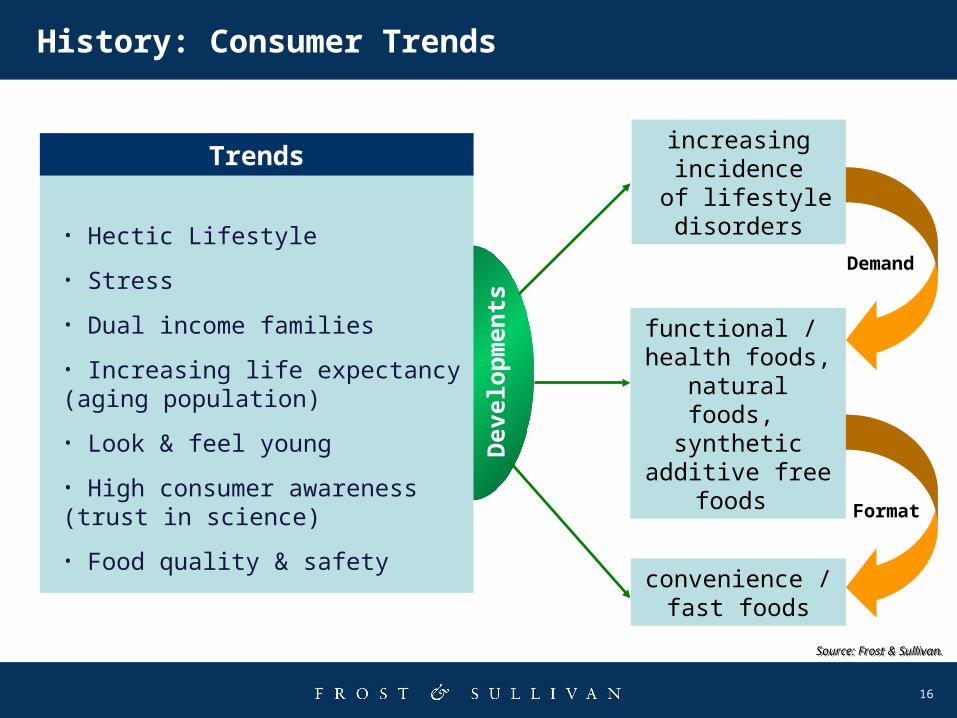
History: Consumer Trends
Source: Frost & Sullivan.Source: Frost & Sullivan.
• Hectic Lifestyle
• Stress
• Dual income families
• Increasing life expectancy (aging population)
• Look & feel young
• High consumer awareness (trust in science)
• Food quality & safetyconvenience /
fast foods
increasing incidence of lifestyle disorders
functional / health foods,
natural foods, synthetic additive
free foods Dev
elo
pm
ents
Trends
Demand
Format
17
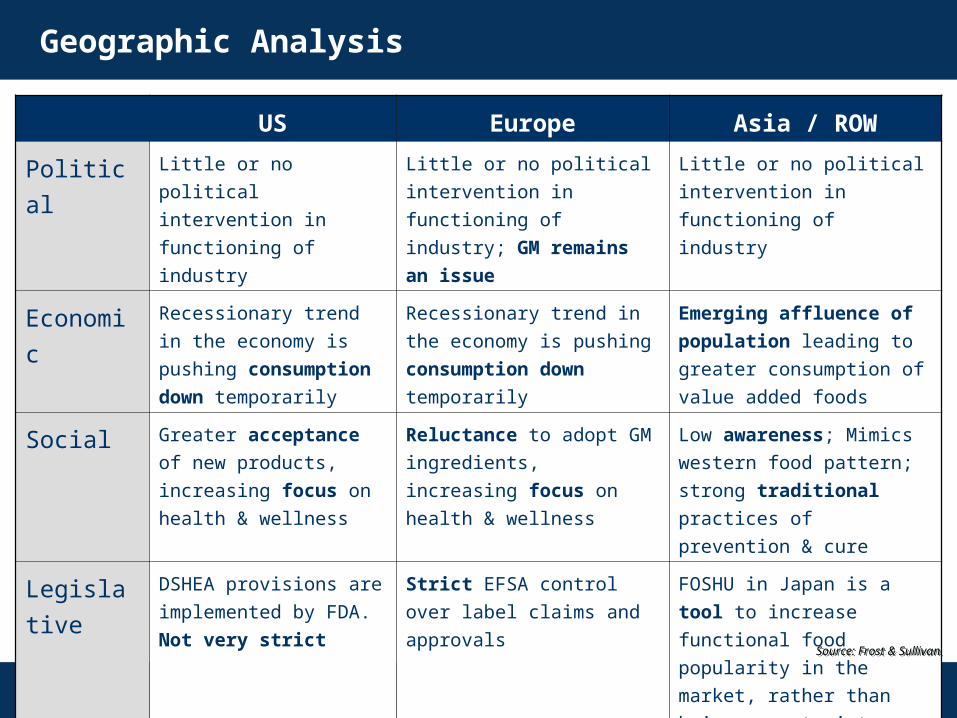
Geographic Analysis
US Europe Asia / ROW
Political Little or no political
intervention in
functioning of industry
Little or no political
intervention in functioning
of industry; GM remains
an issue
Little or no political
intervention in functioning
of industry
Economi
c
Recessionary trend in
the economy is pushing
consumption down
temporarily
Recessionary trend in the
economy is pushing
consumption down
temporarily
Emerging affluence of
population leading to
greater consumption of
value added foods
Social Greater acceptance of
new products,
increasing focus on
health & wellness
Reluctance to adopt GM
ingredients, increasing
focus on health &
wellness
Low awareness; Mimics
western food pattern;
strong traditional
practices of prevention &
cure
Legislativ
e
DSHEA provisions are
implemented by FDA.
Not very strict
Strict EFSA control over
label claims and approvals
FOSHU in Japan is a tool
to increase functional food
popularity in the market,
rather than being a
restraint.Source: Frost & Sullivan.Source: Frost & Sullivan.
18
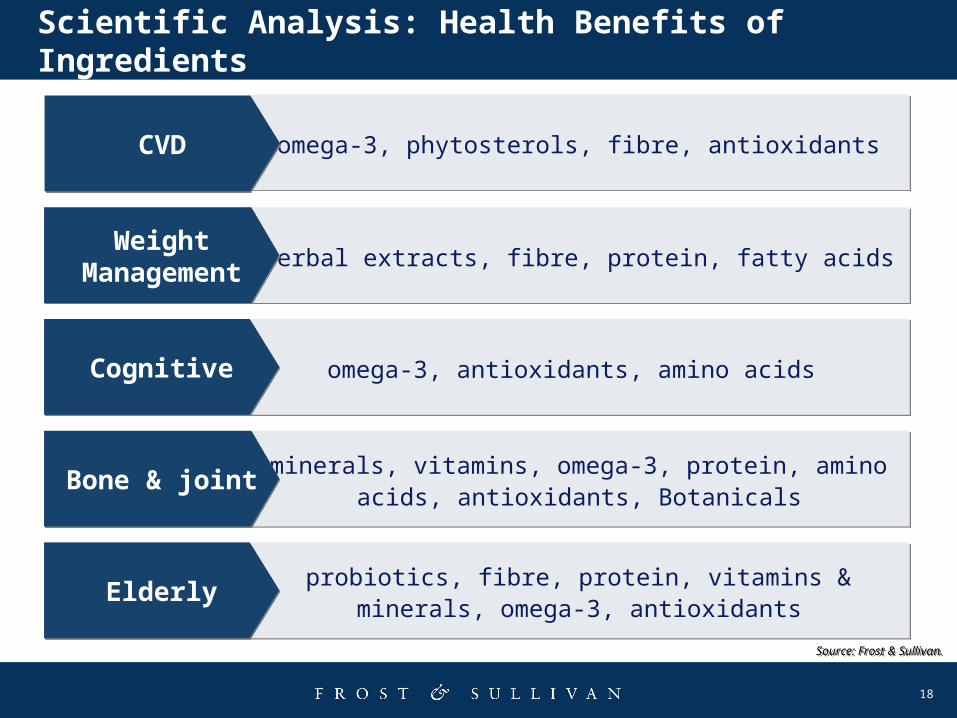
omega-3, phytosterols, fibre, antioxidantsomega-3, phytosterols, fibre, antioxidants
herbal extracts, fibre, protein, fatty acidsherbal extracts, fibre, protein, fatty acids
omega-3, antioxidants, amino acids omega-3, antioxidants, amino acids
CVDCVD
Weight Management
Weight Management
CognitiveCognitive
Scientific Analysis: Health Benefits of Ingredients
probiotics, fibre, protein, vitamins & minerals, omega-3, antioxidants
probiotics, fibre, protein, vitamins & minerals, omega-3, antioxidants
ElderlyElderly
minerals, vitamins, omega-3, protein, amino acids, antioxidants, Botanicals
minerals, vitamins, omega-3, protein, amino acids, antioxidants, Botanicals
Bone & jointBone & joint
Source: Frost & Sullivan.Source: Frost & Sullivan.
19
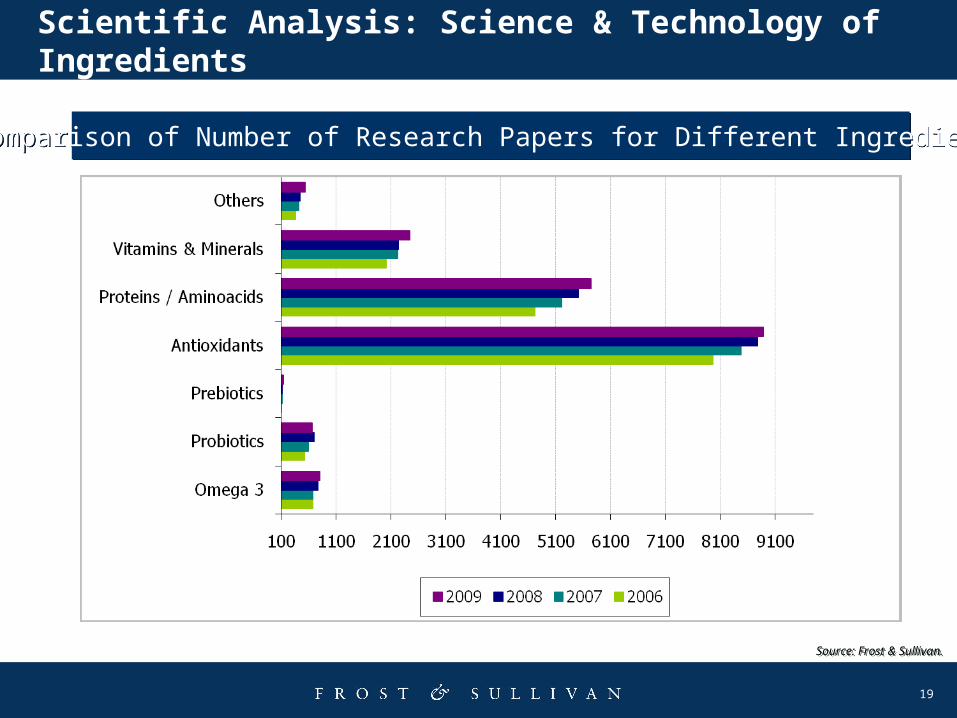
Scientific Analysis: Science & Technology of Ingredients
Comparison of Number of Research Papers for Different IngredientsComparison of Number of Research Papers for Different Ingredients
Source: Frost & Sullivan.Source: Frost & Sullivan.

20
Scientific Analysis: Ingredient Profile
Ingredients Omega 3Probiotic
sFibre /
PrebioticsAntioxidant
s
Proteins / Amino acids
Vitamins &
MineralsBotanical
s
Ranking on a Scale of 1- 10
6.9 6.4 5.6 6.8 7.0 7.1 6.4
Future Nutraceutical Ingredients RankingFuture Nutraceutical Ingredients Ranking
1. Research Profile 6. New Product Introduction
2. Health Claim - Regulatory 7. Consumer Marketing
3. Health Positioning 8. Current Market Size
4. Application Profile 9. Sustainability
5. Consumer Awareness 10. Market Growth rate
Top 10 Parameters Used to Assess Future Nutraceutical Ingredients Top 10 Parameters Used to Assess Future Nutraceutical Ingredients
Source: Frost & Sullivan.Source: Frost & Sullivan.
21
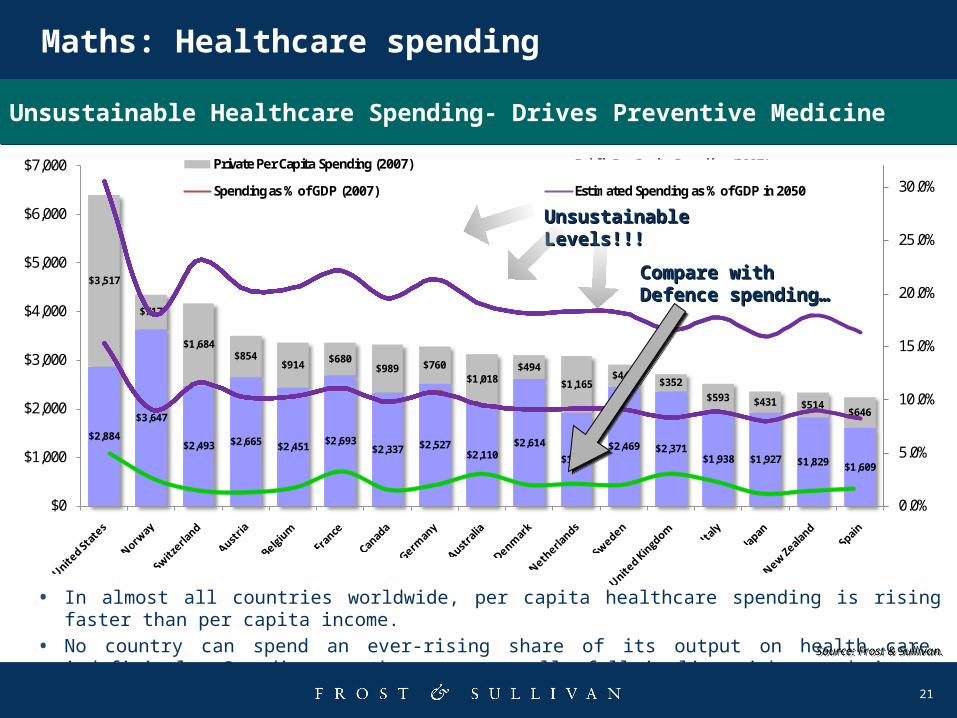
• In almost all countries worldwide, per capita healthcare spending is rising faster than per capita income.
• No country can spend an ever-rising share of its output on health care, indefinitely. Spending growth must eventually fall in line with growth in per capita income.
$2,884
$3,647
$2,493 $2,665 $2,451 $2,693$2,337 $2,527
$2,110$2,614
$1,927$2,469 $2,371
$1,938 $1,927 $1,829 $1,609
$3,517
$717
$1,684$854
$914 $680$989 $760
$1,018$494
$1,165$449
$352$593 $431 $514
$646
0.0%
5.0%
10.0%
15.0%
20.0%
25.0%
30.0%
$0
$1,000
$2,000
$3,000
$4,000
$5,000
$6,000
$7,000
$2,884
$3,647
$2,493 $2,665 $2,451 $2,693$2,337 $2,527
$2,110$2,614
$1,927$2,469 $2,371
$1,938 $1,927 $1,829 $1,609
$3,517
$717
$1,684$854
$914 $680$989 $760
$1,018$494
$1,165$449
$352$593 $431 $514
$646
0.0%
5.0%
10.0%
15.0%
20.0%
25.0%
30.0%
$0
$1,000
$2,000
$3,000
$4,000
$5,000
$6,000
$7,000
Private Per Capita Spending (2007) Public Per Capita Spending (2007)
Spending as % of GDP (2007) Estimated Spending as % of GDP in 2050
$1,009 $1,009 $1,009 $1,009 $1,009 $1,009 $1,009 $1,009 $1,009 $1,009 $1,009 $1,009 $1,009 $1,009 $1,009 $1,009 $1,009
0.0%
5.0%
10.0%
15.0%
20.0%
25.0%
30.0%
$0
$1,000
$2,000
$3,000
$4,000
$5,000
$6,000
$7,000
$1,009 $1,009 $1,009 $1,009 $1,009 $1,009 $1,009 $1,009 $1,009 $1,009 $1,009 $1,009 $1,009 $1,009 $1,009 $1,009 $1,009
0.0%
5.0%
10.0%
15.0%
20.0%
25.0%
30.0%
$0
$1,000
$2,000
$3,000
$4,000
$5,000
$6,000
$7,000
Unsustainable Unsustainable Levels!!!Levels!!!
Compare with Compare with Defence spending…Defence spending…
Maths: Healthcare spending
Unsustainable Healthcare Spending- Drives Preventive Medicine Unsustainable Healthcare Spending- Drives Preventive Medicine
Source: Frost & Sullivan.Source: Frost & Sullivan.
22
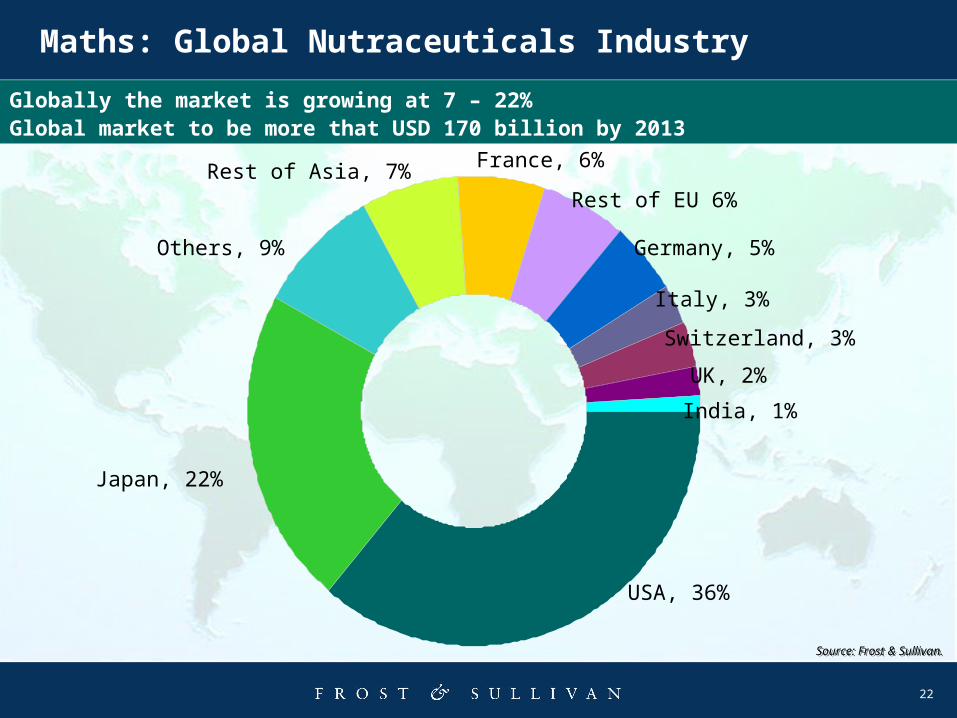
Maths: Global Nutraceuticals Industry
USA, 36%
Japan, 22%
Others, 9%
Rest of Asia, 7% France, 6%
Italy, 3%
Rest of EU 6%
Germany, 5%
Switzerland, 3%
UK, 2%
India, 1%
Globally the market is growing at 7 – 22% Global market to be more that USD 170 billion by 2013
Source: Frost & Sullivan.Source: Frost & Sullivan.

23
Nutraceuticals – Top 5 Functional Ingredients
24
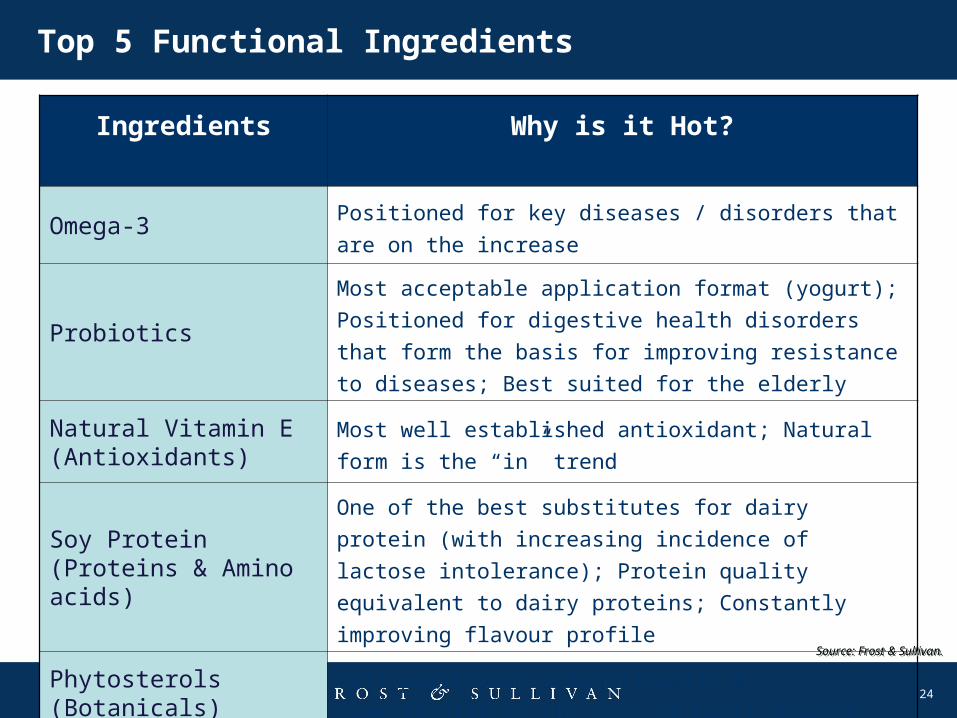
Top 5 Functional Ingredients
Ingredients Why is it Hot?
Omega-3 Positioned for key diseases / disorders that are on
the increase
Probiotics
Most acceptable application format (yogurt);
Positioned for digestive health disorders that form
the basis for improving resistance to diseases; Best
suited for the elderly
Natural Vitamin E (Antioxidants)
Most well established antioxidant; Natural form is the
“in” trend
Soy Protein (Proteins & Amino acids)
One of the best substitutes for dairy protein (with
increasing incidence of lactose intolerance); Protein
quality equivalent to dairy proteins; Constantly
improving flavour profile
Phytosterols (Botanicals)
Well positioned scientifically & commercially in the
area of heart diseaseSource: Frost & Sullivan.Source: Frost & Sullivan.

25
Top 5 Functional Ingredients: Omega-3 Ingredients
• Well-positioned for cognitive & heart health
• New research areas include immune & bone & joint health
• Most important challenge is the flavour profile that decelerates penetration into
many food applications
•Marine Oil Key Players: Pronova BioPharma ASA, EPAX AS, ONC; Algal Oil Key Player:
Martek & Lonza
• Sources under development include: flax, soy
Revenue: $323.0 Million(CAGR – 10.2%)
Volume Market Share by Application, (2009)
Volume Market Share by Application, (2009)
Source: Frost & Sullivan.Source: Frost & Sullivan.
26
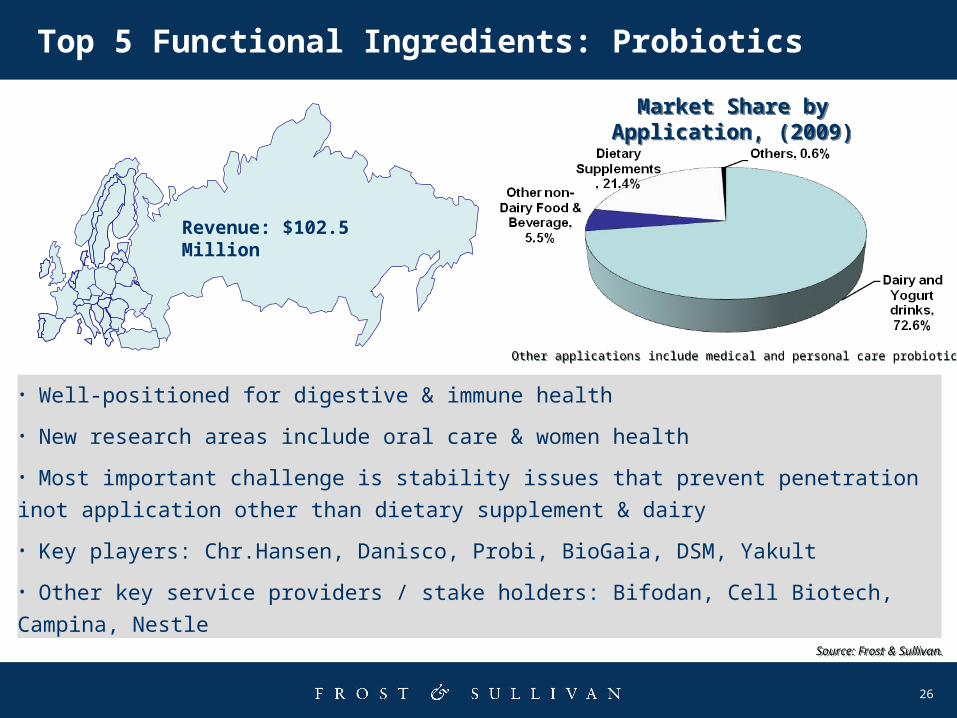
Top 5 Functional Ingredients: Probiotics
• Well-positioned for digestive & immune health
• New research areas include oral care & women health
• Most important challenge is stability issues that prevent penetration inot
application other than dietary supplement & dairy
• Key players: Chr.Hansen, Danisco, Probi, BioGaia, DSM, Yakult
• Other key service providers / stake holders: Bifodan, Cell Biotech, Campina,
Nestle
Other applications include medical and personal care probioticsOther applications include medical and personal care probiotics
Market Share by Application, (2009)Market Share by
Application, (2009)
Source: Frost & Sullivan.Source: Frost & Sullivan.
Revenue: $102.5 Million
27
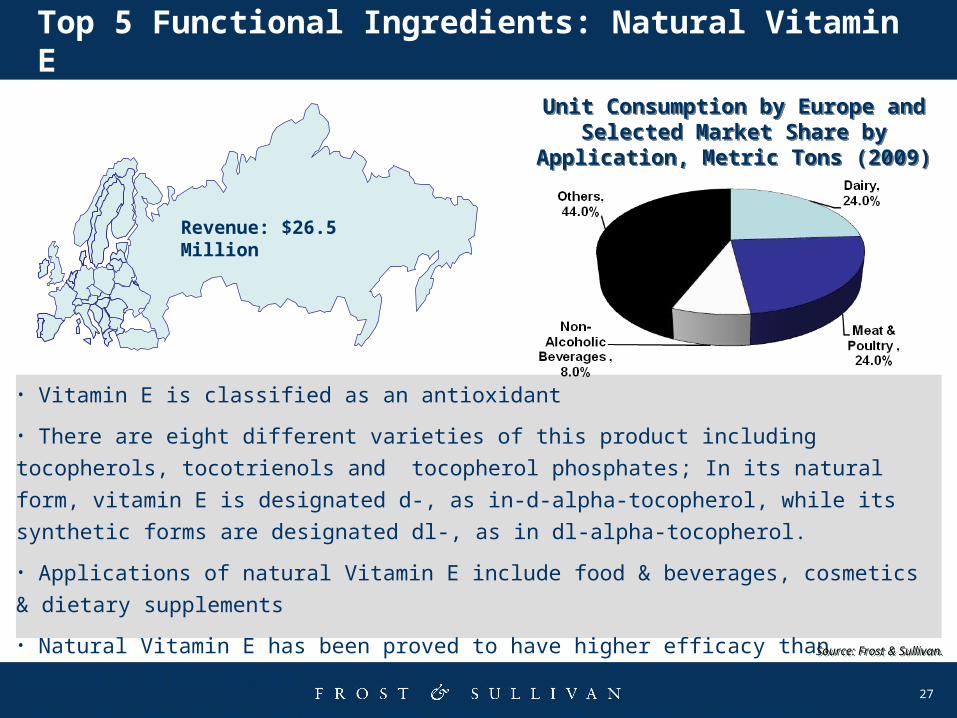
Top 5 Functional Ingredients: Natural Vitamin E
• Vitamin E is classified as an antioxidant
• There are eight different varieties of this product including tocopherols, tocotrienols
and tocopherol phosphates; In its natural form, vitamin E is designated d-, as in-d-
alpha-tocopherol, while its synthetic forms are designated dl-, as in dl-alpha-
tocopherol.
• Applications of natural Vitamin E include food & beverages, cosmetics & dietary
supplements
• Natural Vitamin E has been proved to have higher efficacy than synthetic
alternatives.
• Key players/Stake Holders: DSM, Cognis, ADM, Shenjian Medical
Unit Consumption by Europe and Selected Market Share by
Application, Metric Tons (2009)
Unit Consumption by Europe and Selected Market Share by
Application, Metric Tons (2009)
Source: Frost & Sullivan.Source: Frost & Sullivan.
Revenue: $26.5 Million
28
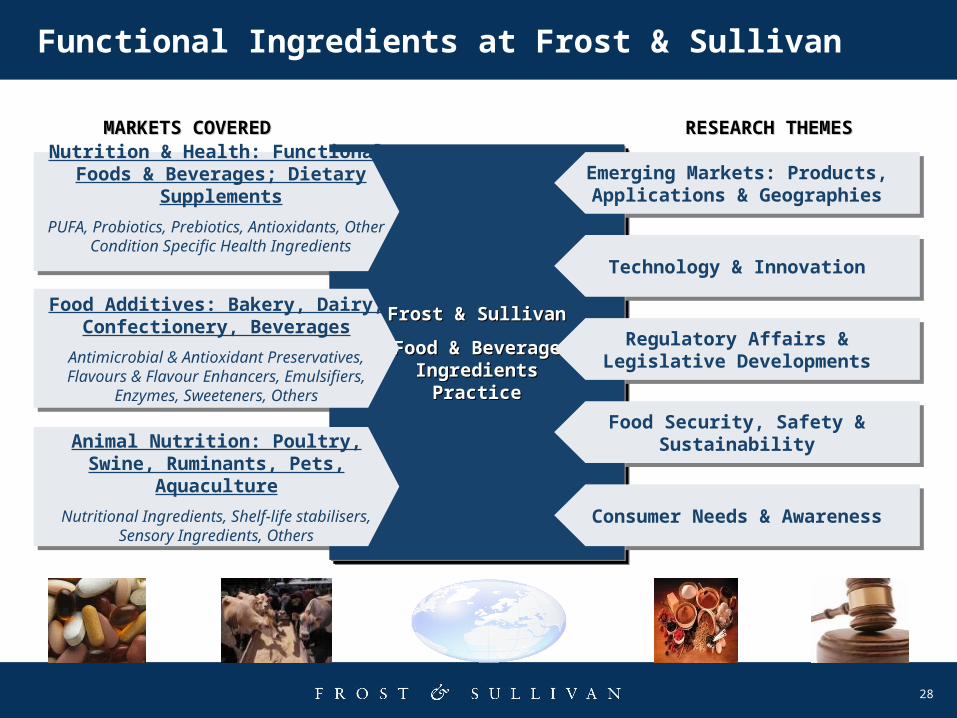
Functional Ingredients at Frost & Sullivan
Frost & SullivanFrost & Sullivan
Food & BeverageFood & BeverageIngredientsIngredients
PracticePractice
Frost & SullivanFrost & Sullivan
Food & BeverageFood & BeverageIngredientsIngredients
PracticePractice
Nutrition & Health: Functional Foods & Beverages; Dietary Supplements
PUFA, Probiotics, Prebiotics, Antioxidants, Other Condition Specific Health Ingredients
Food Additives: Bakery, Dairy, Confectionery, Beverages
Antimicrobial & Antioxidant Preservatives, Flavours & Flavour Enhancers, Emulsifiers,
Enzymes, Sweeteners, Others
Animal Nutrition: Poultry, Swine, Ruminants, Pets, Aquaculture
Nutritional Ingredients, Shelf-life stabilisers, Sensory Ingredients, Others Consumer Needs & Awareness
Technology & Innovation
Emerging Markets: Products, Applications & Geographies
MARKETS COVEREDMARKETS COVERED RESEARCH THEMESRESEARCH THEMES
Regulatory Affairs & Legislative Developments
Food Security, Safety & Sustainability
29
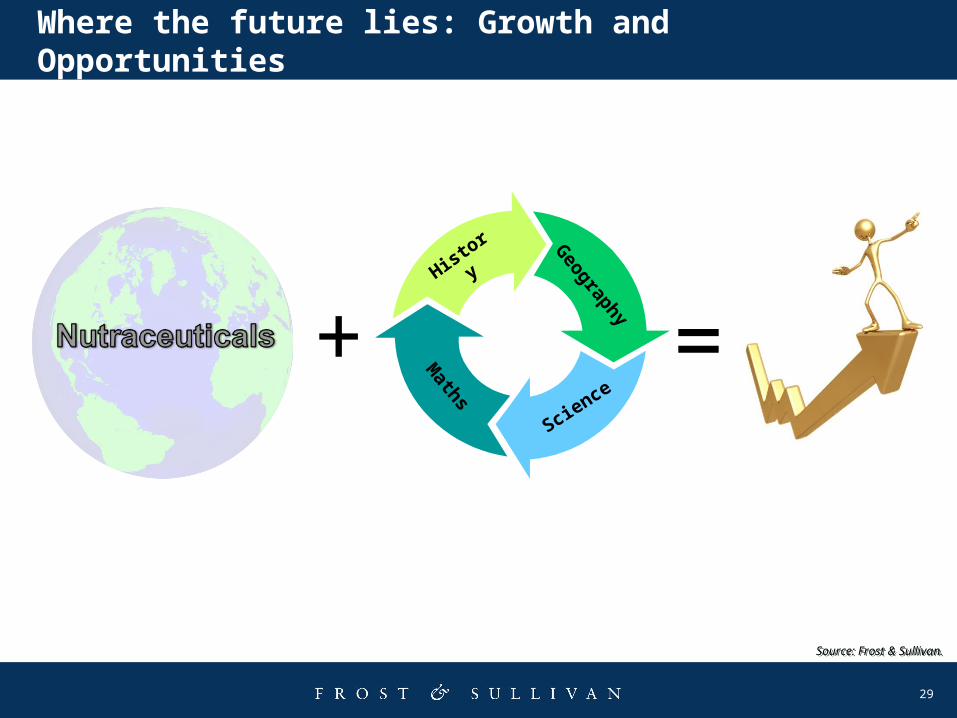
Where the future lies: Growth and Opportunities
Histor
y
Geograph
y
Science
Maths
+ =
Source: Frost & Sullivan.Source: Frost & Sullivan.

30
Frost & Sullivan - Information
31
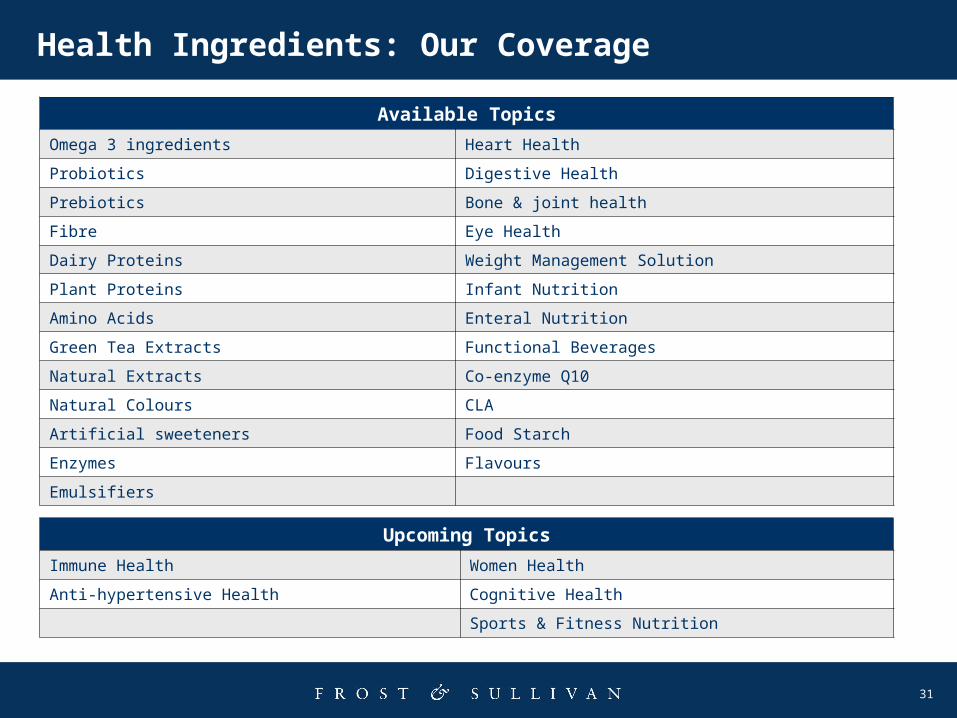
Health Ingredients: Our Coverage
Available Topics
Omega 3 ingredients Heart Health
Probiotics Digestive Health
Prebiotics Bone & joint health
Fibre Eye Health
Dairy Proteins Weight Management Solution
Plant Proteins Infant Nutrition
Amino Acids Enteral Nutrition
Green Tea Extracts Functional Beverages
Natural Extracts Co-enzyme Q10
Natural Colours CLA
Artificial sweeteners Food Starch
Enzymes Flavours
Emulsifiers
Upcoming Topics
Immune Health Women Health
Anti-hypertensive Health Cognitive Health
Sports & Fitness Nutrition
32
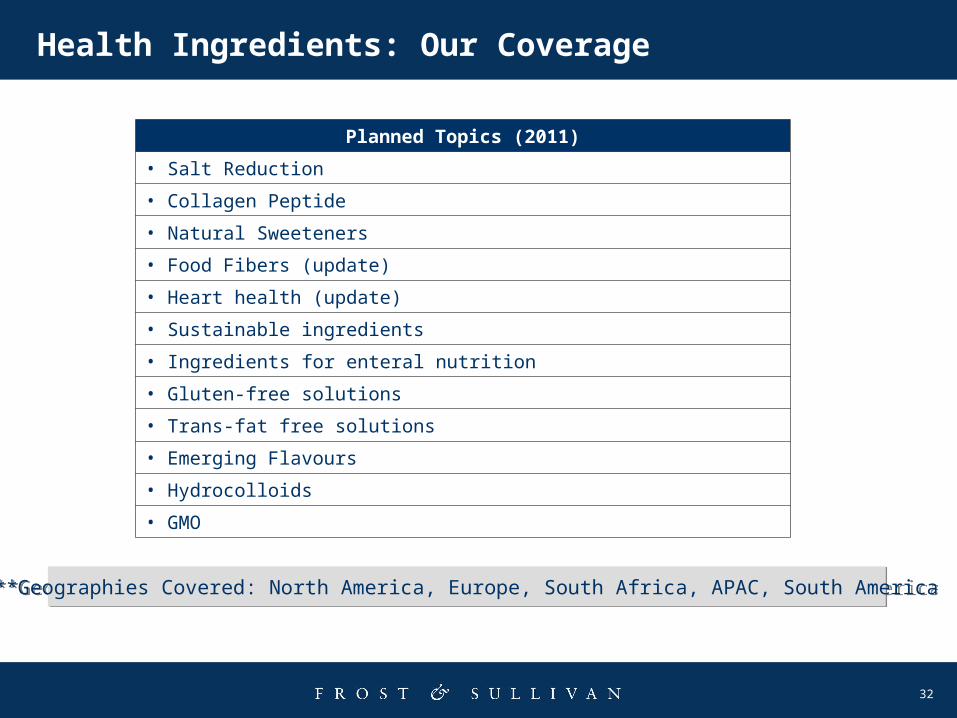
Health Ingredients: Our Coverage
Planned Topics (2011)
• Salt Reduction
• Collagen Peptide
• Natural Sweeteners
• Food Fibers (update)
• Heart health (update)
• Sustainable ingredients
• Ingredients for enteral nutrition
• Gluten-free solutions
• Trans-fat free solutions
• Emerging Flavours
• Hydrocolloids
• GMO
**Geographies Covered: North America, Europe, South Africa, APAC, South America**Geographies Covered: North America, Europe, South Africa, APAC, South America
33
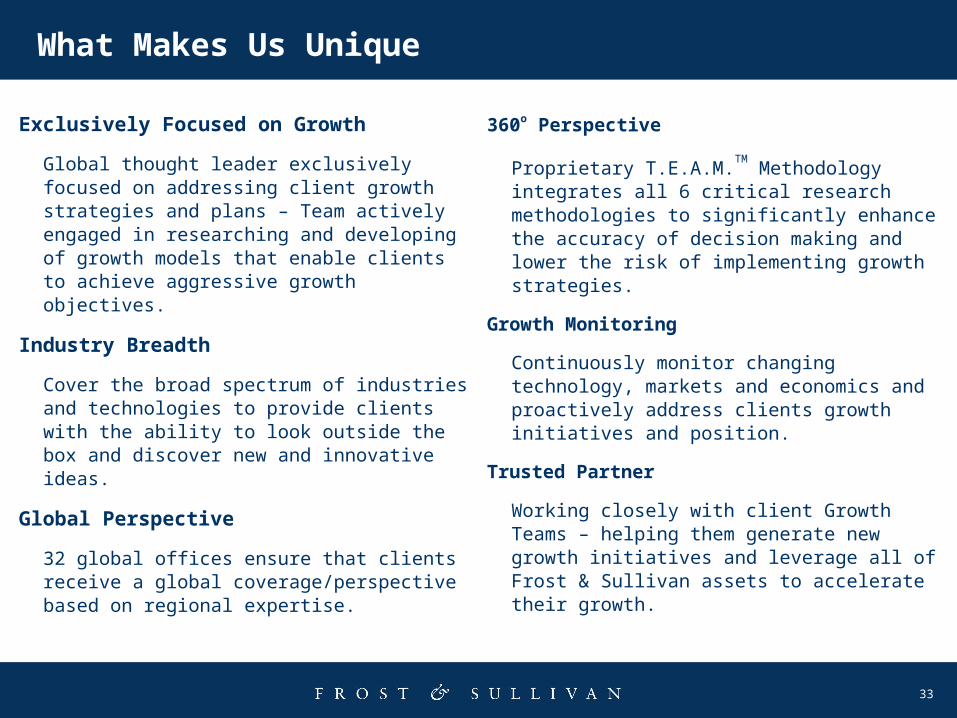
What Makes Us Unique
Exclusively Focused on Growth
Global thought leader exclusively focused on addressing client growth strategies and plans – Team actively engaged in researching and developing of growth models that enable clients to achieve aggressive growth objectives.
Industry Breadth
Cover the broad spectrum of industries and technologies to provide clients with the ability to look outside the box and discover new and innovative ideas.
Global Perspective
32 global offices ensure that clients receive a global coverage/perspective based on regional expertise.
360o Perspective
Proprietary T.E.A.M.TM
Methodology integrates all 6 critical research methodologies to significantly enhance the accuracy of decision making and lower the risk of implementing growth strategies.
Growth Monitoring
Continuously monitor changing technology, markets and economics and proactively address clients growth initiatives and position.
Trusted Partner
Working closely with client Growth Teams – helping them generate new growth initiatives and leverage all of Frost & Sullivan assets to accelerate their growth.
34
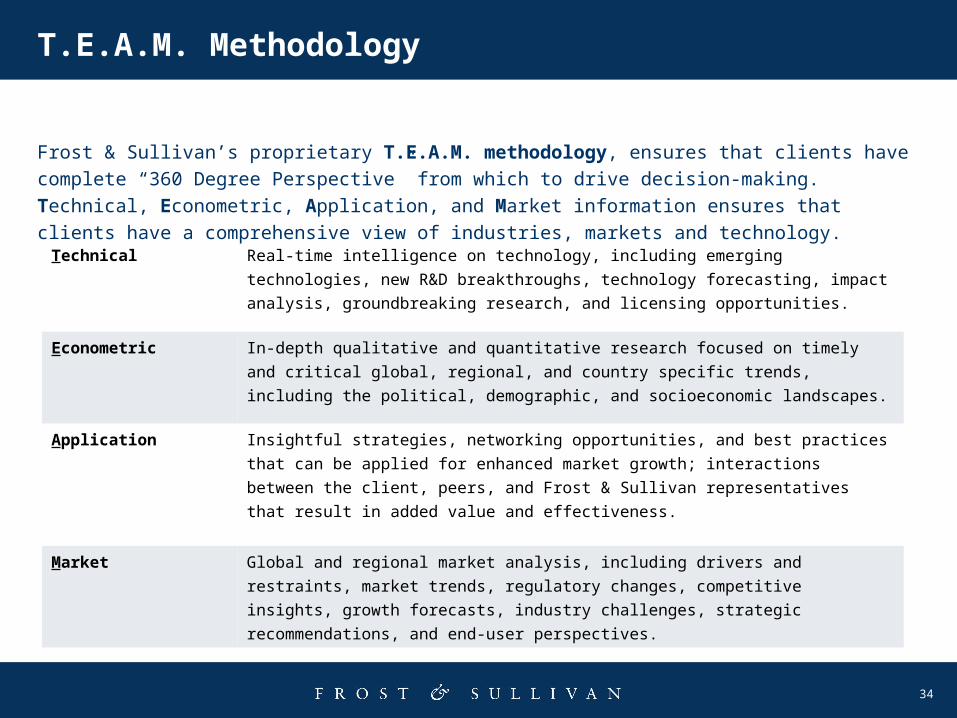
T.E.A.M. Methodology
Frost & Sullivan’s proprietary T.E.A.M. methodology, ensures that clients have complete “360 Degree
Perspective” from which to drive decision-making. Technical, Econometric, Application, and Market
information ensures that clients have a comprehensive view of industries, markets and technology.
Technical Real-time intelligence on technology, including emerging technologies, new
R&D breakthroughs, technology forecasting, impact analysis, groundbreaking
research, and licensing opportunities.
Econometric In-depth qualitative and quantitative research focused on timely and critical
global, regional, and country specific trends, including the political,
demographic, and socioeconomic landscapes.
Application Insightful strategies, networking opportunities, and best practices that can be
applied for enhanced market growth; interactions between the client, peers, and
Frost & Sullivan representatives that result in added value and effectiveness.
Market Global and regional market analysis, including drivers and restraints, market
trends, regulatory changes, competitive insights, growth forecasts, industry
challenges, strategic recommendations, and end-user perspectives.
35
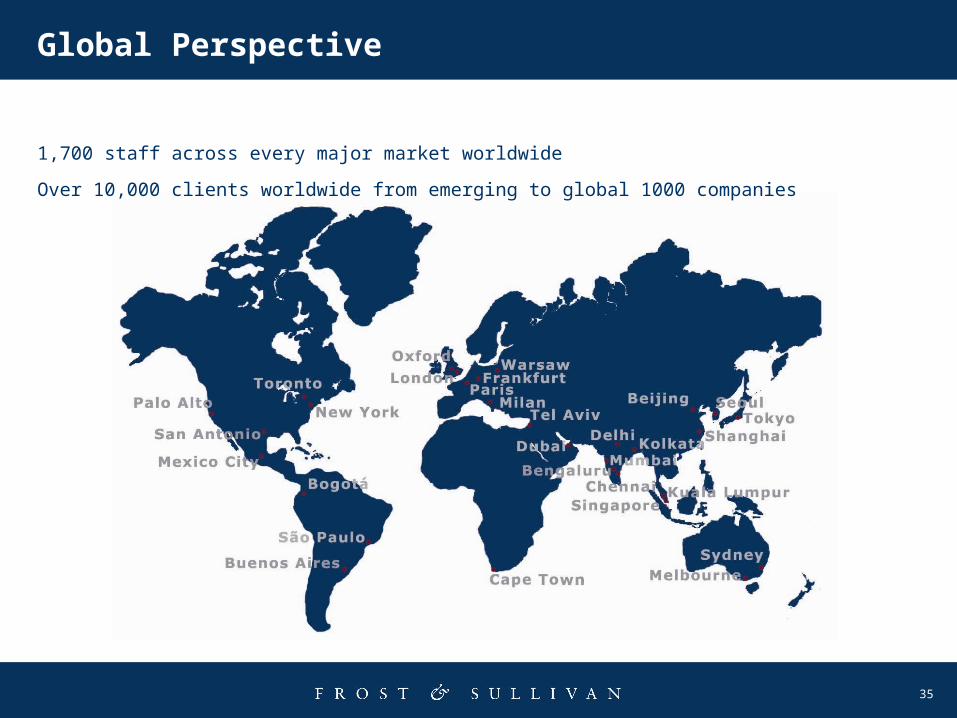
Global Perspective
1,700 staff across every major market worldwide
Over 10,000 clients worldwide from emerging to global 1000 companies