Functional Coactivation Map of the Human Brain
7
Cerebral Cortex November 2008;18:2553--2559 doi:10.1093/cercor/bhn014 Advance Access publication February 21, 2008 Functional Coactivation Map of the Human Brain Roberto Toro 1 , Peter T. Fox 2 and Toma´sˇ Paus 1,3 1 Brain & Body Centre, University of Nottingham, Nottingham NG7 2RD, United Kingdom, 2 Research Imaging Center, University of Texas Health Science Center at San Antonio, San Antonio, TX 78229, USA and 3 Montreal Neurological Institute, McGill University, Montreal, Quebec, Canada H3A 2B4 Understanding the interactions among different brain regions is fundamental to our understanding of brain function. Here we describe a complete map of functional connections in the human brain derived by an automatic meta-analysis of 825 neuroimaging articles, representing 3402 experiments. The likelihood of a func- tional connection between regions was estimated by studying the interdependence of their ‘‘activity,’’ as reported in each experiment, across all experiments. We obtained a dense coactivation map that recovers some fundamental principles of the brain’s functional connectivity, such as the symmetric interhemispheric connections, and important functional networks, such as the fronto-parietal attention network, the resting state network and the motor network. Keywords: brain mapping, database, functional connectivity, human brain, meta-analysis Introduction The most frequent source of brain stimulation is the brain itself. The cerebral cortex, the fastest growing structure in mamma- lian evolution, is a particularly striking example: here more than 95% of the afferent connections appear to be cortico- cortical (Braitenberg and Schu¨z 1991). There are 2 main features important for understanding brain connectivity. One is the organization of efferent and afferent axonal fibers, which determines the brain’s structural connec- tivity. The other is the organization of coordinated functional activation of different brain regions, which determines its functional connectivity. Most of our knowledge about structural connectivity of the primate brain comes from post-mortem studies using retro- grade and anterograde tracers in nonhuman primates. One of the major caveats of traditional tracing techniques is that they provide only a sparse representation of all the possible connections in the brain, a problem alleviated to some extent by systematic meta-analyses, such as those by Felleman and Van Essen (1991), Young et al. (1995), and Stephan et al. (2001). Functional connectivity studies, on the other hand, are aimed at understanding the coordinated activity of brain regions during a cognitive task (Friston 1994). Neuronal activity may be measured, for example, by electric recordings as in electroencephalography, or by magnetic resonance imaging (MRI) of variations in blood oxygenation, as in functional MRI (fMRI). Interregional coordination of brain activity can then be estimated, for example, through the cross- correlation coefficient of such signals. Functional and structural connectivity, whereas obviously related, are not equivalent. Callosal fibers, for example, represent only 1% of the total corticocortical fibers (Schu¨z et al. 2006) and yet left--right symmetric patterns of interhemispheric activation are among the most frequent findings in neuroimaging studies. In fact, studies of functional connectivity provide information not only about the presence of a connection between 2 regions, direct or indirect, but also about the strength of this connection given the particular context (e.g., task). It would be impossible, however, to obtain a complete map of the brain’s functional connectivity in an individual’s brain using current functional connectivity methods; this would require collecting data in a group of subjects performing many different tasks. Here we propose a different approach to the problem of mapping functional connectivity, which has allowed us to obtain a dense 6-dimensional map of functional connections across a large variety of tasks. We based our map on a large automatic meta-analysis of the neuroimaging studies in the BrainMap database (Laird et al. 2005). We interpreted the fact that a group of regions is reported together across experiments as evidence of their functional connection. We assessed the strength and significance of this connection by calculating the likelihood ratio between the hypothesis of interdependence of their activity compared with the null hypothesis of independence. Using this approach, we observed that such a ‘‘meta- coactivation’’ map recovers some fundamental principles of the brain’s functional connectivity, such as the symmetric in- terhemispheric coactivations, and some important functional networks, including the fronto-parietal attention network (Fox et al. 2005), the resting state network (Greicius et al. 2003) and the motor network (Paus et al. 1998; Postuma and Dagher 2006). Methods Database Our meta-analysis included all the articles contained in the BrainMap database (Laird et al. 2005) of studies using positron emission tomography and fMRI. Articles in BrainMap are organized as ‘‘experi- ments’’ representing, for example, a particular contrast between 2 scanning conditions. Each experiment contains a variable number of ‘‘locations,’’ corresponding to the stereotaxic coordinates of the regions reported as ‘‘active.’’ As of June 2006, 825 articles were available in BrainMap, and have been used in our meta-analysis; these articles contained 3402 experiments with a total of 27 909 locations. Locations in BrainMap are stored as 3-dimensional coordinates in standardized stereotaxic space (Talairach and Tournoux 1988). Whenever a study reports locations in MNI305 or ICBM152 space, they are converted into the standardized Talairach space using a piece- wise linear transformation (Brett 1999). We used the inverse of this transformation to convert location coordinates back to MNI305 space. Each experiment was then transformed into a binary volume where the dimension-less locations were replaced by spherical regions of interest with a volume of 1[cm 3 ]. The voxel-size of the binary volumes was set to 4[mm] isotropic. Ó The Author 2008. Published by Oxford University Press. All rights reserved. For permissions, please e-mail: [email protected]
Transcript of Functional Coactivation Map of the Human Brain
Cerebral Cortex November 2008;18:2553--2559doi:10.1093/cercor/bhn014Advance Access publication February 21, 2008
Functional Coactivation Map of the HumanBrain
Roberto Toro1, Peter T. Fox2 and Tomas Paus1,3
1Brain & Body Centre, University of Nottingham, NottinghamNG7 2RD, United Kingdom, 2Research Imaging Center,University of Texas Health Science Center at San Antonio, SanAntonio, TX 78229, USA and 3Montreal Neurological Institute,McGill University, Montreal, Quebec, Canada H3A 2B4
Understanding the interactions among different brain regions isfundamental to our understanding of brain function. Here wedescribe a complete map of functional connections in the humanbrain derived by an automatic meta-analysis of 825 neuroimagingarticles, representing 3402 experiments. The likelihood of a func-tional connection between regions was estimated by studying theinterdependence of their ‘‘activity,’’ as reported in each experiment,across all experiments. We obtained a dense coactivation map thatrecovers some fundamental principles of the brain’s functionalconnectivity, such as the symmetric interhemispheric connections,and important functional networks, such as the fronto-parietalattention network, the resting state network and the motornetwork.
Keywords: brain mapping, database, functional connectivity, human brain,meta-analysis
Introduction
The most frequent source of brain stimulation is the brain itself.The cerebral cortex, the fastest growing structure in mamma-lian evolution, is a particularly striking example: here morethan 95% of the afferent connections appear to be cortico-cortical (Braitenberg and Schuz 1991).
There are 2 main features important for understanding brainconnectivity. One is the organization of efferent and afferentaxonal fibers, which determines the brain’s structural connec-tivity. The other is the organization of coordinated functionalactivation of different brain regions, which determines itsfunctional connectivity.
Most of our knowledge about structural connectivity of theprimate brain comes from post-mortem studies using retro-grade and anterograde tracers in nonhuman primates. One ofthe major caveats of traditional tracing techniques is that theyprovide only a sparse representation of all the possibleconnections in the brain, a problem alleviated to some extentby systematic meta-analyses, such as those by Felleman and VanEssen (1991), Young et al. (1995), and Stephan et al. (2001).
Functional connectivity studies, on the other hand, areaimed at understanding the coordinated activity of brainregions during a cognitive task (Friston 1994). Neuronalactivity may be measured, for example, by electric recordingsas in electroencephalography, or by magnetic resonanceimaging (MRI) of variations in blood oxygenation, as infunctional MRI (fMRI). Interregional coordination of brainactivity can then be estimated, for example, through the cross-correlation coefficient of such signals. Functional and structuralconnectivity, whereas obviously related, are not equivalent.Callosal fibers, for example, represent only 1% of the total
corticocortical fibers (Schuz et al. 2006) and yet left--rightsymmetric patterns of interhemispheric activation are amongthe most frequent findings in neuroimaging studies. In fact,studies of functional connectivity provide information not onlyabout the presence of a connection between 2 regions, director indirect, but also about the strength of this connection giventhe particular context (e.g., task). It would be impossible,however, to obtain a complete map of the brain’s functionalconnectivity in an individual’s brain using current functionalconnectivity methods; this would require collecting data ina group of subjects performing many different tasks.
Here we propose a different approach to the problem ofmapping functional connectivity, which has allowed us to obtaina dense 6-dimensional map of functional connections acrossa large variety of tasks. We based our map on a large automaticmeta-analysis of the neuroimaging studies in the BrainMapdatabase (Laird et al. 2005). We interpreted the fact that a groupof regions is reported together across experiments as evidenceof their functional connection. We assessed the strength andsignificance of this connection by calculating the likelihood ratiobetween the hypothesis of interdependence of their activitycompared with the null hypothesis of independence.
Using this approach, we observed that such a ‘‘meta-coactivation’’ map recovers some fundamental principles of thebrain’s functional connectivity, such as the symmetric in-terhemispheric coactivations, and some important functionalnetworks, including the fronto-parietal attention network (Foxet al. 2005), the resting state network (Greicius et al. 2003) andthemotor network (Paus et al. 1998; Postuma and Dagher 2006).
Methods
DatabaseOur meta-analysis included all the articles contained in the BrainMapdatabase (Laird et al. 2005) of studies using positron emissiontomography and fMRI. Articles in BrainMap are organized as ‘‘experi-ments’’ representing, for example, a particular contrast between2 scanning conditions. Each experiment contains a variable numberof ‘‘locations,’’ corresponding to the stereotaxic coordinates of theregions reported as ‘‘active.’’ As of June 2006, 825 articles were availablein BrainMap, and have been used in our meta-analysis; these articlescontained 3402 experiments with a total of 27 909 locations.Locations in BrainMap are stored as 3-dimensional coordinates in
standardized stereotaxic space (Talairach and Tournoux 1988).Whenever a study reports locations in MNI305 or ICBM152 space,they are converted into the standardized Talairach space using a piece-wise linear transformation (Brett 1999). We used the inverse of thistransformation to convert location coordinates back to MNI305 space.Each experiment was then transformed into a binary volume where
the dimension-less locations were replaced by spherical regions ofinterest with a volume of 1[cm3]. The voxel-size of the binary volumeswas set to 4[mm] isotropic.
! The Author 2008. Published by Oxford University Press. All rights reserved.For permissions, please e-mail: [email protected]
Map of CoactivationsThe coactivation between pairs of voxels in our map was defined bytheir statistical dependence across experiments. The activation of everyvoxel was modeled as independent and identically distributed samplesof binary random variables whose values are equal to 1 when voxels arereported active, and 0 otherwise. For 2 such random variables A and B,corresponding to the activation of voxels v and w, the null hypothesisH0 states that the probability of B being active does not depend on thevalue observed for A, whereas the alternative hypothesis H1 states thata dependence does exist. Formally:
p 0 =prðB = 1jA = 0Þ
p1 =prðB = 1jA = 1Þ
H0 : p 0 = p1 = p
H1 : p 0 6¼ p1:
From the data, we can compute the maximum likelihood estimate pfor the value p in the model under H0, p = m=N , where m is thenumber of experiments where voxel w was active, and N is the totalnumber of experiments. Similarly, the values of p0 and p1 under H1 canbe estimated by p0=ðm–kÞ=ðN –nÞ and p1=k=n, where n is the numberof experiments where voxel v was active, and k is the number ofexperiments where voxels v and w were active together.
We used the likelihood ratio k = L (H1)/L (H0) to evaluate how muchmore likely the alternative hypothesis is, compared with the nullhypothesis (Manning and Schutze 1999). Here, L (H0) and L (H1) arethe maximum likelihood of the data under the null and alternativehypotheses respectively,
LðH0Þ =Bðk;n; p ÞBðm –k;N –n; p Þ;
LðH1Þ =Bðk;n; p1ÞBðm –k;N –n; p0Þ;where B (i, j, x) is the binomial distribution for the probability ofi successes out of j trials, each having a success probability of x. Then,
k =Bðk;n; p1ÞBðm –k;N –n; p0ÞBðk;n; p ÞBðm –k;N –n; p Þ =
pk1 ð1 – p1Þ
n –kpm –k0 ð1 – p0Þ
N –n –m +k
pkð1 – p Þn –k
pm –kð1 – p ÞN –n –m +k :
The false-positive rate when rejecting the null hypothesis H0 for thealternative hypothesis H1 was estimated through 2log(k), which is
asymptotically v2 distributed with 1 degree of freedom (Mood et al.1974).
For every voxel in the brain, the coactivation map provides a 3-dimensional volume containing its coactive regions. We used a false-discovery rate of 0.01 to assess the statistical significance of thecoactivations in each of these volumes while controlling for themultiple comparisons (Genovese et al. 2002).
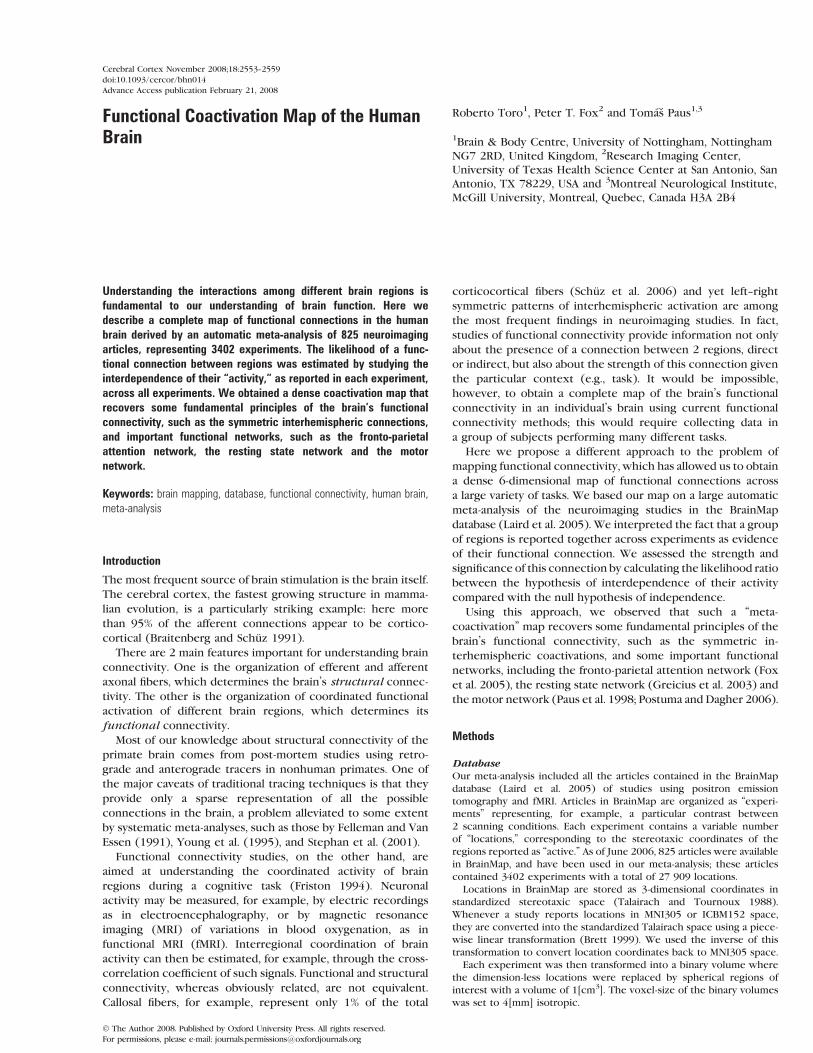
Figure 1. Characterization of the experiments used in the coactivation map. Distribution of the different cognitive domains represented by the experiments after the BrainMapclassification (A). Histogram of the number of locations per experiment (B). Experiments reported on average 8 locations, and a decreasing number of experiments reported largenumbers of locations.
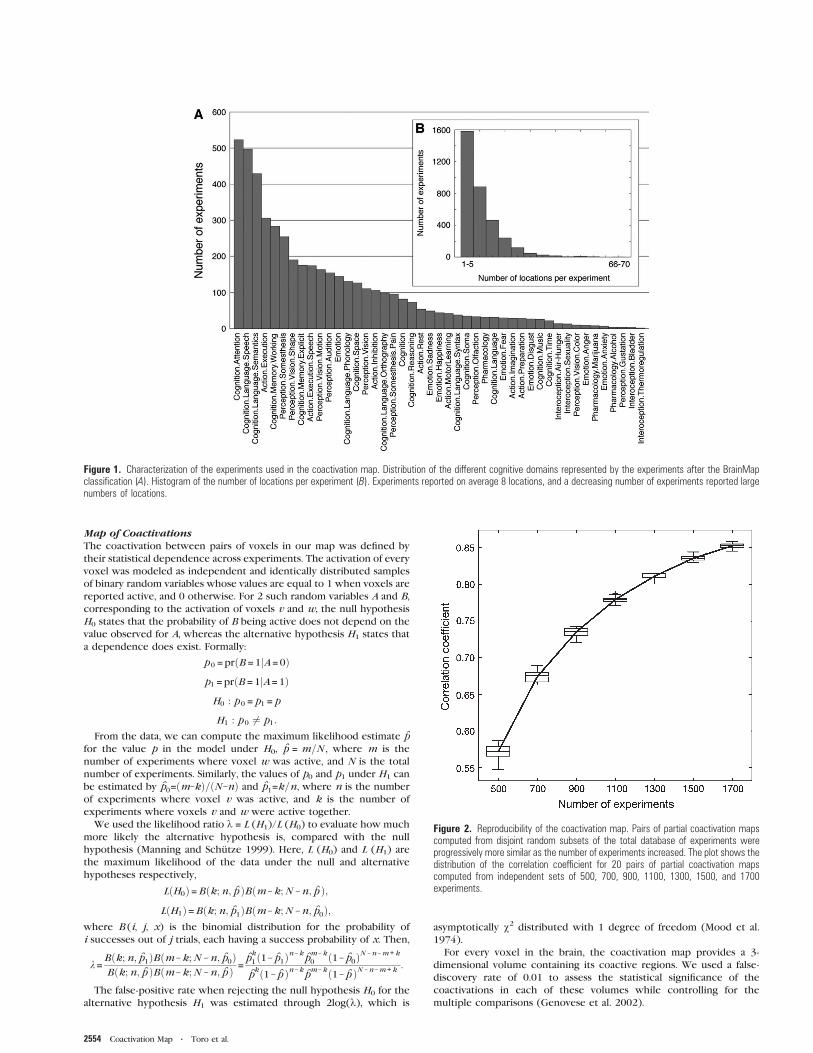
Figure 2. Reproducibility of the coactivation map. Pairs of partial coactivation mapscomputed from disjoint random subsets of the total database of experiments wereprogressively more similar as the number of experiments increased. The plot shows thedistribution of the correlation coefficient for 20 pairs of partial coactivation mapscomputed from independent sets of 500, 700, 900, 1100, 1300, 1500, and 1700experiments.
2554 Coactivation Map d Toro et al.
ReproducibilityTo verify that the coactivation map was not dependent on a particularchoice of experiments, we computed partial coactivation maps usingdisjoint pairs of randomly selected subsets of experiments, with sizes of500, 700, 900, 1100, 1300, 1500, and 1700 experiments. Twenty pairs ofpartial coactivation maps were computed for each subset size. Wecompared the similarity of each pair M0, M1 of partial maps usingPearson’s correlation coefficient r,
r ðM0;M1Þ =+Nc
i = 1ðMi
0 – !M 0ÞðMi1 – !M 1Þ
ffiffiffiffiffiffiffiffiffiffiffiffiffiffiffiffiffiffiffiffiffiffiffiffiffiffiffiffiffi
+Nc
i =1ðMi
0 – !M 0Þ2s ffiffiffiffiffiffiffiffiffiffiffiffiffiffiffiffiffiffiffiffiffiffiffiffiffiffiffiffiffi
+Nc
i = 1ðMi
1 – !M 1Þ2s ;
where !M 0 and !M 1 are the average coactivation of the maps M0 and M1,respectively, and Nc is the total number of coactivations in the maps.There were in total 280 partial coactivation maps, everyone
occupying up to 300 MByte (up to 10 GByte uncompressed). The
reproducibility computations took 3 days in a grid of 8 computers (16Motorola G5 processors) running at 2 GHz with 2 GByte of memory.
Results
Map of Functional Coactivations
The experiments in our database represented a wide variety ofcognitive domains (Fig. 1A), and involved on average 8 differentlocations, with values ranging from 1 to 68 (Fig. 1B). Locationswere not distributed uniformly throughout the brain. ThepreSMA/SMA cortex was the most frequently reported region,followed by left/right symmetric regions in the premotor,intraparietal, and ventral temporo-occipital cortices. The leastreported regions included the central sulcus, anterior temporalcortex and dorsal prefrontal cortex, as well as the inferior halfof the cerebellum; the latter likely reflects a rather common
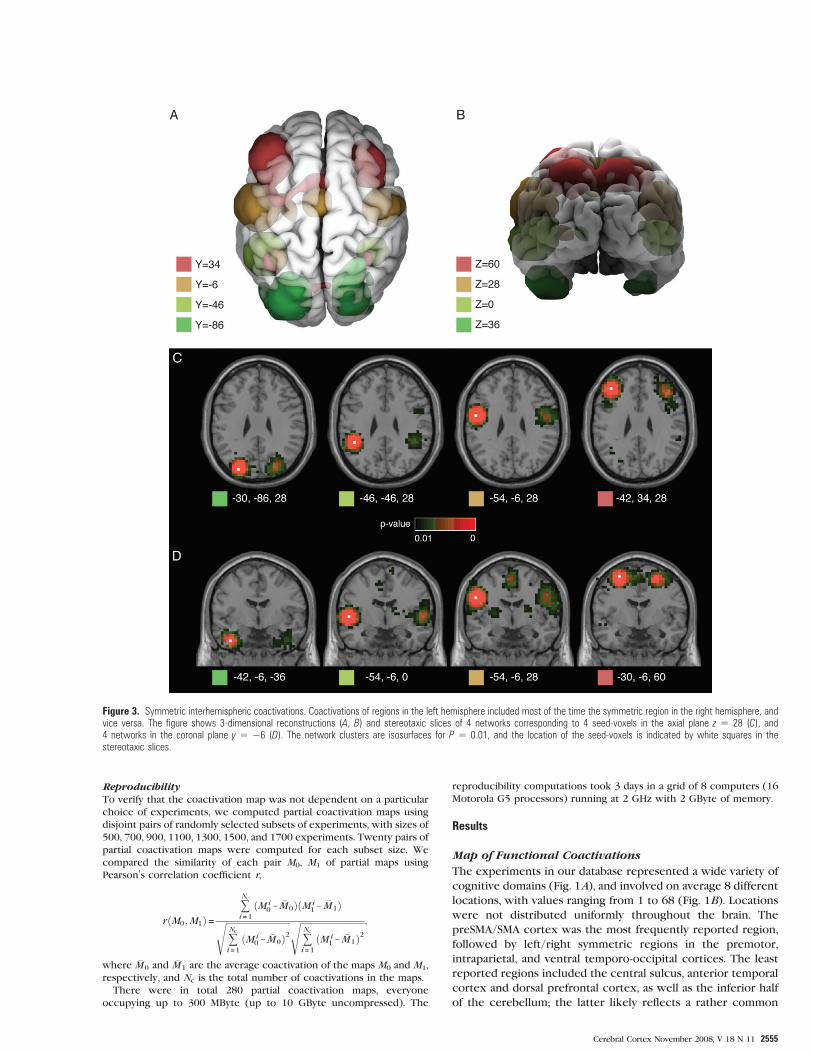
Figure 3. Symmetric interhemispheric coactivations. Coactivations of regions in the left hemisphere included most of the time the symmetric region in the right hemisphere, andvice versa. The figure shows 3-dimensional reconstructions (A, B) and stereotaxic slices of 4 networks corresponding to 4 seed-voxels in the axial plane z 5 28 (C), and4 networks in the coronal plane y 5 $6 (D). The network clusters are isosurfaces for P 5 0.01, and the location of the seed-voxels is indicated by white squares in thestereotaxic slices.
Cerebral Cortex November 2008, V 18 N 11 2555
omission of the inferior part of the cerebellum in the scannedvolumes.
The meta-coactivation map consists of almost 45 000individual volumes, 1 for every 4[mm3] voxel in the brain.Coactivation volumes showed a characteristic structure.Coactivation was stronger in the neighborhood of the seed-voxel, and often also in the left/right symmetric region.Depending on the particular position of the seed-voxel, otherinter- and intrahemispheric regions, as well as subcorticalstructures, presented also strongcoactivations (see, e.g., Figs 4--6).
Reproducibility
Reproducibility of the coactivation map was assessed byestimating the similarity between pairs of partial coactivationmaps that used disjoint random subsamples of experiments.Figure 2 shows that the correlation between maps wassignificant and increased asymptotically with the number ofexperiments, being reasonably high with only 500 experiments.Thus, the meta-coactivation map does not depend ona particular choice of experiments, and there exists a robuststructure in the functional coactivations that can be recoveredeven with a moderate number of studies.
Networks
For every voxel in stereotaxic space, the coactivation mapcontains a complete 3-dimensional volume of its coactivationswith the whole brain. These volumes represent networks ofvarying complexity, from those with significant coactivationsonly around the seed-voxel, to those showing a rich pattern ofcortical and subcortical coactive regions. Here we illustrate thatthe coactivation map does recover meaningful networks bydescribing some well-known cases of functional connectivity.
Symmetric Interhemispheric CoactivationsFigure 3 shows examples of symmetric interhemisphericcoactivations between different regions of the cerebral cortex.
Symmetric coactivations of this kind are among the strongestfunctional correlations that we can observe in the brain; andalmost 2/3 of the voxels in the coactivation map have them.These coactivations are likely mediated by interhemisphericcallosal fibers. Given that the number of callosal fibers isminimal compared with intrahemispheric corticocorticalfibers, the strength of symmetric interhemispheric coactiva-tions is impressively high.
Examples of Specific NetworksAs an illustration of the type of network represented in thecoactivation map, we have chosen seed-voxels for 3 well-known networks, based on the stereotaxic coordinatesreported in the literature. We show the fronto-parietal‘‘attention’’ network, cingulo-parietal ‘‘resting state’’ network,and the cortico-diencephalo-cerebellar ‘‘motor’’ network.
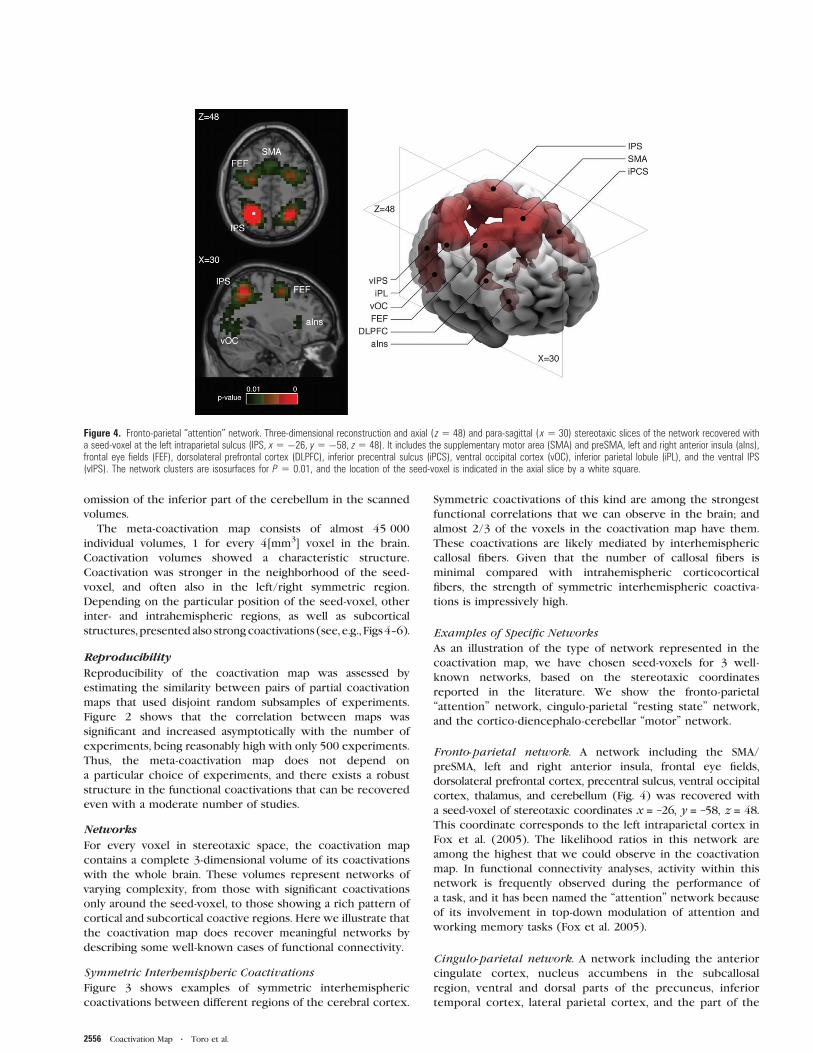
Fronto-parietal network. A network including the SMA/preSMA, left and right anterior insula, frontal eye fields,dorsolateral prefrontal cortex, precentral sulcus, ventral occipitalcortex, thalamus, and cerebellum (Fig. 4) was recovered witha seed-voxel of stereotaxic coordinates x = –26, y = –58, z = 48.This coordinate corresponds to the left intraparietal cortex inFox et al. (2005). The likelihood ratios in this network areamong the highest that we could observe in the coactivationmap. In functional connectivity analyses, activity within thisnetwork is frequently observed during the performance ofa task, and it has been named the ‘‘attention’’ network becauseof its involvement in top-down modulation of attention andworking memory tasks (Fox et al. 2005).
Cingulo-parietal network. A network including the anteriorcingulate cortex, nucleus accumbens in the subcallosalregion, ventral and dorsal parts of the precuneus, inferiortemporal cortex, lateral parietal cortex, and the part of the
Figure 4. Fronto-parietal ‘‘attention’’ network. Three-dimensional reconstruction and axial ( z 5 48) and para-sagittal ( x 5 30) stereotaxic slices of the network recovered witha seed-voxel at the left intraparietal sulcus (IPS, x 5 $26, y 5 $58, z 5 48). It includes the supplementary motor area (SMA) and preSMA, left and right anterior insula (aIns),frontal eye fields (FEF), dorsolateral prefrontal cortex (DLPFC), inferior precentral sulcus (iPCS), ventral occipital cortex (vOC), inferior parietal lobule (iPL), and the ventral IPS(vIPS). The network clusters are isosurfaces for P 5 0.01, and the location of the seed-voxel is indicated in the axial slice by a white square.
2556 Coactivation Map d Toro et al.
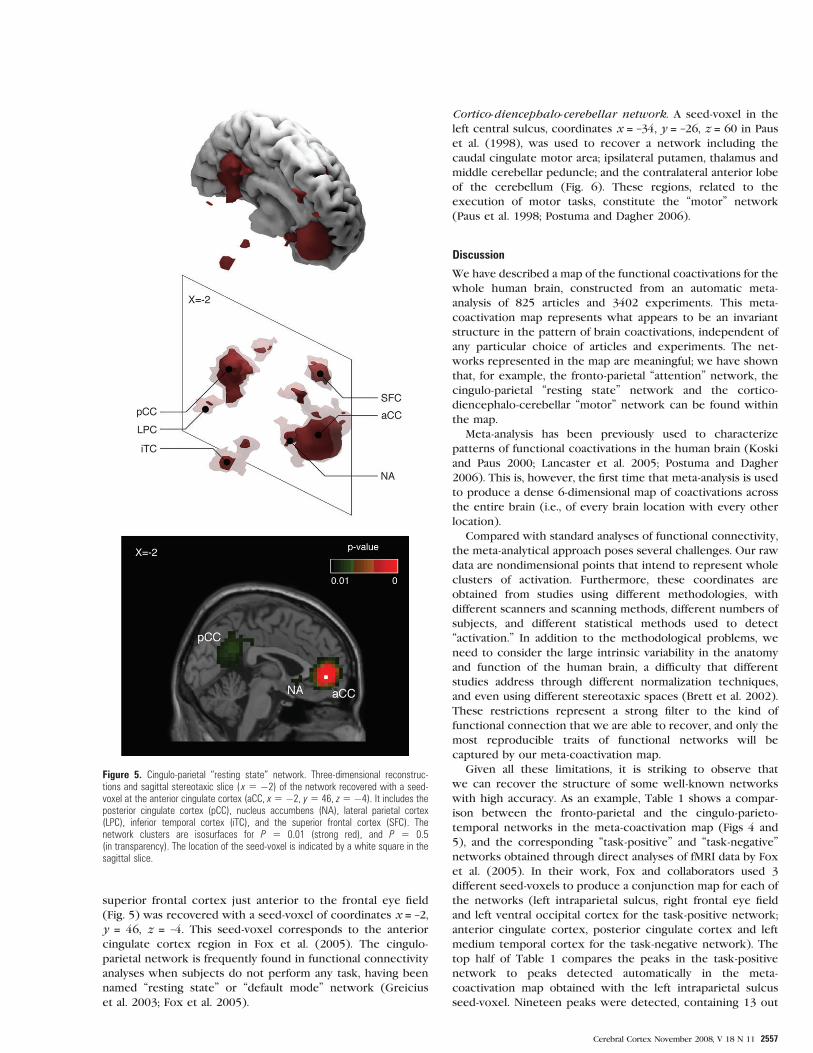
superior frontal cortex just anterior to the frontal eye field(Fig. 5) was recovered with a seed-voxel of coordinates x = –2,y = 46, z = –4. This seed-voxel corresponds to the anteriorcingulate cortex region in Fox et al. (2005). The cingulo-parietal network is frequently found in functional connectivityanalyses when subjects do not perform any task, having beennamed ‘‘resting state’’ or ‘‘default mode’’ network (Greiciuset al. 2003; Fox et al. 2005).
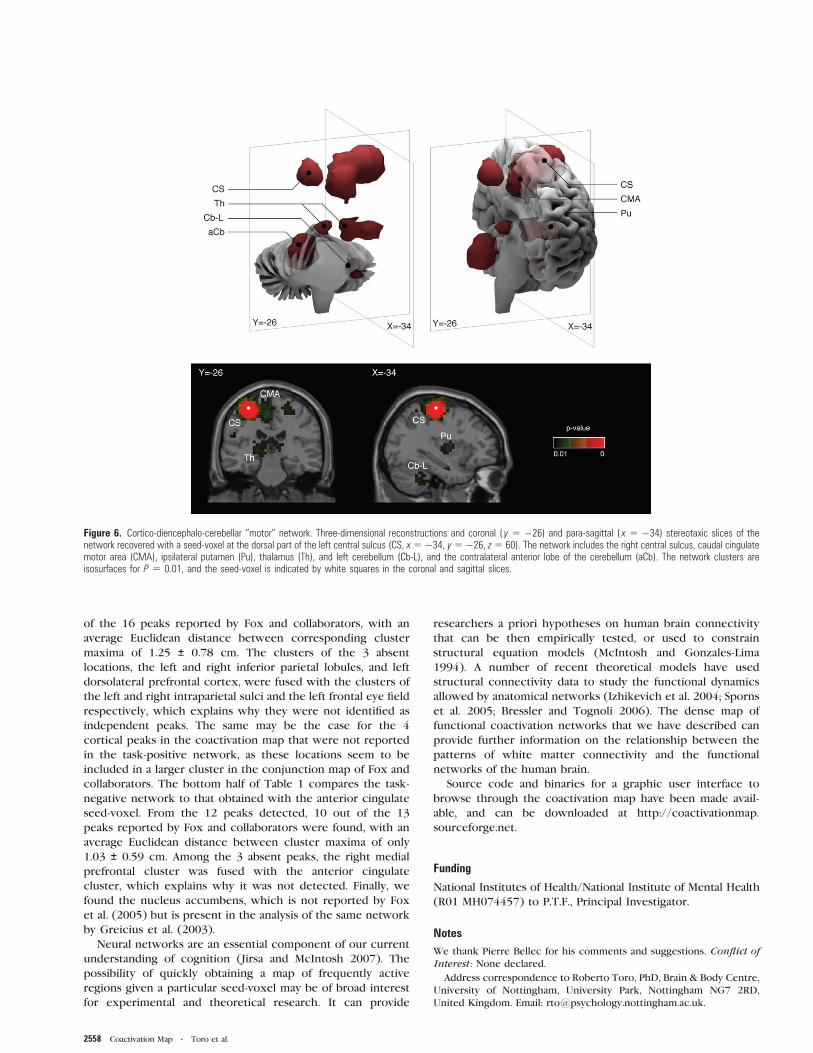
Cortico-diencephalo-cerebellar network. A seed-voxel in theleft central sulcus, coordinates x = –34, y = –26, z = 60 in Pauset al. (1998), was used to recover a network including thecaudal cingulate motor area; ipsilateral putamen, thalamus andmiddle cerebellar peduncle; and the contralateral anterior lobeof the cerebellum (Fig. 6). These regions, related to theexecution of motor tasks, constitute the ‘‘motor’’ network(Paus et al. 1998; Postuma and Dagher 2006).
Discussion
We have described a map of the functional coactivations for thewhole human brain, constructed from an automatic meta-analysis of 825 articles and 3402 experiments. This meta-coactivation map represents what appears to be an invariantstructure in the pattern of brain coactivations, independent ofany particular choice of articles and experiments. The net-works represented in the map are meaningful; we have shownthat, for example, the fronto-parietal ‘‘attention’’ network, thecingulo-parietal ‘‘resting state’’ network and the cortico-diencephalo-cerebellar ‘‘motor’’ network can be found withinthe map.
Meta-analysis has been previously used to characterizepatterns of functional coactivations in the human brain (Koskiand Paus 2000; Lancaster et al. 2005; Postuma and Dagher2006). This is, however, the first time that meta-analysis is usedto produce a dense 6-dimensional map of coactivations acrossthe entire brain (i.e., of every brain location with every otherlocation).
Compared with standard analyses of functional connectivity,the meta-analytical approach poses several challenges. Our rawdata are nondimensional points that intend to represent wholeclusters of activation. Furthermore, these coordinates areobtained from studies using different methodologies, withdifferent scanners and scanning methods, different numbers ofsubjects, and different statistical methods used to detect‘‘activation.’’ In addition to the methodological problems, weneed to consider the large intrinsic variability in the anatomyand function of the human brain, a difficulty that differentstudies address through different normalization techniques,and even using different stereotaxic spaces (Brett et al. 2002).These restrictions represent a strong filter to the kind offunctional connection that we are able to recover, and only themost reproducible traits of functional networks will becaptured by our meta-coactivation map.
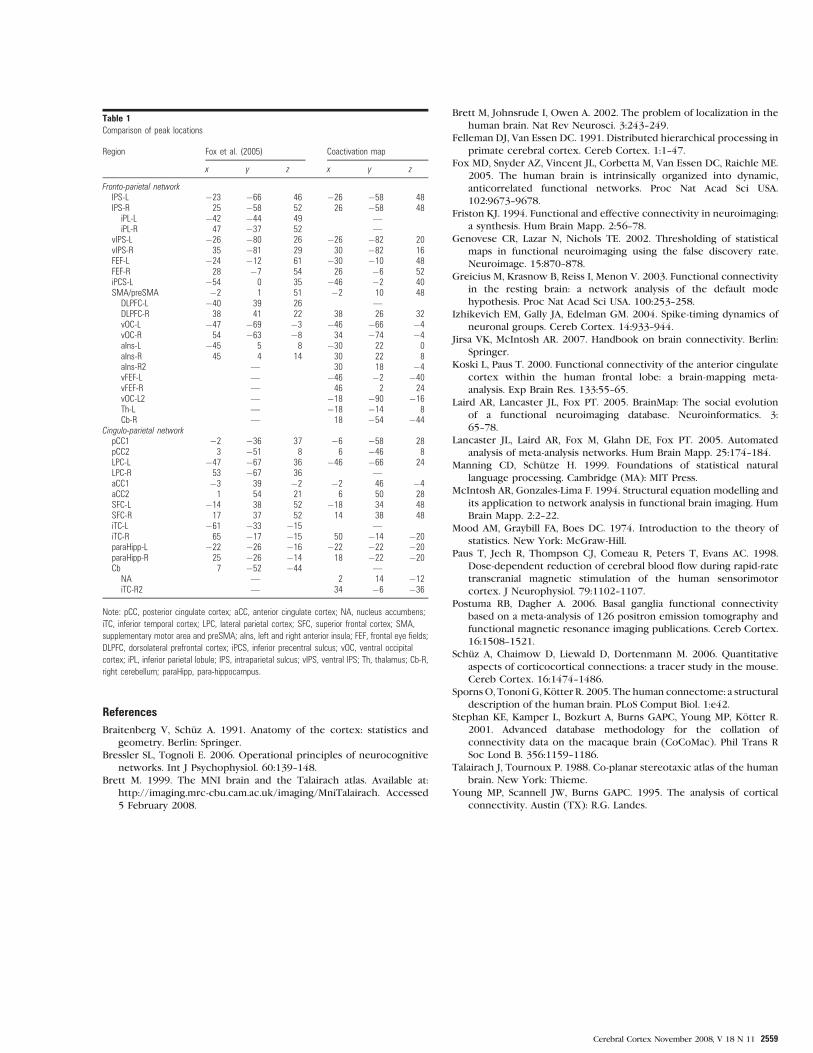
Given all these limitations, it is striking to observe thatwe can recover the structure of some well-known networkswith high accuracy. As an example, Table 1 shows a compar-ison between the fronto-parietal and the cingulo-parieto-temporal networks in the meta-coactivation map (Figs 4 and5), and the corresponding ‘‘task-positive’’ and ‘‘task-negative’’networks obtained through direct analyses of fMRI data by Foxet al. (2005). In their work, Fox and collaborators used 3different seed-voxels to produce a conjunction map for each ofthe networks (left intraparietal sulcus, right frontal eye fieldand left ventral occipital cortex for the task-positive network;anterior cingulate cortex, posterior cingulate cortex and leftmedium temporal cortex for the task-negative network). Thetop half of Table 1 compares the peaks in the task-positivenetwork to peaks detected automatically in the meta-coactivation map obtained with the left intraparietal sulcusseed-voxel. Nineteen peaks were detected, containing 13 out
Figure 5. Cingulo-parietal ‘‘resting state’’ network. Three-dimensional reconstruc-tions and sagittal stereotaxic slice ( x 5 $2) of the network recovered with a seed-voxel at the anterior cingulate cortex (aCC, x5 $2, y5 46, z5 $4). It includes theposterior cingulate cortex (pCC), nucleus accumbens (NA), lateral parietal cortex(LPC), inferior temporal cortex (iTC), and the superior frontal cortex (SFC). Thenetwork clusters are isosurfaces for P 5 0.01 (strong red), and P 5 0.5(in transparency). The location of the seed-voxel is indicated by a white square in thesagittal slice.
Cerebral Cortex November 2008, V 18 N 11 2557
of the 16 peaks reported by Fox and collaborators, with anaverage Euclidean distance between corresponding clustermaxima of 1.25 ± 0.78 cm. The clusters of the 3 absentlocations, the left and right inferior parietal lobules, and leftdorsolateral prefrontal cortex, were fused with the clusters ofthe left and right intraparietal sulci and the left frontal eye fieldrespectively, which explains why they were not identified asindependent peaks. The same may be the case for the 4cortical peaks in the coactivation map that were not reportedin the task-positive network, as these locations seem to beincluded in a larger cluster in the conjunction map of Fox andcollaborators. The bottom half of Table 1 compares the task-negative network to that obtained with the anterior cingulateseed-voxel. From the 12 peaks detected, 10 out of the 13peaks reported by Fox and collaborators were found, with anaverage Euclidean distance between cluster maxima of only1.03 ± 0.59 cm. Among the 3 absent peaks, the right medialprefrontal cluster was fused with the anterior cingulatecluster, which explains why it was not detected. Finally, wefound the nucleus accumbens, which is not reported by Foxet al. (2005) but is present in the analysis of the same networkby Greicius et al. (2003).
Neural networks are an essential component of our currentunderstanding of cognition (Jirsa and McIntosh 2007). Thepossibility of quickly obtaining a map of frequently activeregions given a particular seed-voxel may be of broad interestfor experimental and theoretical research. It can provide
researchers a priori hypotheses on human brain connectivitythat can be then empirically tested, or used to constrainstructural equation models (McIntosh and Gonzales-Lima1994). A number of recent theoretical models have usedstructural connectivity data to study the functional dynamicsallowed by anatomical networks (Izhikevich et al. 2004; Spornset al. 2005; Bressler and Tognoli 2006). The dense map offunctional coactivation networks that we have described canprovide further information on the relationship between thepatterns of white matter connectivity and the functionalnetworks of the human brain.
Source code and binaries for a graphic user interface tobrowse through the coactivation map have been made avail-able, and can be downloaded at http://coactivationmap.sourceforge.net.
Funding
National Institutes of Health/National Institute of Mental Health(R01 MH074457) to P.T.F., Principal Investigator.
Notes
We thank Pierre Bellec for his comments and suggestions. Conflict ofInterest : None declared.
Address correspondence to Roberto Toro, PhD, Brain & Body Centre,University of Nottingham, University Park, Nottingham NG7 2RD,United Kingdom. Email: [email protected].
Figure 6. Cortico-diencephalo-cerebellar ‘‘motor’’ network. Three-dimensional reconstructions and coronal ( y 5 $26) and para-sagittal ( x 5 $34) stereotaxic slices of thenetwork recovered with a seed-voxel at the dorsal part of the left central sulcus (CS, x5 $34, y5 $26, z5 60). The network includes the right central sulcus, caudal cingulatemotor area (CMA), ipsilateral putamen (Pu), thalamus (Th), and left cerebellum (Cb-L), and the contralateral anterior lobe of the cerebellum (aCb). The network clusters areisosurfaces for P 5 0.01, and the seed-voxel is indicated by white squares in the coronal and sagittal slices.
2558 Coactivation Map d Toro et al.
References
Braitenberg V, Schuz A. 1991. Anatomy of the cortex: statistics andgeometry. Berlin: Springer.
Bressler SL, Tognoli E. 2006. Operational principles of neurocognitivenetworks. Int J Psychophysiol. 60:139--148.
Brett M. 1999. The MNI brain and the Talairach atlas. Available at:http://imaging.mrc-cbu.cam.ac.uk/imaging/MniTalairach. Accessed5 February 2008.
Brett M, Johnsrude I, Owen A. 2002. The problem of localization in thehuman brain. Nat Rev Neurosci. 3:243--249.
Felleman DJ, Van Essen DC. 1991. Distributed hierarchical processing inprimate cerebral cortex. Cereb Cortex. 1:1--47.
Fox MD, Snyder AZ, Vincent JL, Corbetta M, Van Essen DC, Raichle ME.2005. The human brain is intrinsically organized into dynamic,anticorrelated functional networks. Proc Nat Acad Sci USA.102:9673--9678.
Friston KJ. 1994. Functional and effective connectivity in neuroimaging:a synthesis. Hum Brain Mapp. 2:56--78.
Genovese CR, Lazar N, Nichols TE. 2002. Thresholding of statisticalmaps in functional neuroimaging using the false discovery rate.Neuroimage. 15:870--878.
Greicius M, Krasnow B, Reiss I, Menon V. 2003. Functional connectivityin the resting brain: a network analysis of the default modehypothesis. Proc Nat Acad Sci USA. 100:253--258.
Izhikevich EM, Gally JA, Edelman GM. 2004. Spike-timing dynamics ofneuronal groups. Cereb Cortex. 14:933--944.
Jirsa VK, McIntosh AR. 2007. Handbook on brain connectivity. Berlin:Springer.
Koski L, Paus T. 2000. Functional connectivity of the anterior cingulatecortex within the human frontal lobe: a brain-mapping meta-analysis. Exp Brain Res. 133:55--65.
Laird AR, Lancaster JL, Fox PT. 2005. BrainMap: The social evolutionof a functional neuroimaging database. Neuroinformatics. 3:65--78.
Lancaster JL, Laird AR, Fox M, Glahn DE, Fox PT. 2005. Automatedanalysis of meta-analysis networks. Hum Brain Mapp. 25:174--184.
Manning CD, Schutze H. 1999. Foundations of statistical naturallanguage processing. Cambridge (MA): MIT Press.
McIntosh AR, Gonzales-Lima F. 1994. Structural equation modelling andits application to network analysis in functional brain imaging. HumBrain Mapp. 2:2--22.
Mood AM, Graybill FA, Boes DC. 1974. Introduction to the theory ofstatistics. New York: McGraw-Hill.
Paus T, Jech R, Thompson CJ, Comeau R, Peters T, Evans AC. 1998.Dose-dependent reduction of cerebral blood flow during rapid-ratetranscranial magnetic stimulation of the human sensorimotorcortex. J Neurophysiol. 79:1102--1107.
Postuma RB, Dagher A. 2006. Basal ganglia functional connectivitybased on a meta-analysis of 126 positron emission tomography andfunctional magnetic resonance imaging publications. Cereb Cortex.16:1508--1521.
Schuz A, Chaimow D, Liewald D, Dortenmann M. 2006. Quantitativeaspects of corticocortical connections: a tracer study in the mouse.Cereb Cortex. 16:1474--1486.
SpornsO, Tononi G, Kotter R. 2005. The human connectome: a structuraldescription of the human brain. PLoS Comput Biol. 1:e42.
Stephan KE, Kamper L, Bozkurt A, Burns GAPC, Young MP, Kotter R.2001. Advanced database methodology for the collation ofconnectivity data on the macaque brain (CoCoMac). Phil Trans RSoc Lond B. 356:1159--1186.
Talairach J, Tournoux P. 1988. Co-planar stereotaxic atlas of the humanbrain. New York: Thieme.
Young MP, Scannell JW, Burns GAPC. 1995. The analysis of corticalconnectivity. Austin (TX): R.G. Landes.
Table 1Comparison of peak locations
Region Fox et al. (2005) Coactivation map
x y z x y z
Fronto-parietal networkIPS-L $23 $66 46 $26 $58 48IPS-R 25 $58 52 26 $58 48iPL-L $42 $44 49 —iPL-R 47 $37 52 —
vIPS-L $26 $80 26 $26 $82 20vIPS-R 35 $81 29 30 $82 16FEF-L $24 $12 61 $30 $10 48FEF-R 28 $7 54 26 $6 52iPCS-L $54 0 35 $46 $2 40SMA/preSMA $2 1 51 $2 10 48DLPFC-L $40 39 26 —DLPFC-R 38 41 22 38 26 32vOC-L $47 $69 $3 $46 $66 $4vOC-R 54 $63 $8 34 $74 $4aIns-L $45 5 8 $30 22 0aIns-R 45 4 14 30 22 8aIns-R2 — 30 18 $4vFEF-L — $46 $2 $40vFEF-R — 46 2 24vOC-L2 — $18 $90 $16Th-L — $18 $14 8Cb-R — 18 $54 $44
Cingulo-parietal networkpCC1 $2 $36 37 $6 $58 28pCC2 3 $51 8 6 $46 8LPC-L $47 $67 36 $46 $66 24LPC-R 53 $67 36 —aCC1 $3 39 $2 $2 46 $4aCC2 1 54 21 6 50 28SFC-L $14 38 52 $18 34 48SFC-R 17 37 52 14 38 48iTC-L $61 $33 $15 —iTC-R 65 $17 $15 50 $14 $20paraHipp-L $22 $26 $16 $22 $22 $20paraHipp-R 25 $26 $14 18 $22 $20Cb 7 $52 $44 —NA — 2 14 $12iTC-R2 — 34 $6 $36
Note: pCC, posterior cingulate cortex; aCC, anterior cingulate cortex; NA, nucleus accumbens;iTC, inferior temporal cortex; LPC, lateral parietal cortex; SFC, superior frontal cortex; SMA,supplementary motor area and preSMA; aIns, left and right anterior insula; FEF, frontal eye fields;DLPFC, dorsolateral prefrontal cortex; iPCS, inferior precentral sulcus; vOC, ventral occipitalcortex; iPL, inferior parietal lobule; IPS, intraparietal sulcus; vIPS, ventral IPS; Th, thalamus; Cb-R,right cerebellum; paraHipp, para-hippocampus.
Cerebral Cortex November 2008, V 18 N 11 2559