Functional Brain Imaging: A Comprehensive Survey · As is known, functional MRI and functional...
29
1 Functional Brain Imaging: A Comprehensive Survey Saman Sarraf 1 , Jian Sun 2 1 Electrical and Computer Engineering, McMaster University, Hamilton, Ontario, Canada 2 Department of Engineering Physics, McMaster University, Hamilton, Ontario, Canada [email protected]
Transcript of Functional Brain Imaging: A Comprehensive Survey · As is known, functional MRI and functional...

1
Functional Brain Imaging: A Comprehensive Survey
Saman Sarraf 1, Jian Sun
2
1Electrical and Computer Engineering, McMaster University, Hamilton, Ontario, Canada
2Department of Engineering Physics, McMaster University, Hamilton, Ontario, Canada

2
Contents
1 Introduction .............................................................................................................................. 3
2 Brain ........................................................................................................................................ 3
2.1 Structure and Function ..................................................................................................... 3
2.2 Neurovascular Coupling ................................................................................................... 4
2.3 Temporal and spatial resolution ....................................................................................... 4
3 Imaging Modalities .................................................................................................................. 6
3.1 Qualitative EEG and MEG ............................................................................................... 6
3.2 Position emission tomography (PET) .............................................................................. 7
3.3 Single-Photon Emission Computed Tomography (SPECT) ............................................ 7
3.4 Functional Magnetic Resonance (fMRI) .......................................................................... 8
3.4.1 Introduction ............................................................................................................... 8
3.4.2 MR Signal Generation and Formation ...................................................................... 8
3.4.3 MR Contrast Mechanisms......................................................................................... 9
3.4.4 Image contrast ......................................................................................................... 10
3.4.5 BOLD fMRI ............................................................................................................ 11
3.4.6 Pre-processing and Statistical Analysis of fMRI data ............................................. 11
3.4.7 Resting-state fMRI .................................................................................................. 12
3.5 Functional Brain Imaging and Multimodalities ............................................................. 14
4 Functional Brain Imaging – Optical Approach ..................................................................... 16
4.1 Introduction .................................................................................................................... 16
4.2 Microscopic Functional Imaging ................................................................................... 17
4.3 Non-invasive Functional Imaging .................................................................................. 21
4.4 Co-Registered fMRI and fNIRS ..................................................................................... 23
5 Conclusion ............................................................................................................................. 24
List of Figures ............................................................................................................................... 25
Bibliography ................................................................................................................................. 26

3
1 Introduction
Functional brain imaging allows measuring dynamic functionality in all brain regions. It is
broadly used in clinical cognitive neuroscience as, well as in research. It will allow the
observation of neural activities in the brain simultaneously.
From the beginning when functional brain imaging was initiated by the mapping of brain
functions proposed by phrenologists, many scientists were asking why we need to image brain
functionality since we have already structural information. Simply, their important question was
including a great answer. Functional information of the human brain would definitely
complement structural information, helping to have a better understanding of what is happening
in the brain.
This paper, which could be useful to those who have an interest in functional brain imaging, such
as engineers, will present a quick review of modalities used in functional brain imaging. We will
concentrate on the most used techniques in functional imaging which are functional magnetic
resonance imaging (fMRI) and functional optical imaging, which is one of novelties in this area
of study.
2 Brain
2.1 Structure and Function
The human brain is the most complex organ in the human body, having a complicated anatomy
and physiology, which is working with almost all other organs through trillions of synapses
(Goetz, 2007). Our brain includes many complicated areas, working based ganglion, and
cerebellum. There are four lobes. They are frontal lobes, parietal lobes, temporal lobes, and
finally the occipital lobes. (Donald C. Johanson, 2006 )
Generally speaking, the cortex is the outer most layers of brain cells which control voluntary
movements and thinking. The brain stem, which is located between the spiral cord and the rest of
the brain, controls our breathing and sleep. The frontal lobes manage problem solving,
judgement and motor function while the parietal lobes manage body position, hand writing, and

4
sensation. The temporal lobes are responsible of memory and hearing, and the occipital lobes
contains the brain’s visual processing system (Goetz, 2007) (Donald C. Johanson et al., 2006).
2.2 Neurovascular Coupling
Crucial to interpreting functional imaging data and normal brain functions, is to have a deep
understanding of neurovascular coupling (Toga, 2012). There is a close relationship between
spatial and temporal coupling and neuronal activity, as well as blood flow that ensures all brain
areas are using a proper amount of oxygen and receiving energetic metabolites. The most recent
research shows the activation of Ca2+
elevations is a necessary step in neuronal activities.
(Giorgio Carmignoto, 2010)
As is known, neurons have a tight relationship with astrocytes, smooth muscle, pericytes,
endothelial cells, and erythrocytes. Neuronal chemo-electrical activity is speculated to be
associated with many metabolic procedures, which are called neurovascular coupling.
Neurovascular coupling includes the following steps: Glucose is metabolized to lactate in
astrocytes, and then lactate is travels to neurons and metabolized with oxygen to produce ATP
and carbon dioxide. Arteries are responsible to deliver oxyhemoglobin to neurons and in the
presence of carbon dioxide, and oxygen will be released. Consequently, Hbo is converted into
dHbo. Neurotransmitters such as acetylcholine released by active neurons cause relaxation step
in smooth muscles, and in arterioles, which will increase blood flow and volume. (Toga, 2012)
2.3 Temporal and spatial resolution
A novel field of study combining cognitive science and cognitive psychology as well as biology
and neuroscience has been developed and called cognitive neuroscience. (Ward, 2006 )
In 1988, Churchland and Sejnowski proposed a method of brain function study based on
temporal and spatial resolution of modalities used in this area. They supposed that it could be
possible to categorize functional brain imaging modalities into temporal resolution and spatial
resolution. This model has been developed several times, and now many novel modalities have
been created. Briefly, temporal resolution refers to the accuracy measured, when an event is
happening, and spatial resolution refers to the accuracy measured, where an event is occurring.
(Ward, 2006 )
5
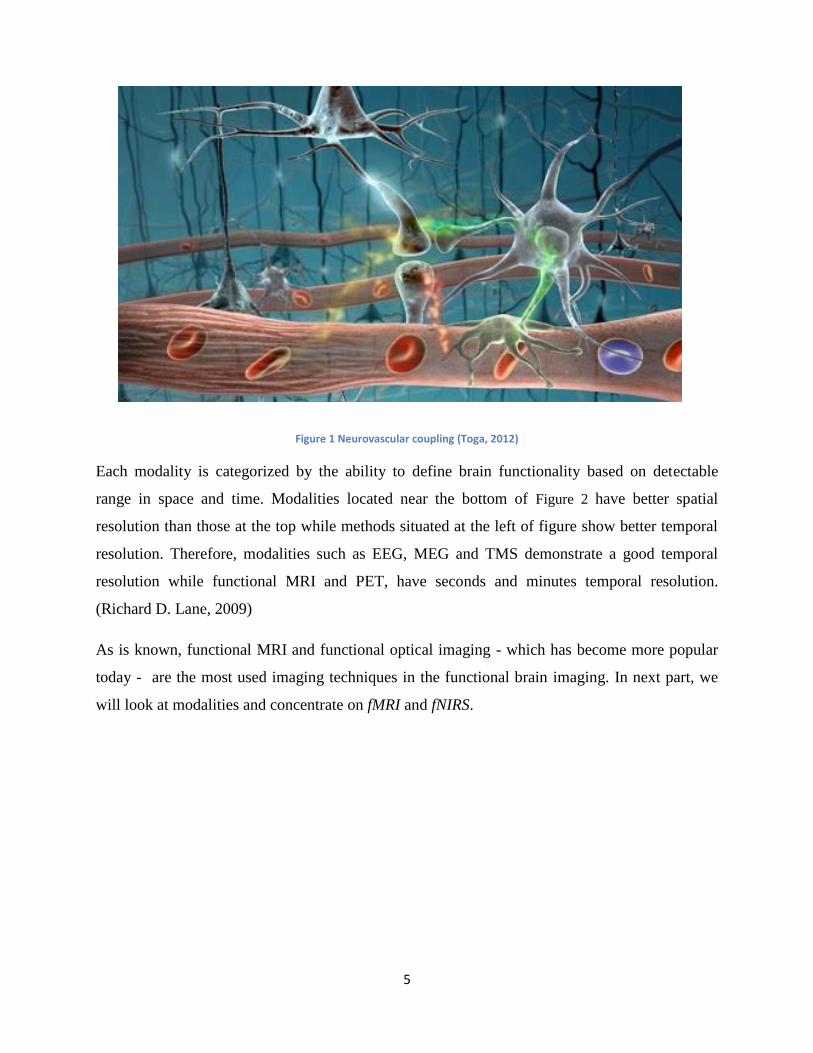
Figure 1 Neurovascular coupling (Toga, 2012)
Each modality is categorized by the ability to define brain functionality based on detectable
range in space and time. Modalities located near the bottom of Figure 2 have better spatial
resolution than those at the top while methods situated at the left of figure show better temporal
resolution. Therefore, modalities such as EEG, MEG and TMS demonstrate a good temporal
resolution while functional MRI and PET, have seconds and minutes temporal resolution.
(Richard D. Lane, 2009)
As is known, functional MRI and functional optical imaging - which has become more popular
today - are the most used imaging techniques in the functional brain imaging. In next part, we
will look at modalities and concentrate on fMRI and fNIRS.

6
Figure 2 Spatial Vs. Temporal Resolution: (Gazziniga, 1998)
3 Imaging Modalities
3.1 Qualitative EEG and MEG
Electroencephalography of EEG is a technique for the recording of electrical signals coming
from brain activities. As is known, an EEG recording is based on voltage fluctuations resulting
from ionic current flows within the neurons in the brain. As mentioned before, EEG has a good
temporal resolution and these days it is used in dual modality fMRI-EEG in the functional brain
(Ernest Niedermever, 2004 ).
Also, Magnetoencephalography is a technique for mapping activity. The electrical currents
which are naturally happening in the brain produce magnetic fields which are recorded by MEG
technique. Application of MEG includes basic research in cognitive brain processes etc.
(Lauronena, 2011).

7
3.2 Position emission tomography (PET)
PET presents a nuclear medicine imaging technique producing 2-D and 3-D images of brain
functionality. Physical principles of PET imaging include several steps which begin with
choosing the molecule of interest. This molecule has to be located radioactively and the product
of this step is called tracer. PET imaging is based on detecting pairs of gamma rays which are
indirectly emitted by the positron-emitting radionuclide (tracer) - which will play the role of an
active molecule in the body. When sufficient amounts of the labelled molecule are administered
into the body, the patients carrying the radioactive trace are placed into the PET scanner. The
basic of image acquisition is similar to all computed-tomography techniques. The radiation
caused by the annihilation step will be detectable in the output. The next step is image
reconstruction. The final goal of PET imaging is to measure the distribution of the tracer. Images
obtained by PET imaging will be filtered by cut-off values, helping the radiologist to interpret
the results. (Peter E. Valk, 2006)
The application of PET is not limited to neuroimaging and it can be used on oncology,
cardiology, musculo-skeletal and small animal imaging. The most popular active molecule in
PET imaging is Fludeoxyglucose (18F) called FDG which is an analogue of glucose. (Kiendys,
2009)
3.3 Single-Photon Emission Computed Tomography (SPECT)
Brain SPECT is a powerful clinical and research tool in the management and diagnosis of
neurologic diseases. (Morano, December 2003)
As is known, SPECT is a nuclear medicine imaging modality providing information of cerebral
function and like other nuclear medicine technique, using a radio pharmaceutical tracer
(Harrison, 1999). The poor image quality causes less usage in clinics. The procedure in SPECT
is similar to PET but the major difference is that radionuclide used in PET is emitting two
gamma-photons while there is only one produced photons in SPECT. Therefore, the image
quality of PET is much higher than SPECT. This modality is utilized in functional brain imaging
and also in myocardial perfusion imaging.

8
3.4 Functional Magnetic Resonance (fMRI)
3.4.1 Introduction
fMRI is a technique measuring the brain activity by detecting the associated changes in blood
flow. This technique, which is similar to MRI, uses the change in magnetization between
oxygen-rich and oxygen-poor blood happening in the brain areas as its basic measure.
The idea for foundations of magnetic resonance imaging were almost started in 1946 by Felix
Bloch (1905-1983) who was at Stanford University studying liquids, and Edward Purcell (1912-
1997) working on solids at Harvard University. Although they could have won Nobel Prizes for
these discovers, it was not until 1973, that successful nuclear magnetic resonance (NMR) was
used to produce images. Finally, in the 1990s their discovers showing changes in blood
oxygenation level could be considered with the use of MRI as a window opening a new
generation of functional brain imaging techniques. (Huettel, 2004)
3.4.2 MR Signal Generation and Formation
A variety of physical concepts resulted in magnetic resonance signal generation. First, an atomic
nuclei having magnetic momentum as well as angular momentum which are called nuclear spin,
plays the important role. “Two axes are important here which are longitudinal direction and
transverse plane, respectively. Longitudinal direction is the axis around which an atomic nucleus
precesses and the transverse plane is the plane on which a nucleus precesses.” (Huettel, 2004)
As is known, each spin will receive a low or high energy state (different magnetic potential
energies) which could be parallel or antiparallel to the magnetic field. By applying an electro-
magnetic pulse oscillating at the resonant (Lamor) frequency of the spins and this procedure is
called excitation; the net magnetization vector will change from longitudinal into the transverse
plane (Huettel, 2004). The mentioned step called evolution will make the net magnetization to
change over time in transverse plane which will be generating MR signals. MR signals can be
measured in the external coil. The Bloch equation describes quantitatively the behaviour of
magnetization in the presence of a time-varying magnetic field. (Huettel, 2004) (Toga et al.,
Brain Mapping The Methods, 2002)

9
Equation 1 the Bloch Equation
𝑑𝑀
𝑑𝑡= 𝛾𝑀 × 𝐵 +
1
𝑇1 (𝑀0 − 𝑀𝑧) −
1
𝑇2 (𝑀𝑥 + 𝑀𝑦)
The Bloch Equation, a quantitative description of magnetic resonance where M is net magnetization, γ is gyromagnetic
ration, B is magnetic field, T1 is the time constant of longitudinal relaxation process and T2 is the time constant of
transverse relaxation.
As described by the Bloch equation, the net magnetization of a spin can be divided into separate
special components along the spatial coordinates(x,y,z). “The longitudinal magnetization is
defined as Mz and the transverse magnetization are defined as Mxy” (Huettel, 2004) .
T1 contrast is related to the time of recovery of the longitudinal magnetization (excitation) and T2
contrast is associated with the decay of transverse magnetization (Huettel, 2004). Briefly, there
are several steps to achieve a 3-D MR image. First, as mentioned before, longitudinal
magnetization happens following the volume excitation. The next step is transverse
magnetization, where 3-D spatial encoding is performed in order to acquire a MR signal in K-
space, resulting in a 3-D MR image (Huettel, 2004) (Toga et al., 2012).
K-space is a 3D Fourier transform of the MR image measured. Its complex values are sampled
during an MR measurement, in a premeditated scheme controlled by a pulse sequence, i.e. an
accurately timed sequence of radiofrequency and gradient pulses. In practice, k-space often
refers to the temporary image space, usually a matrix, in which data from digitized MR signals
are stored during data acquisition. When k-space is full (at the end of the scan) the data are
mathematically processed to produce a final image. Thus k-space holds raw data before
reconstruction. As described, image acquisition in MRI is using the K-space idea affected by a
Fourier transform of the image space.
3.4.3 MR Contrast Mechanisms
Generally, the mechanisms of MR contrasts are divided to four main categories. 1) Static
Contrast which are sensitive to the type, number and relaxation properties of atomic nuclei. This
category includes, T1-wieghted, T2-wieghted, T*2 weighted and proton density contrast. The
main application of static contrast is to determine anatomic information of the brain in fMRI.
2) Motion Contrasts are sensitive to the movement of spins in the space. This group which
includes diffusion and perfusion-weighted, will define dynamic properties of the proton in the

10
brain such as blood flow through MR angiography. 3) Endogenous contrast is related to an
internal feature of biological tissue in the brain while 4) Exogenous contrast needs an external
agent injected to the body playing the role of contrast. For instance, BOLD fMRI is an
endogenous contrast because it uses the blood flow properties, but Gadolinium (Gd) will be an
exogenous contrast (Huettel, 2004).
Figure 3 Comparison of conventional and Synthetic Contrast MRI. T2-weighted, T2-weighted FLAIR and T1-weighted post-Gd contrast of the same slice. The first row was acquired conventionally, the second row has been synthesized (J.B.M. Warntjes,
2009)
3.4.4 Image contrast
Basically, the number of spins in a sample volume will determine a MR signal resulting image
contrast. The equation below shows that image contrast is affected by other parameters. In fact,
image contrast will be determined by TR and TE. For instance choosing a quite small TE will
eliminate T2-weighted images (Toga, 2012). This short description might be of some
mathematical interests.
Equation 2 Image Contrast Equation
𝑆~ 𝜌 1 − 𝑒𝑥𝑝 (−
𝑇𝑅
𝑇1)
1 − cos 𝛼 𝑒𝑥𝑝 (−𝑇𝑅
𝑇1)
sin 𝛼 𝑒𝑥𝑝 (−𝑇𝐸
𝑇2)
Image contrast equation where ρ is the density of nuclear spins, TR is repetition time, TE is echo
time, and α is flip angle. This equation shows that T1 will be maximized by TR and by using a
flip angle equal or greater than the Ernest angle.

11
3.4.5 BOLD fMRI
Blood Oxygenation Level Dependent fMRI (BOLD fMRI) is a technique detecting the brain and
neural activity indirectly, based on magnetic properties of hemoglobin. It means that when Hbo
and dHbo are placed in a magnetic field, dHbo will act as a contrast agent. In BOLD fMRI, the
change in the concentration of dHbo is dynamically monitored. Changes and correlations
between tasks (stimulation) and concentration of Hbo will be considered. As a general fact, the
more neural activities there are, the more tissue needs energy. This will increase the consumption
of Glucose and O2, increasing the blood flow and volume, while local concentration of dHbo is
decreasing which will produce the BOLD fMRI signals. This process will be repeated to the end
and it should mention that BOLD fMRI signals are relevant to these three physiological concepts:
Glucose and O2 consumption, blood flow and volume, and concentration of dHbo, respectively.
(Kim, 1997)
3.4.6 Pre-processing and Statistical Analysis of fMRI data
Preprocessing procedures measuring (removing) unexpected events is done in order to improve
experimental analysis. Regular quality which is important for diagnosis problems has to be
assured in this step. Preprocessing of fMRI data are based on four principal phases. First,
recording of fMRI signal is done followed by an image reconstruction. Then the online quality
assurance is applied. Quality assurance, called Q.A, is a set of procedures defining errors in fMRI
data, to avoid continuing the process with those errors. The second phase will be head motion
correction, as well as slice timing correction. Each slice is acquired at a different time point
within the TR, and the timing difference are especially problematic for an interleave sequence, in
which spatially consecutive slices are not achieved successively. Consequently, it seems that
having a slice timing correction step could be necessary. This phase is a recursive procedure and
it is repeated to the best possible correction. In the third phase, distortion correction, functional
and structural co-registration normalization as well as spatial and temporal smoothing (image
smoothing) are respectively performed. Finally, the online quality assurance is repeated again
and fMRI image are provided. (Huettel, 2004)
Since the fMRI provides vast information which could be difficult to interpret, a variety of
statistical approaches are used in the analysis of the fMRI data. The basin statistical tests such as
t-test or K-S test, as well as frequency domain analysis methods such as Fourier or Wavelet

12
analysis are applied on data of fMRI. Furthermore, the pattern classification methods such as
artificial neural networks or graph theory could be useful to study fMRI data. (Huettel, 2004)
(Toga et al., Brain Mapping The Methods, 2002)
Figure 4 Framework above shows the different phases of pre-processing of fMRI data
3.4.7 Resting-state fMRI
A novel technique used in fMRI called resting-state and as its name shows, the fMRI data
acquisition is performed while there is no task to do for patients. There are two related concepts
about resting-state fMRI. First of all, as patients do not need to do any task and there is no
simulation, the procedure will be more comfortable than a normal fMRI and secondly, as is
known, fMRI data interpretation is often difficult and it is a complicated work. Because in fMRI,
we are not sure of how much the task done by patients, could affect other brain regions or other
cortex. Hopefully, in resting-state fMRI it is supposed that the relationship between brain areas is
in a normal condition and there is no specific effect from one cortex to another region (Bellec,
2010) (Liu et al., 2008).
For studying resting-state fMRI data, several methods can be applied. The most used approach is
seed voxel. The related idea is that a voxel is considered in the MR image which is anatomically
known for scientist. As each voxel represents a signal, they try to find all signals having high
correlation with the seed voxel signal. After finding all correlated signals, they consider those in
a cluster and a network in the brain is achieved. (Bellec, 2010) (Liu et al., 2008)

13
Figure 5 Resting-state fMRI studies are focused on measuring the correlation between spontaneous activation patterns of brain regions. (Heuvel et al., 2010)
Another approach which is useful to study resting-state fMRI data is called graph analysis. A
graph including its clustering-coefficient and connectivity degree, etc. is formed and with the
help of this graph, the networks in the brain could be found. According to (Heuvel, 2010) several
networks such as primary motor, primary visual, extra-striate visual and insular-temporal/ACC
have been found by using the above mentioned approaches.
To summarize, “Functional connections of resting-state networks is related to structural white
matter connections suggesting a structural core of functional connectivity networks in the brain”.
(Heuvel, 2010)
Figure 6 Resting-state networks. A number of group resting-state studies have consistently reported the formation of functionally. (Heuvel et al., 2010)

14
3.5 Functional Brain Imaging and Multimodalities
Medical imaging by single modality could provide information needed for a diagnosis but the
concept of the combination of two modalities in order to have more information, have been
practically done from the past. For instance, although a patient is imaged by different modalities
in different places, the diagnosis is performed by studying of all results. Thus, the idea of dual
modality (hybrid modality) could be realized, especially when a combination of structural and
functional imaging data were needed to lead to a better interpretation. (David W. Townsend,
2008)
Several problems exist which avoids the multi-modality imaging system to be performed ideally.
The major problem is the difference between temporal resolutions of modalities which has to be
combined. Other software limitations such as image fusion and hardware restrictions are still a
challenge in this area. Hopefully, lots of experiences have been done in dual modality and some
of them are commercialized nowadays. Table 1 illustrates several imaging (non-imaging)
systems used in hybrid modalities. (Arno Villringer, 2010)

15
Table 1 Technical feasibility of simultaneous multimodal imaging (Arno Villringer, 2010)

16
4 Functional Brain Imaging – Optical Approach
4.1 Introduction
It has been a long history since optical method was first used to capture functional activities in
brain (F. F. Jobsis et al., 1977) (R. Y. Tsien et al., 1981). After thirty years of development, now
it is able to perform non-invasive, three dimensional functional optical imaging of human brain
or in vivo in living animal brain tissues. Functional optical brain imaging carries significant
importance for understanding the physiological basis of neuron activities, because of its high
temporal resolution and high sensitivity that other well-established clinical imaging modalities
cannot provide. PET can provide 3-D image using fluorodeoxyglucose (FDG) labeled with
radioactive isotope. However both spatial and temporal resolution is low. CT is able to provide
high resolution image with fast data acquisition, but typically it cannot obtain functional
information of the tissue. Functional MRI (fMRI) using the blood oxygen level dependent
(BOLD) signal has been through significant development in recent years. However, the
achievable temporal resolution is still limited by its long data acquisition time. Besides, optical
imaging does not depend on ionizing radiation, has substantially lower infrastructure costs, and
require minimum footprint and maintenance.
Functional optical brain imaging can be either invasive or non-invasive. High resolution brain
imaging requires direct exposure to laser light, such as multi-photon fluorescent microscopy (W.
Denk et al., 1990), which has been widely adopted in animal neuron imaging researches. Non-
invasive imaging generally refers to functional near-infrared spectroscopy (fNIRS), which
detects the hemodynamics in brain tissues. It has provided useful complimentary information to
clinical studies such as cognitive activity (P. M. Arentha et al., 2007), Alzheimer’s disease (M.
Ferrari et al., 2012) (C. Hock et al., 1996) (F. Irania et al., 2007) , stroke (G. Strangman et al.,
2006)[ (L. A. Nelson et al., 2006)] and birth asphyxia (J. S. Wyatt et al., 1989) [ (F. van Bel et
al., 1993) (M. C. Toet et al., 2009) etc. The major problem for 3-D optical imaging is scattering,
which has limited the achievable image quality and the penetrable depth. As a result, most
optical brain imaging studies have been limited in the brain cortex.

17
4.2 Microscopic Functional Imaging
Microscopic study of neuron networks provides basic yet significant understanding of cellular
and molecular activities in the brain. Analyzing the neural circuits in vivo helps develop network
topologies that give us fundamental information about their interactions and functionalities.
Two-photon microscopy has caught much attention since it was first invented in 1990 (W. Denk
et al., 1990), a few years after the invention of Ti-sapphire laser in the early (P. F. Moulton et al.,
1986). Instead of exciting the fluorophores at visible wavelength, the two photon microscope
utilizes femtosecond laser at near infrared wavelength to complete excitation via two photon
absorption, which is a third-order nonlinear optical process. As a result, only the fluorophores at
the focal point of the beam can be excited. 3-D scanning can be realized by adding galvo mirrors
or acoustic optical deflectors (AODs) in the optical assembly. Since the infrared light can
penetrate into tissues with lower scattering, and its wavelength is well apart from the fluorescent
wavelength, the two photon microscope is able to provide 3-D image with unprecedented high
spatial resolution. Figure 1 shows the schematic structure of the microscope. Over the past
decade, two-photon microscopy has become a well-established method for in vivo optical
neuroimaging (F. F. Jobsis et al., 1977) (K. Ohki et al., 2006) (M. Zonta et al., 2003) (T. Takano
et al., 2006)
Figure 7 Super-resolution fluorescent microscopy (Brian A.Wilt et al., 2009)

18
Intracellular calcium ion concentration is closely linked to many cellular functions. Functional
imaging in vivo can be achieved by use of membrane-permeable calcium sensitive dyes such as
Oregon Green 488 BAPTA-1 acetoxymethyl ester (K. Ohki et al., 2006) (R. Cossart et al.,
2005). The dye is injected via a pipette, and delivered into interested area. After diffusing into
the cell, it is hydrolyzed by endogenous esterase and stays inside the cell, while the remaining
extracellular dye is gradually washed out. It results in a uniform staining of all cells in the field
of view. This method is called the multi-cell bolus loading (MCBL) technique, by which means
Scanning
Module
Ti: Sapphire
Femtosecond Pulse
Oscillator
Power Amplifier Femtosecond Laser
Module
Wavefront Correction
Module High Precision
Optical Microscope
Camera or PMT
Figure 8 Schematic diagram of a two photon fluorescent scanning microscope.

19
fluorescent observations can be performed in intact cortical neuron cells. An example of two
photon microscope image of neuron ensembles is shown in Figure 7.
In order to capture fast dynamics and large area imaging, fast scanning technique is applied. One
of the most interested techniques is by employing AOD pairs (A. Bullen et al., 1997). By
propagating sound waves through an optical crystal, AOD works as a tunable light deflector, and
by changing the frequency of the acoustic waves, it steers the laser beam in one dimension. By
orthogonally stacking multiple AODs, it can provide 3-D scanning abilities (G. D. Reddy et al.,
2008). Comparing with mechanical scanning components such as galvo mirrors, AOD scanner
has higher operating frequency, and can provide random access to the spot of interest.
(a) (b)
(c) (d)
Figure 9 (a) The MCBL method for neuron cell staining (O. Garaschuk, 2006) (b) Typical Ca2+ and hemodynamic response of a neuron cell after stimulation (E. M. C. Hillman et al., 2007). (C) and (d). In vivo
Ca2+ transients in mouse visual cortex, the circle in (c) marks the area of glutamate stimuli

20
As shown in Figure 8, by employing the state-of-the-art technology, multiscale automated
scanning microscopy can be realized in a large area and over several days of continuous
observation.
Researches have been done in disease models by two photon calcium imaging, such as
Alzheimer’s disease (AD), stroke, ischemia, hypoxia and epilepsy (N. L. Rochefort et al., 2008).
Although the cause and progression of AD remains not well understood, it is believed that the
senile plaques and neurofibrillary tangles are associated with the disease (P. Tiraboschi et al.,
2004). The beta amyloid (Aβ) can be fluorescent labeled in vivo, and by imaging Aβ and the
neurons simultaneously, it is possible to study the toxicity of Aβ plaque and the evolution of
neuronal damage (M. Meyer-Luehmann et al., 2008)Researches show that glial cells are also
strongly involved in the development of AD. In vivo imaging of calcium signaling has shown
abnormal astrocyte activity and instability at the early stage of the disease, before the onset of Aβ
plaque deposition (M. Meyer-Luehmann et al., 2008).
Figure 10 Automated and multiscale fluorescent microscopy (B. A.Wilt et al., 2009) (a) Automated microscopy. (b). Multiscale microscopy. (c). Array tomography. (d). All-optical histology.

21
4.3 Non-invasive Functional Imaging
Hemoglobin is the most significant contributor to light absorption in brain. Since oxy- and
deoxyhemoglobin (HbO2 and HbR) possess unique and distinctive absorption spectra at visible
and near infrared wavelength (Figure 4), its dynamics can be measured by spectroscopy.
Functional activities in brain are closely correlated with cerebral blood flow, blood volume and
oxygenation. As a result, brain functions can be captured by analyzing the spectra of
hemodynamic response.
Infrared light is preferable for spectroscopy because of its lower scattering rate in the tissue. And
to determine HbO2, HbR and Hb total (HbT) signal respectively, two or more wavelengths must
be used simultaneously. Calculation of HbO2, HbR and HbT concentration can be done by
applying the Beer-Lambert law, while the effect of light scattering must be taken into
consideration (M. Kohl et al., 2000). Because of the scattering, photons have traveled different
distances before collected by the detector. Most photons traveled through very superficial layers
of the cortex, while few of them has penetrated deeply into the brain tissue and returned. The
differential pathlength factor (DPF) is used to describe this differential attenuation effect. Light
with different wavelengths possess different DPF, and it should impact the accuracy of the result
when multiple wavelengths are used.
Comparing with other functional imaging modalities, fNIRS has demonstrated its unique
usefulness. EEG has high temporal resolution, but it is difficult to determine the spatial location
of the signal source. PET and fMRI provides excellent spatial resolution, but the data acquisition
time is long. fNIRS is somewhat in between. It can acquire data rapidly with hundreds of Hertz
frequency, and generate three dimensional spatial pictures combined with tomosynthesis,
although without the ability to provide anatomical structures. For infants, PET and fMRI are not
well suited because of the radiation risk and artifact cause by patient movement. Infrared light
can penetrate through the skin and skull of a baby much easier than an adult, which also makes
fNIRS an ideal method for functional brain imaging of awake infants (Figure 9). In addition,
fNIRS is able to record brain reactions to auditory stimuli, which is impossible in fMRI.

22
Although both BOLD fMRI and fNIRS are designated to detect hemodynamic signals,
researches have revealed certain discrepancies. One most debated phenomenon is the “initial
dip” (D. Malonek et al., 1996). Local HbR concentration increases in a short time after
stimulation, before it enters a substantial decrease. One possible explanation for this transient
change is that local HbO2 is converted to HbR quickly after activation, before it is replenished
from blood flow. However, this dip is only seen in a few BOLD fMRI and many optical studies
(R. S. Menon, 1995), which suggests that it is related to the specific experimental conditions
such as object species, stimuli type, and measurement parameters etc.
(b)
(d) (c)
(a)
Figure 11 Absorption spectra of HbO2, HbR and HbT at (a) visible and (b) near infrared wavelength. Light scattering and water absorption curves are also shown. (c). Schematic of non-invasive fNIRS functional brain imaging and its application on an infant (d) (E. M. C. Hillman et al., 2007)

23
4.4 Co-Registered fMRI and fNIRS
Although both fMRI and fNIRS targets the hemodynamic response, they are based on different
physics principles and possess different advantages. Because fNIRS cannot provide anatomical
references, co-registering with MRI is preferred, which helps in localizing the signal source.
Figure 5 shows an example of a 3-D functional fNIRS mapping fused with MRI image. It is also
suggested that fNIRS is best to be correlated with fMRI signals (M. Ferrari et al., 2012). BOLD
fMRI signal reflects dynamic changes of deoxy-hemoglobin concentration. However, this change
may result from either an increase in oxygenation or a decrease in blood volume, which could be
caused by various physiological conditions. By correlating fNIRS results with fMRI, it provides
better calibration and leads to more accurate interpretations to the measurement.
Figure 12 Co-registered functional brain imaging by fMRI and fNIRS, showing good signal correlation (H. Tsunashima et al., 2009)

24
5 Conclusion
We have briefly reviewed the fundamental principles of functional brain imaging by two photon
microscopy and near infrared spectroscopy. Optical imaging technology has gone through
dramatic development in recent years. Multiphoton fluorescent microscopy in vivo has led to
many ground breaking understanding of neuron activities, while fNIRS has done remarkable
accomplishments in clinical researches, especially on infants. Future development in
instrumentation, data analysis and multimodality methods should open more opportunities for
functional optical imaging, and provide promising research tools for both laboratory and clinical
applications.

25
List of Figures
Figure 1 Neurovascular coupling (Toga, 2012) ............................................................................................ 4
Each modality is categorized by the ability to define brain functionality based on detectable range in
space and time. Modalities located near the bottom of Figure 2 have better spatial resolution than those at
the top while methods situated at the left of figure show better temporal resolution. Therefore, modalities
such as EEG, MEG and TMS demonstrate a good temporal resolution while functional MRI and PET,
have seconds and minutes temporal resolution. (Richard D. Lane, 2009) .................................................... 5
Figure 3 Comparison of conventional and Synthetic Contrast MRI. T2-weighted, T2-weighted FLAIR
and T1-weighted post-Gd contrast of the same slice. The first row was acquired conventionally, the
second row has been synthesized (J.B.M. Warntjes, 2009) ........................................................................ 10
Figure 4 Framework above shows the different phases of pre-processing of fMRI data ........................... 12
Figure 5 Resting-state fMRI studies are focused on measuring the correlation between spontaneous
activation patterns of brain regions. (Heuvel et al., 2010) .......................................................................... 13
Figure 6 Resting-state networks. A number of group resting-state studies have consistently reported the
formation of functionally. (Heuvel et al., 2010) ......................................................................................... 13
Figure 7 Super-resolution fluorescent microscopy (Brian A.Wilt et al., 2009) .......................................... 17
Figure 8 Schematic diagram of a two photon fluorescent scanning microscope. ....................................... 18
Figure 9 (a) The MCBL method for neuron cell staining (O. Garaschuk, 2006) (b) Typical Ca2+ and
hemodynamic response of a neuron cell after stimulation (E. M. C. Hillman et al., 2007). (C) and (d). In
vivo Ca2+ transients in mouse visual cortex, the circle in (c) marks the area of glutamate stimuli ........... 19
Figure 10 Automated and multiscale fluorescent microscopy (B. A.Wilt et al., 2009) (a) Automated
microscopy. (b). Multiscale microscopy. (c). Array tomography. (d). All-optical histology. .................... 20
Figure 11 Absorption spectra of HbO2, HbR and HbT at (a) visible and (b) near infrared wavelength.
Light scattering and water absorption curves are also shown. (c). Schematic of non-invasive fNIRS
functional brain imaging and its application on an infant (d) (E. M. C. Hillman et al., 2007) ................... 22
Figure 12 Co-registered functional brain imaging by fMRI and fNIRS, showing good signal correlation
(H. Tsunashima et al., 2009) ....................................................................................................................... 23

26
Bibliography
A. Bullen et al., S. S. (1997). High-speed, random-access fluorescence microscopy: I. High-resolution
optical recording with voltage-sensitive dyes and ion indicators . Biophys. J. 73, 477.
Arno Villringer, C. M. (2010). EEG–fMRI. Verlag Berlin Heidelberg: Springer .
B. A.Wilt et al., L. D. (2009). Advances in light microscopy for neuroscience . Annu. Rev. Neurosci. 32,
435.
Bellec, P. (2010). Multi-level bootstrap analysis of stable clusters in resting-state fMRI. NeuroImage 51,
1126–1139.
Brian A.Wilt et al. (2009). Advances in Light Microscopy. Annu.Rev.Neurosci. 32,, 435.
C. Hock et al., K. V. (1996). Near Infrared Spectroscopy in the Diagnosis of Alzheimer's Disease . Annals
of the New York Academy of Sciences 777, 22 .
D. Malonek et al., a. A. (1996). Interactions between electrical activity and cortical microulation revealed
by imaging spectroscopy: implications for functional brain mapping. Science 272, 551.
David W. Townsend. (2008). Dual-Modality Imaging: Combining Anatomy and Function. THE
JOURNAL OF NUCLEAR MEDICINE Vol. 49 • No. 6, 938-955.
Donald C. Johanson et al., B. E. (2006). From Lucy To Language. Simon and Schuster.
Donald C. Johanson, B. E. (2006 ). From Lucy To Language. Simon and Schuster.
E. M. C. Hillman et al. (2007). Optical brain imaging in vivo: techniques and applications from animal to
man. J. Biomed. Opt. 12, 051402.
Ernest Niedermever, F. L. (2004 ). Electroencephalography: Basic Principles, Clinical Applications, and
Related Fields. Lippincott Williams & Wilkins.
F. F. Jobsis et al. (1977). Noninvasive, infrared monitoring of cerebral and myocardial oxygen sufficiency
and circulatory parameters. Science 198, 1264.
F. Irania et al., S. M. (2007). Functional Near Infrared Spectroscopy (fNIRS): An Emerging
Neuroimaging Technology with Important Applications for the Study of Brain Disorders. The
Clinical Neuropsychologist 21, 9 .
F. van Bel et al., C. A. (1993). Changes in Cerebral Hemodynamics and Oxygenation in the First 24
Hours After Birth Asphyxia . Pediatrics 92, 365 .
G. D. Reddy et al., K. K. (2008). Three-dimensional random access multiphoton microscopy for
functional imaging of neuronal activity . Nat. Neurosci. 11, 713 .
G. Strangman et al., R. G. (2006). Nearinfrared spectroscopy and imaging for investigating stroke
rehabilitation: test-retest reliability and review of the literature. Arch. Phys. Med. Rehabil. 87, 12 .

27
Giorgio Carmignoto, M. G.-G. (2010). The contribution of astrocyte signalling to neurovascular coupling.
BRAIN RESEARCH REVIEWS 63, 138 – 148.
Goetz, C. (2007). Textbook of Clinical Neurology. 3rd Edition, Saunders,.
H. Tsunashima et al., a. K. (2009). Measurement of brain function of car driver using functional near-
infrared spectroscopy (fNIRS). Comput. Intell. Neurosci. , 164958 .
Harrison, C. (1999). Single photon emission computed tomography and its use in neuroimaging. Clinical
Eye and Vision Care, 139-147.
Heuvel et al., M. P. (2010). Exploring the brain network: A review on resting-state fMRI functional
connectivity. European Neuropsychopharmacology, 519–534.
Heuvel, M. P. (2010). Exploring the brain network: A review on resting-state fMRI functional
connectivity. European Neuropsychopharmacology, 519–534.
Huettel, S. A. (2004). Functional Magnetic Resonance Imaging. Sunderland, Massachuesetts, USA:
Sinauer Associates, Inc.
J. S. Wyatt et al., A. D. (1989). Cerebral Heamodynamics During Failure of Oxidative Phosphorylation
Following Birth Asphyxia . Pediatric Research 26, 511 .
J.B.M. Warntjes, C. S. (2009, October 23). Magnetic Resonance Imaging of the future will show brain
structures automatically in PACS. Retrieved April 19, 2012, from
http://newsroom.sectra.com/2009/10/magnetic-resonance-imaging-of-the-future-will-show-brain-
structures-automatically-in-pacs/
K. Ohki et al., S. C. (2006). Highly ordered arrangement of single neurons in orientation pinwheels .
Nature 24, 925 .
Kiendys, U. (2009). F-18 fl uorodeoxyglucose (FDG) positron emission tomography (PET)-positive
parotid incidentaloma: Prevalence and clinical signifi cance. Reports in Medical Imaging, 1–6.
Kim, S.-G. (1997). Functional Magnetic Resonance Imaging of Human Brain. Neuroscience Methods,
229-243.
L. A. Nelson et al., J. C. (2006). Development and validation of a multiwavelength spatial domain near-
infrared oximeter to detect cerebral hypoxiaischemia . J. Biomed. Opt. 11, 064022.
Lauronena, L. (2011). Magnetoencephalography in neonatology. Clinical Neurophysiology, 27-34.
Liu et al., Y. (2008). Regional homogeneity, functional connectivity and imaging markers of Alzheimer’s
disease: A review of resting-state fMRI studies. Neuropsychologia 46, 1648–1656.
M. C. Toet et al., P. M. (2009). Brain monitoring in neonates . Early Human Development 85, 77 .
M. Ferrari et al., a. V. (2012). A brief review on the history of human functional near-infrared
spectroscopy (fNIRS) development and fields of application. Brain and Language 121, 79 .

28
M. Kohl et al., U. L. (2000). Physical model for the spectroscopic analysis of cortical intrinsic optical
signals. Phys. Med. Biol. 45, 3749 .
M. Meyer-Luehmann et al., T. L.-J.-A.-T. (2008). Rapid appearance and local toxicity of amyloid-
plaques in a mouse model of Alzheimer's disease. Nature 451, 720.
M. Zonta et al., M. C. (2003). Neuron-to-astrocyte signaling is central to the dynamic control of brain
microcirculation. Nat. Neurosci. 6, 43 .
Morano, G. N. (December 2003). Technical Overview of Brain SPECT Imaging. JOURNAL OF
NUCLEAR MEDICINE TECHNOLOGY, 191-195.
N. L. Rochefort et al., H. J. (2008). Calcium imaging in the living brain: prospects for molecular medicine
. Trends in Molecular Medicine 14 , 389 .
O. Garaschuk, R. M. (2006). Targeted bulk-loading of fluorescent indicators for two-photon brain
imaging in vivo . Nat Prot 1, 380 .
P. F. Moulton et al. (1986). Spectroscopic and laser characteristics of Ti:Al2O3. J. Opt. Soc. B 3, 125 .
P. M. Arentha et al., J. H. (2007). Applications of Functional Near-Infrared Spectroscopy (fNIRS) to
Neurorehabilitation of Cognitive Disabilities . The Clinical Neuropsychologist 21, 38 .
P. Tiraboschi et al., L. A.-B. (2004). The importance of neuritic plaques and tangles to the development
and evolution of AD”, . Neurology 62, 1984.
Peter E. Valk. (2006). Positron Emission Tomography Clinical Practice . Springer.
R. Cossart et al., Y. I. (2005). Calcium imaging of cortical networks dynamics . Cell Calcium 37, 451 .
R. S. Menon, S. O. (1995). BOLD based functional MRI at 4 Tesla includes a capillary bed contribution:
echo-planar imaging correlates with previous optical imaging using intrinsic signals. Nat.
Neurosci. 33 , 453 .
R. Y. Tsien et al. (1981). A non-disruptive technique for loading calcium buffers and indicators into cells.
Nature 290, 527 .
Richard D. Lane. (2009). The Rebirth of Neuroscience in Psychosomatic Medicine, Part I: Historical
Context, Methods, and Relevant Basic Science. Psychosomatic Medicine 71, 117–134.
Saman Hossein Sarraf, Ehsan Marzbanrad, Hamid Mobedi, Mohammad Rafienia,Hamid
Mirzadeh,Ahmad Jamshidi. (2009). SIMULATION OF BETAMETHASONE RELEASE
PROFILES FROM IN SITU FORMING SYSTEMS BASED ON PLGA. 32nd Conference of the
Canadian Medical and Biological Engineering Society (CMBEC32). Calgary, Alberta.
Saman Sarraf , Ehsan Marzbanrad , Hamid Mobedi. (2014). Mathematical Modeling for Predicting
Betamethasone Profile and Burst Release From In Situ Forming Systems Based On PLGA.
Electrical and Computer Engineering (CCECE), 2014 IEEE 27th Canadian Conference on.
Toronto.

29
Saman Sarraf, Cristina Saverino, Halleh Ghaderi, John Anderson. (2014). Brain network extraction from
probabilistic ICA using functional Magnetic Resonance Images and advanced template matching
techniques. Electrical and Computer Engineering (CCECE), 2014 IEEE 27th Canadian
Conference. Toronto.
Saman Sarraf, Raghda Hasswa, Carol Dematteo, John Connolly, and Michael D. Noseworthy. (2013).
Resting-State fMRI Data Classification of Exercise-Induced Brain Changes in Healthy Subjects
Using Probabilistic Independent Component Analysis (PICA). Researchgate.
Sarraf, S. H., Marzbanrad, E., Mobedi, H., Rafienia, M., Mirzadeh, H., Jamshidi, A. (2009). Simulation
Of Betamethasone Release Profiles From In Situ Forming Systems Based On Plga. Canadian
Medical and Biological Engineering Society (CMBEC32). Calgary, Alberta.
Stephen C. Strother, Saman Sarraf, Cheryl Grady. (2014). A Hierarchy of Cognitive Brain Networks
Revealed by Multivariate Performance Metrics . Signals, Systems and Computers, 2014 48th
Asilomar Conference. Asilomar .
T. Takano et al., G. T. (2006). Astrocyte-mediated control of cerebral blood flow . Nat. Neurosci. 9, 260 .
Toga et al., A. W. (2002). Brain Mapping The Methods. Academic Press.
Toga et al., A. W. (2012, April 15). Neurovascular coupling and imaging techniques. Retrieved from
Laboratory of neuro imaging UCLA: http://www.loni.ucla.edu/SVG/index.php?vid=261
Toga, A. W. (2012, April 15). Neurovascular coupling and imaging techniques. Retrieved from
Laboratory of neuro imaging UCLA: http://www.loni.ucla.edu/SVG/index.php?vid=261
W. Denk et al., J. H. (1990). Two-photon laser scanning fluorescence microscopy . Science 248, 73 .
Ward, J. (2006 ). The Student's Guide to Cognitive Neuroscience. Psychology Press.
Warsi, M. A. (2012). The Fractal Nature and Functional Connectivity of Brain Function as Measured by
BOLD MRI in Alzheimer’s Disease. Hamilton: macsphere.mcmaster.ca.