Functional Allocation Issues and Tradeoffs (FAIT) Analysis ...
192
FAIT analysis of SVS 1 Functional Allocation Issues and Tradeoffs (FAIT) Analysis of Synthetic Vision Systems (SVS) John Uhlarik, Ph.D. Christina M. Prey Kansas State University This document was prepared for the 2001 Human Error Modeling element of the NASA Aviation Safety Program System Safety Technologies
Transcript of Functional Allocation Issues and Tradeoffs (FAIT) Analysis ...

FAIT analysis of SVS 1
Functional Allocation Issues and Tradeoffs (FAIT) Analysis ofSynthetic Vision Systems (SVS)
John Uhlarik, Ph.D.Christina M. Prey
Kansas State University
This document was prepared for the 2001 Human Error Modeling element of the NASAAviation Safety Program System Safety Technologies

FAIT analysis of SVS 2
Abstract
Synthetic Vision displays provide a computer-generated view of terrain surrounding the
aircraft during all phases of flight. This would allow pilots to have a clear view of the
surrounding environment, similar to Visual Meteorological Conditions, regardless of
weather. By increasing the pilot’s situation awareness, synthetic vision systems aim to reduce
Controlled Flight into Terrain (CFIT) accidents, as well as allow flight in low visibility
conditions. The current research was conducted using a Functional Allocation Issues and
Tradeoffs (FAIT) analysis (Riley, 1993). This method serves to identify human factors issues
in human-machine systems by identifying characteristics of the system, tradeoffs between
these characteristics, as well as potential sources of error within the system. Using the FAIT
analysis, highly influential and sensitive characteristics were identified. These are
characteristics which are critical to the functioning of the system. Also, 35 potential tradeoff
situations were identified, and four scenarios were written for each. Error scenarios, which
were written from an abbreviated matrix containing only highly influential and sensitive
characteristics, were also developed. These scenarios document a variety of situations in
which an error is likely to occur. The majority of issues relevant to the SVS considered for
this analysis appear to be training issues, which suggests that many errors within the system
could be mitigated with proper training. The current research gives specific recommendations
of what training should be focused on. The majority of training issues were identified in the
“Machine-Operator” category, which suggests that funds may be best spent on display design
in order to reduce potential errors when using the SVS. This analysis should serve to identify

FAIT analysis of SVS 3
human factors bottlenecks within the system, and scenarios generated can be used to in future
simulations to identify error, and ensure the safety of the SVS.
Synthetic Vision Systems
In response to several high-visibility commercial transport accidents, the white house
established a Commission on Aviation Safety and Security in August 1996. The following
year, President Clinton announced a national goal to reduce the aviation fatal accident rate by
80% in ten years. In response to this goal, NASA created the Aviation Safety Program. An
element of this program is the Synthetic Vision Systems (SVS) project, which is designed to
increase safety in low visibility conditions.
The SVS would provide a computer-generated view of the terrain surrounding the
aircraft, which is based on static geographical data provided by digital elevation maps
(DEM’s) or digital terrain elevation data (DTED), and a global positioning system (Williams,
Waller, Burdette, Doyle, Capron, Barry & Gifford, 2000). This technology has also been
made possible by NASA’a Shuttle Radar Topography Mission (SRTM), which successfully
mapped 80% of the earth’s land surfaces for SVS en route requirements (99.96% of land
between 60° N. and 56° S. latitude). This artificial view of the terrain would allow pilots to
have a clear view of the external environment regardless of current weather conditions,
which would allow flight in near zero visibility conditions. SVS would be useful in all phases
of flight, including departure, en route, approach, landing, and taxi (Williams et al. 2000).
Although SVS may make flight in zero/zero conditions (Category IIIc) possible, the current
focus at this time is to make flight possible in “low visibility” (Category IIIb or better)

FAIT analysis of SVS 4
conditions (Williams, 2000). This would reduce the required Runway Visual Range (RVR) to
300 feet.
Objectives of the SVS Project
For the remainder of this paper, Synthetic Vision Systems will be discussed as they
apply to commercial and business aircraft, considering that currently this is the market that
synthetic vision systems are designed for. The general objective of SVS is “…to develop
cockpit display systems with intuitive visual cues that replicate the safety and operational
benefits of flight operations in clear-day Visual Meteorological Conditions” (Williams, et al.
2000). In other words, the SVS would allow adherence to Visual Flight Rules (VFR) in
Instrument Meteorological Conditions (IMC).
Other specific objectives of SVS include developing affordable, certifiable, display
configurations, which provide pilots with an intuitive view of the external environment as
well as intuitive obstacle detection (Williams, 2000). SVS is also designed to reduce
Controlled Flight into Terrain (CFIT) accidents, a leading cause of fatality in aviation each
year. CFIT is was the cause of 36.8% of accidents, and 53.6% of fatalities from 1988 to 1993
in the commercial sector. CFIT accidents were also to blame for 30% of General Aviation
accidents in the United States. These accidents frequently occur in the approach phase of
flight, and could be mitigated if the pilot had a clear view of terrain surrounding the
destination airport. In addition to CFIT accidents, SVS should also reduce accidents in the
landing phase of flight, runway incursion accidents, mid-air accidents, and rejected take-off
accidents.

FAIT analysis of SVS 5
SVS are also proposed to aid in aircraft navigation by providing guidance cues and
highlighting terrain and obstacle information (Williams). Using GPS and databases that
provide information about the surrounding terrain, pertinent obstacles, and target airports,
SVS would aid in the approach and landing phase of flight, as well as airport surface
navigation. Because some major airport taxi-ways are extremely complicated, SVS would
allow the pilot flying (PF) to highlight the correct path, as well as other ground traffic, and
target structures such as gates and deicing facilities.
Description of SVS
It is important to note that the SVS used for the current analysis did not include all
proposed features of SVS listed above. Because synthetic vision systems are not currently in
common use, there is no single defined system on which to conduct an analysis. Therefore,
this section will provide a general description of all technology proposed for SVS, and will
then give an explanation of the SVS used for the current analysis.
The main element of the SVS is the virtual visual environment, which mimics what
could be seen out-the-window in optimal visibility conditions. Although Head-Up Display
(HUD) versions have been suggested, the SVS is currently depicted on a Head-Down
Display (HDD) (Comstock, Glaab, Prinzel & Elliot, 2001). This display will most likely be
757 EADI (5 x 5.25 in.), 777 PFD (6.4 x 6.4 in.) or a rectangular flat-panel (8 x 10 in.). This
display would use either a photo-realistic format, a less detailed terrain texture, or a wire-
frame rendering in which a “fish-net” appears to overlay surrounding terrain (Williams,
2000). While viewing surrounding terrain, pilots will most likely have access to four Field of
Views (FOV), which would be pilot selectable. The SVS display is also proposed to highlight

FAIT analysis of SVS 6
salient features of the external environment, which are critical to safe operation of the
aircraft, even in optimal visibility conditions. In addition to these highlighted features, the
SVS would also have the capability to accurately depict the location of the aircraft in
relationship to other features on the display (Williams, 2000). Ground traffic, surface
vehicles, obstacles such as buildings and towers, target structures such as gates or deicing
facilities, may also be displayed via the SVS (Williams, 2000). However, varying structures,
such as ground traffic and surface vehicles, or newly built structures, which would not be in
the terrain database, would be detected through an externally mounted sensor. Although
weather and turbulence information will probably not be incorporated into the display in the
near future, wake turbulence protection may be provided through detection using NASA’s
Aircraft Vortex Spacing System (AVOSS) (Williams, 2000).
Primary Flight Display (PFD) information would be overlaid on the SVS display and
would include vertical speed, velocity vector, and location of ownship with respect to
navigation fixes (Williams, 2000). Flight path navigation would be enabled by the GPS.
Waypoints would most likely be overlaid on the SVS, and a highway in the Sky (HIS) could
be used in the form of “boxes” which the pilot flies through, or “stripes” which the pilot flies
over, in order to guide the pilot along the flight path. A follow-me-airplane may also be used
for additional guidance information. Enhanced flight information such as taxi-maps, and taxi-
path aids may also be include on the SVS display. It is also possible that the SVS would have
Airborne Information for Lateral Spacing (AILS) display capability or self-spacing
algorithms, assuming that traffic information is displayed. In the future, SVS may be able to

FAIT analysis of SVS 7
provide pro-active decision making information to support self-separation, curved IMC
approaches, and noise abatement procedures.
The externally mounted sensor is proposed to either use conventional radar, Forward
Looking Infrared Radar (FLIR), or possibly MiliMeter Wave Radar (MMWR) (Williams,
2000). The sensor could also be an imaging sensor, such as a video camera. It is possible that
this sensor would detect ground and air traffic in close proximity, construction areas, newly
built structures, and wildlife. Information from the sensor and from terrain databases would
be automatically blended to produce one image. In this way, the sensor could be used for
database integrity monitoring.
Description of the SVS Used for the Current Analysis
As mentioned above, SVS is not currently in common use in commercial, transport,
or general aviation aircraft, and there is therefore no single defined system. Instead, as is
evident in the above description of SVS, many elements to be incorporated into the system
have been proposed. In light of this fact, and because of limited availability of information
regarding current SVS, this analysis used a somewhat simplified version of a SVS.
The current research focused on a basic synthetic vision display in which an artificial
view of the terrain is overlaid on a PFD (see Appendix A). For our uses, this virtual visual
environment was assumed to mimic what could be seen out the window in clear weather
conditions. We assumed that this display would use one of three pictorial scene information
densities. These densities were photo-realistic, less detailed texture, or wire-frame rendering.
It was also assumed that the display was head-down, and was one of the three possible sizes
mentioned in the previous section (757 EADI, 777 PFD, or Rectangular Flat Panel). The SVS

FAIT analysis of SVS 8
used for this analysis was assumed to have four possible FOV that were pilot selectable. The
pilot would also have the option of decluttering the display by using some type of “declutter
button” such as that defined by Norman and Hughes (2001). There would also be and
auditory or visual alert which warned the pilot of immanent collision with terrain. PFD data
would be overlaid on the SVS display, and this would not be selectable. PFD data would
include altitude, airspeed, ground speed, attitude, vertical speed, velocity vector, and location
with respect to navigation fixes. Obstacles in proximity of ownship, runway edges, and other
salient features would be depicted via terrain databases. For the purposes of this analysis an
externally mounted sensor was not considered. Therefore, objects such as newly built
structures, ground vehicles and other traffic, wildlife; etc. would not be depicted. Also,
guidance information such as a highway-in-the-sky, and a follow-me-airplane, were also not
considered. When looking at the following analysis it is important to keep in mind this
simplified version of the SVS. This analysis identifies basic human factors issues and
bottlenecks, and is not intended to be an exhaustive analysis of all possible elements of SVS.
Note that all characteristics associated with the SVS used in this analysis are stable
except for display size, pictorial scene information density, and type of alert. These particular
characteristics can be of several types, and all will be considered.
Goal of the Current Analysis
The current research was conducted using a Functional Allocation Issues and Tradeoffs
(FAIT) analysis (Riley, 1993). This analysis can be thought of as a task analysis, but one that
produces more output than traditional task analyses (Comerford & Uhlarik, 2000). Using this
method as an early front-end analysis allows one to systematically identify human factors

FAIT analysis of SVS 9
issues in human-machine systems. In this way, the analysis allows the user to identify
important characteristics of the system in question, tradeoffs between these characteristics, as
well as potential sources of error within the system.
Overview of the FAIT Analysis
The FAIT analysis is designed to answer six basic questions (Riley, 1993): 1.) what human
factors issues are relevant to the system under consideration? 2.) what types of requirements
need to be written to address human factors issues? 3.) what are all the possible sources of
and consequences of error in the system? 4.) what types of information should the operator
have available to prevent, detect, or recover from errors? 5.) what are the most important
characteristics of the system from a human factors perspective? 6.) what tradeoffs need to be
made in the development of the system? In order to answer these questions, the user carries
out three basic tasks. First, a general human-machine model is used along with taxonomy of
autonomy and intelligence in order to create a model of information flow for the system
under consideration. This information flow model consists of relevant sections of the general
model provided by Riley (1993) (see Figure 1). Next, the information flow model is used to
create a list of characteristics for the system. Characteristics are developed for each node in
the model and are relevant to the environment in which the system functions, the machine
itself, and the human operator. Last, pairwise comparisons are made between characteristics
to determine how the characteristics interact during real-time operations of the system.
The FAIT analysis is useful for analysis of a synthetic vision system because it can be
used on systems that have not been implemented, such as SVS. While typical analyses
narrow the problem down, the FAIT analysis opens the problem up by identifying concrete

FAIT analysis of SVS 10
physical characteristics of the machine, as well as more abstract characteristics, and
psychological constructs relevant to the human-machine interface such as situation awareness
and mental workload. The FAIT analysis also yields numerical values that represent the
relative influence and sensitivity of these characteristics. In this way, the FAIT analysis
provides a variety of useful information. Also, previous applications of the FAIT analysis to
AILS and CDTI (Cockpit Display of Traffic Information) have identified many human
factors issues as well as error and tradeoff scenarios that can be used for a variety of
applications (Uhlarik & Comerford, 1999, Comerford & Uhlarik, 2000).
Preliminary Step
In the preliminary step, the user defines relevant components of the SVS system, the human
user and the environment in which the system will be implemented (see Appendix A). The
environment considered for this analysis was the approach and landing phases of flight.
Although the SVS is capable of supporting all phases of flight, we will be focusing only on
approach and landing because these are the most complex phases of flight and therefore have
the potential for many human factors issues to arise. With respect to the human component of
the SVS system, only the pilot flying (PF) was considered. However, pilots of other aircraft,
as well as other crew member will occasionally be considered to the extent with they affect
the PF. The particular SVS system used in this analysis is defined in the above section titled
“Description of the SVS Used for the Current Analysis”.
Step One: A Model of Information Flow
In order to develop a model of information flow within the SVS, one starts with the general
model of information flow, and then systematically reduces this model in order to fit the

FAIT analysis of SVS 11
system under consideration. In order to accomplish this, automation is broken down into
autonomy and intelligence of the system (see Table 1). The user first defines the autonomy
and intelligence level of the system by asking a series of questions (see Appendix A). The
FAIT users manual provides a complete list of questions, as well as various templates
representing all possible combinations of the twelve levels of automation and seven levels of
intelligence that can be used in order to complete this step (Riley, 1993). The general model
represents the highest level of automation (see Figure 1).
Table 1. Levels of intelligence and autonomy provided by Riley (1993).
Autonomy is defined as “How much authority the automation has to manipulate
information and perform actions” (Riley, 1993, p.3). When defining the level of intelligence,
one considers what type of information the automation is capable of using.
none information fuser simple aid advisor interactive advisor adaptive advisor servant assistant associate partner supervisor autonomous
raw da
ta pro
cedu
ral
conte
xt res
pons
ive
perso
nalize
d inf
erred
inten
t resp
onsiv
e op
erator
state
resp
onsiv
e op
erator
pred
ictive
LEVELS OF INTELLIGENCE
LEVE
LS O
F AUT
ONOM
Y

FAIT analysis of SVS 12
First, it was determined that the level of autonomy for the SVS system was
“Information Fuser”. This level of autonomy refers to a system that is capable of collecting
information and putting it in the best format for presentation to the operator (Riley, 1993).
The SVS used for this analysis is basically and terrain-rendering display overlaid with PFD
data. This display would be capable of taking information from terrain databases and
presenting this to the operator via the SVS display, and therefore the system would fit into
this category.
Second, the level of intelligence for the SVS was defined as “Personalized”. This
level of intelligence assumes that the machine uses imbedded models of the operator, and
would refer to a system that can be personalized to present information in the particular way
that the operator wants it (Riley, 1993). Even in our simplified version of the SVS, the
operator can select the FOV, and also has the option to declutter the display. In this way, the
system is somewhat personalized to the individual user.
The levels of “Information Fuser” and “Personalized” resulted a reduced version of
the information flow chart (see Figure 2). This chart was then decomposed into
characteristics of the system.

FAIT
ana
lysi
s of
SV
S13
Fig
ure
1. T
he g
ener
al m
odel
of
info
rmat
ion
flow
(R
iley,
199
3).
infe
rop
erat
orst
ate
hum
an o
utpu
t
hum
an in
put
mac
hine
inpu
t
mac
hine
out p
ut
plan
own
Act
ion
chec
kpe
rmis
sion
actio
n
requ
est
perm
issi
on
requ
est
info
rmat
ion
cons
truc
tdi
spla
ys
disp
lay
s cach
em
achi
ne's
goal
sself
mod
el
prov
ide
deci
sion
prio
ritiz
e in
form
atio
n
dete
rmin
e op
erat
or's
need
for
info
rmat
ion
oper
ator
sens
ors
oper
ator
'sgo
als
cont
rols
sens
ors
infe
rop
erat
or
inte
ntm
achi
ne's
goal
s
wor
ldse
nsor
s
infe
rw
orld
stat
e
oper
ator
mod
el
pred
ict
oper
ator
'sbe
havi
or
infe
r
oper
ator
'skn
owle
dge
wor
ldm
odel
wor
ldin
fer
wor
ldst
ate
wor
ldm
odel
pred
ict
mac
hine
beha
vior
mac
hine
mod
el
infe
r
mac
hine
stat
e
perc
eive
mac
hine
beha
vior
perc
eive
disp
lays
plan
own
actio
n
take
no
actio
nor
mon
itor
prov
ide
info
rmat
ion
requ
est
info
rmat
ion
com
man
d
cont
rol
Sel
fm
odel
oper
ator
'sgo
als
mac
hine
'sgo
als
wor
ld
Perc
eive
Wor
ld

FAIT analysis of SVS 15
Machine Input Human Output
Machine Output Human Input
Figure 2. The current model of information flow (Information Fuser/Personalized)
World
Operator’sModels
WorldModel
Operator’sGoals
InferWorldState
ControlsSensors
Machine’sGoals
WorldSensors
Take No Actionor Monitor
Provide Information
Request Information
Command
Control
SelfModel
Operator’sGoals
PlanOwnAction
Machine’sGoals
ConstructDisplays
Displays
PerceiveWorld
PerceiveDisplays
InferWorldState
InferMachineState
WorldModel
MachineModel
Machine’sGoals
PredictMachineBehavior

FAIT analysis of SVS 16
Step two: Identify Characteristics
In this step characteristics are identified for each node or “box” within the information flow
model (see Appendix B). In this step all characteristics of the operational environment and all
related systems that have the potential to influence or be influenced by the system are
considered (Riley, 1993). The user’s manual provides descriptions of each node, and
example characteristics for each. In order to make this process more systematic, Uhlarik and
Comerford's (1999, 2000) method was used. In this method a question is created for each
node, and resulting characteristics are noted. A characteristic is defined as “An aspect of the
system that can vary from a desirable to an undesirable state” (Uhlarik & Comerford, 2000,
p. 15). Characteristics in a desirable state lead to proper functioning of the system, while an
undesirable state would lead to some malfunction or error. It is important to note however,
that several characteristics such as “Display Size” and “Auditory vs. Visual Warning” and
“Pictorial Scene Information Density” do not fit this typical definition. Although it is likely
that these characteristics do indeed have desirable and undesirable states, research has not yet
concretely demonstrated this, and it is beyond the scope of this analysis to do so. Therefore,
all possible variations listed in the description of the system were considered.
For example, the “World Model” node represents the operator’s level of
understanding about the operational environment. The questions asked for this node was
“What affects the pilots current mental model of (or awareness of) the SVS environment?”
Examples of resulting characteristics are “Current level of SA”, “Amount of time spent
looking out-the-window”, “Accuracy of pilots mental model of the environment” and
“Degree of pilot fatigue”. These characteristics are related to the “Operator” component of

FAIT analysis of SVS 17
the system. Other nodes relate to the machine and environment components of the system.
An example of a “Machine” node is the “Perceive Displays Node”, which refers to the
operator’s act of reading the displays. The question asked for this node was “What affects the
pilots ability to perceive information from the SVS display?” Examples of characteristics
resulting from this node are “Glare on the SVS”, “Color of Terrain”, “Degree of overlay with
PFD data”, “Number of layers in the menu structure”, and “Size of symbols/text” (see
Appendix B for a complete list of characteristics).
Because related systems, as well as characteristics of the operational environment are
considered, the list of characteristics is quite extensive, resulting in 77 characteristics of the
system (see Appendix A). Each characteristic is only counted once, even if it is listed under
more than one node.
Step Three: A Matrix of Characteristics
For this step, characteristics identified in step two were divided into three components of the
system, “Environment”, “Operator”, and “Machine”. The information flow chart is divided
into four quadrants “Human Input”, “Human Output”, “Machine Input”, and “Machine
Output”. The characteristics are therefore naturally divided into the four components of the
environment in this way. However, characteristics sometimes appear in both human and
machine quadrants. When this happens, characteristics are placed in the category to which
they most intuitively belong (see Appendix B). For example, “Level of pilot fatigue”
obviously belongs in the “Human” quadrant although it may affect some aspect of the
machine.

FAIT analysis of SVS 18
Once the characteristics were divided, they were then placed in a matrix, which lists
each characteristic twice, once along the left margin of matrix, and once along the top (see
Appendix C). These two axes are therefore identical. On one axis, the characteristics are
referred to as “Drivers” and on the other, they are referred to as “Receivers” (see Table 2).
“This means that the left side characteristic will drive the relationship in the questions
considered, and the top characteristic will receive any requirements generated by the
relationship” (Riley, 1993, p. 40).
Receivers
Cha
ract
eris
tic 1
Cha
ract
eris
tic 2
Cha
ract
eris
tic 3
Characteristic 1 1
Drivers Characteristic 2 1 1Characteristic 3
Table 2. Matrix structure.
Dividing the Drivers and Receivers into “Environment”, “Operator” and “Machine”
components, results in nine regions based on the relationship between these components.
Entries in these sections then give information as to what regions are important in the design
of the system. The implications of entries in these regions will be discussed in detail in a later
section.
By listing each characteristic twice, the relationship between every possible pair of
characteristics is considered. To complete this step, two questions were asked for each cell:
1.) Does the driver influence the receiver during real time operations of the system? 2.) Does

FAIT analysis of SVS 19
the driver place a requirement on the receiver? These questions were asked for each of the
close to 6000 cells in the matrix. If the answer was yes to either question, then an entry of
“1” was placed in the matrix (see Appendix A). The gray area along the negative diagonal in
the matrix represents cells in which identical characteristics interact, and their relationship is
therefore not considered.
An example of an “influence” entry would be the interaction between the
characteristics “Glare on the SVS” and “Level of mental workload”. If the SVS display is not
readable, then the pilot will be forced to gain pertinent information from another source. An
example of an “requirement” entry would be the interaction between the characteristics
“Level of noise in the cockpit” and “Auditory vs. visual warning”. When the volume of noise
(driver) in the cockpit is high, a visual warning (receiver), as opposed to an auditory warning,
may be required.
Step Four: Estimates of the Relative Importance of Characteristics
By summing the rows of the matrix, influence totals are derived and by summing the
columns, sensitivity totals for each characteristic are derived. Influential characteristics are
those that drove the largest number of interactions, and the most sensitive characteristics are
those that received the largest number of interactions. The most influential and sensitive
characteristics represent characteristics that are essential to the functioning of the SVS
system. These characteristics can be used to determine what the priorities should be for
devoting design resources, and where the largest potential problems are likely to lie (Riley,
1993). Riley (1993) also states that characteristics, which are both highly sensitive and highly
influential, are potential sources of instability within the system and should therefore be

FAIT analysis of SVS 20
considered in the implementation of the SVS. All characteristics are listed in Appendix D in
order of their relative influence and sensitivity rankings within each component of the
system, as well as overall. Riley (1993) sets no definite criteria for identifying the most
important characteristics, and not all relationships can be considered because of the large
number of cells. Therefore, Uhlarik and Comerford's (1999) method was utilized.
In this method, only influence and sensitivity scores falling above a certain percentile
are considered. The 90th percentile and above was considered in previous analyses, however,
the current research considered characteristics falling above the 80th percentile (step 1). In
addition to this method, the current analysis also divided the influence and sensitivity
rankings into the three components of the SVS (Environment, Human, and Machine) and
considered characteristics that fell above the 80th percentile in each component (step 2). This
was done because following completion of step one, it was obvious that most characteristics
falling above the 80th percentile were part of the “Human” component of the system. It was
therefore possible that important characteristics of other components (Environment and
Machine) were being ignored (See Appendix E).
The most Influential Characteristics Overall were as follows:
• Intuitiveness/usability of the SVS• Difficulty of terrain environment surrounding destination airport• Experience and ability of the pilot• Difficulty of the approach• Accuracy of GPS• Accuracy of the terrain database• Difficulty of landing• Functioning/malfunctioning of displays other than the SVS• Pilot Preference• Limitations of the machines processor• Pictorial Scene information density

FAIT analysis of SVS 21
The most Sensitive Characteristics Overall were as follows:
• Level of mental workload• Difficulty of landing• Difficulty of approach• Amount of time spent reading instruments other than the SVS• Amount of time spent viewing the SVS display (head-down time)• Current level of SA• Accuracy of the pilots mental model of the environment• Amount of time spent looking out-the-window
The most Influential (I)/Sensitive (S) Characteristics in the “Operator” Category are asfollows:
• Experience and ability of the pilot (I)• Pilot preference (I)• Experience using the SVS (training) (I)• Amount of display cross-checking (I)• Amount of time spent looking out-the-window (I/S)• Amount of time spent viewing the SVS display (I/S)• Level of pilot mental workload (I/S)• Amount of time spent reading instruments other than the SVS (S)• Current level of SA (S)• Accuracy of pilots mental model of the environment (S)
The most Influential (I)/Sensitive (S) characteristics in the “Environment” Category are asfollows:
• Difficulty of terrain environment at destination airport (I)• Difficulty of landing (I/S)• Difficulty of approach (I/S)• Functioning/malfunctioning of displays other than the SVS (I)• ATC workload (S)• Altitude of the aircraft (S)• Speed of the aircraft (S)
Most Influential (I)/Sensitive (S) Characteristics in the “Machine” Category are as follows:
• Intuitiveness/usability of the SVS (I/S)• Accuracy of the GPS (I)• Accuracy of the terrain database (I)• Limitations of the machines processor (I)• Pictorial scene information density (I)• Glare on the SVS (I)

FAIT analysis of SVS 22
• Degree of display clutter (S)• Degree of overlay with PFD data (S)• Auditory vs. visual warning (S)• Display size (S)• Color of symbols/text (S)• Color of terrain (S)• FOV currently depicted on the SVS display (S)
When the characteristics were not separated by category, only the characteristic
“Difficulty of approach/landing” was ranked as both highly influential and highly sensitive.
This characteristic refers to the difficulty of the terrain environment surrounding the airport,
and the resulting difficulty of the landing itself. The SVS is designed to aid pilots in
navigating through difficult terrain environments, so the SVS should server to mitigate any
possible errors caused by terrain difficulty.
When the characteristics were separated by category, four characteristics were rated
as both highly sensitive and highly influential. These characteristics were “level of mental
workload”, “Amount of time spent viewing the SVS (Head-down time)”, “Amount of time
spent looking out-the-window (Head-up time) ”, and “Intuitiveness/usability of the SVS”.
This suggests that these characteristics are critical to the functioning of the system. For
example, these characteristics suggests that if nothing is done to correct the error, the
following states are likely to occur: high-level of mental workload, excessive head-up time,
and insufficient amount to time spent viewing the SVS. In order to avoid these states, the PF
should have a substantial amount of experience with the SVS, so that he/she has a high level
of trust in the system and is comfortable spending the majority of time viewing the SVS
display, since the SVS should be primarily used to navigate through terrain in less than
optimal weather conditions.

FAIT analysis of SVS 23
It should also be noted that the most influential and sensitive characteristics are
somewhat general, and that may be the reason they rate high in importance. Therefore, it is
important to look at all of the characteristics listed above, as they have potential to seriously
affect the SVS system and environment.
Future applications of the FAIT analysis to a synthetic vision system may wish to use
subject matter experts in order to get a better idea about which characteristics are essential to
the functioning of the system, in a manner similar to that used in Comerford and Uhlarik
(2000).
Step Five: Tradeoffs
In this step, tradeoff relationships between characteristics are identified. To
accomplish this, the matrix is folded along the negative diagonal, and symmetrical
relationships that have the potential for a tradeoff relationship are identified (see Table 3). A
potential tradeoff represents a situation in which the characteristics being considered both
effect each other during real time operations of the system. In other words, “characteristic 1”
influences “characteristic 2”, and “characteristic 2” influences “characteristic 1”. This
resulted in 188 symmetrical relationships. However, because cells on both sides of the
negative diagonal are highlighted, symmetrical relationships between two cells only count as
a single tradeoff relationship. Therefore, 94 potential tradeoff relationships were identified.
Because of the large number of potential tradeoff relationships, abbreviated matrices using
only the most influential and sensitive characteristics listed in step four were used in this
step. This resulted in a total of 35 potential tradeoff scenarios; each of these scenarios
illustrates a set of circumstances in which a potential tradeoff could occur (see Appendix F).

FAIT analysis of SVS 24
Receivers
Cha
ract
eris
tic 1
Cha
ract
eris
tic 2
Cha
ract
eris
tic 3
Characteristic 1 1
Drivers Characteristic 2 1 1Characteristic 3
Table 3. Tradeoff relationships are highlighted in yellow.
Each pair of characteristics examined in this step has to be considered as a driver and
as a receiver. Also, the definition of a characteristics, that is something that varies from a
desirable to an undesirable state, introduces another complication. This definition suggests
that each characteristic must be looked at in terms of its desirability in the system increasing
and decreasing (“Glare on the SVS display could range from “No Glare” (desirable), to
“Unreadable display” (undesirable)). Because each characteristic is also considered as a
driver and as a receiver, this results in four potential tradeoff scenarios for each pair of
characteristics. Although Riley (1993) does not specifically suggest this method, it is a more
systematic way of identifying possible tradeoff situations (Comerford & Uhlarik, 2000).
In order for a pair of characteristics to represent a true tradeoff relationship, the
characteristics must be inversely related in terms of desirability. An increase in the
desirability of “characteristic 1” must lead to a decrease in the desirability of “characteristic
2” and vise versa. It is possible that one or two of the four scenarios generated for each pair
may represent a tradeoff, while other scenarios for that pair represent direct relationships (an
increase in the desirability of “characteristic 1 leads to an increase in the desirability of

FAIT analysis of SVS 25
“characteristic 2”). In this case, the pair of characteristics is labeled “unstable” (see Appendix
F).
It is also possible that a potential tradeoff scenario cannot be imagined for pairs of
characteristics, in this case, a true tradeoff situation most likely does not exist, and the pair is
discarded. Pairs of characteristics for which a scenario could not be imagined are noted in
Appendix F.
As mentioned above, characteristics that did not, for our purposes, range from a
desirable to an undesirable state were also identified. Because these characteristics do not fit
the definition, only one potential tradeoff scenario is written for each pair. These pairs are
labeled “Non-Varying Characteristics” and can be found in Appendix G.
Of the 24 pairs of characteristics that did vary from an undesirable to an desirable
state, 17 were found to represent “unstable” relationships, 6 were labeled as “Direct”
relationships, and one was found to be a true “tradeoff” scenario (see Appendix F).
However, the type of relationship identified is not as important as the scenarios that
are generated for each pair of characteristics. The criteria for determining a true tradeoff
relationship is somewhat stringent, and this is most likely the reason that only one true
tradeoff relationship was identified. Also, it is important to notice that even those pairs of
characteristics classified as unstable often have tradeoff scenarios within them, but are not
classified as true tradeoffs because all four scenarios do not represent tradeoffs. For the Non-
Varying Characteristics, all 11 scenarios identify tradeoff scenarios, and all can be found in
Appendix B.

FAIT analysis of SVS 26
Riley (1993) suggests that the identification of potential scenarios is one of the most
useful products of the FAIT analysis. Each of the potential tradeoff scenarios represent
important issues relevant to a synthetic visions system. Also, many useful human factors
issues that could arise in the system were identified. It is suggested that these scenarios are
used as a starting point to identify basic issues and to explore more detailed scenarios that are
relevant to SVS.
Step Six: Error Scenarios
In this step potential errors that could adversely effect the functioning of the SVS are
identified (see Appendix H). In order to accomplish this an abbreviated matrix is created.
This matrix contains only highly influential and sensitive characteristics identified in step
four. It is important to note that this abbreviated matrix is different from that used to identify
tradeoff scenarios. The matrix used in this step does not contain identical axes. The left hand
portion of the matrix contains highly influential characteristics, while the upper portion of the
matrix contains only highly sensitive characteristics. Therefore, there is not negative diagonal
in which the characteristics interact with themselves. This is because the characteristics
interact in a one-way fashion.
Also, in this step, several characteristics were eliminated. For example, the
characteristic “Difficulty of approach” was found to be both highly influential and highly
sensitive. However, this is most likely the case because it is a very general characteristic and
will therefore effect and be affected by many characteristics in the system. Error scenarios
are meant to be more specific than tradeoff scenarios created in step five, therefore more
general characteristics were not used in order to produce more specific scenarios.

FAIT analysis of SVS 27
All error scenarios found in Appendix H identify other possible human factors issues
that could arise in the SVS environment. In addition to identifying human factors issues,
these scenarios can be used for future simulations of SVS in order to attempt to mitigate any
errors that could arise in the system.
Step Seven: Overall Trends
Riley (1993) provides pre-specified classifications in order to examine overall trends
in the system. Because the matrix is divided into the three components of the system
(environment, machine, and operator) on both axes, this allows for the matrix to be divided
into nine regions based on the relationships between these three components. Entries in each
region represent “Training Issues”, “Automation Issues”, or “Operator-Driven System
Design Issues” (see Table 5).

FAIT analysis of SVS 28
Table 5. Classification of issues based on the layout of the matrix (Riley, 1993).
According to this classification scheme, the majority of issues relevant to the SVS
system are training issues (66.25%), while relatively few issues appear to be automation
issues (9.15%) and operator-driven system design issues (2.97%) (see Table 6).
characteristic 1 characteristic 2
characteristic 1 characteristic 2
char
a cteristi
c 2
char
a cteristi
c 1
char
a cteristi
c 2
char
a cteristi
c 1
char
a cteristi
c 2
char
a cteristi
c 1
characteristic 1 characteristic 2
sensitivity score
infl
uen ce s
core
ENVIRONMENT MACHINE OPERATOR
DRIVERS
RECEIVERS
TRADEOFFS DIAGONAL
AUTOMATION ISSUES
OPERATOR- DRIVEN SYSTEM DESIGN ISSUES
TRAINING ISSUES
X X XX
31
112
TRAINING ISSUES
TRAINING ISSUES
ENVI
RO
NM
ENT MA
CHI
NE
OPE
RAT
OR

FAIT analysis of SVS 29
Training Issues = 66.25%Automation Issues = 9.15%Operator Driven System Design Issues = 2.97%Most Influential = MachineMost Sensitive = Operator
Table 6. Percentage of interactions found in each section of the matrix.
This classification system suggests that errors within the SVS could be mitigated with
proper training. In addition to learning the physical properties and functions of the display,
training serves to increase trust in the system and allows the pilot to adopt an accurate mental
model of the system, which was found to be a highly sensitive characteristic in step four.
According to the most influential and sensitive characteristics identified earlier,
training should assist pilots in gaining experience with the SVS, reducing the level of mental
workload, creating an accurate mental model of the environment, creating and accurate
machine model, gaining increased SA, and balancing attention appropriately between the
out-the-window view, the SVS, and instruments other than the SVS.
Environment Operator Machine Total Influence
Training Issues
Environment 6.80% 16.81% 2.35% 25.96%Operator-Driven System Design
Training Issues Issues
Operator 4.82% 23.24% 2.97% 31.02%
Training Issues Automation Issues
Machine 7.66% 26.21% 9.15% 43.02%
Total Sensitivity 19.29% 66.25% 14.46% Total = 100%

FAIT analysis of SVS 30
It is also important to consider that the category of training issues is comprised of the
following interactions: “Environment-Operator”, “Operator-Operator”, and “Machine-
Operator” (see Table 6). The largest number of training issues fell into the “Machine-
Operator” category (26%). This may suggest that although training with respect to the SVS is
important, money may be best spent on display design in order to reduce potential errors in
the system. Step four gives specific examples of what aspects of design should be
concentrated on when SVS is implemented.
The classification system provided by Riley (1993) also allows one to identify the
most influential and sensitive categories (environment, operator, and machine) overall. The
current analysis revealed that the “Machine” was the most influential component, while the
“Operator” was the most sensitive component. The fact that the machine component is the
most influential component of the system is somewhat obvious. This simply implies that the
SVS itself has great potential to influence all other components of the system. However, it is
less intuitive that the pilot (operator) would be the most sensitive. This implies that other
aspects of the SVS and its environment have the potential to seriously influence the pilot.
Because the SVS can basically replace the out-the-window view, care must be taken to
assure that the pilot is provided with an accurate depiction of the terrain. Also, the GPS must
be extremely accurate to assure proper functioning of the system, and that the pilot has an
accurate mental model of the environment.
This classification also suggests that it would be most cost-effective if training
concentrated on issues and characteristics identified in the “machine” and “operator”
categories of the SVS (see Step Four).

FAIT analysis of SVS 31
Last, as mentioned above, few “Operator-Driven System Design Issues” and
“Automation Issues” were identified. This is not surprising because the SVS used for this
application had only a moderate level of autonomy (“Information Fuser”) and intelligence
(“Personalized”). Therefore, it was not expected that operator characteristics would have a
large amount of influence on the SVS used for this analysis.
Summary
The SVS that was used for the current analysis was one that incorporated an enhanced
view of terrain overlaid with PFD data on a HDD. This system also incorporated either an
auditory or visual warning system, three different types of pictorial scene information
densities (photo-realistic, less detailed, and wire frame), and could be viewed on three
possible display sizes (757 EADI, 777 PFD, or Rectangular Flat Panel). The SVS was also
assumed to have four possible FOV ranges from which the pilot could select.
The pilot flying was the main focus of this analysis, although other humans were
considered to the extent that they influenced the PF’s actions. Also, only the approach and
landing phases of flight were considered in an effort to narrow the analysis. These phases of
flight were chosen because of the great potential for error.
The FAIT analysis used in the current research identified basic influential and
sensitive components of the SVS environment, as well as tradeoffs between these
components, errors within the system, and potential human factors issues.
Using the FAIT method, the system under consideration was labeled as being an
“information Fuser” in terms of autonomy. This refers to a system capable of collecting
information and putting it in the best format for presentation to the operator. The SVS was

FAIT analysis of SVS 32
also labeled as being “Personalized” in terms of intelligence. This means that the machine
uses imbedded models of the operator, and refers to a system that can be personalized to
present information in a particular way to the operator.
A number of characteristics were also identified as being highly influential or highly
sensitive. After creating a matrix of characteristics of the system, one can compute a relative
influence and sensitivity score for each characteristic. Next, only those characteristics, which
are highly sensitive and influential, are considered (those which fall above the 80th
percentile). This procedure was conducted in two ways. First, highly influential and sensitive
characteristics were identified for the system as a whole. Second, highly influential and
sensitive characteristics were identified for each component of the system (environment,
operator, and machine).
When the system was considered as a whole, only the characteristics “Difficulty of
approach/landing” was ranked as both highly influential and highly sensitive. However,
when separated by components, the characteristics “Level of mental workload”, “Amount of
time spent viewing the SVS display (head-down time)”, “Amount of time spent looking out-
the-window (head-up time)”, and “Intuitiveness/usability of the SVS” were identified as
being both highly influential and highly sensitive. This suggests that these characteristics are
critical to the functioning of the SVS.
Also, 35 potential tradeoff situations were identified, and a scenario was written for
each. Because not all characteristics fit the definition of a characteristic identified in step two
(something that varies from a desirable to an undesirable state), tradeoff scenarios were
separated into those dealing with varying and non-varying characteristics. Each characteristic

FAIT analysis of SVS 33
in the pair for varying characteristics is considered as both a driver and a receiver, and is also
considered as both desirable and undesirable. This results in four scenarios for each pair of
tradeoff characteristics. In order for a pair to represent a true trade-off relationship, each of
the four scenarios must represent a situation in which the characteristics are inversely related.
Because the criteria for identifying true tradeoff relationships is rather stringent, only
one was found to represent a true tradeoff situation. However, the type of relationship
identified is not as important as the scenario generated for each pair. Also, even pairs that
were not labeled as true tradeoff relationships may contain tradeoffs as one or two of the four
scenarios. These scenarios identify important human factors issues in the SVS, and can be
used as a starting point to identify basic issues and explore more detailed scenarios that are
relevant to the system.
Last, error scenarios were written from an abbreviated matrix that contained only
highly influential and sensitive characteristics. These scenarios did not incorporate very
general characteristics such as “Difficulty of approach/landing” or “Level of mental
workload”, and are therefore somewhat more specific than the tradeoff scenarios mentioned
above.
The majority of issues relevant to the SVS considered for this analysis appear to be
training issues (66.25%). This suggested that errors with in the SVS environment could be
mitigated with proper training. Specifically, training should assist pilots in gaining
experience with the SVS, reducing the level of mental workload, creating an accurate mental
model of the environment, creating an accurate machine model, gaining increased SA, and
balancing attention appropriately between the out-the-window view, the SVS, and

FAIT analysis of SVS 34
instruments other than the SVS. Because the largest amount of training issues fell into the
“Machine-Operator” category, money may be best spent on display design in order to reduce
potential errors in the system.
Future Research
The present FAIT analysis provided an in-depth analysis of a relatively simple
synthetic vision system. Future analyses may wish to examine more complex system that
integrates much of the technology that SVS is capable of possessing. Although the current
analysis provided a starting point, a FAIT analysis of a more complex system may serve to
identify more specific characteristics and human factors issues that are relevant to the SVS.
Future research may also benefit from including subject-matter experts, in order to validate
the current findings. These subject-matter experts could provide information about the
relative importance of characteristics, and the frequency with which they interact with each
other.

FAIT analysis of SVS 35
References
Comerford, D., & Uhlarik, J. (2000). Functional Allocation Issues and Tradeoffs(FAIT) analysis of Airborne Information for Lateral Spacing (AILS). NASA-ARC System-Wide Accident Prevention Program. NASA Technical Report.
Comstock, J., Glabb, L., Prinzel, L., Elliot, D. (2001). Can effective synthetic visionsystem displays be implemented on limited display spaces?
Norman, R.M., & Hughes, M.F., (2001). Flight Tests Requirements Document.Aviation Safety Program Synthetic Vision Systems (SVS) Project. Synthetic Vision DisplayConcepts. Testing at Eagle County Regional Airport (SVDC-EGE).
Riley, V. (1993). Function Allocation Issues and Tradeoffs: Users Manual(198002014-1981). Columbus, Ohio: Honeywell Technology Center.
Uhlarik, J., & Comerford, D. (1999). Information Requirments for Traffic Awarenessin a Free-Flight Environment: An Application of the FAIT Analysis. Prepared for the U.S.Department of Transportation and The Federal Aviation Administration.
Williams, D., Waller, M., Burdette, D., Doyle, T., Capron, W., Barry, J., & Gifford,R. (2000). Concept of operations for commercial and business aircraft synthetic visionsystems, Version 1.0 (Draft). NASA Technical Report.

Appendix A I
Preliminary Step: Define the components of the SVS system and environment
1. The Human:We will be looking only at the pilot flying (PF) with regards to the SVS system.However, pilots of other aircraft, as well as other crew members will occasionallybe considered to the extent which they affect the PF.
2. The Environment:Although the SVS is capable of supporting all phases of flight, we will befocusing only on approach and landing situations using the SVS.
3. The Machine:We are working with the following SVS system:
Description of the SVS Used For the Current Analysis:
Virtual Visual Environment:- Mimics what could be seen out the window in good visibility
conditions- **Uses either a photo-realistic terrain display, a less detailed terrain
texture display, or a wire-frame rendering of terrain- Display is head-down- **May have three possible display sizes (757 EADI 5 x 5.25 inch, 777
PFD 6.4 x 6.4 inch, and rectangular flat-panel 8 x 10 inch)- May have four possible field of views, which are pilot selectable- PFD symbology is overlaid on the SVS display (this is not selectable)- Obstacles in proximity of own aircraft are displayed via the terrain
database- Runway edges are depicted- Salient features are highlighted on the display- Pilot has the ability to declutter the display- The SVS will give an auditory or visual warning if impact with terrain
is immanent- The pilot manually enters flight path data into the SVS (or through the
FMS)
Primary Flight Display Information:- Primary flight display information is overlaid on the SVS display- Primary flight display information is not redundantly coded elsewhere
in the cockpit

Appendix A II
- Primary flight display information includes: altitude, airspeed, groundspeed, attitude, vertical speed, velocity vector, and location withrespect to navigation fixes
** = These are characteristics of the SVS that we are leaving undefined and have thepotential to cause three way interactions between characteristics. Each of these SVScharacteristics has a corresponding characteristic in the matrix.
Step #1: Chose the level of autonomy and intelligence of the system in orderto create an information flow model
Autonomy:In order to chose the level of automation, 6 questions were asked of theSVS system. It was determined that the level of automation inINFORMATION FUSER.
1. Does the machine perform any control actions?
NO. The SVS does not perform any control actions, it simply displays terrain informationvia the terrain database.
2. Can the machine manage the operator’s displays autonomously?
NO. In order to answer yes to this question, the SVS would have to be capable ofdetermining what information should be presented, what format it should be presented in,and how it should be presented. It is my understanding that the SVS is not this advanced.It does not determine anything, but simply presents information from a databasedepending on the position of the aircraft, which is determined by GPS technology.
3. Can the machine initiate interactions with the operator?
NO. In order to answer yes to this question, the SVS would have to makerecommendations to the operator without being explicitly asked for them. It is myunderstanding that the SVS does not make any recommendations.
4. Can the machine provide recommendations or advice?
NO. Since we are no longer looking at an SVS system that incorporates a sensor, thehazard alerting system would not be present. Therefore, the SVS does not explicitlyprovide any recommendations to the pilot flying.
5. Does the machine perform any decision making functions?
NO. The SVS system does not make any decisions, it simply displays information fromthe database. In order to answer yes to this question, the SVS would need to performsome type of decision making such as categorization of targets.

Appendix A III
6. Can the machine integrate information and construct displays?
YES. This would refer to a machine that can collect information and put it in the bestformat for presentation to the operator. Since the SVS is a simple display, which formatsinformation from a database for presentation to the operator via the display, I think that itfits into this category. Therefore, the SVS is anINFORMATION FUSER
Intelligence: In order to determine the level of intelligence, 4 questions were asked ofthe SVS system. The level of intelligence was determined to bePERSONALIZED.
1. Can the machine predict the operator’s behavior?
NO. In order to answer yes to this question the SVS would need to be able to collect anduse information about the operator’s physical state. This is not the case with the SVS.
2. Can the machine monitor the operator’s physical state?
NO. The SVS cannot collect or use any information about the physical state of the pilot.
3. Can the machine infer operator intent?
NO. In order to answer yes to this question the SVS would need to be able to dynamicallyinfer the operator’s intent and assist the operator in carrying out this intent.
4. Does the machine use imbedded models of the operator?
YES. This refers to a machine, which can be personalized to present information in theparticular way that the operator wants it. Since the operator can select FOV the SVS canbe personalized in some way. Therefore, the level of intelligence isPERSONALIZED.

Appendix B 1
Characteristics in Each Node of the Information Flow Chart(Information Fuser/Personalized):
The World Node:Everything outside of your particular system, parameters of larger systems that yoursystem fits into should be included
What are the important characteristics of the SVS environment (approach and landing),what affects this environment (that is not related to the SVS)?
Riley states: For enhanced vision, this node would contain parameters for the operationalenvironment and the rest of the airplane, such as engines, the FMS, etc.
• Difficulty of approach• Difficulty of landing• Difficult of terrain environment at destination airport• Traffic situation at destination airport• Physical state of the engines• Physical state of the aircraft• Experience and ability of the pilot• Pilot experience with this specific approach• Pilot experience with this specific landing• Amount of time pilot spent looking out-the-window• Usability/intuitiveness of displays other than the SVS• Amount of trust in crew members• Amount of trust in systems other than the SVS• Weather• Degree of time pressure (is aircraft arriving on time, early, or late?)• Amount of information available from displays other than the SVS• Glare on displays other than the SVS• Ceiling visibility at destination airport• ATC workload• Functioning/malfunctioning of displays other than the SVS• Speed of aircraft (too low/high?)• Altitude of aircraft (too low/high?)
*The Human Input Quadrant*
Perceive World Node:The operators access to information about the operational environment through allmethods other than the SVS
What affects the pilot’s ability to perceive characteristics of the outside environmentduring takeoff and landing, other that what is being presented on the SVS display?

Appendix B 2
• Amount of time spent looking out-the-window• Experience and ability of the pilot• Pilot experience with this specific approach• Pilot experience with this specific landing• Experience using instruments other than the SVS• Communication with ATC• Weather conditions at destination airport• Ceiling visibility at destination airport• Amount of time spent reading instruments other than the SVS• Pilots level of confidence in his/her perception of the world• Current level of SA• Accuracy of pilots mental model of the environment• Amount of noise in cockpit• Amount of collaboration with crew members• Accuracy of information from displays other than the SVS• Amount of information available from displays other than the SVS• Degree of pilot fatigue
Perceive Displays Node:Refers to the operators act of reading the displays
What affects the pilot’s ability to perceive information form the SVS display?
• Glare on SVS• Physical condition of display surfaces• Intuitiveness/usability of the SVS• Display size• Pictorial scene information density• Size of symbols/text• Color of Terrain• Color of symbols/text• Degree of display clutter• Degree of overlay with PFD data• Auditory vs. visual warning• Ability to declutter SVS display• Number of layers in the menu structure• Number of key presses required to accesss desired information• Experience using the SVS• Pilot experience with this specific approach• Pilot experience with this specific landing• Experience with this specific airport
Appendix B 3
• Experience and ability of the pilot• Location of the SVS display in the cockpit• FOV currently depicted on SVS display• Number of obstacles currently in view• Number of highlighted features currently in view
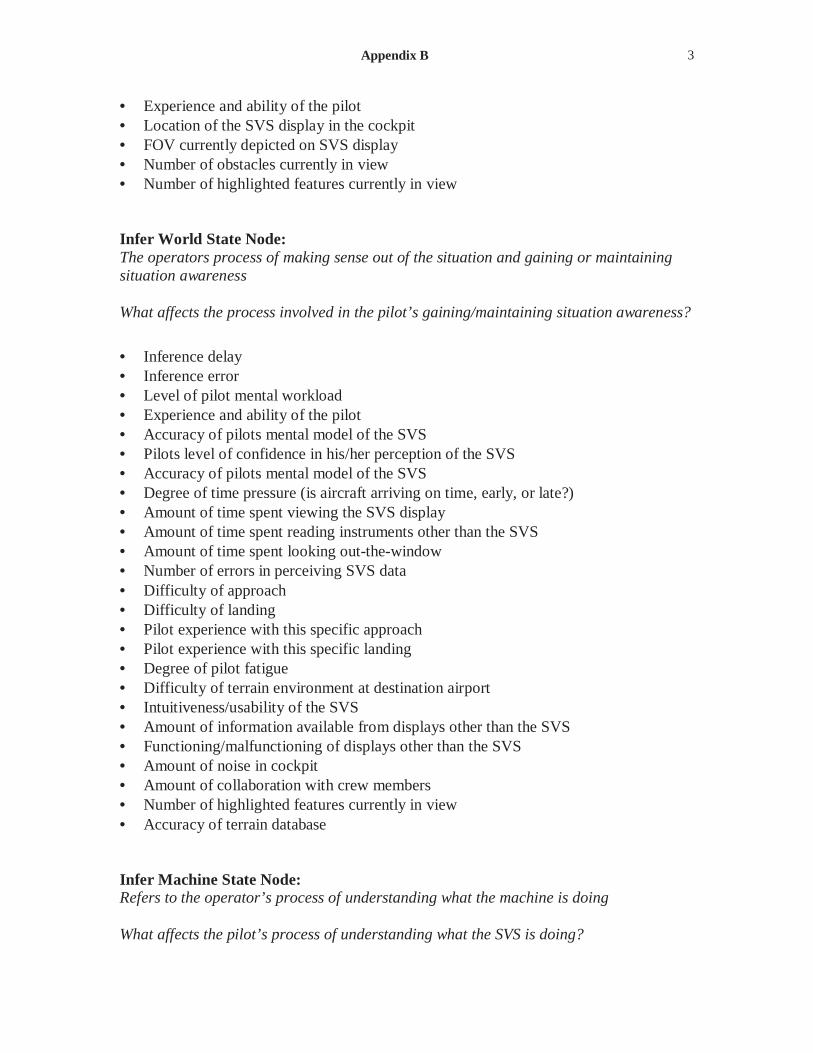
Infer World State Node:The operators process of making sense out of the situation and gaining or maintainingsituation awareness
What affects the process involved in the pilot’s gaining/maintaining situation awareness?
• Inference delay• Inference error• Level of pilot mental workload• Experience and ability of the pilot• Accuracy of pilots mental model of the SVS• Pilots level of confidence in his/her perception of the SVS• Accuracy of pilots mental model of the SVS• Degree of time pressure (is aircraft arriving on time, early, or late?)• Amount of time spent viewing the SVS display• Amount of time spent reading instruments other than the SVS• Amount of time spent looking out-the-window• Number of errors in perceiving SVS data• Difficulty of approach• Difficulty of landing• Pilot experience with this specific approach• Pilot experience with this specific landing• Degree of pilot fatigue• Difficulty of terrain environment at destination airport• Intuitiveness/usability of the SVS• Amount of information available from displays other than the SVS• Functioning/malfunctioning of displays other than the SVS• Amount of noise in cockpit• Amount of collaboration with crew members• Number of highlighted features currently in view• Accuracy of terrain database
Infer Machine State Node:Refers to the operator’s process of understanding what the machine is doing
What affects the pilot’s process of understanding what the SVS is doing?

Appendix B 4
• Degree of redundant coding of SVS data• Experience and ability of the pilot• Amount of time spent viewing the SVS display• Amount of time spent looking out-the-window• Intuitiveness/usability of the SVS• Experience using the SVS• Degree of display clutter• Functioning/malfunctioning of displays other than the SVS• Amount of noise in cockpit• Current level of SA• Accuracy of pilots mental model of the SVS• Pilots level of confidence in his/her perception of the SVS• Level of mental workload• Number of errors in perceiving SVS data• Pilots level of confidence in the accuracy of the SVS• Amount of display cross-checking
World Model Node:Represents the operators level of understanding about the operational environment
What affects the pilots current mental model of (or awareness of) the SVS environment?
• Current level of SA• Amount of time spent viewing the SVS display• Amount of display cross-checking• Auditory vs. visual warning• Pictorial scene information density• Experience and ability of the pilot• Pilot experience with this specific approach• Pilot experience with this specific landing• Amount of time spent looking out-the-window• Experience using the SVS• Intuitiveness/usability of the SVS• Functioning/malfunctioning of displays other than the SVS• Number of highlighted features currently in view• Pilots level of confidence in his/her perception of the world• Accuracy of pilots mental model of the environment• Degree of pilot fatigue• Level of mental workload

Appendix B 5
Machine Model Node:Represents the operator’s current level of understanding about the system, such ascurrent level of readability.
What affects the pilot’s current mental model or understanding of the SVS?
• Accuracy of pilots mental model of the SVS• Experience using the SVS• Experience and ability of the pilot• Degree of redundant coding of SVS data• Degree of display clutter• Accuracy of terrain database• Intuitiveness/usability of the SVS• Amount of trust in the SVS• Pilot error when using the SVS• Number of function keys required to access desired information• Number of layers in the menu structure
Machine’s Goals Node:Represents the operators understanding of the machines current goals and targets
What affects the pilot’s ability to understand the goals of the SVS display?
• Experience and ability of the pilot• Experience using the SVS• Pilots level of confidence in the accuracy of the SVS• Accuracy of pilots mental model of the SVS display• Intuitiveness/usability of the SVS• Accuracy of terrain database• Degree of display clutter• Amount of time spent viewing the SVS display• Amount of time spent reading instruments other than the SVS• Amount of time spent looking out-the-window• Pilot experience with this specific approach• Pilot experience with this specific landing• Experience with terrain surrounding destination airport
Predict Machine Behavior Node:Refers to the operator’s anticipation of the next actions to be taken by the machine
What affects the pilot’s ability to anticipate the warnings and other behaviors of the SVSdisplay?
• Accuracy of pilots mental model of the environment

Appendix B 6
• Accuracy of pilots mental model of the SVS• Accuracy of terrain database• Amount of display cross-checking• Amount of time spent looking out-the-window• Amount of time spent viewing the SVS display• Experience using the SVS• Pilots level of confidence in his/her perception of the SVS• Level of mental workload• Degree of pilot fatigue• Current level of SA• Pilot experience with this specific approach• Pilot experience with this specific landing• Experience with terrain surrounding destination airport• Experience and ability of the pilot• Accuracy of information from displays other than the SVS• Accuracy of GPS• Intuitiveness/usability of the SVS• Weather conditions at destination airport• Amount of noise in cockpit• Lighting conditions in the cockpit• Glare on SVS
*The Human Output Quadrant*
Plan Own Action Node:Refers to the operator’s process of deciding what to do next
What affects the appropriateness (or process) of the action chosen by the pilot?
• Accuracy of pilots mental model of the environment• Accuracy of pilots mental model of the SVS• Pilots level of confidence in his/her perception of the SVS• Degree of time pressure (is aircraft arriving on time, early, or late?)• Current level of SA• Pilots level of confidence in the accuracy of the SVS• Experience using the SVS• Experience and ability of the pilot• Level of self confidence• Level of mental workload• Degree of pilot fatigue• Weather conditions at destination airport• Traffic situation at destination airport

Appendix B 7
• Pilot experience with this specific approach• Pilot experience with this specific landing• Amount of time spent looking out-the-window• Amount of display cross-checking• Intuitiveness/usability of the SVS• Pilots level of confidence in his/her perception of the world• Accuracy of terrain database• Accuracy of GPS• Difficulty of terrain environment at destination airport
Operators Goals Node:Represents the operators actual intentions, and can contain characteristics that arethe operators counterparts of the “Operators Goals” and “Machines Goals” nodeson the Machine side of the model
What affects the operator’s actual goals or intentions?
• Accuracy of pilots mental model of the environment• Current level of SA• Experience and ability of the pilot• Weather conditions at destination airport• Traffic situation at destination airport• Difficulty of terrain environment at destination airport
Self Model Node:Refers to the operators assessment of his or her own current abilities or state
What affects the pilot’s ability to assess his/her abilities to deal with the current SVSenvironment?
• Level of mental workload• Level of self confidence• Experience using the SVS• Level of confidence in the accuracy of the SVS• Experience and ability of the pilot• Current level of SA• Degree of pilot fatigue
Take No Action or Monitor Node:**This is basically a placeholder, and can itself, be listed as a characteristic

Appendix B 8
Provide Information Node:Represents the process by which the operator enters data into the system or providesother types of information
What affects the pilot’s accuracy in providing information data to the SVS (or FMS)?
• Current level of SA• Experience and ability of the pilot• Experience using the SVS (or FMS)• Accuracy of pilots mental model of the environment• Level of mental workload• Accuracy of pilots mental model of the SVS• Intuitiveness/usability of the SVS (or FMS)
Request Information Node:Represents the process by which the operator enters requests for information, such ascalling up new display pages* It is my understanding that the pilot only has the option of selecting FOV from 4possibilities. Therefore, this is the only request I am referring to in this section.
What affects the pilot in requesting FOV information from the SVS?
• Pilot preference• Proximity to the destination airport• Experience using the SVS• Experience and ability of the pilot
Command Node:Represents inputs made by the operator to change the state of the system through acommand to automation**Again, right now, the only thing that I think is selectable (can be changed) is the FOV,therefore, I will refer only to this function in this section
What affects the pilot in commanding the SVS to change FOV?
• Pilot preference• Proximity to the destination airport• Experience using the SVS• Experience and ability of the pilot

Appendix B 9
Control Node:Refers to inputs made by the operators through manual control
What affects the pilot in manually entering data concerning flight path into the SVS orFMS?
• Experience and ability of the pilot• Experience using the SVS (or FMS)• Level of mental workload• Intuitiveness/usability of the SVS (or FMS)• Number of layers in the menu structure
*The Machine Input Quadrant*
World Sensors Node:This node is intended to contain all the potential sources of information coming into thesystem (should list characteristics of sensors)
How does the SVS receive information, what affects this information (accuracy/quality)?
• Update rate of Terrain database• Update rate of GPS• Accuracy of terrain database• Accuracy of GPS
Control Sensors Node:Represents all the ways that the operators can put information into the systems, typicallythrough the controls (should list characteristics of controls)
How is information put into the SVS (or FMS), and what affects the accuracy/quality ofthis information?
• Accuracy of terrain database• Accuracy of GPS• Placement of controls• Tactile feedback from controls• Layout of controls• Feedback delay• Functioning/malfunctioning of hardware/software• Number of layers in the menu structure• Number of key presses required to access desired information• Force requirements

Appendix B 10
• Precision requirements• Format restrictions• Experience using the SVS (or FMS)• Experience and ability of the pilot• Current level of SA• Accuracy of pilots mental model of the environment• Level of mental workload• Accuracy of pilots mental model of the SVS• Intuitiveness/usability of the SVS (FMS)
Machines Goals Node:Represents the machines current targets, operational parameters, or understanding of thecurrent mission goals.
What affects the ability of the SVS to “understand” which information is relevant to its“role”?
• Accuracy of terrain database• Accuracy of the GPS• Limitations of the machines processor• Functioning/malfunctioning of hardware/software
Operator’s Goals NodeRepresents the machines understanding of the operator’s current goals.**I don’t think that this node applies, since the SVS is not capable of inferring, assistingor understanding the operators goals.
Infer World State Node:Represents the machines process of understanding what the current state of theoperational environment is, based on information provided to it from its sensors
What affects the processes involved in the SVS gaining/maintaining an understanding ofthe operational environment?
• Accuracy of terrain database• Accuracy of GPS• Update rate of terrain database• Update rate of GPS• Functioning/malfunctioning of hardware/software• Processing time (to display information from terrain database)

Appendix B 11
Operators Models Node:Represents internal representation of the human operator used by the machine to drawinferences about the operator’s intention and possible future actions. This node would berelevant to a system that can merely be personalized for a particular operator
What affects the ability of the SVS to “understand” what the operator wantspersonalized? (Note: FOV is the only feature of the SVS that can be personalized)
• Functioning/malfunctioning of hardware/software
World Model Node:Represents the machines internal representations of the operational environment
What affects the SVS current model of the world?**Note: these are the same characteristics as listed under “infer world state node”
• Accuracy of terrain database• Accuracy of GPS• Update rate of terrain database• Update rate of GPS• Functioning/malfunctioning of hardware/software• Processing time (to display data from terrain database)
*Machine Output Quadrant*
Machines Goals Node:**See previous “Machines Goals Node” for a list of characteristics
Construct Displays Node:Refers to the process of taking information to be sent to the crew and generating thedisplay required to do so. It merely represents the process of converting the informationavailable to the system into display formats for the crew.
What affects the “ability” of the SVS to process information coming into the system andcreate a display from that information?
• Processing time (to display data from terrain database)• Limitations of the machines processor• Functioning/malfunctioning of hardware/software• Update rate of terrain database• Update rate of GPS

Appendix B 12
Displays Node:Refers to the physical display devices
What affects the display quality of the information presented by the SVS?
• Lighting conditions in the cockpit• Glare on SVS• Physical condition of display surfaces
Comprehensive List (Separated by Category):
Environment:Accuracy of information from displays other than the SVSAltitude of the aircraft (too low/high?)Amount of information available from displays other than the SVSAmount of noise in cockpitATC workloadCeiling visibility at destination airportDegree of redundant coding of SVS dataDegree of time pressure (is aircraft arriving on time, early, or late?)Difficulty of approachDifficulty of landingDifficulty of terrain environment at destination airportFunctioning/malfunctioning of displays other than the SVSGlare on displays other than the SVSLighting conditions in the cockpitPhysical state of the aircraftPhysical state of the enginesSpeed of aircraft (too low/high?)Traffic situation at destination airportUsability/intuitiveness of displays other than the SVSWeather conditions at destination airport
Pilot:Accuracy of pilots mental model of the environmentAccuracy of pilots mental model of the SVSAmount of collaboration with crew membersAmount of display cross-checkingAmount of time spent looking out-the-windowAmount of time spent reading instruments other than the SVSAmount of time spent viewing the SVS displayAmount of trust in crew membersAmount of trust in SVSAmount of trust in systems other than the SVS

Appendix B 13
Current level of SADegree of pilot fatigueExperience and ability of the pilotExperience using the SVSExperience with terrain surrounding destination airportInference delayInference errorLevel of mental workloadLevel of self confidenceNumber of errors in perceiving SVS dataPilot error when using the SVSPilot experience with this specific approachPilot experience with this specific landingPilot preferencePilots level of confidence in his/her perception of the SVSPilots level of confidence in his/her perception of the worldPilots level of confidence in the accuracy of the SVSProximity to the destination airport
Machine:Ability to declutter SVS displayAccuracy of GPSAccuracy of terrain databaseAuditory vs. visual warningColor of symbols/textColor of terrainDegree of display clutterDegree of overlay with PFD dataDisplay sizeFeedback delayFOV currently depicted on the SVS displayFunctioning/malfunctioning of hardware/softwareGlare on SVSIntuitiveness/usability of the SVSLayout of controlsLimitations of the machines processorLocation of the SVS display in the cockpitNumber of errors in perceiving SVS dataNumber of highlighted features currently in viewNumber of key presses required to access desired informationNumber of layers in menu structureNumber of obstacles currently in viewPhysical condition of display surfacesPictorial scene information densityPlacement of controlsProcessing time (to display data from terrain database)

Appendix B 14
Size of symbols/textTactile feedback from controlsUpdate rate of GPSUpdate rate of terrain database

Appendix C
Rec
eiver
sA
ccur
acy
ofin
form
atio
nfr
omdi
spla
ysot
her t
han
the
SVS
Alti
tude
ofth
eai
rcra
ft(to
olo
w/h
igh?
)
Am
ount
ofin
form
atio
nav
aila
ble
from
disp
lays
othe
r tha
nSV
S
Am
ount
ofno
ise
inth
eco
ckpi
t
ATC
wor
kloa
dC
eilin
gvi
sibi
lity
atde
stina
tion
airp
ort
Deg
reeo
f red
unda
ntco
ding
ofSV
Sda
ta
Deg
reeo
f tim
epr
essu
re
Diff
icul
tyof
appr
oach
Diff
icul
tyof
land
ing
Diff
icul
tyof
terr
ain
envi
ron
Func
tioni
ng/m
alf
Gla
re
DriversEnvironment Accuracy of information from displays other than the SVS 1 1 1 1
Altitude of the aircraft (too low/high?) 1 1 1
Amount of information available from displays other than SVS 1 1
Amount of noise in cockpitATC workloadCeiling visibility at destination airport 1 1 1 1
Degree of redundant coding of SVS dataDegree of time pressure 1 1 1
Difficulty of approach 1 1
Difficulty of landing 1
Difficulty of terrain environment at destination airport 1 1 1
Functioning/malfunctioning of displays other than the SVS 1 1 1 1
Glare on displays other than the SVS 1 1
Lighting conditions in the cockpit 1

Physical state of the aircraft 1 1 1 1
Physical state of the engines 1 1 1 1
Speed of aircraft (too low/high?) 1 1 1
Traffic situation at destination airport 1 1 1
Usability/intuitiveness of displays other than the SVS 1 1
Weather conditions at destination airport 1 1 1 1
Pilot Accuracy of pilots mental model of the environment 1 1
Accuracy of pilots mental model of the SVS 1 1
Amount of collaboration with crew members 1 1
Amount of display cross-checking 1 1
Amount of time spent looking out-the-window 1 1
Amount of time spent reading instruments other than the SVS 1 1
Amount of time spent viewing the SVS display 1 1
Amount of trust in crew members 1 1
Amount of trust in SVSAmount of trust in systems other than the SVSCurrent level of SA 1 1
Degree of pilot fatigue 1 1
Experience and ability of the pilot 1 1 1
Experience using the SVS 1 1
Experience with terrain surrounding destination airport 1 1
Inference delayInference error 1 1
Level of mental workload 1 1
Level of self confidenceNumber of errors in perceiving SVS data 1 1
Pilot error when using the SVS 1 1
Pilot experience with this specific approach 1 1
Pilot experience with this specific landing 1 1
Pilot preferencePilots level of confidence in his/her perception of the SVSPilots level of confidence in his/her perception of the worldPilots level of confidence in the accuracy of the SVSProximity to the destination airport
Machine Ability to declutter SVS display 1 1

Accuracy of GPS 1 1 1 1
Accuracy of terrain database 1 1 1 1
Auditory vs. visual warning 1 1
Color of symbols/text 1 1
Color of terrain 1 1
Degree of display clutter 1 1
Degree of overlay with PFD data 1 1
Display size 1 1
Feedback delay 1 1
FOV currently depicted on the SVS display 1 1
Functioning/malfunctioning of hardware/software 1 1
Glare on SVS 1 1
Intuitiveness/usability of the SVS 1 1
Layout of controls 1 1
Limitations of the machines processor 1 1
Location of the SVS display in the cockpit 1 1
Number of highlighted features currently in view 1 1
Number of key presses required to access desired information 1 1
Number of layers in menu structure 1 1
Number of obstacles currently in view 1 1
Physical condition of display surfaces 1 1
Pictorial scene information density 1 1
Placement of controls 1 1
Processing time (to display data from terrain database) 1 1
Size of symbols/text 1 1
Tactile feedback from controlsUpdate rate of GPS 1 1
Update rate of terrain database 1 1
SENSITIVITY TOTAL 0 9 0 0 14 0 0 1 61 62 0 0 1
SENSITIVITY RANK (2) 63 23.5 63 63 17.5 63 63 45 3 2 63 63 45


Environment Pilot
ronm
ent a
tdes
tinat
ion
airp
ort
mal
func
tioni
ngof
disp
lays
othe
r tha
nthe
SVS
are
ondi
spla
ysot
her t
han
theSV
S
Ligh
ting
cond
ition
sin
the
cock
pit
Phys
ical
stat
eof
the
airc
raft
Phys
ical
stat
eof
the
engi
nes
Spee
dof
the
airc
raft
(too
low
/hig
h?)
Traf
ficsi
tuat
ion
atde
stina
tion
airp
ort
Usa
bilit
y/in
tuiti
vene
ssof
disp
lays
othe
r tha
nth
eSV
S
Wea
ther c
ondi
tions
atde
stina
tion
airp
ort
Acc
urac
yof
pilo
tsm
enta
l mod
elof
the
envi
ronm
ent
Acc
urac
yof
pilo
tsm
enta
l mod
elfo
the
SVS
Am
ount
ofco
llabo
ratio
nw
ithcr
ewm
embe
rs
Am
ount
ofdi
spla
y cro
ss-c
heck
ing
Am
ount
oftim
esp
ent l
ooki
ngou
t-the
-win
dow
Am
ount
oftim
esp
ent r
eadi
ngin
stru
men
tsot
her t
han
SVS
Am
ount
oftim
esp
ent v
iew
ing
the
SVS
disp
lay
Am
ount
oftru
stin
crew
mem
bers
Am
ount
oftru
stin
SVS
Am
ount
oftru
stin
syst
ems
othe
r tha
nthe
SVS
Cur
rent
leve
l of S
A
Deg
reeo
f pilo
t fat
igue
Exp
erie
ncea
ndab
ility
ofth
epi
lot
Exp
erie
nceu
sing
the
SVS
Exp
erie
ncew
ithte
rrain
surr
ound
ing
dest
inat
ion
airp
ort
Infe
renc
edel
ayIn
fere
ncee
rror
Leve
l of m
enta
l wor
kloa
d
Leve
l of s
elf c
onfid
ence
Num
bero
f erro
rsin
perc
eivi
Pilo
t erro
r whe
nu
Pilo
t e
1 1 1 1 1 1 1 1 1
1
1 1 1 1 1 1 1
1 1 1
1 1 1 1 1 1 1 1
1 1 1 1 1 1 1 1 1 1 1
1 1 1 1 1 1 1 1
1 1 1 1 1 1 1 1 1 1
1 1 1 1 1 1 1 1 1 1
1 1 1 1 1 1 1 1 1 1 1 1
1 1 1 1 1 1 1 1 1 1
1 1 1 1

11
11
11
11 1
11
11
11
1
11
11
11
11
11
11
11
11
11
11
1
11
11
11
11
11
11
11
11
11
11
11
11
11
11
11
11
11
11
1
11
11
11
11
11
11
11
11
11
11
11
11
11
11
11
11
11
11
11
11
11
11
11
11
11
1
11
11
11
11
11
11
11
11
11
1
11
11
11
11
11
11
11
11
11
11
11
11
11
11
1
11
11
11
11
11
11
11
1
11
11
1
11

11
11
11
11
11
11
11
11
11
11
11
11
11
11
11
11
11
11
11
11
1
11
11
11
11
11
11
11
11
11
11
11
11
1
11
11
11
11
11
1
11
11
11
11
11
11
11
11
11
11
11
11
11
11
11
11
11
11
1
11
11
11
11
11
11
11
11
11
11
1
11
11
1
11
1
11
11
11
1
11
11
1
11
11
11
11
11
11
11
11
11
1
11
11
1
11
11
11
1
11
11
11
11
11
11
11
11
11
11
00
09
00
04
43
14
28
43
52
51
18
54
68
02
09
96
31
83
23
10
63
63
63
23
.56
36
36
37
11
35
.51
38
45
45
27
.53
2.5
62
7.5
63
40
63
23
.52
3.5
11
59
11
63


Machine
ceiv
ing
SVS
data
hen
usin
gth
eSV
S
otex
perie
ncew
ithth
issp
ecif i
cap
proa
ch
Pilo
t exp
eric
ence
with
this
spec
ific
land
ing
Pilo
t pre
fere
nce
Pilo
tsle
vel o
f con
fiden
cein
his/
her p
erce
ptio
nof
the
SVS
Pilo
tsle
vel o
f con
fiden
cein
his/
her p
erce
ptio
nof
the
wor
ld
Pilo
tsle
vel o
f con
fiden
cein
the
accu
racy
ofth
eSV
S
Prox
imity
tode
stina
tion
airp
ort
Abi
lity
tode
clutte
rSV
Sdi
spla
y
Acc
urac
yof
GPS
Acc
urac
yof
terra
inda
taba
se
Aud
itory
vs. v
isua
l war
ning
Col
orof
sym
bols
/text
Col
orof
terr
ain
Deg
reeo
f dis
play
clutte
r
Deg
reeo
f ove
rlayw
ithPF
Dda
ta
Dis
play
size
Feed
back
dela
yFO
Vcu
rren
tlyde
pict
edon
the
SVS
disp
lay
Func
tioni
ng/m
alfu
nctio
ning
ofha
rdw
are/
softw
are
Gla
reon
SVS
Intu
itive
ness
/usa
bilit
yof
the
SVS
Layo
utof
cont
rols
Lim
iatio
nsof
the
mac
hines
proc
esso
r
Loca
tion
ofth
eSV
Sdi
spla
y
Num
bero
f hig
hlig
hted
featu
resc
urre
ntly
invi
ew
Num
bero
f key
pres
sesr
equi
red
toac
cess
desir
edi
Num
bero
f lay
ers
inm
enu
stru
ctur
e
Num
bero
f obs
tacle
scur
rent
l
Phys
ical
cond
itio
Pict
ori
1 1
1 1 1
1
1 1
1 1 1
1 1
1 1 1 1 1 1 1 1
1 1 1 1 1 1 1 1
1 1 1 1 1 1 1 1 1
1 1 1
1

11
11
1
11
1
1
11
1 1
11
11
11
1
11
11
11
1
11
1
1 1
11
11
11
11
11
1
1

11
11
11
11
11
1
11
1
11
11
11
11
11
11
11
11
1
1
1
1
11
11
11
11
11
11
11
1
11
11
11 1 1
1
11 1
11
11
11 1
1
1 1 1 1 1
00
14
21
15
00
00
96
61
11
19
46
00
31
40
40
21
10
5
63
63
17
.51
41
66
36
36
36
32
3.5
30
30
19
.51
9.5
23
.53
5.5
30
63
63
11
35
.56
33
5.5
63
40
45
45
63
32
.5

l

redinformation
e rentlyinview
ditionofdisp
laysurfaces
ctorialsceneinformationdensit
y
Placementofcontrols
Processingtim
e(todisp
laydatafromterra
indatabase)
Sizeofsymbols/text
Tactilefeedbackfro
mcontrols
UpdaterateofGPS
Updaterateofterraindatabase
INFLUENCETOTAL
INFLUENCE(2)
15
16
.5
46
9.5
12
30
.5
46
9.5
07
7
14
22
.5
14
22
.5
13
27
.5
20
5
19
7
24
2
17
9.5
75
3
17
5.5

84
8
84
8
46
9.5
56
4
75
3
14
22
.5
65
8.5
84
8
56
4
15
16
.5
15
16
.5
94
1.5
15
16
.5
37
3.5
75
3
46
9.5
84
8
84
8
22
3
16
12
.5
11
33
.5
17
5.5
65
8.5
15
16
.5
56
4
65
8.5
65
8.5
11
33
.5
11
33
.5
11
17
9.5
46
9.5
46
9.5
75
3
65
8.5
56
4

20
5
20
5
13
27
.5
14
22
.5
12
30
.5
14
22
.5
15
16
.5
11
42
2.5
10
36
.5
56
4
13
27
.5
16
12
.5
11
13
01
75
3
11
79
.5
94
1.5
94
1.5
65
8.5
11
33
.5
94
1.5
13
27
.5
17
9.5
94
1.5
10
36
.5
94
1.5
37
3.5
94
1.5
94
1.5
21
31
00
40
45
38
45
63
63


INFLUENCE TOTALS SCORE RANK RANK (2)m Intuitiveness/usability of the SVS 30 1 1
w Difficulty of terrain environment at destination airport 24 2 2
p Experience and ability of the pilot 22 3 3
w Difficulty of approach 20 4 5
m Accuracy of GPS 20 4 5
m Accuracy of terrain database 20 4 5
w Difficulty of landing 19 7 7
w Functioning/malfunctioning of displays other than the SVS 17 8 9.5
p Pilot preference 17 8 9.5
m Limitations of the machines processor 17 8 9.5
m Pictorial scene information density 17 8 9.5
p Experience using the SVS 16 12 12.5
m Glare on SVS 16 12 12.5
w Accuracy of information from displays other than the SVS 15 14 16.5
p Amount of display cross-checking 15 14 16.5
p Amount of time spent looking out-the-window 15 14 16.5
p Amount of time spent viewing the SVS display 15 14 16.5
p Level of mental workload 15 14 16.5
m Degree of overlay with PFD data 15 14 16.5
w Ceiling visibility at destination airport 14 20 22.5
w Degree of redundant coding of SVS data 14 20 22.5
w Weather conditions at destination airport 14 20 22.5
m Color of symbols/text 14 20 22.5
m Degree of display clutter 14 20 22.5
m Display size 14 20 22.5
w Degree of time pressure (is aircraft arriving on time, early) 13 26 27.5
m Auditory vs. visual warning 13 26 27.5
m Functioning/malfunctioning of hardware/software 13 26 27.5
m Physical condition of display surfaces 13 26 27.5
w Amount of information available from displays other SVS 12 30 30.5
m Color of terrain 12 30 30.5
p Experience with terrain surrounding destination airport 11 32 33.5
p Pilot experience with this specific approach 11 32 33.5
p Pilot experience with this specific landing 11 32 33.5
m Number of layers in menu structure 11 32 33.5
m Feedback delay 10 36 36.5
m Processing time (to display data from terrain database) 10 36 36.5
p Amount of time spent reading instruments other than the SVS 9 38 41.5
m Location of the SVS display in the cockpit 9 38 41.5
m Number of highlighted features currently in view 9 38 41.5
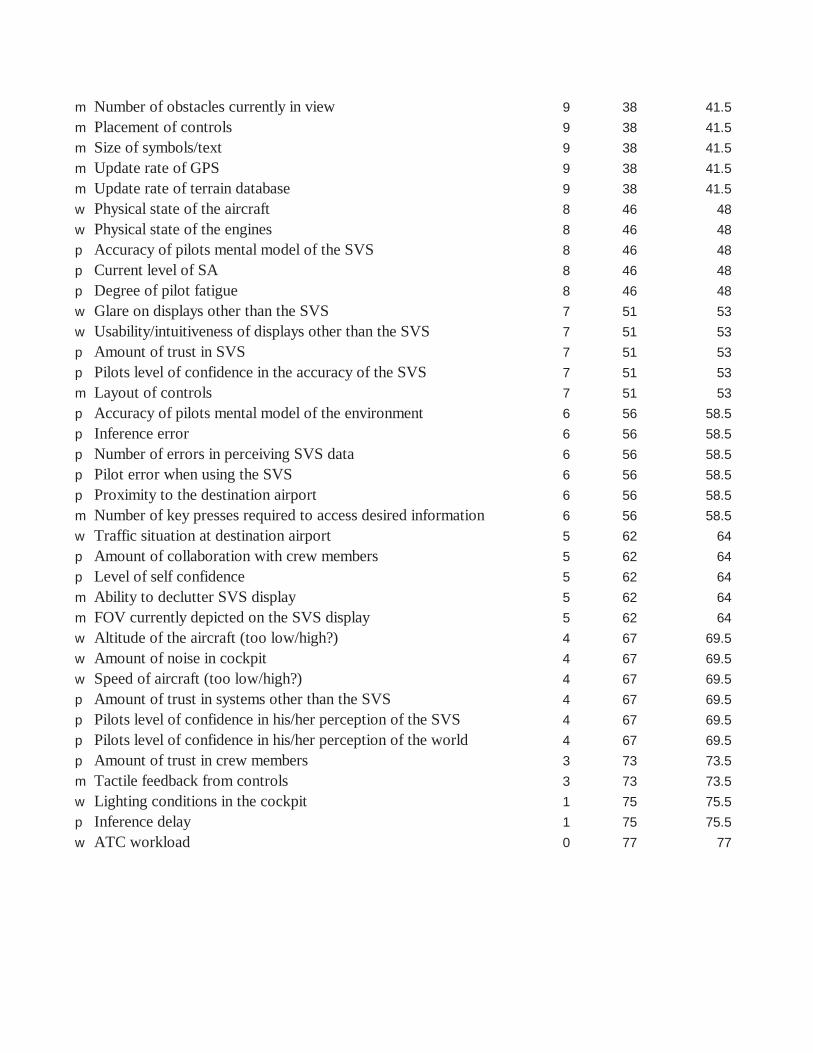
m Number of obstacles currently in view 9 38 41.5
m Placement of controls 9 38 41.5
m Size of symbols/text 9 38 41.5
m Update rate of GPS 9 38 41.5
m Update rate of terrain database 9 38 41.5
w Physical state of the aircraft 8 46 48
w Physical state of the engines 8 46 48
p Accuracy of pilots mental model of the SVS 8 46 48
p Current level of SA 8 46 48
p Degree of pilot fatigue 8 46 48
w Glare on displays other than the SVS 7 51 53
w Usability/intuitiveness of displays other than the SVS 7 51 53
p Amount of trust in SVS 7 51 53
p Pilots level of confidence in the accuracy of the SVS 7 51 53
m Layout of controls 7 51 53
p Accuracy of pilots mental model of the environment 6 56 58.5
p Inference error 6 56 58.5
p Number of errors in perceiving SVS data 6 56 58.5
p Pilot error when using the SVS 6 56 58.5
p Proximity to the destination airport 6 56 58.5
m Number of key presses required to access desired information 6 56 58.5
w Traffic situation at destination airport 5 62 64
p Amount of collaboration with crew members 5 62 64
p Level of self confidence 5 62 64
m Ability to declutter SVS display 5 62 64
m FOV currently depicted on the SVS display 5 62 64
w Altitude of the aircraft (too low/high?) 4 67 69.5
w Amount of noise in cockpit 4 67 69.5
w Speed of aircraft (too low/high?) 4 67 69.5
p Amount of trust in systems other than the SVS 4 67 69.5
p Pilots level of confidence in his/her perception of the SVS 4 67 69.5
p Pilots level of confidence in his/her perception of the world 4 67 69.5
p Amount of trust in crew members 3 73 73.5
m Tactile feedback from controls 3 73 73.5
w Lighting conditions in the cockpit 1 75 75.5
p Inference delay 1 75 75.5
w ATC workload 0 77 77

SENSITIVITY TOTALS SCORE RANK RANK (2)m Level of mental workload 63 1 1
m Difficulty of landing 62 2 2
m Difficulty of approach 61 3 3
m Amount of time spent reading instruments other than the SVS 52 4 4
m Amount of time spent viewing the SVS display 51 5 5
m Current level of SA 46 6 6
m Accuracy of pilots mental model of the environment 44 7 7
m Amount of time spent looking out-the-window 43 8 8
m Number of errors in perceiving SVS data 32 9 9
m Intuitiveness/usability of the SVS 31 10 11
m Accuracy of pilots mental model of the SVS 31 10 11
m Pilot error when using the SVS 31 10 11
m Amount of display cross-checking 28 13 13
m Pilots level of confidence in his/her perception of the world 21 14 14
m Level of self confidence 18 15 15
m Pilots level of confidence in the accuracy of the SVS 15 16 16
m Pilots level of confidence in his/her perception of the SVS 14 17 17.5
m ATC workload 14 17 17.5
m Degree of display clutter 11 19 19.5
m Degree of overlay with PFD data 11 19 19.5
m Auditory vs. visual warning 9 21 23.5
m Display size 9 21 23.5
m Inference delay 9 21 23.5
m Inference error 9 21 23.5
m Altitude of the aircraft (too low/high?) 9 21 23.5
m Speed of aircraft (too low/high?) 9 21 23.5
m Amount of trust in SVS 8 27 27.5
m Degree of pilot fatigue 8 27 27.5
m Color of symbols/text 6 29 30
p Color of terrain 6 29 30
p FOV currently depicted on the SVS display 6 29 30
p Pictorial scene information density 5 32 32.5
p Amount of trust in systems other than the SVS 5 32 32.5
p Feedback delay 4 34 35.5
p Layout of controls 4 34 35.5
p Location of the SVS display in the cockpit 4 34 35.5
p Amount of collaboration with crew members 4 34 35.5
p Size of symbols/text 3 38 38
p Number of key presses required to access desired information 2 39 40
p Placement of controls 2 39 40

p Experience using the SVS 2 39 40
p Number of layers in menu structure 1 42 45
p Number of obstacles currently in view 1 42 45
p Processing time (to display data from terrain database) 1 42 45
p Tactile feedback from controls 1 42 45
p Amount of trust in crew members 1 42 45
p Degree of time pressure (is aircraft arriving on time, early) 1 42 45
p Glare on displays other than the SVS 1 42 45
p Ability to declutter SVS display 0 49 63
p Accuracy of GPS 0 49 63
p Accuracy of terrain database 0 49 63
p Functioning/malfunctioning of hardware/software 0 49 63
p Glare on SVS 0 49 63
p Limitations of the machines processor 0 49 63
p Number of highlighted features currently in view 0 49 63
p Physical condition of display surfaces 0 49 63
p Update rate of GPS 0 49 63
w Update rate of terrain database 0 49 63
w Experience and ability of the pilot 0 49 63
w Experience with terrain surrounding destination airport 0 49 63
w Pilot experience with this specific approach 0 49 63
w Pilot experience with this specific landing 0 49 63
w Pilot preference 0 49 63
w Proximity to the destination airport 0 49 63
w Accuracy of information from displays other than the SVS 0 49 63
w Amount of information available from displays other SVS 0 49 63
w Amount of noise in cockpit 0 49 63
w Ceiling visibility at destination airport 0 49 63
w Degree of redundant coding of SVS data 0 49 63
w Difficulty of terrain environment at destination airport 0 49 63
w Functioning/malfunctioning of displays other than the SVS 0 49 63
w Lighting conditions in the cockpit 0 49 63
w Physical state of the aircraft 0 49 63
w Physical state of the engines 0 49 63
w Traffic situation at destination airport 0 49 63
w Usability/intuitiveness of displays other than the SVS 0 49 63
w Weather conditions at destination airport 0 49 63

INFLUENCE TOTALS SCORE RANK RANK (2)EnvironmentDifficulty of terrain environment at destination airport 24 2 2
Difficulty of approach 20 4 5
Difficulty of landing 19 7 7
Functioning/malfunctioning of displays other than the SVS 17 8 9.5
Accuracy of information from displays other than the SVS 15 14 16.5
Ceiling visibility at destination airport 14 20 22.5
Degree of redundant coding of SVS data 14 20 22.5
Weather conditions at destination airport 14 20 22.5
Degree of time pressure (is aircraft arriving on time, early) 13 26 27.5
Amount of information available from displays other SVS 12 30 30.5
Physical state of the aircraft 8 46 48
Physical state of the engines 8 46 48
Glare on displays other than the SVS 7 51 53
Usability/intuitiveness of displays other than the SVS 7 51 53
Traffic situation at destination airport 5 62 64
Altitude of the aircraft (too low/high?) 4 67 69.5
Amount of noise in cockpit 4 67 69.5
Speed of aircraft (too low/high?) 4 67 69.5
Lighting conditions in the cockpit 1 75 75.5
ATC workload 0 77 77
PilotExperience and ability of the pilot 22 3 3
Pilot preference 17 8 9.5
Experience using the SVS 16 12 12.5
Amount of display cross-checking 15 14 16.5
Amount of time spent looking out-the-window 15 14 16.5
Amount of time spent viewing the SVS display 15 14 16.5
Level of mental workload 15 14 16.5
Experience with terrain surrounding destination airport 11 32 33.5
Pilot experience with this specific approach 11 32 33.5
Pilot experience with this specific landing 11 32 33.5
Amount of time spent reading instruments other than the SV 9 38 41.5
Accuracy of pilots mental model of the SVS 8 46 48
Current level of SA 8 46 48
Degree of pilot fatigue 8 46 48
Amount of trust in SVS 7 51 53
Pilots level of confidence in the accuracy of the SVS 7 51 53
Accuracy of pilots mental model of the environment 6 56 58.5

Inference error 6 56 58.5
Number of errors in perceiving SVS data 6 56 58.5
Pilot error when using the SVS 6 56 58.5
Proximity to the destination airport 6 56 58.5
Amount of collaboration with crew members 5 62 64
Level of self confidence 5 62 64
Amount of trust in systems other than the SVS 4 67 69.5
Pilots level of confidence in his/her perception of the SVS 4 67 69.5
Pilots level of confidence in his/her perception of the world 4 67 69.5
Amount of trust in crew members 3 73 73.5
Inference delay 1 75 75.5
MachineIntuitiveness/usability of the SVS 30 1 1
Accuracy of GPS 20 4 5
Accuracy of terrain database 20 4 5
Limitations of the machines processor 17 8 9.5
Pictorial scene information density 17 8 9.5
Glare on SVS 16 12 12.5
Degree of overlay with PFD data 15 14 16.5
Color of symbols/text 14 20 22.5
Degree of display clutter 14 20 22.5
Display size 14 20 22.5
Auditory vs. visual warning 13 26 27.5
Functioning/malfunctioning of hardware/software 13 26 27.8
Physical condition of display surfaces 13 26 27.8
Color of terrain 12 30 30.5
Number of layers in menu structure 11 32 33.5
Feedback delay 10 36 36.5
Processing time (to display data from terrain database) 10 36 36.5
Location of the SVS display in the cockpit 9 38 41.5
Number of highlighted features currently in view 9 38 41.5
Number of obstacles currently in view 9 38 41.5
Placement of controls 9 38 41.5
Size of symbols/text 9 38 41.5
Update rate of GPS 9 38 41.5
Update rate of terrain database 9 38 41.5
Layout of controls 7 51 53
Number of key presses required to access desired informati 6 56 58.5
Ability to declutter SVS display 5 62 64
FOV currently depicted on the SVS display 5 62 64
Tactile feedback from controls 3 73 73.5

SENSITIVITY TOTALS SCORE RANK RANK (2)EnvironmentDifficulty of approach 61 3 3
ATC workload 14 17 17.5
Altitude of the aircraft (too low/high?) 9 21 23.5
Speed of aircraft (too low/high?) 9 21 23.5
Degree of time pressure (is aircraft arriving on time, early) 1 42 45
Glare on displays other than the SVS 1 42 45
Accuracy of information from displays other than the SVS 0 49 63
Amount of information available from displays other SVS 0 49 63
Amount of noise in cockpit 0 49 63
Ceiling visibility at destination airport 0 49 63
Degree of redundant coding of SVS data 0 49 63
Difficulty of terrain environment at destination airport 0 49 63
Functioning/malfunctioning of displays other than the SVS 0 49 63
Lighting conditions in the cockpit 0 49 63
Physical state of the aircraft 0 49 63
Physical state of the engines 0 49 63
Traffic situation at destination airport 0 49 63
Usability/intuitiveness of displays other than the SVS 0 49 63
Weather conditions at destination airport 0 49 63
PilotLevel of mental workload 63 1 1
Amount of time spent reading instruments other than the SV 52 4 4
Amount of time spent viewing the SVS display 51 5 5
Current level of SA 46 6 6
Accuracy of pilots mental model of the environment 44 7 7
Amount of time spent looking out-the-window 43 8 8
Number of errors in perceiving SVS data 32 9 9
Accuracy of pilots mental model of the SVS 31 10 11
Pilot error when using the SVS 31 10 11
Amount of display cross-checking 28 13 13
Pilots level of confidence in his/her perception of the world 21 14 14
Level of self confidence 18 15 15
Pilots level of confidence in the accuracy of the SVS 15 16 16
Pilots level of confidence in his/her perception of the SVS 14 17 17.5
Inference delay 9 21 23.5
Inference error 9 21 23.5
Amount of trust in SVS 8 27 27.5

Degree of pilot fatigue 8 27 27.5
Amount of trust in systems other than the SVS 5 32 32.5
Amount of collaboration with crew members 4 34 35.5
Experience using the SVS 2 39 40
Amount of trust in crew members 1 42 45
Experience and ability of the pilot 0 49 63
Experience with terrain surrounding destination airport 0 49 63
Pilot experience with this specific approach 0 49 63
Pilot experience with this specific landing 0 49 63
Pilot preference 0 49 63
Proximity to the destination airport 0 49 63
MachineIntuitiveness/usability of the SVS 31 10 11
Degree of display clutter 11 19 19.5
Degree of overlay with PFD data 11 19 19.5
Auditory vs. visual warning 9 21 23.5
Display size 9 21 23.5
Color of symbols/text 6 29 30
Color of terrain 6 29 30
FOV currently depicted on the SVS display 6 29 30
Pictorial scene information density 5 32 32.5
Feedback delay 4 34 35.5
Layout of controls 4 34 35.5
Location of the SVS display in the cockpit 4 34 35.5
Size of symbols/text 3 38 38
Number of key presses required to access desired informati 2 39 40
Placement of controls 2 39 40
Number of layers in menu structure 1 42 45
Number of obstacles currently in view 1 42 45
Processing time (to display data from terrain database) 1 42 45
Tactile feedback from controls 1 42 45
Ability to declutter SVS display 0 49 63
Accuracy of GPS 0 49 63
Accuracy of terrain database 0 49 63
Functioning/malfunctioning of hardware/software 0 49 63
Glare on SVS 0 49 63
Limitations of the machines processor 0 49 63
Number of highlighted features currently in view 0 49 63
Physical condition of display surfaces 0 49 63
Update rate of GPS 0 49 63
Update rate of terrain database 0 49 63

INFLUENCE TOTALS SCORE RANKAbility to declutter SVS display 5 62
Accuracy of GPS 20 4
Accuracy of information from displays other than the SVS 15 14
Accuracy of pilots mental model of the environment 6 56
Accuracy of pilots mental model of the SVS 8 46
Accuracy of terrain database 20 4
Altitude of the aircraft (too low/high?) 4 67
Amount of collaboration with crew members 5 62
Amount of display cross-checking 15 14
Amount of information available from displays other SVS 12 30
Amount of noise in cockpit 4 67
Amount of time spent looking out-the-window 15 14
Amount of time spent reading instruments other than the SVS 9 38
Amount of time spent viewing the SVS display 15 14
Amount of trust in crew members 3 73
Amount of trust in SVS 7 51
Amount of trust in systems other than the SVS 4 67
ATC workload 0 77
Auditory vs. visual warning 13 26
Ceiling visibility at destination airport 14 20
Color of symbols/text 14 20
Color of terrain 12 30
Current level of SA 8 46
Degree of display clutter 14 20
Degree of overlay with PFD data 15 14
Degree of pilot fatigue 8 46
Degree of redundant coding of SVS data 14 20
Degree of time pressure (is aircraft arriving on time, early) 13 26
Difficulty of approach 20 4
Difficulty of landing 19 7
Difficulty of terrain environment at destination airport 24 2
Display size 14 20
Experience and ability of the pilot 22 3
Experience using the SVS 16 12
Experience with terrain surrounding destination airport 11 32
Feedback delay 10 36
FOV currently depicted on the SVS display 5 62
Functioning/malfunctioning of displays other than the SVS 17 8
Functioning/malfunctioning of hardware/software 13 26
Glare on displays other than the SVS 7 51

Glare on SVS 16 12
Inference delay 1 75
Inference error 6 56
Intuitiveness/usability of the SVS 30 1
Layout of controls 7 51
Level of mental workload 15 14
Level of self confidence 5 62
Lighting conditions in the cockpit 1 75
Limitations of the machines processor 17 8
Location of the SVS display in the cockpit 9 38
Number of errors in perceiving SVS data 6 56
Number of highlighted features currently in view 9 38
Number of key presses required to access desired information 6 56
Number of layers in menu structure 11 32
Number of obstacles currently in view 9 38
Physical condition of display surfaces 13 26
Physical state of the aircraft 8 46
Physical state of the engines 8 46
Pictorial scene information density 17 8
Pilot error when using the SVS 6 56
Pilot experience with this specific approach 11 32
Pilot experience with this specific landing 11 32
Pilot preference 17 8
Pilots level of confidence in his/her perception of the SVS 4 67
Pilots level of confidence in his/her perception of the world 4 67
Pilots level of confidence in the accuracy of the SVS 7 51
Placement of controls 9 38
Processing time (to display data from terrain database) 10 36
Proximity to the destination airport 6 56
Size of symbols/text 9 38
Speed of aircraft (too low/high?) 4 67
Tactile feedback from controls 3 73
Traffic situation at destination airport 5 62
Update rate of GPS 9 38
Update rate of terrain database 9 38
Usability/intuitiveness of displays other than the SVS 7 51
Weather conditions at destination airport 14 20
SENSITIVITY TOTALS SCORE RANKAbility to declutter SVS display 0 49
Accuracy of GPS 0 49

Accuracy of information from displays other than the SVS 0 49
Accuracy of pilots mental model of the environment 44 7
Accuracy of pilots mental model of the SVS 31 10
Accuracy of terrain database 0 49
Altitude of the aircraft (too low/high?) 9 21
Amount of collaboration with crew members 4 34
Amount of display cross-checking 28 13
Amount of information available from displays other SVS 0 49
Amount of noise in cockpit 0 49
Amount of time spent looking out-the-window 43 8
Amount of time spent reading instruments other than the SVS 52 4
Amount of time spent viewing the SVS display 51 5
Amount of trust in crew members 1 42
Amount of trust in SVS 8 27
Amount of trust in systems other than the SVS 5 32
ATC workload 14 17
Auditory vs. visual warning 9 21
Ceiling visibility at destination airport 0 49
Color of symbols/text 6 29
Color of terrain 6 29
Current level of SA 46 6
Degree of display clutter 11 19
Degree of overlay with PFD data 11 19
Degree of pilot fatigue 8 27
Degree of redundant coding of SVS data 0 49
Degree of time pressure (is aircraft arriving on time, early) 1 42
Difficulty of approach 61 3
Difficulty of landing 62 2
Difficulty of terrain environment at destination airport 0 49
Display size 9 21
Experience and ability of the pilot 0 49
Experience using the SVS 2 39
Experience with terrain surrounding destination airport 0 49
Feedback delay 4 34
FOV currently depicted on the SVS display 6 29
Functioning/malfunctioning of displays other than the SVS 0 49
Functioning/malfunctioning of hardware/software 0 49
Glare on displays other than the SVS 1 42
Glare on SVS 0 49
Inference delay 9 21
Inference error 9 21
Intuitiveness/usability of the SVS 31 10

Layout of controls 4 34
Level of mental workload 63 1
Level of self confidence 18 15
Lighting conditions in the cockpit 0 49
Limitations of the machines processor 0 49
Location of the SVS display in the cockpit 4 34
Number of errors in perceiving SVS data 32 9
Number of highlighted features currently in view 0 49
Number of key presses required to access desired information 2 39
Number of layers in menu structure 1 42
Number of obstacles currently in view 1 42
Physical condition of display surfaces 0 49
Physical state of the aircraft 0 49
Physical state of the engines 0 49
Pictorial scene information density 5 32
Pilot error when using the SVS 31 10
Pilot experience with this specific approach 0 49
Pilot experience with this specific landing 0 49
Pilot preference 0 49
Pilots level of confidence in his/her perception of the SVS 14 17
Pilots level of confidence in his/her perception of the world 21 14
Pilots level of confidence in the accuracy of the SVS 15 16
Placement of controls 2 39
Processing time (to display data from terrain database) 1 42
Proximity to the destination airport 0 49
Size of symbols/text 3 38
Speed of aircraft (too low/high?) 9 21
Tactile feedback from controls 1 42
Traffic situation at destination airport 0 49
Update rate of GPS 0 49
Update rate of terrain database 0 49
Usability/intuitiveness of displays other than the SVS 0 49
Weather conditions at destination airport 0 49
TOP FIFTEEN CHARACTERISTICS (INFLUENCE) SCORE RANK
Intuitiveness/usability of the SVS 30 1
Difficulty of terrain environment at destination airport 24 2
Experience and ability of the pilot 22 3
Difficulty of approach 20 4
Accuracy of GPS 20 4

Accuracy of terrain database 20 4
Difficulty of landing 19 7
Functioning/malfunctioning of displays other than the SVS 17 8
Pilot preference 17 8
Limitations of the machines processor 17 8
Pictorial scene information density 17 8
Experience using the SVS 16 12
Glare on SVS 16 12
Accuracy of information from displays other than the SVS 15 14
Amount of display cross-checking 15 14
TOP FIFTEEN CHARACTERISTICS (SENSITIVITY) SCORE RANK
Level of mental workload 63 1
Difficulty of landing 62 2
Difficulty of approach 61 3
Amount of time spent reading instruments other than the SVS 52 4
Amount of time spent viewing the SVS display 51 5
Current level of SA 46 6
Accuracy of pilots mental model of the environment 44 7
Amount of time spent looking out-the-window 43 8
Number of errors in perceiving SVS data 32 9
Accuracy of pilots mental model of the SVS 31 10
Pilot error when using the SVS 31 10
Intuitiveness/usability of the SVS 31 10
Amount of display cross-checking 28 13
Pilots level of confidence in his/her perception of the world 21 14
Level of self confidence 18 15

RANK (2)65
5
15.8
59.5
49
5
70.5
65
15.8
31.5
70.5
15.8
42.5
15.8
74.5
54
70.5
77
28.5
23.5
23.5
31.5
49
23.5
15.8
49
23.5
28.5
5
8
2
23.5
3
13.5
34.5
37.5
65
10.5
28.5
54

13.5
76.5
59.5
1
54
15.8
65
76.5
10.5
42.5
59.5
42.5
59.5
34.5
42.5
28.5
49
49
10.5
59.5
34.5
34.5
10.5
70.5
70.5
54
42.5
37.5
59.5
42.5
70.5
74.5
65
42.5
42.5
54
23.5
RANK (2)64
64

64
7
11
64
24.5
36.5
14
64
64
8
4
5
46
28.5
33.5
18.5
24.5
64
31
31
6
20.5
20.5
28.5
64
46
3
2
64
24.5
64
41
64
36.5
31
64
64
46
64
24.5
24.5
11

36.5
1
16
64
64
36.5
9
64
41
46
46
64
64
64
33.5
11
64
64
64
18.5
15
17
41
46
64
39
24.5
46
64
64
64
64
64
RANK (2)
1
2
3
5
5

5
8
10.5
10.5
10.5
10.5
13.5
13.5
15.8
15.8
RANK (2)
1
2
3
4
5
6
7
8
9
11
11
11
14
15
16

SVS MATRIX
Rec
eiver
sA
ccur
acy
ofin
form
atio
nfr
omdi
spla
ysot
her t
han
the
SVS
Alti
tude
ofth
eai
rcra
ft(to
olo
w/h
igh?
)
Am
ount
ofin
form
atio
nav
aila
ble
from
disp
lays
othe
r tha
nSV
S
Am
ount
ofno
ise
inth
eco
ckpi
t
ATC
wor
kloa
dC
eilin
gvi
sibi
lity
atde
stina
tion
airp
ort
Deg
reeo
f red
unda
ntco
ding
ofSV
Sda
ta
Deg
reeo
f tim
epr
essu
re
Diff
icul
tyof
appr
oach
Diff
icul
tyof
land
ing
Diff
icul
tyof
terr
ain
envi
ron
Func
tioni
ng/m
alf
Gla
re
DriversEnvironment Accuracy of information from displays other than the SVS 1 1 1 1
Altitude of the aircraft (too low/high?) 1 1 1
Amount of information available from displays other than SVS 1 1
Amount of noise in cockpitATC workloadCeiling visibility at destination airport 1 1 1 1
Degree of redundant coding of SVS dataDegree of time pressure 1 1 1
Difficulty of approach 1 1
Difficulty of landing 1
Difficulty of terrain environment at destination airport 1 1 1
Functioning/malfunctioning of displays other than the SVS 1 1 1 1
Glare on displays other than the SVS 1 1
Lighting conditions in the cockpit 1

Physical state of the aircraft 1 1 1 1
Physical state of the engines 1 1 1 1
Speed of aircraft (too low/high?) 1 1 1
Traffic situation at destination airport 1 1 1
Usability/intuitiveness of displays other than the SVS 1 1
Weather conditions at destination airport 1 1 1 1
Pilot Accuracy of pilots mental model of the environment 1 1
Accuracy of pilots mental model of the SVS 1 1
Amount of collaboration with crew members 1 1
Amount of display cross-checking 1 1
Amount of time spent looking out-the-window 1 1
Amount of time spent reading instruments other than the SVS 1 1
Amount of time spent viewing the SVS display 1 1
Amount of trust in crew members 1 1
Amount of trust in SVSAmount of trust in systems other than the SVSCurrent level of SA 1 1
Degree of pilot fatigue 1 1
Experience and ability of the pilot 1 1 1
Experience using the SVS 1 1
Experience with terrain surrounding destination airport 1 1
Inference delayInference error 1 1
Level of mental workload 1 1
Level of self confidenceNumber of errors in perceiving SVS data 1 1
Pilot error when using the SVS 1 1
Pilot experience with this specific approach 1 1
Pilot experience with this specific landing 1 1
Pilot preferencePilots level of confidence in his/her perception of the SVSPilots level of confidence in his/her perception of the worldPilots level of confidence in the accuracy of the SVSProximity to the destination airport
Machine Ability to declutter SVS display 1 1

Accuracy of GPS 1 1 1 1
Accuracy of terrain database 1 1 1 1
Auditory vs. visual warning 1 1
Color of symbols/text 1 1
Color of terrain 1 1
Degree of display clutter 1 1
Degree of overlay with PFD data 1 1
Display size 1 1
Feedback delay 1 1
FOV currently depicted on the SVS display 1 1
Functioning/malfunctioning of hardware/software 1 1
Glare on SVS 1 1
Intuitiveness/usability of the SVS 1 1
Layout of controls 1 1
Limitations of the machines processor 1 1
Location of the SVS display in the cockpit 1 1
Number of highlighted features currently in view 1 1
Number of key presses required to access desired information 1 1
Number of layers in menu structure 1 1
Number of obstacles currently in view 1 1
Physical condition of display surfaces 1 1
Pictorial scene information density 1 1
Placement of controls 1 1
Processing time (to display data from terrain database) 1 1
Size of symbols/text 1 1
Tactile feedback from controlsUpdate rate of GPS 1 1
Update rate of terrain database 1 1
SENSITIVITY TOTAL 0 9 0 0 14 0 0 1 61 62 0 0 1
SENSITIVITY RANK (2) 63 23.5 63 63 17.5 63 63 45 3 2 63 63 45


Environment Pilot
ronm
ent a
tdes
tinat
ion
airp
ort
mal
func
tioni
ngof
disp
lays
othe
r tha
nthe
SVS
are
ondi
spla
ysot
her t
han
theSV
S
Ligh
ting
cond
ition
sin
the
cock
pit
Phys
ical
stat
eof
the
airc
raft
Phys
ical
stat
eof
the
engi
nes
Spee
dof
the
airc
raft
(too
low
/hig
h?)
Traf
ficsi
tuat
ion
atde
stina
tion
airp
ort
Usa
bilit
y/in
tuiti
vene
ssof
disp
lays
othe
r tha
nth
eSV
S
Wea
ther c
ondi
tions
atde
stina
tion
airp
ort
Acc
urac
yof
pilo
tsm
enta
l mod
elof
the
envi
ronm
ent
Acc
urac
yof
pilo
tsm
enta
l mod
elfo
the
SVS
Am
ount
ofco
llabo
ratio
nw
ithcr
ewm
embe
rs
Am
ount
ofdi
spla
y cro
ss-c
heck
ing
Am
ount
oftim
esp
ent l
ooki
ngou
t-the
-win
dow
Am
ount
oftim
esp
ent r
eadi
ngin
stru
men
tsot
her t
han
SVS
Am
ount
oftim
esp
ent v
iew
ing
the
SVS
disp
lay
Am
ount
oftru
stin
crew
mem
bers
Am
ount
oftru
stin
SVS
Am
ount
oftru
stin
syst
ems
othe
r tha
nthe
SVS
Cur
rent
leve
l of S
A
Deg
reeo
f pilo
t fat
igue
Exp
erie
ncea
ndab
ility
ofth
epi
lot
Exp
erie
nceu
sing
the
SVS
Exp
erie
ncew
ithte
rrain
surr
ound
ing
dest
inat
ion
airp
ort
Infe
renc
edel
ayIn
fere
ncee
rror
Leve
l of m
enta
l wor
kloa
d
Leve
l of s
elf c
onfid
ence
Num
bero
f erro
rsin
perc
eivi
Pilo
t erro
r whe
nu
Pilo
t e
1 1 1 1 1 1 1 1 1
1
1 1 1 1 1 1 1
1 1 1
1 1 1 1 1 1 1 1
1 1 1 1 1 1 1 1 1 1 1
1 1 1 1 1 1 1 1
1 1 1 1 1 1 1 1 1 1
1 1 1 1 1 1 1 1 1 1
1 1 1 1 1 1 1 1 1 1 1 1
1 1 1 1 1 1 1 1 1 1
1 1 1 1

11
11
11
11 1
11
11
11
1
11
11
11
11
11
11
11
11
11
11
1
11
11
11
11
11
11
11
11
11
11
11
11
11
11
11
11
11
11
1
11
11
11
11
11
11
11
11
11
11
11
11
11
11
11
11
11
11
11
11
11
11
11
11
11
1
11
11
11
11
11
11
11
11
11
1
11
11
11
11
11
11
11
11
11
11
11
11
11
11
1
11
11
11
11
11
11
11
1
11
11
1
11

11
11
11
11
11
11
11
11
11
11
11
11
11
11
11
11
11
11
11
11
1
11
11
11
11
11
11
11
11
11
11
11
11
1
11
11
11
11
11
1
11
11
11
11
11
11
11
11
11
11
11
11
11
11
11
11
11
11
1
11
11
11
11
11
11
11
11
11
11
1
11
11
1
11
1
11
11
11
1
11
11
1
11
11
11
11
11
11
11
11
11
1
11
11
1
11
11
11
1
11
11
11
11
11
11
11
11
11
11
00
09
00
04
43
14
28
43
52
51
18
54
68
02
09
96
31
83
23
10
63
63
63
23
.56
36
36
37
11
35
.51
38
45
45
27
.53
2.5
62
7.5
63
40
63
23
.52
3.5
11
59
11
63


Machine
ceiv
ing
SVS
data
hen
usin
gth
eSV
S
otex
perie
ncew
ithth
issp
ecif i
cap
proa
ch
Pilo
t exp
eric
ence
with
this
spec
ific
land
ing
Pilo
t pre
fere
nce
Pilo
tsle
vel o
f con
fiden
cein
his/
her p
erce
ptio
nof
the
SVS
Pilo
tsle
vel o
f con
fiden
cein
his/
her p
erce
ptio
nof
the
wor
ld
Pilo
tsle
vel o
f con
fiden
cein
the
accu
racy
ofth
eSV
S
Prox
imity
tode
stina
tion
airp
ort
Abi
lity
tode
clutte
rSV
Sdi
spla
y
Acc
urac
yof
GPS
Acc
urac
yof
terra
inda
taba
se
Aud
itory
vs. v
isua
l war
ning
Col
orof
sym
bols
/text
Col
orof
terr
ain
Deg
reeo
f dis
play
clutte
r
Deg
reeo
f ove
rlayw
ithPF
Dda
ta
Dis
play
size
Feed
back
dela
yFO
Vcu
rren
tlyde
pict
edon
the
SVS
disp
lay
Func
tioni
ng/m
alfu
nctio
ning
ofha
rdw
are/
softw
are
Gla
reon
SVS
Intu
itive
ness
/usa
bilit
yof
the
SVS
Layo
utof
cont
rols
Lim
iatio
nsof
the
mac
hines
proc
esso
r
Loca
tion
ofth
eSV
Sdi
spla
y
Num
bero
f hig
hlig
hted
featu
resc
urre
ntly
invi
ew
Num
bero
f key
pres
sesr
equi
red
toac
cess
desir
edi
Num
bero
f lay
ers
inm
enu
stru
ctur
e
Num
bero
f obs
tacle
scur
rent
l
Phys
ical
cond
itio
Pict
ori
1 1
1 1 1
1
1 1
1 1 1
1 1
1 1 1 1 1 1 1 1
1 1 1 1 1 1 1 1
1 1 1 1 1 1 1 1 1
1 1 1
1

11
11
1
11
1
1
11
1 1
11
11
11
1
11
11
11
1
11
1
1 1
11
11
11
11
11
1
1

11
11
11
11
11
1
11
1
11
11
11
11
11
11
11
11
1
1
1
1
11
11
11
11
11
11
11
1
11
11
11 1 1
1
11 1
11
11
11 1
1
1 1 1 1 1
00
14
21
15
00
00
96
61
11
19
46
00
31
40
40
21
10
5
63
63
17
.51
41
66
36
36
36
32
3.5
30
30
19
.51
9.5
23
.53
5.5
30
63
63
11
35
.56
33
5.5
63
40
45
45
63
32
.5

l

redinformation
e rentlyinview
ditionofdisp
laysurfaces
ctorialsceneinformationdensit
y
Placementofcontrols
Processingtim
e(todisp
laydatafromterra
indatabase)
Sizeofsymbols/text
Tactilefeedbackfro
mcontrols
UpdaterateofGPS
Updaterateofterraindatabase
INFLUENCETOTAL
INFLUENCE(2)
15
16
.5
46
9.5
12
30
.5
46
9.5
07
7
14
22
.5
14
22
.5
13
27
.5
20
5
19
7
24
2
17
9.5
75
3
17
5.5

84
8
84
8
46
9.5
56
4
75
3
14
22
.5
65
8.5
84
8
56
4
15
16
.5
15
16
.5
94
1.5
15
16
.5
37
3.5
75
3
46
9.5
84
8
84
8
22
3
16
12
.5
11
33
.5
17
5.5
65
8.5
15
16
.5
56
4
65
8.5
65
8.5
11
33
.5
11
33
.5
11
17
9.5
46
9.5
46
9.5
75
3
65
8.5
56
4

20
5
20
5
13
27
.5
14
22
.5
12
30
.5
14
22
.5
15
16
.5
11
42
2.5
10
36
.5
56
4
13
27
.5
16
12
.5
11
13
01
75
3
11
79
.5
94
1.5
94
1.5
65
8.5
11
33
.5
94
1.5
13
27
.5
17
9.5
94
1.5
10
36
.5
94
1.5
37
3.5
94
1.5
94
1.5
21
31
00
40
45
38
45
63
63


INFLUENCE TOTALS SCORE RANK RANK (2)m Intuitiveness/usability of the SVS 30 1 1
w Difficulty of terrain environment at destination airport 24 2 2
p Experience and ability of the pilot 22 3 3
w Difficulty of approach 20 4 5
m Accuracy of GPS 20 4 5
m Accuracy of terrain database 20 4 5
w Difficulty of landing 19 7 7
w Functioning/malfunctioning of displays other than the SVS 17 8 9.5
p Pilot preference 17 8 9.5
m Limitations of the machines processor 17 8 9.5
m Pictorial scene information density 17 8 9.5
p Experience using the SVS 16 12 12.5
m Glare on SVS 16 12 12.5
w Accuracy of information from displays other than the SVS 15 14 16.5
p Amount of display cross-checking 15 14 16.5
p Amount of time spent looking out-the-window 15 14 16.5
p Amount of time spent viewing the SVS display 15 14 16.5
p Level of mental workload 15 14 16.5
m Degree of overlay with PFD data 15 14 16.5
w Ceiling visibility at destination airport 14 20 22.5
w Degree of redundant coding of SVS data 14 20 22.5
w Weather conditions at destination airport 14 20 22.5
m Color of symbols/text 14 20 22.5
m Degree of display clutter 14 20 22.5
m Display size 14 20 22.5
w Degree of time pressure (is aircraft arriving on time, early) 13 26 27.5
m Auditory vs. visual warning 13 26 27.5
m Functioning/malfunctioning of hardware/software 13 26 27.5
m Physical condition of display surfaces 13 26 27.5
w Amount of information available from displays other SVS 12 30 30.5
m Color of terrain 12 30 30.5
p Experience with terrain surrounding destination airport 11 32 33.5
p Pilot experience with this specific approach 11 32 33.5
p Pilot experience with this specific landing 11 32 33.5
m Number of layers in menu structure 11 32 33.5
m Feedback delay 10 36 36.5
m Processing time (to display data from terrain database) 10 36 36.5
p Amount of time spent reading instruments other than the SVS 9 38 41.5
m Location of the SVS display in the cockpit 9 38 41.5
m Number of highlighted features currently in view 9 38 41.5

m Number of obstacles currently in view 9 38 41.5
m Placement of controls 9 38 41.5
m Size of symbols/text 9 38 41.5
m Update rate of GPS 9 38 41.5
m Update rate of terrain database 9 38 41.5
w Physical state of the aircraft 8 46 48
w Physical state of the engines 8 46 48
p Accuracy of pilots mental model of the SVS 8 46 48
p Current level of SA 8 46 48
p Degree of pilot fatigue 8 46 48
w Glare on displays other than the SVS 7 51 53
w Usability/intuitiveness of displays other than the SVS 7 51 53
p Amount of trust in SVS 7 51 53
p Pilots level of confidence in the accuracy of the SVS 7 51 53
m Layout of controls 7 51 53
p Accuracy of pilots mental model of the environment 6 56 58.5
p Inference error 6 56 58.5
p Number of errors in perceiving SVS data 6 56 58.5
p Pilot error when using the SVS 6 56 58.5
p Proximity to the destination airport 6 56 58.5
m Number of key presses required to access desired information 6 56 58.5
w Traffic situation at destination airport 5 62 64
p Amount of collaboration with crew members 5 62 64
p Level of self confidence 5 62 64
m Ability to declutter SVS display 5 62 64
m FOV currently depicted on the SVS display 5 62 64
w Altitude of the aircraft (too low/high?) 4 67 69.5
w Amount of noise in cockpit 4 67 69.5
w Speed of aircraft (too low/high?) 4 67 69.5
p Amount of trust in systems other than the SVS 4 67 69.5
p Pilots level of confidence in his/her perception of the SVS 4 67 69.5
p Pilots level of confidence in his/her perception of the world 4 67 69.5
p Amount of trust in crew members 3 73 73.5
m Tactile feedback from controls 3 73 73.5
w Lighting conditions in the cockpit 1 75 75.5
p Inference delay 1 75 75.5
w ATC workload 0 77 77

SENSITIVITY TOTALS SCORE RANK RANK (2)m Level of mental workload 63 1 1
m Difficulty of landing 62 2 2
m Difficulty of approach 61 3 3
m Amount of time spent reading instruments other than the SVS 52 4 4
m Amount of time spent viewing the SVS display 51 5 5
m Current level of SA 46 6 6
m Accuracy of pilots mental model of the environment 44 7 7
m Amount of time spent looking out-the-window 43 8 8
m Number of errors in perceiving SVS data 32 9 9
m Intuitiveness/usability of the SVS 31 10 11
m Accuracy of pilots mental model of the SVS 31 10 11
m Pilot error when using the SVS 31 10 11
m Amount of display cross-checking 28 13 13
m Pilots level of confidence in his/her perception of the world 21 14 14
m Level of self confidence 18 15 15
m Pilots level of confidence in the accuracy of the SVS 15 16 16
m Pilots level of confidence in his/her perception of the SVS 14 17 17.5
m ATC workload 14 17 17.5
m Degree of display clutter 11 19 19.5
m Degree of overlay with PFD data 11 19 19.5
m Auditory vs. visual warning 9 21 23.5
m Display size 9 21 23.5
m Inference delay 9 21 23.5
m Inference error 9 21 23.5
m Altitude of the aircraft (too low/high?) 9 21 23.5
m Speed of aircraft (too low/high?) 9 21 23.5
m Amount of trust in SVS 8 27 27.5
m Degree of pilot fatigue 8 27 27.5
m Color of symbols/text 6 29 30
p Color of terrain 6 29 30
p FOV currently depicted on the SVS display 6 29 30
p Pictorial scene information density 5 32 32.5
p Amount of trust in systems other than the SVS 5 32 32.5
p Feedback delay 4 34 35.5
p Layout of controls 4 34 35.5
p Location of the SVS display in the cockpit 4 34 35.5
p Amount of collaboration with crew members 4 34 35.5
p Size of symbols/text 3 38 38
p Number of key presses required to access desired information 2 39 40
p Placement of controls 2 39 40

p Experience using the SVS 2 39 40
p Number of layers in menu structure 1 42 45
p Number of obstacles currently in view 1 42 45
p Processing time (to display data from terrain database) 1 42 45
p Tactile feedback from controls 1 42 45
p Amount of trust in crew members 1 42 45
p Degree of time pressure (is aircraft arriving on time, early) 1 42 45
p Glare on displays other than the SVS 1 42 45
p Ability to declutter SVS display 0 49 63
p Accuracy of GPS 0 49 63
p Accuracy of terrain database 0 49 63
p Functioning/malfunctioning of hardware/software 0 49 63
p Glare on SVS 0 49 63
p Limitations of the machines processor 0 49 63
p Number of highlighted features currently in view 0 49 63
p Physical condition of display surfaces 0 49 63
p Update rate of GPS 0 49 63
w Update rate of terrain database 0 49 63
w Experience and ability of the pilot 0 49 63
w Experience with terrain surrounding destination airport 0 49 63
w Pilot experience with this specific approach 0 49 63
w Pilot experience with this specific landing 0 49 63
w Pilot preference 0 49 63
w Proximity to the destination airport 0 49 63
w Accuracy of information from displays other than the SVS 0 49 63
w Amount of information available from displays other SVS 0 49 63
w Amount of noise in cockpit 0 49 63
w Ceiling visibility at destination airport 0 49 63
w Degree of redundant coding of SVS data 0 49 63
w Difficulty of terrain environment at destination airport 0 49 63
w Functioning/malfunctioning of displays other than the SVS 0 49 63
w Lighting conditions in the cockpit 0 49 63
w Physical state of the aircraft 0 49 63
w Physical state of the engines 0 49 63
w Traffic situation at destination airport 0 49 63
w Usability/intuitiveness of displays other than the SVS 0 49 63
w Weather conditions at destination airport 0 49 63

INFLUENCE TOTALS SCORE RANK RANK (2)EnvironmentDifficulty of terrain environment at destination airport 24 2 2
Difficulty of approach 20 4 5
Difficulty of landing 19 7 7
Functioning/malfunctioning of displays other than the SVS 17 8 9.5
Accuracy of information from displays other than the SVS 15 14 16.5
Ceiling visibility at destination airport 14 20 22.5
Degree of redundant coding of SVS data 14 20 22.5
Weather conditions at destination airport 14 20 22.5
Degree of time pressure (is aircraft arriving on time, early) 13 26 27.5
Amount of information available from displays other SVS 12 30 30.5
Physical state of the aircraft 8 46 48
Physical state of the engines 8 46 48
Glare on displays other than the SVS 7 51 53
Usability/intuitiveness of displays other than the SVS 7 51 53
Traffic situation at destination airport 5 62 64
Altitude of the aircraft (too low/high?) 4 67 69.5
Amount of noise in cockpit 4 67 69.5
Speed of aircraft (too low/high?) 4 67 69.5
Lighting conditions in the cockpit 1 75 75.5
ATC workload 0 77 77
PilotExperience and ability of the pilot 22 3 3
Pilot preference 17 8 9.5
Experience using the SVS 16 12 12.5
Amount of display cross-checking 15 14 16.5
Amount of time spent looking out-the-window 15 14 16.5
Amount of time spent viewing the SVS display 15 14 16.5
Level of mental workload 15 14 16.5
Experience with terrain surrounding destination airport 11 32 33.5
Pilot experience with this specific approach 11 32 33.5
Pilot experience with this specific landing 11 32 33.5
Amount of time spent reading instruments other than the SV 9 38 41.5
Accuracy of pilots mental model of the SVS 8 46 48
Current level of SA 8 46 48
Degree of pilot fatigue 8 46 48
Amount of trust in SVS 7 51 53
Pilots level of confidence in the accuracy of the SVS 7 51 53
Accuracy of pilots mental model of the environment 6 56 58.5

Inference error 6 56 58.5
Number of errors in perceiving SVS data 6 56 58.5
Pilot error when using the SVS 6 56 58.5
Proximity to the destination airport 6 56 58.5
Amount of collaboration with crew members 5 62 64
Level of self confidence 5 62 64
Amount of trust in systems other than the SVS 4 67 69.5
Pilots level of confidence in his/her perception of the SVS 4 67 69.5
Pilots level of confidence in his/her perception of the world 4 67 69.5
Amount of trust in crew members 3 73 73.5
Inference delay 1 75 75.5
MachineIntuitiveness/usability of the SVS 30 1 1
Accuracy of GPS 20 4 5
Accuracy of terrain database 20 4 5
Limitations of the machines processor 17 8 9.5
Pictorial scene information density 17 8 9.5
Glare on SVS 16 12 12.5
Degree of overlay with PFD data 15 14 16.5
Color of symbols/text 14 20 22.5
Degree of display clutter 14 20 22.5
Display size 14 20 22.5
Auditory vs. visual warning 13 26 27.5
Functioning/malfunctioning of hardware/software 13 26 27.8
Physical condition of display surfaces 13 26 27.8
Color of terrain 12 30 30.5
Number of layers in menu structure 11 32 33.5
Feedback delay 10 36 36.5
Processing time (to display data from terrain database) 10 36 36.5
Location of the SVS display in the cockpit 9 38 41.5
Number of highlighted features currently in view 9 38 41.5
Number of obstacles currently in view 9 38 41.5
Placement of controls 9 38 41.5
Size of symbols/text 9 38 41.5
Update rate of GPS 9 38 41.5
Update rate of terrain database 9 38 41.5
Layout of controls 7 51 53
Number of key presses required to access desired informati 6 56 58.5
Ability to declutter SVS display 5 62 64
FOV currently depicted on the SVS display 5 62 64
Tactile feedback from controls 3 73 73.5

SENSITIVITY TOTALS SCORE RANK RANK (2)EnvironmentDifficulty of approach 61 3 3
ATC workload 14 17 17.5
Altitude of the aircraft (too low/high?) 9 21 23.5
Speed of aircraft (too low/high?) 9 21 23.5
Degree of time pressure (is aircraft arriving on time, early) 1 42 45
Glare on displays other than the SVS 1 42 45
Accuracy of information from displays other than the SVS 0 49 63
Amount of information available from displays other SVS 0 49 63
Amount of noise in cockpit 0 49 63
Ceiling visibility at destination airport 0 49 63
Degree of redundant coding of SVS data 0 49 63
Difficulty of terrain environment at destination airport 0 49 63
Functioning/malfunctioning of displays other than the SVS 0 49 63
Lighting conditions in the cockpit 0 49 63
Physical state of the aircraft 0 49 63
Physical state of the engines 0 49 63
Traffic situation at destination airport 0 49 63
Usability/intuitiveness of displays other than the SVS 0 49 63
Weather conditions at destination airport 0 49 63
PilotLevel of mental workload 63 1 1
Amount of time spent reading instruments other than the SV 52 4 4
Amount of time spent viewing the SVS display 51 5 5
Current level of SA 46 6 6
Accuracy of pilots mental model of the environment 44 7 7
Amount of time spent looking out-the-window 43 8 8
Number of errors in perceiving SVS data 32 9 9
Accuracy of pilots mental model of the SVS 31 10 11
Pilot error when using the SVS 31 10 11
Amount of display cross-checking 28 13 13
Pilots level of confidence in his/her perception of the world 21 14 14
Level of self confidence 18 15 15
Pilots level of confidence in the accuracy of the SVS 15 16 16
Pilots level of confidence in his/her perception of the SVS 14 17 17.5
Inference delay 9 21 23.5
Inference error 9 21 23.5
Amount of trust in SVS 8 27 27.5

Degree of pilot fatigue 8 27 27.5
Amount of trust in systems other than the SVS 5 32 32.5
Amount of collaboration with crew members 4 34 35.5
Experience using the SVS 2 39 40
Amount of trust in crew members 1 42 45
Experience and ability of the pilot 0 49 63
Experience with terrain surrounding destination airport 0 49 63
Pilot experience with this specific approach 0 49 63
Pilot experience with this specific landing 0 49 63
Pilot preference 0 49 63
Proximity to the destination airport 0 49 63
MachineIntuitiveness/usability of the SVS 31 10 11
Degree of display clutter 11 19 19.5
Degree of overlay with PFD data 11 19 19.5
Auditory vs. visual warning 9 21 23.5
Display size 9 21 23.5
Color of symbols/text 6 29 30
Color of terrain 6 29 30
FOV currently depicted on the SVS display 6 29 30
Pictorial scene information density 5 32 32.5
Feedback delay 4 34 35.5
Layout of controls 4 34 35.5
Location of the SVS display in the cockpit 4 34 35.5
Size of symbols/text 3 38 38
Number of key presses required to access desired informati 2 39 40
Placement of controls 2 39 40
Number of layers in menu structure 1 42 45
Number of obstacles currently in view 1 42 45
Processing time (to display data from terrain database) 1 42 45
Tactile feedback from controls 1 42 45
Ability to declutter SVS display 0 49 63
Accuracy of GPS 0 49 63
Accuracy of terrain database 0 49 63
Functioning/malfunctioning of hardware/software 0 49 63
Glare on SVS 0 49 63
Limitations of the machines processor 0 49 63
Number of highlighted features currently in view 0 49 63
Physical condition of display surfaces 0 49 63
Update rate of GPS 0 49 63
Update rate of terrain database 0 49 63

Appendix D
INFLUENCE TOTALS SCORE RANKIntuitiveness/usability of the SVS 30 1
Difficulty of terrain environment at destination airport 24 2
Experience and ability of the pilot 22 3
Difficulty of approach 20 5
Accuracy of GPS 20 5
Accuracy of terrain database 20 5
Difficulty of landing 19 7
Functioning/malfunctioning of displays other than the SVS 17 9.5
Pilot preference 17 9.5
Limitations of the machines processor 17 9.5
Pictorial scene information density 17 9.5
Experience using the SVS 16 12.5
Glare on SVS 16 12.5
Accuracy of information from displays other than the SVS 15 16.5
Amount of display cross-checking 15 16.5
Amount of time spent looking out-the-window 15 16.5
Amount of time spent viewing the SVS display 15 16.5
Level of mental workload 15 16.5
Degree of overlay with PFD data 15 16.5
Ceiling visibility at destination airport 14 22.5
Degree of redundant coding of SVS data 14 22.5
Weather conditions at destination airport 14 22.5
Color of symbols/text 14 22.5
Degree of display clutter 14 22.5
Display size 14 22.5
Degree of time pressure (is aircraft arriving on time, early) 13 27.5
Auditory vs. visual warning 13 27.5
Functioning/malfunctioning of hardware/software 13 27.5
Physical condition of display surfaces 13 27.5
Amount of information available from displays other SVS 12 30.5
Color of terrain 12 30.5
Experience with terrain surrounding destination airport 11 33.5
Pilot experience with this specific approach 11 33.5
Pilot experience with this specific landing 11 33.5
Number of layers in menu structure 11 33.5
Feedback delay 10 36.5
Processing time (to display data from terrain database) 10 36.5
Amount of time spent reading instruments other than the SVS 9 41.5
Location of the SVS display in the cockpit 9 41.5
Number of highlighted features currently in view 9 41.5

Appendix D
Number of obstacles currently in view 9 41.5
Placement of controls 9 41.5
Size of symbols/text 9 41.5
Update rate of GPS 9 41.5
Update rate of terrain database 9 41.5
Physical state of the aircraft 8 48
Physical state of the engines 8 48
Accuracy of pilots mental model of the SVS 8 48
Current level of SA 8 48
Degree of pilot fatigue 8 48
Glare on displays other than the SVS 7 53
Usability/intuitiveness of displays other than the SVS 7 53
Amount of trust in SVS 7 53
Pilots level of confidence in the accuracy of the SVS 7 53
Layout of controls 7 53
Accuracy of pilots mental model of the environment 6 58.5
Inference error 6 58.5
Number of errors in perceiving SVS data 6 58.5
Pilot error when using the SVS 6 58.5
Proximity to the destination airport 6 58.5
Number of key presses required to access desired information 6 58.5
Traffic situation at destination airport 5 64
Amount of collaboration with crew members 5 64
Level of self confidence 5 64
Ability to declutter SVS display 5 64
FOV currently depicted on the SVS display 5 64
Altitude of the aircraft (too low/high?) 4 69.5
Amount of noise in cockpit 4 69.5
Speed of aircraft (too low/high?) 4 69.5
Amount of trust in systems other than the SVS 4 69.5
Pilots level of confidence in his/her perception of the SVS 4 69.5
Pilots level of confidence in his/her perception of the world 4 69.5
Amount of trust in crew members 3 73.5
Tactile feedback from controls 3 73.5
Lighting conditions in the cockpit 1 75.5
Inference delay 1 75.5
ATC workload 0 77

Appendix D
SENSITIVITY TOTALS SCORE RANKLevel of mental workload 63 1
Difficulty of landing 62 2
Difficulty of approach 61 3
Amount of time spent reading instruments other than the SVS 52 4
Amount of time spent viewing the SVS display 51 5
Current level of SA 46 6
Accuracy of pilots mental model of the environment 44 7
Amount of time spent looking out-the-window 43 8
Number of errors in perceiving SVS data 32 9
Intuitiveness/usability of the SVS 31 11
Accuracy of pilots mental model of the SVS 31 11
Pilot error when using the SVS 31 11
Amount of display cross-checking 28 13
Pilots level of confidence in his/her perception of the world 21 14
Level of self confidence 18 15
Pilots level of confidence in the accuracy of the SVS 15 16
Pilots level of confidence in his/her perception of the SVS 14 17.5
ATC workload 14 17.5
Degree of display clutter 11 19.5
Degree of overlay with PFD data 11 19.5
Auditory vs. visual warning 9 23.5
Display size 9 23.5
Inference delay 9 23.5
Inference error 9 23.5
Altitude of the aircraft (too low/high?) 9 23.5
Speed of aircraft (too low/high?) 9 23.5
Amount of trust in SVS 8 27.5
Degree of pilot fatigue 8 27.5
Color of symbols/text 6 30
Color of terrain 6 30
FOV currently depicted on the SVS display 6 30
Pictorial scene information density 5 32.5
Amount of trust in systems other than the SVS 5 32.5
Feedback delay 4 35.5
Layout of controls 4 35.5
Location of the SVS display in the cockpit 4 35.5
Amount of collaboration with crew members 4 35.5
Size of symbols/text 3 38
Number of key presses required to access desired information 2 40
Placement of controls 2 40

Appendix D
Experience using the SVS 2 40
Number of layers in menu structure 1 45
Number of obstacles currently in view 1 45
Processing time (to display data from terrain database) 1 45
Tactile feedback from controls 1 45
Amount of trust in crew members 1 45
Degree of time pressure (is aircraft arriving on time, early) 1 45
Glare on displays other than the SVS 1 45
Ability to declutter SVS display 0 63
Accuracy of GPS 0 63
Accuracy of terrain database 0 63
Functioning/malfunctioning of hardware/software 0 63
Glare on SVS 0 63
Limitations of the machines processor 0 63
Number of highlighted features currently in view 0 63
Physical condition of display surfaces 0 63
Update rate of GPS 0 63
Update rate of terrain database 0 63
Experience and ability of the pilot 0 63
Experience with terrain surrounding destination airport 0 63
Pilot experience with this specific approach 0 63
Pilot experience with this specific landing 0 63
Pilot preference 0 63
Proximity to the destination airport 0 63
Accuracy of information from displays other than the SVS 0 63
Amount of information available from displays other SVS 0 63
Amount of noise in cockpit 0 63
Ceiling visibility at destination airport 0 63
Degree of redundant coding of SVS data 0 63
Difficulty of terrain environment at destination airport 0 63
Functioning/malfunctioning of displays other than the SVS 0 63
Lighting conditions in the cockpit 0 63
Physical state of the aircraft 0 63
Physical state of the engines 0 63
Traffic situation at destination airport 0 63
Usability/intuitiveness of displays other than the SVS 0 63
Weather conditions at destination airport 0 63

INFLUENCE TOTALS SCORE RANKAbility to declutter SVS display 5 62
Accuracy of GPS 20 4
Accuracy of information from displays other than the SVS 15 14
Accuracy of pilots mental model of the environment 6 56
Accuracy of pilots mental model of the SVS 8 46
Accuracy of terrain database 20 4
Altitude of the aircraft (too low/high?) 4 67
Amount of collaboration with crew members 5 62
Amount of display cross-checking 15 14
Amount of information available from displays other SVS 12 30
Amount of noise in cockpit 4 67
Amount of time spent looking out-the-window 15 14
Amount of time spent reading instruments other than the SVS 9 38
Amount of time spent viewing the SVS display 15 14
Amount of trust in crew members 3 73
Amount of trust in SVS 7 51
Amount of trust in systems other than the SVS 4 67
ATC workload 0 77
Auditory vs. visual warning 13 26
Ceiling visibility at destination airport 14 20
Color of symbols/text 14 20
Color of terrain 12 30
Current level of SA 8 46
Degree of display clutter 14 20
Degree of overlay with PFD data 15 14
Degree of pilot fatigue 8 46
Degree of redundant coding of SVS data 14 20
Degree of time pressure (is aircraft arriving on time, early) 13 26
Difficulty of approach 20 4
Difficulty of landing 19 7
Difficulty of terrain environment at destination airport 24 2
Display size 14 20
Experience and ability of the pilot 22 3
Experience using the SVS 16 12
Experience with terrain surrounding destination airport 11 32
Feedback delay 10 36
FOV currently depicted on the SVS display 5 62
Functioning/malfunctioning of displays other than the SVS 17 8
Functioning/malfunctioning of hardware/software 13 26
Glare on displays other than the SVS 7 51

Glare on SVS 16 12
Inference delay 1 75
Inference error 6 56
Intuitiveness/usability of the SVS 30 1
Layout of controls 7 51
Level of mental workload 15 14
Level of self confidence 5 62
Lighting conditions in the cockpit 1 75
Limitations of the machines processor 17 8
Location of the SVS display in the cockpit 9 38
Number of errors in perceiving SVS data 6 56
Number of highlighted features currently in view 9 38
Number of key presses required to access desired information 6 56
Number of layers in menu structure 11 32
Number of obstacles currently in view 9 38
Physical condition of display surfaces 13 26
Physical state of the aircraft 8 46
Physical state of the engines 8 46
Pictorial scene information density 17 8
Pilot error when using the SVS 6 56
Pilot experience with this specific approach 11 32
Pilot experience with this specific landing 11 32
Pilot preference 17 8
Pilots level of confidence in his/her perception of the SVS 4 67
Pilots level of confidence in his/her perception of the world 4 67
Pilots level of confidence in the accuracy of the SVS 7 51
Placement of controls 9 38
Processing time (to display data from terrain database) 10 36
Proximity to the destination airport 6 56
Size of symbols/text 9 38
Speed of aircraft (too low/high?) 4 67
Tactile feedback from controls 3 73
Traffic situation at destination airport 5 62
Update rate of GPS 9 38
Update rate of terrain database 9 38
Usability/intuitiveness of displays other than the SVS 7 51
Weather conditions at destination airport 14 20
SENSITIVITY TOTALS SCORE RANKAbility to declutter SVS display 0 49
Accuracy of GPS 0 49

Accuracy of information from displays other than the SVS 0 49
Accuracy of pilots mental model of the environment 44 7
Accuracy of pilots mental model of the SVS 31 10
Accuracy of terrain database 0 49
Altitude of the aircraft (too low/high?) 9 21
Amount of collaboration with crew members 4 34
Amount of display cross-checking 28 13
Amount of information available from displays other SVS 0 49
Amount of noise in cockpit 0 49
Amount of time spent looking out-the-window 43 8
Amount of time spent reading instruments other than the SVS 52 4
Amount of time spent viewing the SVS display 51 5
Amount of trust in crew members 1 42
Amount of trust in SVS 8 27
Amount of trust in systems other than the SVS 5 32
ATC workload 14 17
Auditory vs. visual warning 9 21
Ceiling visibility at destination airport 0 49
Color of symbols/text 6 29
Color of terrain 6 29
Current level of SA 46 6
Degree of display clutter 11 19
Degree of overlay with PFD data 11 19
Degree of pilot fatigue 8 27
Degree of redundant coding of SVS data 0 49
Degree of time pressure (is aircraft arriving on time, early) 1 42
Difficulty of approach 61 3
Difficulty of landing 62 2
Difficulty of terrain environment at destination airport 0 49
Display size 9 21
Experience and ability of the pilot 0 49
Experience using the SVS 2 39
Experience with terrain surrounding destination airport 0 49
Feedback delay 4 34
FOV currently depicted on the SVS display 6 29
Functioning/malfunctioning of displays other than the SVS 0 49
Functioning/malfunctioning of hardware/software 0 49
Glare on displays other than the SVS 1 42
Glare on SVS 0 49
Inference delay 9 21
Inference error 9 21
Intuitiveness/usability of the SVS 31 10

Layout of controls 4 34
Level of mental workload 63 1
Level of self confidence 18 15
Lighting conditions in the cockpit 0 49
Limitations of the machines processor 0 49
Location of the SVS display in the cockpit 4 34
Number of errors in perceiving SVS data 32 9
Number of highlighted features currently in view 0 49
Number of key presses required to access desired information 2 39
Number of layers in menu structure 1 42
Number of obstacles currently in view 1 42
Physical condition of display surfaces 0 49
Physical state of the aircraft 0 49
Physical state of the engines 0 49
Pictorial scene information density 5 32
Pilot error when using the SVS 31 10
Pilot experience with this specific approach 0 49
Pilot experience with this specific landing 0 49
Pilot preference 0 49
Pilots level of confidence in his/her perception of the SVS 14 17
Pilots level of confidence in his/her perception of the world 21 14
Pilots level of confidence in the accuracy of the SVS 15 16
Placement of controls 2 39
Processing time (to display data from terrain database) 1 42
Proximity to the destination airport 0 49
Size of symbols/text 3 38
Speed of aircraft (too low/high?) 9 21
Tactile feedback from controls 1 42
Traffic situation at destination airport 0 49
Update rate of GPS 0 49
Update rate of terrain database 0 49
Usability/intuitiveness of displays other than the SVS 0 49
Weather conditions at destination airport 0 49
TOP FIFTEEN CHARACTERISTICS (INFLUENCE) SCORE RANK
Intuitiveness/usability of the SVS 30 1
Difficulty of terrain environment at destination airport 24 2
Experience and ability of the pilot 22 3
Difficulty of approach 20 4
Accuracy of GPS 20 4

Accuracy of terrain database 20 4
Difficulty of landing 19 7
Functioning/malfunctioning of displays other than the SVS 17 8
Pilot preference 17 8
Limitations of the machines processor 17 8
Pictorial scene information density 17 8
Experience using the SVS 16 12
Glare on SVS 16 12
Accuracy of information from displays other than the SVS 15 14
Amount of display cross-checking 15 14
TOP FIFTEEN CHARACTERISTICS (SENSITIVITY) SCORE RANK
Level of mental workload 63 1
Difficulty of landing 62 2
Difficulty of approach 61 3
Amount of time spent reading instruments other than the SVS 52 4
Amount of time spent viewing the SVS display 51 5
Current level of SA 46 6
Accuracy of pilots mental model of the environment 44 7
Amount of time spent looking out-the-window 43 8
Number of errors in perceiving SVS data 32 9
Accuracy of pilots mental model of the SVS 31 10
Pilot error when using the SVS 31 10
Intuitiveness/usability of the SVS 31 10
Amount of display cross-checking 28 13
Pilots level of confidence in his/her perception of the world 21 14
Level of self confidence 18 15

RANK (2)65
5
15.8
59.5
49
5
70.5
65
15.8
31.5
70.5
15.8
42.5
15.8
74.5
54
70.5
77
28.5
23.5
23.5
31.5
49
23.5
15.8
49
23.5
28.5
5
8
2
23.5
3
13.5
34.5
37.5
65
10.5
28.5
54

13.5
76.5
59.5
1
54
15.8
65
76.5
10.5
42.5
59.5
42.5
59.5
34.5
42.5
28.5
49
49
10.5
59.5
34.5
34.5
10.5
70.5
70.5
54
42.5
37.5
59.5
42.5
70.5
74.5
65
42.5
42.5
54
23.5
RANK (2)64
64

64
7
11
64
24.5
36.5
14
64
64
8
4
5
46
28.5
33.5
18.5
24.5
64
31
31
6
20.5
20.5
28.5
64
46
3
2
64
24.5
64
41
64
36.5
31
64
64
46
64
24.5
24.5
11

36.5
1
16
64
64
36.5
9
64
41
46
46
64
64
64
33.5
11
64
64
64
18.5
15
17
41
46
64
39
24.5
46
64
64
64
64
64
RANK (2)
1
2
3
5
5

5
8
10.5
10.5
10.5
10.5
13.5
13.5
15.8
15.8
RANK (2)
1
2
3
4
5
6
7
8
9
11
11
11
14
15
16

SVS MATRIX
Rec
eiver
sA
ccur
acy
ofin
form
atio
nfr
omdi
spla
ysot
her t
han
the
SVS
Alti
tude
ofth
eai
rcra
ft(to
olo
w/h
igh?
)
Am
ount
ofin
form
atio
nav
aila
ble
from
disp
lays
othe
r tha
nSV
S
Am
ount
ofno
ise
inth
eco
ckpi
t
ATC
wor
kloa
dC
eilin
gvi
sibi
lity
atde
stina
tion
airp
ort
Deg
reeo
f red
unda
ntco
ding
ofSV
Sda
ta
Deg
reeo
f tim
epr
essu
re
Diff
icul
tyof
appr
oach
Diff
icul
tyof
land
ing
Diff
icul
tyof
terr
ain
envi
ron
Func
tioni
ng/m
alf
Gla
re
DriversEnvironment Accuracy of information from displays other than the SVS 1 1 1 1
Altitude of the aircraft (too low/high?) 1 1 1
Amount of information available from displays other than SVS 1 1
Amount of noise in cockpitATC workloadCeiling visibility at destination airport 1 1 1 1
Degree of redundant coding of SVS dataDegree of time pressure 1 1 1
Difficulty of approach 1 1
Difficulty of landing 1
Difficulty of terrain environment at destination airport 1 1 1
Functioning/malfunctioning of displays other than the SVS 1 1 1 1
Glare on displays other than the SVS 1 1
Lighting conditions in the cockpit 1

Physical state of the aircraft 1 1 1 1
Physical state of the engines 1 1 1 1
Speed of aircraft (too low/high?) 1 1 1
Traffic situation at destination airport 1 1 1
Usability/intuitiveness of displays other than the SVS 1 1
Weather conditions at destination airport 1 1 1 1
Pilot Accuracy of pilots mental model of the environment 1 1
Accuracy of pilots mental model of the SVS 1 1
Amount of collaboration with crew members 1 1
Amount of display cross-checking 1 1
Amount of time spent looking out-the-window 1 1
Amount of time spent reading instruments other than the SVS 1 1
Amount of time spent viewing the SVS display 1 1
Amount of trust in crew members 1 1
Amount of trust in SVSAmount of trust in systems other than the SVSCurrent level of SA 1 1
Degree of pilot fatigue 1 1
Experience and ability of the pilot 1 1 1
Experience using the SVS 1 1
Experience with terrain surrounding destination airport 1 1
Inference delayInference error 1 1
Level of mental workload 1 1
Level of self confidenceNumber of errors in perceiving SVS data 1 1
Pilot error when using the SVS 1 1
Pilot experience with this specific approach 1 1
Pilot experience with this specific landing 1 1
Pilot preferencePilots level of confidence in his/her perception of the SVSPilots level of confidence in his/her perception of the worldPilots level of confidence in the accuracy of the SVSProximity to the destination airport
Machine Ability to declutter SVS display 1 1

Accuracy of GPS 1 1 1 1
Accuracy of terrain database 1 1 1 1
Auditory vs. visual warning 1 1
Color of symbols/text 1 1
Color of terrain 1 1
Degree of display clutter 1 1
Degree of overlay with PFD data 1 1
Display size 1 1
Feedback delay 1 1
FOV currently depicted on the SVS display 1 1
Functioning/malfunctioning of hardware/software 1 1
Glare on SVS 1 1
Intuitiveness/usability of the SVS 1 1
Layout of controls 1 1
Limitations of the machines processor 1 1
Location of the SVS display in the cockpit 1 1
Number of highlighted features currently in view 1 1
Number of key presses required to access desired information 1 1
Number of layers in menu structure 1 1
Number of obstacles currently in view 1 1
Physical condition of display surfaces 1 1
Pictorial scene information density 1 1
Placement of controls 1 1
Processing time (to display data from terrain database) 1 1
Size of symbols/text 1 1
Tactile feedback from controlsUpdate rate of GPS 1 1
Update rate of terrain database 1 1
SENSITIVITY TOTAL 0 9 0 0 14 0 0 1 61 62 0 0 1
SENSITIVITY RANK (2) 63 23.5 63 63 17.5 63 63 45 3 2 63 63 45


Environment Pilot
ronm
ent a
tdes
tinat
ion
airp
ort
mal
func
tioni
ngof
disp
lays
othe
r tha
nthe
SVS
are
ondi
spla
ysot
her t
han
theSV
S
Ligh
ting
cond
ition
sin
the
cock
pit
Phys
ical
stat
eof
the
airc
raft
Phys
ical
stat
eof
the
engi
nes
Spee
dof
the
airc
raft
(too
low
/hig
h?)
Traf
ficsi
tuat
ion
atde
stina
tion
airp
ort
Usa
bilit
y/in
tuiti
vene
ssof
disp
lays
othe
r tha
nth
eSV
S
Wea
ther c
ondi
tions
atde
stina
tion
airp
ort
Acc
urac
yof
pilo
tsm
enta
l mod
elof
the
envi
ronm
ent
Acc
urac
yof
pilo
tsm
enta
l mod
elfo
the
SVS
Am
ount
ofco
llabo
ratio
nw
ithcr
ewm
embe
rs
Am
ount
ofdi
spla
y cro
ss-c
heck
ing
Am
ount
oftim
esp
ent l
ooki
ngou
t-the
-win
dow
Am
ount
oftim
esp
ent r
eadi
ngin
stru
men
tsot
her t
han
SVS
Am
ount
oftim
esp
ent v
iew
ing
the
SVS
disp
lay
Am
ount
oftru
stin
crew
mem
bers
Am
ount
oftru
stin
SVS
Am
ount
oftru
stin
syst
ems
othe
r tha
nthe
SVS
Cur
rent
leve
l of S
A
Deg
reeo
f pilo
t fat
igue
Exp
erie
ncea
ndab
ility
ofth
epi
lot
Exp
erie
nceu
sing
the
SVS
Exp
erie
ncew
ithte
rrain
surr
ound
ing
dest
inat
ion
airp
ort
Infe
renc
edel
ayIn
fere
ncee
rror
Leve
l of m
enta
l wor
kloa
d
Leve
l of s
elf c
onfid
ence
Num
bero
f erro
rsin
perc
eivi
Pilo
t erro
r whe
nu
Pilo
t e
1 1 1 1 1 1 1 1 1
1
1 1 1 1 1 1 1
1 1 1
1 1 1 1 1 1 1 1
1 1 1 1 1 1 1 1 1 1 1
1 1 1 1 1 1 1 1
1 1 1 1 1 1 1 1 1 1
1 1 1 1 1 1 1 1 1 1
1 1 1 1 1 1 1 1 1 1 1 1
1 1 1 1 1 1 1 1 1 1
1 1 1 1

11
11
11
11 1
11
11
11
1
11
11
11
11
11
11
11
11
11
11
1
11
11
11
11
11
11
11
11
11
11
11
11
11
11
11
11
11
11
1
11
11
11
11
11
11
11
11
11
11
11
11
11
11
11
11
11
11
11
11
11
11
11
11
11
1
11
11
11
11
11
11
11
11
11
1
11
11
11
11
11
11
11
11
11
11
11
11
11
11
1
11
11
11
11
11
11
11
1
11
11
1
11

11
11
11
11
11
11
11
11
11
11
11
11
11
11
11
11
11
11
11
11
1
11
11
11
11
11
11
11
11
11
11
11
11
1
11
11
11
11
11
1
11
11
11
11
11
11
11
11
11
11
11
11
11
11
11
11
11
11
1
11
11
11
11
11
11
11
11
11
11
1
11
11
1
11
1
11
11
11
1
11
11
1
11
11
11
11
11
11
11
11
11
1
11
11
1
11
11
11
1
11
11
11
11
11
11
11
11
11
11
00
09
00
04
43
14
28
43
52
51
18
54
68
02
09
96
31
83
23
10
63
63
63
23
.56
36
36
37
11
35
.51
38
45
45
27
.53
2.5
62
7.5
63
40
63
23
.52
3.5
11
59
11
63


Machine
ceiv
ing
SVS
data
hen
usin
gth
eSV
S
otex
perie
ncew
ithth
issp
ecif i
cap
proa
ch
Pilo
t exp
eric
ence
with
this
spec
ific
land
ing
Pilo
t pre
fere
nce
Pilo
tsle
vel o
f con
fiden
cein
his/
her p
erce
ptio
nof
the
SVS
Pilo
tsle
vel o
f con
fiden
cein
his/
her p
erce
ptio
nof
the
wor
ld
Pilo
tsle
vel o
f con
fiden
cein
the
accu
racy
ofth
eSV
S
Prox
imity
tode
stina
tion
airp
ort
Abi
lity
tode
clutte
rSV
Sdi
spla
y
Acc
urac
yof
GPS
Acc
urac
yof
terra
inda
taba
se
Aud
itory
vs. v
isua
l war
ning
Col
orof
sym
bols
/text
Col
orof
terr
ain
Deg
reeo
f dis
play
clutte
r
Deg
reeo
f ove
rlayw
ithPF
Dda
ta
Dis
play
size
Feed
back
dela
yFO
Vcu
rren
tlyde
pict
edon
the
SVS
disp
lay
Func
tioni
ng/m
alfu
nctio
ning
ofha
rdw
are/
softw
are
Gla
reon
SVS
Intu
itive
ness
/usa
bilit
yof
the
SVS
Layo
utof
cont
rols
Lim
iatio
nsof
the
mac
hines
proc
esso
r
Loca
tion
ofth
eSV
Sdi
spla
y
Num
bero
f hig
hlig
hted
featu
resc
urre
ntly
invi
ew
Num
bero
f key
pres
sesr
equi
red
toac
cess
desir
edi
Num
bero
f lay
ers
inm
enu
stru
ctur
e
Num
bero
f obs
tacle
scur
rent
l
Phys
ical
cond
itio
Pict
ori
1 1
1 1 1
1
1 1
1 1 1
1 1
1 1 1 1 1 1 1 1
1 1 1 1 1 1 1 1
1 1 1 1 1 1 1 1 1
1 1 1
1

11
11
1
11
1
1
11
1 1
11
11
11
1
11
11
11
1
11
1
1 1
11
11
11
11
11
1
1

11
11
11
11
11
1
11
1
11
11
11
11
11
11
11
11
1
1
1
1
11
11
11
11
11
11
11
1
11
11
11 1 1
1
11 1
11
11
11 1
1
1 1 1 1 1
00
14
21
15
00
00
96
61
11
19
46
00
31
40
40
21
10
5
63
63
17
.51
41
66
36
36
36
32
3.5
30
30
19
.51
9.5
23
.53
5.5
30
63
63
11
35
.56
33
5.5
63
40
45
45
63
32
.5

l

redinformation
e rentlyinview
ditionofdisp
laysurfaces
ctorialsceneinformationdensit
y
Placementofcontrols
Processingtim
e(todisp
laydatafromterra
indatabase)
Sizeofsymbols/text
Tactilefeedbackfro
mcontrols
UpdaterateofGPS
Updaterateofterraindatabase
INFLUENCETOTAL
INFLUENCE(2)
15
16
.5
46
9.5
12
30
.5
46
9.5
07
7
14
22
.5
14
22
.5
13
27
.5
20
5
19
7
24
2
17
9.5
75
3
17
5.5

84
8
84
8
46
9.5
56
4
75
3
14
22
.5
65
8.5
84
8
56
4
15
16
.5
15
16
.5
94
1.5
15
16
.5
37
3.5
75
3
46
9.5
84
8
84
8
22
3
16
12
.5
11
33
.5
17
5.5
65
8.5
15
16
.5
56
4
65
8.5
65
8.5
11
33
.5
11
33
.5
11
17
9.5
46
9.5
46
9.5
75
3
65
8.5
56
4

20
5
20
5
13
27
.5
14
22
.5
12
30
.5
14
22
.5
15
16
.5
11
42
2.5
10
36
.5
56
4
13
27
.5
16
12
.5
11
13
01
75
3
11
79
.5
94
1.5
94
1.5
65
8.5
11
33
.5
94
1.5
13
27
.5
17
9.5
94
1.5
10
36
.5
94
1.5
37
3.5
94
1.5
94
1.5
21
31
00
40
45
38
45
63
63


INFLUENCE TOTALS SCORE RANK RANK (2)m Intuitiveness/usability of the SVS 30 1 1
w Difficulty of terrain environment at destination airport 24 2 2
p Experience and ability of the pilot 22 3 3
w Difficulty of approach 20 4 5
m Accuracy of GPS 20 4 5
m Accuracy of terrain database 20 4 5
w Difficulty of landing 19 7 7
w Functioning/malfunctioning of displays other than the SVS 17 8 9.5
p Pilot preference 17 8 9.5
m Limitations of the machines processor 17 8 9.5
m Pictorial scene information density 17 8 9.5
p Experience using the SVS 16 12 12.5
m Glare on SVS 16 12 12.5
w Accuracy of information from displays other than the SVS 15 14 16.5
p Amount of display cross-checking 15 14 16.5
p Amount of time spent looking out-the-window 15 14 16.5
p Amount of time spent viewing the SVS display 15 14 16.5
p Level of mental workload 15 14 16.5
m Degree of overlay with PFD data 15 14 16.5
w Ceiling visibility at destination airport 14 20 22.5
w Degree of redundant coding of SVS data 14 20 22.5
w Weather conditions at destination airport 14 20 22.5
m Color of symbols/text 14 20 22.5
m Degree of display clutter 14 20 22.5
m Display size 14 20 22.5
w Degree of time pressure (is aircraft arriving on time, early) 13 26 27.5
m Auditory vs. visual warning 13 26 27.5
m Functioning/malfunctioning of hardware/software 13 26 27.5
m Physical condition of display surfaces 13 26 27.5
w Amount of information available from displays other SVS 12 30 30.5
m Color of terrain 12 30 30.5
p Experience with terrain surrounding destination airport 11 32 33.5
p Pilot experience with this specific approach 11 32 33.5
p Pilot experience with this specific landing 11 32 33.5
m Number of layers in menu structure 11 32 33.5
m Feedback delay 10 36 36.5
m Processing time (to display data from terrain database) 10 36 36.5
p Amount of time spent reading instruments other than the SVS 9 38 41.5
m Location of the SVS display in the cockpit 9 38 41.5
m Number of highlighted features currently in view 9 38 41.5

m Number of obstacles currently in view 9 38 41.5
m Placement of controls 9 38 41.5
m Size of symbols/text 9 38 41.5
m Update rate of GPS 9 38 41.5
m Update rate of terrain database 9 38 41.5
w Physical state of the aircraft 8 46 48
w Physical state of the engines 8 46 48
p Accuracy of pilots mental model of the SVS 8 46 48
p Current level of SA 8 46 48
p Degree of pilot fatigue 8 46 48
w Glare on displays other than the SVS 7 51 53
w Usability/intuitiveness of displays other than the SVS 7 51 53
p Amount of trust in SVS 7 51 53
p Pilots level of confidence in the accuracy of the SVS 7 51 53
m Layout of controls 7 51 53
p Accuracy of pilots mental model of the environment 6 56 58.5
p Inference error 6 56 58.5
p Number of errors in perceiving SVS data 6 56 58.5
p Pilot error when using the SVS 6 56 58.5
p Proximity to the destination airport 6 56 58.5
m Number of key presses required to access desired information 6 56 58.5
w Traffic situation at destination airport 5 62 64
p Amount of collaboration with crew members 5 62 64
p Level of self confidence 5 62 64
m Ability to declutter SVS display 5 62 64
m FOV currently depicted on the SVS display 5 62 64
w Altitude of the aircraft (too low/high?) 4 67 69.5
w Amount of noise in cockpit 4 67 69.5
w Speed of aircraft (too low/high?) 4 67 69.5
p Amount of trust in systems other than the SVS 4 67 69.5
p Pilots level of confidence in his/her perception of the SVS 4 67 69.5
p Pilots level of confidence in his/her perception of the world 4 67 69.5
p Amount of trust in crew members 3 73 73.5
m Tactile feedback from controls 3 73 73.5
w Lighting conditions in the cockpit 1 75 75.5
p Inference delay 1 75 75.5
w ATC workload 0 77 77

SENSITIVITY TOTALS SCORE RANK RANK (2)m Level of mental workload 63 1 1
m Difficulty of landing 62 2 2
m Difficulty of approach 61 3 3
m Amount of time spent reading instruments other than the SVS 52 4 4
m Amount of time spent viewing the SVS display 51 5 5
m Current level of SA 46 6 6
m Accuracy of pilots mental model of the environment 44 7 7
m Amount of time spent looking out-the-window 43 8 8
m Number of errors in perceiving SVS data 32 9 9
m Intuitiveness/usability of the SVS 31 10 11
m Accuracy of pilots mental model of the SVS 31 10 11
m Pilot error when using the SVS 31 10 11
m Amount of display cross-checking 28 13 13
m Pilots level of confidence in his/her perception of the world 21 14 14
m Level of self confidence 18 15 15
m Pilots level of confidence in the accuracy of the SVS 15 16 16
m Pilots level of confidence in his/her perception of the SVS 14 17 17.5
m ATC workload 14 17 17.5
m Degree of display clutter 11 19 19.5
m Degree of overlay with PFD data 11 19 19.5
m Auditory vs. visual warning 9 21 23.5
m Display size 9 21 23.5
m Inference delay 9 21 23.5
m Inference error 9 21 23.5
m Altitude of the aircraft (too low/high?) 9 21 23.5
m Speed of aircraft (too low/high?) 9 21 23.5
m Amount of trust in SVS 8 27 27.5
m Degree of pilot fatigue 8 27 27.5
m Color of symbols/text 6 29 30
p Color of terrain 6 29 30
p FOV currently depicted on the SVS display 6 29 30
p Pictorial scene information density 5 32 32.5
p Amount of trust in systems other than the SVS 5 32 32.5
p Feedback delay 4 34 35.5
p Layout of controls 4 34 35.5
p Location of the SVS display in the cockpit 4 34 35.5
p Amount of collaboration with crew members 4 34 35.5
p Size of symbols/text 3 38 38
p Number of key presses required to access desired information 2 39 40
p Placement of controls 2 39 40

p Experience using the SVS 2 39 40
p Number of layers in menu structure 1 42 45
p Number of obstacles currently in view 1 42 45
p Processing time (to display data from terrain database) 1 42 45
p Tactile feedback from controls 1 42 45
p Amount of trust in crew members 1 42 45
p Degree of time pressure (is aircraft arriving on time, early) 1 42 45
p Glare on displays other than the SVS 1 42 45
p Ability to declutter SVS display 0 49 63
p Accuracy of GPS 0 49 63
p Accuracy of terrain database 0 49 63
p Functioning/malfunctioning of hardware/software 0 49 63
p Glare on SVS 0 49 63
p Limitations of the machines processor 0 49 63
p Number of highlighted features currently in view 0 49 63
p Physical condition of display surfaces 0 49 63
p Update rate of GPS 0 49 63
w Update rate of terrain database 0 49 63
w Experience and ability of the pilot 0 49 63
w Experience with terrain surrounding destination airport 0 49 63
w Pilot experience with this specific approach 0 49 63
w Pilot experience with this specific landing 0 49 63
w Pilot preference 0 49 63
w Proximity to the destination airport 0 49 63
w Accuracy of information from displays other than the SVS 0 49 63
w Amount of information available from displays other SVS 0 49 63
w Amount of noise in cockpit 0 49 63
w Ceiling visibility at destination airport 0 49 63
w Degree of redundant coding of SVS data 0 49 63
w Difficulty of terrain environment at destination airport 0 49 63
w Functioning/malfunctioning of displays other than the SVS 0 49 63
w Lighting conditions in the cockpit 0 49 63
w Physical state of the aircraft 0 49 63
w Physical state of the engines 0 49 63
w Traffic situation at destination airport 0 49 63
w Usability/intuitiveness of displays other than the SVS 0 49 63
w Weather conditions at destination airport 0 49 63

INFLUENCE TOTALS SCORE RANK RANK (2)EnvironmentDifficulty of terrain environment at destination airport 24 2 2
Difficulty of approach 20 4 5
Difficulty of landing 19 7 7
Functioning/malfunctioning of displays other than the SVS 17 8 9.5
Accuracy of information from displays other than the SVS 15 14 16.5
Ceiling visibility at destination airport 14 20 22.5
Degree of redundant coding of SVS data 14 20 22.5
Weather conditions at destination airport 14 20 22.5
Degree of time pressure (is aircraft arriving on time, early) 13 26 27.5
Amount of information available from displays other SVS 12 30 30.5
Physical state of the aircraft 8 46 48
Physical state of the engines 8 46 48
Glare on displays other than the SVS 7 51 53
Usability/intuitiveness of displays other than the SVS 7 51 53
Traffic situation at destination airport 5 62 64
Altitude of the aircraft (too low/high?) 4 67 69.5
Amount of noise in cockpit 4 67 69.5
Speed of aircraft (too low/high?) 4 67 69.5
Lighting conditions in the cockpit 1 75 75.5
ATC workload 0 77 77
PilotExperience and ability of the pilot 22 3 3
Pilot preference 17 8 9.5
Experience using the SVS 16 12 12.5
Amount of display cross-checking 15 14 16.5
Amount of time spent looking out-the-window 15 14 16.5
Amount of time spent viewing the SVS display 15 14 16.5
Level of mental workload 15 14 16.5
Experience with terrain surrounding destination airport 11 32 33.5
Pilot experience with this specific approach 11 32 33.5
Pilot experience with this specific landing 11 32 33.5
Amount of time spent reading instruments other than the SV 9 38 41.5
Accuracy of pilots mental model of the SVS 8 46 48
Current level of SA 8 46 48
Degree of pilot fatigue 8 46 48
Amount of trust in SVS 7 51 53
Pilots level of confidence in the accuracy of the SVS 7 51 53
Accuracy of pilots mental model of the environment 6 56 58.5

Inference error 6 56 58.5
Number of errors in perceiving SVS data 6 56 58.5
Pilot error when using the SVS 6 56 58.5
Proximity to the destination airport 6 56 58.5
Amount of collaboration with crew members 5 62 64
Level of self confidence 5 62 64
Amount of trust in systems other than the SVS 4 67 69.5
Pilots level of confidence in his/her perception of the SVS 4 67 69.5
Pilots level of confidence in his/her perception of the world 4 67 69.5
Amount of trust in crew members 3 73 73.5
Inference delay 1 75 75.5
MachineIntuitiveness/usability of the SVS 30 1 1
Accuracy of GPS 20 4 5
Accuracy of terrain database 20 4 5
Limitations of the machines processor 17 8 9.5
Pictorial scene information density 17 8 9.5
Glare on SVS 16 12 12.5
Degree of overlay with PFD data 15 14 16.5
Color of symbols/text 14 20 22.5
Degree of display clutter 14 20 22.5
Display size 14 20 22.5
Auditory vs. visual warning 13 26 27.5
Functioning/malfunctioning of hardware/software 13 26 27.8
Physical condition of display surfaces 13 26 27.8
Color of terrain 12 30 30.5
Number of layers in menu structure 11 32 33.5
Feedback delay 10 36 36.5
Processing time (to display data from terrain database) 10 36 36.5
Location of the SVS display in the cockpit 9 38 41.5
Number of highlighted features currently in view 9 38 41.5
Number of obstacles currently in view 9 38 41.5
Placement of controls 9 38 41.5
Size of symbols/text 9 38 41.5
Update rate of GPS 9 38 41.5
Update rate of terrain database 9 38 41.5
Layout of controls 7 51 53
Number of key presses required to access desired informati 6 56 58.5
Ability to declutter SVS display 5 62 64
FOV currently depicted on the SVS display 5 62 64
Tactile feedback from controls 3 73 73.5

SENSITIVITY TOTALS SCORE RANK RANK (2)EnvironmentDifficulty of approach 61 3 3
ATC workload 14 17 17.5
Altitude of the aircraft (too low/high?) 9 21 23.5
Speed of aircraft (too low/high?) 9 21 23.5
Degree of time pressure (is aircraft arriving on time, early) 1 42 45
Glare on displays other than the SVS 1 42 45
Accuracy of information from displays other than the SVS 0 49 63
Amount of information available from displays other SVS 0 49 63
Amount of noise in cockpit 0 49 63
Ceiling visibility at destination airport 0 49 63
Degree of redundant coding of SVS data 0 49 63
Difficulty of terrain environment at destination airport 0 49 63
Functioning/malfunctioning of displays other than the SVS 0 49 63
Lighting conditions in the cockpit 0 49 63
Physical state of the aircraft 0 49 63
Physical state of the engines 0 49 63
Traffic situation at destination airport 0 49 63
Usability/intuitiveness of displays other than the SVS 0 49 63
Weather conditions at destination airport 0 49 63
PilotLevel of mental workload 63 1 1
Amount of time spent reading instruments other than the SV 52 4 4
Amount of time spent viewing the SVS display 51 5 5
Current level of SA 46 6 6
Accuracy of pilots mental model of the environment 44 7 7
Amount of time spent looking out-the-window 43 8 8
Number of errors in perceiving SVS data 32 9 9
Accuracy of pilots mental model of the SVS 31 10 11
Pilot error when using the SVS 31 10 11
Amount of display cross-checking 28 13 13
Pilots level of confidence in his/her perception of the world 21 14 14
Level of self confidence 18 15 15
Pilots level of confidence in the accuracy of the SVS 15 16 16
Pilots level of confidence in his/her perception of the SVS 14 17 17.5
Inference delay 9 21 23.5
Inference error 9 21 23.5
Amount of trust in SVS 8 27 27.5

Degree of pilot fatigue 8 27 27.5
Amount of trust in systems other than the SVS 5 32 32.5
Amount of collaboration with crew members 4 34 35.5
Experience using the SVS 2 39 40
Amount of trust in crew members 1 42 45
Experience and ability of the pilot 0 49 63
Experience with terrain surrounding destination airport 0 49 63
Pilot experience with this specific approach 0 49 63
Pilot experience with this specific landing 0 49 63
Pilot preference 0 49 63
Proximity to the destination airport 0 49 63
MachineIntuitiveness/usability of the SVS 31 10 11
Degree of display clutter 11 19 19.5
Degree of overlay with PFD data 11 19 19.5
Auditory vs. visual warning 9 21 23.5
Display size 9 21 23.5
Color of symbols/text 6 29 30
Color of terrain 6 29 30
FOV currently depicted on the SVS display 6 29 30
Pictorial scene information density 5 32 32.5
Feedback delay 4 34 35.5
Layout of controls 4 34 35.5
Location of the SVS display in the cockpit 4 34 35.5
Size of symbols/text 3 38 38
Number of key presses required to access desired informati 2 39 40
Placement of controls 2 39 40
Number of layers in menu structure 1 42 45
Number of obstacles currently in view 1 42 45
Processing time (to display data from terrain database) 1 42 45
Tactile feedback from controls 1 42 45
Ability to declutter SVS display 0 49 63
Accuracy of GPS 0 49 63
Accuracy of terrain database 0 49 63
Functioning/malfunctioning of hardware/software 0 49 63
Glare on SVS 0 49 63
Limitations of the machines processor 0 49 63
Number of highlighted features currently in view 0 49 63
Physical condition of display surfaces 0 49 63
Update rate of GPS 0 49 63
Update rate of terrain database 0 49 63

Appendix E
INFLUENCE TOTALS SCORE RANKEnvironmentDifficulty of terrain environment at destination airport 24 2
Difficulty of approach 20 5
Difficulty of landing 19 7
Functioning/malfunctioning of displays other than the SVS 17 9.5
Accuracy of information from displays other than the SVS 15 16.5
Ceiling visibility at destination airport 14 22.5
Degree of redundant coding of SVS data 14 22.5
Weather conditions at destination airport 14 22.5
Degree of time pressure (is aircraft arriving on time, early) 13 27.5
Amount of information available from displays other SVS 12 30.5
Physical state of the aircraft 8 48
Physical state of the engines 8 48
Glare on displays other than the SVS 7 53
Usability/intuitiveness of displays other than the SVS 7 53
Traffic situation at destination airport 5 64
Altitude of the aircraft (too low/high?) 4 69.5
Amount of noise in cockpit 4 69.5
Speed of aircraft (too low/high?) 4 69.5
Lighting conditions in the cockpit 1 75.5
ATC workload 0 77
PilotExperience and ability of the pilot 22 3
Pilot preference 17 9.5
Experience using the SVS 16 12.5
Amount of display cross-checking 15 16.5
Amount of time spent looking out-the-window 15 16.5
Amount of time spent viewing the SVS display 15 16.5
Level of mental workload 15 16.5
Experience with terrain surrounding destination airport 11 33.5
Pilot experience with this specific approach 11 33.5
Pilot experience with this specific landing 11 33.5
Amount of time spent reading instruments other than the SVS 9 41.5
Accuracy of pilots mental model of the SVS 8 48
Current level of SA 8 48
Degree of pilot fatigue 8 48
Amount of trust in SVS 7 53
Pilots level of confidence in the accuracy of the SVS 7 53
Accuracy of pilots mental model of the environment 6 58.5
Inference error 6 58.5

Appendix E
Number of errors in perceiving SVS data 6 58.5
Pilot error when using the SVS 6 58.5
Proximity to the destination airport 6 58.5
Amount of collaboration with crew members 5 64
Level of self confidence 5 64
Amount of trust in systems other than the SVS 4 69.5
Pilots level of confidence in his/her perception of the SVS 4 69.5
Pilots level of confidence in his/her perception of the world 4 69.5
Amount of trust in crew members 3 73.5
Inference delay 1 75.5
MachineIntuitiveness/usability of the SVS 30 1
Accuracy of GPS 20 5
Accuracy of terrain database 20 5
Limitations of the machines processor 17 9.5
Pictorial scene information density 17 9.5
Glare on SVS 16 12.5
Degree of overlay with PFD data 15 16.5
Color of symbols/text 14 22.5
Degree of display clutter 14 22.5
Display size 14 22.5
Auditory vs. visual warning 13 27.5
Functioning/malfunctioning of hardware/software 13 27.8
Physical condition of display surfaces 13 27.8
Color of terrain 12 30.5
Number of layers in menu structure 11 33.5
Feedback delay 10 36.5
Processing time (to display data from terrain database) 10 36.5
Location of the SVS display in the cockpit 9 41.5
Number of highlighted features currently in view 9 41.5
Number of obstacles currently in view 9 41.5
Placement of controls 9 41.5
Size of symbols/text 9 41.5
Update rate of GPS 9 41.5
Update rate of terrain database 9 41.5
Layout of controls 7 53
Number of key presses required to access desired information 6 58.5
Ability to declutter SVS display 5 64
FOV currently depicted on the SVS display 5 64
Tactile feedback from controls 3 73.5

Appendix E
SENSITIVITY TOTALS SCORE RANKEnvironmentDifficulty of approach 61 3
ATC workload 14 17.5
Altitude of the aircraft (too low/high?) 9 23.5
Speed of aircraft (too low/high?) 9 23.5
Degree of time pressure (is aircraft arriving on time, early) 1 45
Glare on displays other than the SVS 1 45
Accuracy of information from displays other than the SVS 0 63
Amount of information available from displays other SVS 0 63
Amount of noise in cockpit 0 63
Ceiling visibility at destination airport 0 63
Degree of redundant coding of SVS data 0 63
Difficulty of terrain environment at destination airport 0 63
Functioning/malfunctioning of displays other than the SVS 0 63
Lighting conditions in the cockpit 0 63
Physical state of the aircraft 0 63
Physical state of the engines 0 63
Traffic situation at destination airport 0 63
Usability/intuitiveness of displays other than the SVS 0 63
Weather conditions at destination airport 0 63
PilotLevel of mental workload 63 1
Amount of time spent reading instruments other than the SVS 52 4
Amount of time spent viewing the SVS display 51 5
Current level of SA 46 6
Accuracy of pilots mental model of the environment 44 7
Amount of time spent looking out-the-window 43 8
Number of errors in perceiving SVS data 32 9
Accuracy of pilots mental model of the SVS 31 11
Pilot error when using the SVS 31 11
Amount of display cross-checking 28 13
Pilots level of confidence in his/her perception of the world 21 14
Level of self confidence 18 15
Pilots level of confidence in the accuracy of the SVS 15 16
Pilots level of confidence in his/her perception of the SVS 14 17.5
Inference delay 9 23.5
Inference error 9 23.5
Amount of trust in SVS 8 27.5
Degree of pilot fatigue 8 27.5

Appendix E
Amount of trust in systems other than the SVS 5 32.5
Amount of collaboration with crew members 4 35.5
Experience using the SVS 2 40
Amount of trust in crew members 1 45
Experience and ability of the pilot 0 63
Experience with terrain surrounding destination airport 0 63
Pilot experience with this specific approach 0 63
Pilot experience with this specific landing 0 63
Pilot preference 0 63
Proximity to the destination airport 0 63
MachineIntuitiveness/usability of the SVS 31 11
Degree of display clutter 11 19.5
Degree of overlay with PFD data 11 19.5
Auditory vs. visual warning 9 23.5
Display size 9 23.5
Color of symbols/text 6 30
Color of terrain 6 30
FOV currently depicted on the SVS display 6 30
Pictorial scene information density 5 32.5
Feedback delay 4 35.5
Layout of controls 4 35.5
Location of the SVS display in the cockpit 4 35.5
Size of symbols/text 3 38
Number of key presses required to access desired information 2 40
Placement of controls 2 40
Number of layers in menu structure 1 45
Number of obstacles currently in view 1 45
Processing time (to display data from terrain database) 1 45
Tactile feedback from controls 1 45
Ability to declutter SVS display 0 63
Accuracy of GPS 0 63
Accuracy of terrain database 0 63
Functioning/malfunctioning of hardware/software 0 63
Glare on SVS 0 63
Limitations of the machines processor 0 63
Number of highlighted features currently in view 0 63
Physical condition of display surfaces 0 63
Update rate of GPS 0 63
Update rate of terrain database 0 63

INFLUENCE TOTALS SCORE RANKAbility to declutter SVS display 5 62
Accuracy of GPS 20 4
Accuracy of information from displays other than the SVS 15 14
Accuracy of pilots mental model of the environment 6 56
Accuracy of pilots mental model of the SVS 8 46
Accuracy of terrain database 20 4
Altitude of the aircraft (too low/high?) 4 67
Amount of collaboration with crew members 5 62
Amount of display cross-checking 15 14
Amount of information available from displays other SVS 12 30
Amount of noise in cockpit 4 67
Amount of time spent looking out-the-window 15 14
Amount of time spent reading instruments other than the SVS 9 38
Amount of time spent viewing the SVS display 15 14
Amount of trust in crew members 3 73
Amount of trust in SVS 7 51
Amount of trust in systems other than the SVS 4 67
ATC workload 0 77
Auditory vs. visual warning 13 26
Ceiling visibility at destination airport 14 20
Color of symbols/text 14 20
Color of terrain 12 30
Current level of SA 8 46
Degree of display clutter 14 20
Degree of overlay with PFD data 15 14
Degree of pilot fatigue 8 46
Degree of redundant coding of SVS data 14 20
Degree of time pressure (is aircraft arriving on time, early) 13 26
Difficulty of approach 20 4
Difficulty of landing 19 7
Difficulty of terrain environment at destination airport 24 2
Display size 14 20
Experience and ability of the pilot 22 3
Experience using the SVS 16 12
Experience with terrain surrounding destination airport 11 32
Feedback delay 10 36
FOV currently depicted on the SVS display 5 62
Functioning/malfunctioning of displays other than the SVS 17 8
Functioning/malfunctioning of hardware/software 13 26
Glare on displays other than the SVS 7 51

Glare on SVS 16 12
Inference delay 1 75
Inference error 6 56
Intuitiveness/usability of the SVS 30 1
Layout of controls 7 51
Level of mental workload 15 14
Level of self confidence 5 62
Lighting conditions in the cockpit 1 75
Limitations of the machines processor 17 8
Location of the SVS display in the cockpit 9 38
Number of errors in perceiving SVS data 6 56
Number of highlighted features currently in view 9 38
Number of key presses required to access desired information 6 56
Number of layers in menu structure 11 32
Number of obstacles currently in view 9 38
Physical condition of display surfaces 13 26
Physical state of the aircraft 8 46
Physical state of the engines 8 46
Pictorial scene information density 17 8
Pilot error when using the SVS 6 56
Pilot experience with this specific approach 11 32
Pilot experience with this specific landing 11 32
Pilot preference 17 8
Pilots level of confidence in his/her perception of the SVS 4 67
Pilots level of confidence in his/her perception of the world 4 67
Pilots level of confidence in the accuracy of the SVS 7 51
Placement of controls 9 38
Processing time (to display data from terrain database) 10 36
Proximity to the destination airport 6 56
Size of symbols/text 9 38
Speed of aircraft (too low/high?) 4 67
Tactile feedback from controls 3 73
Traffic situation at destination airport 5 62
Update rate of GPS 9 38
Update rate of terrain database 9 38
Usability/intuitiveness of displays other than the SVS 7 51
Weather conditions at destination airport 14 20
SENSITIVITY TOTALS SCORE RANKAbility to declutter SVS display 0 49
Accuracy of GPS 0 49

Accuracy of information from displays other than the SVS 0 49
Accuracy of pilots mental model of the environment 44 7
Accuracy of pilots mental model of the SVS 31 10
Accuracy of terrain database 0 49
Altitude of the aircraft (too low/high?) 9 21
Amount of collaboration with crew members 4 34
Amount of display cross-checking 28 13
Amount of information available from displays other SVS 0 49
Amount of noise in cockpit 0 49
Amount of time spent looking out-the-window 43 8
Amount of time spent reading instruments other than the SVS 52 4
Amount of time spent viewing the SVS display 51 5
Amount of trust in crew members 1 42
Amount of trust in SVS 8 27
Amount of trust in systems other than the SVS 5 32
ATC workload 14 17
Auditory vs. visual warning 9 21
Ceiling visibility at destination airport 0 49
Color of symbols/text 6 29
Color of terrain 6 29
Current level of SA 46 6
Degree of display clutter 11 19
Degree of overlay with PFD data 11 19
Degree of pilot fatigue 8 27
Degree of redundant coding of SVS data 0 49
Degree of time pressure (is aircraft arriving on time, early) 1 42
Difficulty of approach 61 3
Difficulty of landing 62 2
Difficulty of terrain environment at destination airport 0 49
Display size 9 21
Experience and ability of the pilot 0 49
Experience using the SVS 2 39
Experience with terrain surrounding destination airport 0 49
Feedback delay 4 34
FOV currently depicted on the SVS display 6 29
Functioning/malfunctioning of displays other than the SVS 0 49
Functioning/malfunctioning of hardware/software 0 49
Glare on displays other than the SVS 1 42
Glare on SVS 0 49
Inference delay 9 21
Inference error 9 21
Intuitiveness/usability of the SVS 31 10

Layout of controls 4 34
Level of mental workload 63 1
Level of self confidence 18 15
Lighting conditions in the cockpit 0 49
Limitations of the machines processor 0 49
Location of the SVS display in the cockpit 4 34
Number of errors in perceiving SVS data 32 9
Number of highlighted features currently in view 0 49
Number of key presses required to access desired information 2 39
Number of layers in menu structure 1 42
Number of obstacles currently in view 1 42
Physical condition of display surfaces 0 49
Physical state of the aircraft 0 49
Physical state of the engines 0 49
Pictorial scene information density 5 32
Pilot error when using the SVS 31 10
Pilot experience with this specific approach 0 49
Pilot experience with this specific landing 0 49
Pilot preference 0 49
Pilots level of confidence in his/her perception of the SVS 14 17
Pilots level of confidence in his/her perception of the world 21 14
Pilots level of confidence in the accuracy of the SVS 15 16
Placement of controls 2 39
Processing time (to display data from terrain database) 1 42
Proximity to the destination airport 0 49
Size of symbols/text 3 38
Speed of aircraft (too low/high?) 9 21
Tactile feedback from controls 1 42
Traffic situation at destination airport 0 49
Update rate of GPS 0 49
Update rate of terrain database 0 49
Usability/intuitiveness of displays other than the SVS 0 49
Weather conditions at destination airport 0 49
TOP FIFTEEN CHARACTERISTICS (INFLUENCE) SCORE RANK
Intuitiveness/usability of the SVS 30 1
Difficulty of terrain environment at destination airport 24 2
Experience and ability of the pilot 22 3
Difficulty of approach 20 4
Accuracy of GPS 20 4

Accuracy of terrain database 20 4
Difficulty of landing 19 7
Functioning/malfunctioning of displays other than the SVS 17 8
Pilot preference 17 8
Limitations of the machines processor 17 8
Pictorial scene information density 17 8
Experience using the SVS 16 12
Glare on SVS 16 12
Accuracy of information from displays other than the SVS 15 14
Amount of display cross-checking 15 14
TOP FIFTEEN CHARACTERISTICS (SENSITIVITY) SCORE RANK
Level of mental workload 63 1
Difficulty of landing 62 2
Difficulty of approach 61 3
Amount of time spent reading instruments other than the SVS 52 4
Amount of time spent viewing the SVS display 51 5
Current level of SA 46 6
Accuracy of pilots mental model of the environment 44 7
Amount of time spent looking out-the-window 43 8
Number of errors in perceiving SVS data 32 9
Accuracy of pilots mental model of the SVS 31 10
Pilot error when using the SVS 31 10
Intuitiveness/usability of the SVS 31 10
Amount of display cross-checking 28 13
Pilots level of confidence in his/her perception of the world 21 14
Level of self confidence 18 15

RANK (2)65
5
15.8
59.5
49
5
70.5
65
15.8
31.5
70.5
15.8
42.5
15.8
74.5
54
70.5
77
28.5
23.5
23.5
31.5
49
23.5
15.8
49
23.5
28.5
5
8
2
23.5
3
13.5
34.5
37.5
65
10.5
28.5
54

13.5
76.5
59.5
1
54
15.8
65
76.5
10.5
42.5
59.5
42.5
59.5
34.5
42.5
28.5
49
49
10.5
59.5
34.5
34.5
10.5
70.5
70.5
54
42.5
37.5
59.5
42.5
70.5
74.5
65
42.5
42.5
54
23.5
RANK (2)64
64

64
7
11
64
24.5
36.5
14
64
64
8
4
5
46
28.5
33.5
18.5
24.5
64
31
31
6
20.5
20.5
28.5
64
46
3
2
64
24.5
64
41
64
36.5
31
64
64
46
64
24.5
24.5
11

36.5
1
16
64
64
36.5
9
64
41
46
46
64
64
64
33.5
11
64
64
64
18.5
15
17
41
46
64
39
24.5
46
64
64
64
64
64
RANK (2)
1
2
3
5
5

5
8
10.5
10.5
10.5
10.5
13.5
13.5
15.8
15.8
RANK (2)
1
2
3
4
5
6
7
8
9
11
11
11
14
15
16

Appendix F
Tradeoff Scenarios (Varying Characteristics)
1
1.) Amount of time spent looking out-the-window/Difficulty of approach/landing
Relationship:a.) When the desirability of Amount of time spent looking out-the-window
increases, the desirability of Difficulty of approach/landingincreasesordecreases
b.) When the desirability of Amount of time spent looking out-the-windowdecreases, the desirability of Difficulty of approach/landingincreasesordecreases
c.) When the desirability of Difficulty of approach/landingincreases, thedesirability of Amount of time spent looking out the windowincreasesordecreases
d.) When the desirability of Difficulty of approach/landingdecreases, thedesirability of Amount of time spent looking out the windowincreasesordecreases
Classification: Unstable
Explanation of Scenarios:a.) Direct Relationship (Tradeoff Possible): If the terrain surrounding the
destination airport is not difficult to navigate and the weather is desirable, thePF may be able to spend more time looking out-the-window. However, if thepilot devotes too much head up time, and does not pay attention to hisinstruments and/or the SVS display, the approach/landing may become moredifficult.
b.) Direct Relationship (Tradeoff Possible): If the PF spends less time viewingthe terrain out the window, he/she will have more time to view the SVS andother instruments. This may be especially helpful in poor weather conditions,because the SVS provides an uninterrupted view of terrain. This would makethe desirability of the Difficulty of the approach/landing increase. However,looking out-the-window can be used to quickly check theaccuracy of theSVS. In this situation, if the PF does not spend any head up time, thedesirability of the Difficulty of the approach/landing may decrease (becomemore difficult).
c.) Direct Relationship (Tradeoff Possible): If the approach/landing is relativelyeasy to navigate either because of terrain or weather conditions, then the pilotcan spend more time looking out the window, and less time viewing the SVSdisplay. However, since the SVS display may eventually replace the out-the-window view altogether, it may be desirable to have the PF looking primarilyat the SVS display during the approach/landing, even if this approach/landingis relatively simple.
d.) Direct Relationship (Tradeoff Possible): This type of relationship is not easyto imagine. Presumably, if the approach/landing is very difficulty (because ofterrain or weather) it would be desirable to have the pilot spend more timeviewing the SVS display and less time looking out the window. However, it

Appendix F
Tradeoff Scenarios (Varying Characteristics)
2
may be somewhat useful for the PF to quickly check the accuracy of the SVSdisplay of terrain by looking out the window, even in difficult approaches.
2.) Amount of time spent viewing the SVS display/Amount of time spent lookingout-the-window
Relationship:a.) When the desirability of Amount of time spent viewing the SVS display
increases, the desirability of Amount of time spent looking out-the-window decreases
b.) When the desirability of Amount of time spent viewing the SVS displaydecreases, the desirability of Amount of time spent looking out thewindow increasesor decreases
c.) When the desirability of Amount of time spent looking out-the-windowincreases, the desirability of Amount of time spent viewing the SVSdisplaydecreases
d.) When the desirability of Amount of time spent looking out-the-windowdecreases, the desirability of Amount of time spent viewing the SVSdisplayincreasesor decreases
Classification: Unstable
Explanation of Scenarios:a.) Tradeoff: If a pilot is spending a large amount of time viewing the SVS
display, he/she is necessarily spending less time looking out-the-window. Thisis most likely a desirable situation, since the SVS display should be able tofully support the pilot through all phases of flight.
b.) Direct Relationship (Tradeoff Possible): If it is undesirable for the PF to spenda lot of time viewing the SVS display, then he/she can spend more timelooking out-the-window. This may be a situation that is not normallydesirable. However, the pilot can also spend time looking at instruments otherthan the SVS, and his/her time spent looking out-the-window and looking atthe SVS display will decrease.
c.) Tradeoff: If the PF spends a great deal of time looking out the window, thentime spent viewing the SVS display will decrease
d.) Direct Relationship (Tradeoff Possible): If the PF spends less time lookingout-the-window, then it is possible to spend more time viewing the SVSdisplay. However, the PF may also view instruments unrelated to the SVS andtime spent looking out-the-window and time spent viewing the SVS displaywould both decrease.
3.) Amount of time spent reading instruments other than the SVS/Amount of timespent looking out-the-window
Relationship:

Appendix F
Tradeoff Scenarios (Varying Characteristics)
3
a.) When the desirability of Amount of time spent reading instruments otherthan the SVSincreases, the desirability of Amount of time spent lookingout-the-windowdecreases
b.) When the desirability of Amount of time spent reading instruments otherthan the SVSdecreases, the desirability of Amount of time spent lookingout-the-windowincreasesor decreases
c.) When the desirability of Amount of time spent looking out-the-windowincreases, the desirability of Amount of time spent reading instrumentsother than the SVSdecreases
d.) When the desirability of Amount of time spent looking out-the-windowdecreases, the desirability of Amount of time spent reading instrumentsother than the SVSincreasesor decreases
Classification: Unstable
Explanation of Scenarios:a.) Tradeoff: When the PF spends more time viewing instruments unrelated to the
SVS, less head up time can be spent viewing terrain.b.) Direct Relationship (Tradeoff Possible): When it is less desirable for the PF to
view instruments other than the SVS, more time can be spent looking out-the-window. However, more time can also be spent viewing the SVS display,which would decrease the amount of time spent looking out-the-window.
c.) Tradeoff: If it is desirable to have to PF spend time looking out-the-window,less head down time can be spent viewing other instruments in the cockpit.
d.) Direct Relationship (Tradeoff Possible): If it is undesirable to have the pilotlooking out-the-window, more time can be spent viewing instruments otherthan the SVS. However, if this additional time is spent viewing the SVSdisplay, less time will be spent viewing instruments other than the SVS.
4.) Current level of SA/Amount of time spent looking out-the-window
Relationship:a.) When the desirability of Current level of SAincreases, the desirability of
Amount of time spent looking out-the-windowincreasesor decreasesb.) When the desirability of Current level of SAdecreases, the desirability of
Amount of time spent looking out-the-windowincreasesor decreasesc.) When the desirability of Amount of time spent looking-out-window
increases, the desirability of Current level of SAincreasesor decreasesd.) When the desirability of Amount of time spent looking out-the-window
decreases, the desirability of Current level of SAincreasesor decreases
Classification: Unstable
Explanation of Scenarios:a.) Direct Relationship (Tradeoff Possible): Situation awareness may become
higher because the pilot is spending time looking out-the-window (in desirable

Appendix F
Tradeoff Scenarios (Varying Characteristics)
4
weather conditions with relatively flat terrain). However, situation awarenessmay become higher in other situations (such as in poor weather conditions)when the PF is spending less time looking out-the-window (and more timeviewing the SVS display).
b.) Direct Relationship (Tradeoff Possible): If the pilot’s current level of SA islow, he/she may spend more time looking out-the-window at the terrainenvironment in order to try and regain SA. However, he/she may also spendmore time looking at the SVS and other instruments (and not out-the-window)in order to try and regain SA.
c.) Direct Relationship (Tradeoff Possible): If the PF is spending a great deal oftime looking out-the-window, SA may be higher in good weather conditionswith flat terrain. However, this may also result in decreased situationawareness if it decreases the amount of time the PF spends viewing the SVSdisplay (in poor weather conditions with complex terrain).
d.) Direct Relationship (Tradeoff Possible): When the PF spends less timelooking out-the-window, and more time looking at the SVS display, SA willmost likely increase. However, there may be some situations in whichdecreasing time spent looking out-the-window will decrease SA. For example,when there is an inaccuracy in the terrain database, or whenhardware/software is otherwise not functioning properly.
5.) Level of mental workload/Amount of time spent looking out-the-window
Relationship:a.) When the desirability of Level of mental workloadincreases, the
desirability of Amount of time spent looking out-the-windowincreasesordecreases
b.) When the desirability of Level of mental workloaddecreases, thedesirability of Amount of time spent looking out-the-windowincreasesordecreases
c.) When the desirability of Amount of time spent looking out-the-windowincreases, the desirability of Level of mental workloadincreasesordecreases
d.) When the desirability of Amount of time spent looking out-the-windowdecreases, the desirability of Level of mental workloadincreasesordecreases
Classification: Unstable
Explanation of Scenarios:a.) Direct Relationship (Tradeoff Possible): When the desirability of Level of
mental workload decreases (mental workload is low) the PF may be able tofocus more of their attention on the out-the-window scene. However, the PFmay also be able to focus more on the SVS or other displays in this situation.
b.) Direct Relationship (Tradeoff Possible): When the pilots level of mentalworkload increases, their time spent looking out-the-window will either

Appendix F
Tradeoff Scenarios (Varying Characteristics)
5
increase or decrease. If mental workload is high (during landing, for example)the pilot may spend more time making sure the aircraft is at the rightaltitude/speed and less time looking out-the-window. However, in otherphases of flight, the pilot may spend more time looking out-the-window inorder to check the accuracy of the SVS display to make certain that anwarning from the display is accurate.
c.) Direct Relationship (Tradeoff Possible): When the PF is spending a great dealof time looking out the window, he/she may have a low level of mentalworkload if weather conditions are good and the terrain is relatively easy tonavigate, or a high level of mental workload because they are not focusing onimportant information on the SVS display (in poor weather conditions, forexample) or from other instruments.
d.) Direct Relationship (Tradeoff Possible): If little time is spent looking out-the-window, the pilots level of mental workload may be low because they areinstead viewing the SVS display (in poor weather conditions, for example), orhigh because they are viewing an inaccurate, or improperly aligned display.
6.) Amount of time spent reading instruments other than the SVS/Difficulty ofapproach/landing
Relationship:a.) When the desirability of Amount of time spent reading instruments other
than the SVSincreases, the desirability of Difficulty of approach/landingincreasesor decreases
b.) When the desirability of Amount of time spent reading instruments otherthan the SVSdecreases, the desirability of Difficulty of approach/landingincreasesor decreases
c.) When the desirability of Difficulty of approach/landingincreases, thedesirability of Amount of time spent reading instruments other than theSVS increasesor decreases
d.) When the desirability of Difficulty of approach/landingdecreases, thedesirability of Amount of time spent reading instruments other than theSVS increasesor decreases
Classification: Unstable
Explanation of Scenarios:a.) Direct Relationship (Tradeoff Possible): If the PF is paying sufficient attention
to instruments other than the SVS, the approach/landing may become moredifficult because they are paying less attention to the SVS display or lessdifficult because these instruments are proving information pertinent to thecurrent phase of flight.
b.) Direct Relationship (Tradeoff Possible): If the PF is paying little attention toinstruments other than the SVS, the difficulty of approach/landing mayincrease because they pilot is not focusing attention on important information.

Appendix F
Tradeoff Scenarios (Varying Characteristics)
6
However, the difficulty of the approach/landing may decrease because thepilot can spend more time viewing the SVS display.
c.) Direct Relationship (Tradeoff Possible): When the approach/landing isrelatively simple, the pilot has the option of focusing attention on the SVS oron other instruments. Where the pilot focuses his/her attention has fewerconsequences in this situation.
d.) Direct Relationship: If the approach is extremely difficult, because of weatherconditions, terrain, pilot fatigue, etc. it may be essential for the pilot to spendtime reading instruments pertinent to that phase of flight. However, in badweather conditions especially, it may be more important for the pilot to focuson the SVS display which provides a clear view of terrain.
7.) Amount of time spent viewing the SVS display/Difficulty of approach/landing
Relationship:a.) When the desirability of Amount of time spent viewing the SVS display
increases, the desirability of Difficulty of approach/landingincreasesordecreases
b.) When the desirability of Amount of time spent viewing the SVS displaydecreases, the desirability of Difficulty of approach/landingincreasesordecreases
c.) When the desirability of Difficulty of approach/landingincreases, thedesirability of Amount of time spent viewing the SVS displayincreasesordecreases
d.) When the desirability of Difficulty of approach/landingdecreases, thedesirability of Amount of time spent viewing the SVS displayincreasesordecreases
Classification: Unstable
Explanation of Scenarios:a.) Direct Relationship (Tradeoff Possible): Ideally, when the PF is devoting
attention to the SVS display, the approach/landing should be less difficult,since the SVS provides a clear view of terrain and other obstacles. However,there may be situations in which the SVS was not functioning correctly, or theterrain database or GPS was inaccurate. In this case, devoting too much timeto the SVS could make the approach/landing more difficult.
b.) Direct Relationship (Tradeoff Possible): When the PF spends little timeviewing the SVS display (especially in low visibility conditions) theapproach/landing may be more difficult. However, spending little timeviewing the SVS display may be necessary as mentioned above, when thesystem is not functioning properly, and the difficulty of the approach/landingwould decrease because the pilot would not have to deal with inaccurate ormissing information.
c.) Direct Relationship (Tradeoff Possible): In an easy approach/landingsituation, the pilot may spend more or less time viewing the SVS display. This

Appendix F
Tradeoff Scenarios (Varying Characteristics)
7
may depend purely on pilot preference, or pilots amount of trust in the SVS,or it may be dependent on the accuracy of the components of the SVS.
d.) Direct Relationship (Tradeoff Possible): As with an easy approach, with adifficult approach the pilot may spend more or less time viewing the SVSdisplay depending on a variety of factors such as its accuracy, pilotpreference, pilot experience, etc.
8.) Current level of SA/Difficulty of approach/landing
Relationship:a.) When the desirability of Current level of SAincreases, the desirability of
Difficulty of approach/landingincreasesb.) When the desirability of Current level of SAdecreases, the desirability of
Difficulty of approach/landingdecreasesc.) When the desirability of Difficulty of approach/landingincreases, the
desirability of Current level of SAincreasesd.) When the desirability of Difficulty of approach/landingdecreases, the
desirability of Current level of SAdecreases
Classification: Direct Relationship
Explanation of Scenarios:a.) Direct Relationship: When the PF has a very high awareness of his
surroundings and current situation, this should make the approach/landingeasier to carry out regardless of the weather conditions, type of terrain, orother factors.
b.) Direct Relationship: When the PF has very low situation awareness, theapproach/landing would be more difficult regardless of other factors
c.) Direct Relationship: When the terrain is easy to navigate, or the weather isdesirable, for example, the pilots SA will be higher. This may be a result oflow mental workload in these conditions.
d.) Direct Relationship: When the approach/landing is difficult because of anynumber of factors, the pilots SA will be lower. This may also be a result ofhigh mental workload in these conditions.
9.) Level of mental workload/Difficulty of approach/landing
Relationship:a.) When the desirability of Level of mental workloadincreases, the
desirability of Difficulty of approach/landingincreasesb.) When the desirability of Level of mental workloaddecreases, the
desirability of Difficulty of approach/landingdecreasesc.) When the desirability of Difficulty of approach/landingincreases, the
desirability of Level of mental work loadincreasesd.) When the desirability of Difficulty of approach/landingdecreases, the
desirability of Level of mental workloaddecreases

Appendix F
Tradeoff Scenarios (Varying Characteristics)
8
Classification: Direct Relationship
Explanation of Scenarios:a.) Direct Relationship: When the pilot’s task is relatively easy, and mental
workload is low, the approach/landing will become easier to carry outregardless of other factors such as terrain, weather, or SA.
b.) Direct Relationship: When the pilot’s task is more difficult, and mentalworkload is high, the approach/landing will become more difficult, regardlessof other factors.
c.) Direct Relationship: When the conditions in which the approach/landing isattempted, or the terrain itself, is easy to carry out, then, assuming the pilot isnot fatigued and instruments are functioning correctly, his/her mentalworkload will be relatively low.
d.) Direct Relationship: When the approach/landing is very difficult, the pilotsmental workload will be higher.
10.) Intuitiveness/usability of the SVS/Difficulty of approach/landing
Relationship:a.) When the desirability of Intuitiveness/usability of the SVSincreases, the
desirability of Difficulty of approach/landingincreasesb.) When the desirability of Intuitiveness/usability of the SVSdecreases, the
desirability of Difficulty of approach/landingdecreasesc.) When the desirability of Difficulty of approach/landingdecreases, the
desirability of Intuitiveness/usability of the SVSdecreasesd.) When the desirability of Difficulty of approach/landingincreases, the
desirability of Intuitiveness/usability of the SVSincreases
Classification: Direct Relationship
Explanation of Scenarios:a.) Direct Relationship: If the SVS display is very intuitive to the pilot, the
approach/landing will be easier to carry out, regardless of other factors. Itis important to note that a display may be more or less intuitive dependingon the operator’s experience, or preference.
b.) Direct Relationship: If the SVS display is not user friendly, and thereforeunintuitive, the approach/landing will be more difficult to carry outregardless of other factors.
c.) Direct Relationship: If the approach/landing is very difficult because ofterrain, weather, pilot fatigue etc., this may require that the SVS display beextremely intuitive, since pilot mental workload may be high in thissituation.

Appendix F
Tradeoff Scenarios (Varying Characteristics)
9
d.) Direct Relationship: If the approach/landing is very simple, the SVS canbe somewhat more difficult to use because mental workload in thissituation would be lower and the pilot would have more attention toallocate to the SVS.
11.) Current level of SA/Accuracy of pilots mental model of the environment
Relationship:a.) When the desirability of Current level of SAincreases, the desirability of
Accuracy of pilots mental model of the environmentincreasesb.) When the desirability of Current level of SAdecreases, the desirability of
Accuracy of pilots mental model of the environmentdecreasesc.) When the desirability of Accuracy of pilots mental model of the
environmentincreases, the desirability of Current level of SAincreasesd.) When the desirability of Accuracy of pilots mental model of the
environmentdecreases, the desirability of Current level of SAdecreases
Classification: Direct Relationship
Explanation of Scenarios:a.) Direct Relationship: When the PF has a high awareness of their situation
and surroundings, they are also likely to have a very accurate mentalmodel of their environment. This may be a result of experience, or aconsequence of an easy approach/landing
b.) Direct Relationship: When the PF has low SA, he/she is less aware of hersurroundings and therefore the environment and their mental model maytherefore be inaccurate.
c.) Direct Relationship: The PF may have a great deal of experience with thisspecific approach/landing and therefore a very accurate mental model ofthe environment which would result in an increased level of SA
d.) Direct Relationship: It is also possible that the PF may have littleexperience with this specific approach, or may have malfunctioninginstruments and therefore an inaccurate mental model of the environmentwhich would result in a lower level of SA.
12.) Level of mental workload/ Accuracy of pilots mental model of the environment
Relationship:a.) When the desirability of Level of mental workloadincreases, the
desirability of Accuracy of pilots mental model of the environmentincreases
b.) When the desirability of Level of mental workloaddecreases, thedesirability of Accuracy of pilots mental model of the environmentdecreases

Appendix F
Tradeoff Scenarios (Varying Characteristics)
10
c.) When the desirability of Accuracy of pilots mental model of theenvironmentincreases, the desirability of Level of mental workloadincreases
d.) When the desirability of Accuracy of pilots mental model of theenvironmentdecreases, the desirability of Level of mental workloaddecreases
Classification: Direct Relationship
Explanation of Scenarios:a.) Direct Relationship: If the current task is relatively easy to carry out (low
mental workload), then the pilot may have more time to pay attention tohis surroundings through instruments or looking out the window, andwould have a more accurate mental model of the environment.
b.) Direct Relationship: If the current task is very complicated and the pilotsmental workload is very high, then he/she would have lower SA, whichmay create an inaccurate mental model of the environment.
c.) Direct Relationship: If the pilot has experience with the approach/landingand has high SA, their mental model of the environment would be veryaccurate. This could lead to a decrease in mental workload, regardless ofother factors.
d.) Direct Relationship: If however, the pilot has little experience with theapproach and has low SA, their mental model of the environment may beinaccurate, which could lead to increased mental workload even if theapproach/landing is relatively easy, or the weather conditions aredesirable.
13.) Amount of time spent viewing the SVS display/Amount of time spent readinginstruments other than the SVS
Relationship:a.) When the desirability of Amount of time spent viewing the SVS display
increases, the desirability of Amount of time spent reading instrumentsother than the SVSdecreases
b.) When the desirability of Amount of time spent viewing the SVS displaydecreases, the desirability of Amount of time spent reading instrumentsother than the SVSincreases
c.) When the desirability of Amount of time spent reading instruments otherthan the SVSincreases, the desirability of Amount of time spent viewingthe SVSdecreases
d.) When the desirability of Amount of time spent reading instruments otherthan the SVSdecreases, the desirability of Amount of time spent viewingthe SVSincreases
Classification: Tradeoff

Appendix F
Tradeoff Scenarios (Varying Characteristics)
11
Explanation of Scenarios:a.) Tradeoff: The relationship between these two variables is rather obvious. When
the PF devotes a great deal of attention to the SVS display, his/her time spentviewing instruments other than the SVS will necessarily decrease. Since the SVScan be used exclusively for viewing terrain, especially in poor visibilityconditions, this may be the ideal situation
b.) Tradeoff: When the PF spends little time viewing the SVS display, he/she willspend more time viewing instruments other than the SVS. This may result fromlack of trust in the SVS, lack of experience with the SVS, some malfunction ofthe SVS, or a variety of other factors.
c.) Tradeoff: If the PF devotes more time to viewing instruments other than the SVS,less time will be available to devote to viewing the SVS.
d.) Tradeoff: If the PF devotes less time to viewing instruments other than the SVS,more time will be available to devote to viewing the SVS.
14.) Current level of SA/Amount of time spent reading instruments other than theSVS
Relationship:a.) When the desirability of Current level of SAincreases, the desirability of
Amount of time spent reading instruments other than the SVSincreasesordecreases
b.) When the desirability of Current level of SAdecreases, the desirability ofAmount of time spent reading instruments other than the SVSincreasesordecreases
c.) When the desirability of Amount of time spent reading instruments otherthan the SVSincreases, the desirability of Current level of SAincreasesor decreases
d.) When the desirability of Amount of time spent reading instruments otherthan the SVSdecreases, the desirability of Current level of SAincreasesor decreases
Classification: Unstable
Explanation of Scenarios:a.) Direct Relationship (Tradeoff Possible): A high level of SA can result from a
variety of factors. The PF may need to devote a significant amount ofattention to instruments other than the SVS if, for example, they containinformation pertinent to the current phase of flight, the SVS is inaccurate, inorder to cross-check between displays, etc. However, increased SA shouldalso come from viewing the SVS display, especially in very low visibilityconditions, in which the out-the-window view is insufficient.
b.) Direct Relationship (Tradeoff Possible): Low SA can also result fromchoosing to spend time viewing instruments other than the SVS, or fromviewing the SVS display itself, depending on the circumstance. Ideally, when

Appendix F
Tradeoff Scenarios (Varying Characteristics)
12
the SVS is functioning properly, it should encourage high SA. However, if theSVS display is inaccurate, if the pilot has an inaccurate machine model, or thepilot does not trust the SVS display, viewing the display may actually result indecreased SA.
c.) Direct Relationship (Tradeoff Possible): As mentioned above, devoting asignificant amount of attention to instruments other than the SVS can result inan increased or decreased level of SA, depending on the circumstances.
d.) Direct Relationship (Tradeoff Possible): As mentioned above, viewing theSVS display or looking out-the-window, and not devoting attention toinstruments other than the SVS can also result in an increased or decreasedlevel of SA depending on the situation.
15.) Level of mental workload/Amount of time spent reading instruments other thanthe SVS
Relationship:a.) When the desirability of Level of mental workloadincreases, the
desirability of Amount of time spent reading instruments other than theSVS increasesor decreases
b.) When the desirability of Level of mental workloaddecreases, thedesirability of Amount of time spent reading instruments other than theSVSdecreases
c.) When the desirability of Amount of time spent reading instruments otherthan the SVSincreases, the desirability of Level of mental workloadincreasesor decreases
d.) When the desirability of Amount of time spent reading instruments otherthan the SVSdecreases, the desirability of Level of mental workloadincreasesor decreases
Classification: Unstable
Explanation of Scenarios:a.) Direct Relationship (Tradeoff Possible): When the PF is experiencing a low
level of mental workload, presumably because the task is relatively simple(i.e. weather conditions are ideal), then he/she has the option of devotingmore/less attention to instruments other than the SVS.
b.) Direct Relationship: If the desirability of the amount of mental workloaddecreases (high mental workload), then the PF will have less attention todevote to viewing instruments other than the SVS. In very low visibilityconditions, the PF may need to devote much of his/her attention to the SVSdisplay in order to carry out the approach/landing.
c.) Direct Relationship (Tradeoff Possible): Spending a significant amount oftime viewing instruments other than the SVS can result in high or low levelsof mental workload depending on a variety of factors. For example, if the PFshould be looking at the SVS display and is not, mental workload mayincrease. However, if these other instruments are providing pertinent

Appendix F
Tradeoff Scenarios (Varying Characteristics)
13
information to the current phase of flight, this may result in decreased mentalworkload.
d.) Direct Relationship (Tradeoff Possible): As mentioned above, devoting a greatdeal of attention to instruments other than the SVS display can result in anincreased or decreased level of mental workload depending on the situation.
16.) Current level of SA/Amount of time spent viewing the SVS display
Relationship:a.) When the desirability of Current level of SAincreases, the desirability of
Amount of time spent viewing the SVS displayincreasesb.) When the desirability of Current level of SAdecreases, the desirability of
Amount of time spent viewing the SVS displaydecreasesc.) When the desirability of Amount of time spent viewing the SVS display
increases, the desirability of Current level of SAincreasesd.) When the desirability of Amount of time spent viewing the SVS display
decreases, the desirability of Current level of SAdecreases
Classification: Unstable
Explanation of Scenarios:a.) Direct Relationship: The SVS is designed to promote high situation awareness
because it allows the pilot to have a clear view of terrain and other obstaclesregardless of current weather conditions. Therefore, in an ideal situation, highSA should result from spending a significant amount of time viewing the SVSdisplay.
b.) Direct Relationship: Similar to the situation mentioned above, if the PF spendslittle time viewing the SVS display, this will most likely result in decreasedSA.
c.) Direct Relationship: As mentioned above, viewing the SVS display for asignificant amount of time should result in increased SA
d.) Direct Relationship: Not devoting a great deal of attention to the SVS displayshould result in decreased SA.
17.) Level of mental workload/Amount of time spent viewing the SVS display
Relationship:a.) When the desirability of Level of mental workloadincreases, the
desirability of Amount of time spent viewing the SVS displayincreasesordecreases
b.) When the desirability of Level of mental workloaddecreases, thedesirability of Amount of time spent viewing the SVS displayincreasesordecreases
c.) When the desirability of Amount of time spent viewing the SVS displayincreases, the desirability of Level of mental workloadincreasesordecreases

Appendix F
Tradeoff Scenarios (Varying Characteristics)
14
d.) When the desirability of Amount of time spent viewing the SVS displaydecreases, the desirability of Level of mental workloadincreasesordecreases
Classification: Unstable
Explanation of Scenarios:a.) Direct Relationship (Tradeoff Possible): If the mental workload of the PF is
low then he/she has the option of allocating more or less attention to the SVSdisplay.
b.) Direct Relationship (Tradeoff Possible): If, however, the mental workload ofthe PF is very high because the weather conditions are very poor, he/she mayneed to spend a significant amount of time focusing on the SVS display,which is designed for use in this type of situation. However, under conditionsof high mental workload, he/she may have less time to view one instrumentfor any extended period of time, and will most likely need to cross-checkfrequently between instruments.
c.) Direct Relationship (Tradeoff Possible): If the PF is spending most of theirtime viewing the SVS display, this can result in low or high mental workload.Mental workload may decrease if weather conditions or other factors warrantthe pilot paying attention exclusively to the SVS display. However, if the SVSis inaccurate, not functioning correctly, or the pilot has an inaccurate machinemodel, mental workload may increase as a result.
d.) Direct Relationship (Tradeoff Possible): If the pilot spends little time viewingthe SVS display, this can result in low or high levels of mental workloaddepending on the above-mentioned factors.
18.) Intuitiveness/usability of the SVS display/Level of mental workload
Relationship:a.) When the desirability of Intuitiveness/usability of the SVS display
increases, the desirability of Level of mental workloadincreasesb.) When the desirability of Intuitiveness/usability of the SVS display
decreases, the desirability of Level of mental workloaddecreasesc.) When the desirability of Level of mental workloadincreases, the
desirability of Intuitiveness/usability of the SVS displaydecreasesd.) When the desirability of Level of mental workloaddecreases, the
desirability of Intuitiveness/usability of the SVS displayincreases
Classification: Unstable
Explanation of Scenarios:a.) Direct Relationship: If the SVS display is highly intuitive to the pilot, then this
should result in a lower level of mental workload, regardless of other factors.This may depend on the experience of the pilot, his amount of trust in theSVS, his machine model, as well as other factors.

Appendix F
Tradeoff Scenarios (Varying Characteristics)
15
b.) Direct Relationship: If the SVS display is not intuitive to the pilot, then thisshould result in a higher level of mental workload, regardless of other factors.
c.) Tradeoff: If the PF mental workload is very low, then it is not as critical thatthe SVS display be extremely intuitive to him/her. Although a user-friendlyinterface is always desirable, it is less important under conditions of lowmental workload since the pilot would presumably have more attention todevote to the display.
d.) Tradeoff: If the PF mental workload is very high, then it is extremely criticalthat the SVS be intuitive to that individual, since he/she will not have a greatdeal of time or attention to devote to the display.
19.) Difficulty of approach/landing/Amount of display cross-checking
Relationship:a.) When the desirability of Difficulty of approach/landingincreases, the
desirability of amount of display cross-checkingdecreasesb.) When the desirability of Difficulty of approach/landingdecreases, the
desirability of amount of display cross-checkingincreasesor decreasesc.) When the desirability of Amount of display cross-checkingincreases, the
desirability of Difficulty of approach/landingincreasesor decreasesd.) When the desirability of Amount of display cross-checkingdecreases, the
desirability of Difficulty of approach/landingincreasesor decreases
Classification: Unstable
Explanation of Scenarios:a.) Tradeoff: If the approach/landing situation is relatively easy because of
terrain, weather conditions, or other factors such as experience of the pilot,the amount of time the pilot spends cross-checking will decrease. If thepilot is overly confident, he/she may not cross-check between displaysenough, which could result in an error.
b.) Direct Relationship (Tradeoff Possible): If the approach/landing situationis very difficult, the PF may need to cross-check information betweendisplays frequently in order to avoid a potential error and to increase hissituation awareness, and the accuracy of his mental model of theenvironment. However, there may also be situations in which theapproach/landing causes an increase in mental workload, and the pilotdoes not have the attention to devote to cross-checking between displays.In this situation it may be more desirable to have the pilot focusedprimarily on one instrument such as the SVS.
c.) Direct Relationship (Tradeoff Possible): If the PF is spending a significantamount of time cross-checking information, this could make the approacheasier for him/her because they will have increased SA. However, if toomuch time is spent cross-checking information, the pilot may not beallocating enough attention to pertinent displays (such as the SVS) which

Appendix F
Tradeoff Scenarios (Varying Characteristics)
16
would assist in the approach/landing, and the difficulty of theapproach/landing would therefore increases.
d.) Direct Relationship (Tradeoff Possible): If the PF is spending little timecross-checking information between displays, this could also make thecurrent approach/landing more or less difficult depending on the abovementioned factors.
20.) Difficulty of approach/landing/Degree of display clutter/degree of overlay withPFD data
Relationships:a.) When the desirability of Difficulty of approach/landingincreases, the
desirability of Degree of display clutter/degree of overlay with PFD datadecreases
b.) When the desirability of Difficulty of approach/landingdecreases, thedesirability of Degree of display clutter/degree of overlay with PFD dataincreases
c.) When the desirability of Degree of display clutter/degree of overlay withPFD dataincreases, the desirability of Difficulty of approach/landingincreasesor decreases
d.) When the desirability of Degree of display clutter/degree of overlay withPFD datadecreases, the desirability of Difficulty of approach/landingincreasesor decreases
Classification: Unstable
Explanation of Scenarios:a.) Tradeoff: If the approach/landing situation is relatively simple, then
the desirability of the Degree of clutter will increase (low clutterlevel). In other words, it will be less essential for the display to beuncluttered, since mental workload will presumably be lower.
b.) Tradeoff: If the approach/landing is very difficult, for whatever reason,then it is essential that the degree of display clutter be relatively low inorder to decrease mental workload for the PF and provide an intuitive,easy to read display.
c.) Direct Relationship (Tradeoff Possible): If the SVS is uncluttered, andtherefore easy to read and intuitive to the PF, the approach/landing willmost likely be easier for the PF to carry out since the display is moreintuitive. However, the approach/landing could become moredifficulty if the display has so little information that information thepilot currently needs is not displayed, and he/she has to search throughthe menu in order to obtain this information.
d.) Direct Relationship (Tradeoff Possible): If the SVS is very cluttered,the approach landing may be more or less difficult for the abovementioned reasons.

Appendix F
Tradeoff Scenarios (Varying Characteristics)
17
21.) Amount of display cross-checking/Current level of SA
Relationships:a.) When the desirability of the Amount of display cross-checkingincreases,
the Current level of SAincreases.b.) When the desirability of the Amount of display cross-checkingdecreases,
the Current level of SAdecreasesc.) When the desirability of the Current level of SAincreases, the desirability
of Amount of display cross-checkingdecreasesd.) When the desirability of the Current level of SAdecreases, the desirability
of Amount of display cross-checkingincreases.
Classification: Unstable
Explanation of Scenarios:a.) Direct Relationship: If the PF is spending a lot of time cross-checking
information between displays, then his/her SA should increase.b.) Direct Relationship: If the PF is spending little time cross-checking
between displays, his/her SA should decrease since they are gettinginformation primarily from one source which could be inaccurate.
c.) Tradeoff: If the PF has a high SA because he/she is very experiencedwith the current terrain surroundings, or has a high amount of generalexperience, they will not need to cross-check information betweendisplays as frequently.
d.) Tradeoff: If the PF has very low SA, he/she may need to cross-checkinformation between displays in order to increase their awareness ofthe current situation.
22.) Amount of display cross-checking/Level of mental workload
Relationships:a.) When the desirability of Amount of display cross-checkingincreases, the
desirability of the Level of mental workloaddecreasesb.) When the desirability of Amount of display cross-checkingdecreases, the
desirability of the Level of mental workloadincreasesc.) When the desirability of the Level of mental workloadincreases, the
desirability of Amount of display cross-checkingincreasesd.) When the desirability of the Level of mental workloaddecreases, the
desirability of Amount of display cross-checkingdecreases
Classification: Unstable
Explanation of Scenarios:a.) Tradeoff: If the PF is constantly cross-checking information between
displays, his/her Level of mental workload will increase simplybecause they are performing more mental tasks. It is important to note

Appendix F
Tradeoff Scenarios (Varying Characteristics)
18
that a high degree of display cross-checking may be desirable eventhough mental workload may increase in these circumstances.
b.) Tradeoff: If the PF is spending little time cross-checking informationbetween displays, his/her Level of mental workload will decreasebecause they are performing fewer mental tasks. Again, this may notbe a desirable situation regardless of the level of mental workload.
c.) Direct Relationship: If the PF currently has a high level of mentalworkload, he/she will have less time to devote to cross-checkinginformation between displays, and may need to devote their attentionto one primary display (such as the SVS)
d.) Direct Relationship: If the PF currently has a low level of mentalworkload because of the terrain situation, weather, confidence, etc.,he/she will have more attention to allocate to cross-checkinginformation between displays.
23.) Level of mental workload/Degree of display clutter/Degree of overlay with PFDdata
Relationship:a.) When the desirability of Level of mental workloadincreases, the
desirability of Degree of display clutter/Degree of overlay with PFD dataincreases
b.) When the desirability of Level of mental workloaddecreases, thedesirability of Degree of display clutter/Degree of overlay with PFD datadecreases
c.) When the desirability of Degree of display clutter/Degree of overlay withPFD dataincreases, the desirability of Level of mental workloadincreases
d.) When the desirability of Degree of display clutter/Degree of overlay withPFD datadecreases, the desirability of Level of mental workloaddecreases
Classification: Direct Relationship
Explanation of Scenarios:a.) Direct Relationship: When the PF is experiencing a low level of
mental workload it is less important that the display maintain a lowdegree of clutter, because he/she presumably has more attention toallocate to the display.
b.) Direct Relationship: When the PF is experiencing a high level ofmental workload is it critical that the display be easy to interpret,which may mean a low degree of display clutter. It is importanthowever, that pertinent information still be readily available, and notburied in the menu structure in an attempt to have an uncluttereddisplay.

Appendix F
Tradeoff Scenarios (Varying Characteristics)
19
c.) Direct Relationship: When display clutter is kept to a minimum, thenmental workload should decrease because the display should be moreintuitive and therefore easier for the pilot to interpret.
d.) Direct Relationship: When there is a high degree of display clutter,mental workload will increases because it will be more difficult for thepilot to quickly obtain needed information from the display. It isimportant to not however that pertinent information not be removedfrom the display in an effort to oversimplify the SVS because this mayresult in a high level of mental workload which is the opposite of whatit is intended to produce.
24.) Degree of display clutter/Degree of overlay with PFD data/Intuitiveness/usability of the SVS
Relationship:a.) When the desirability of Degree of display clutter/Degree of overlay with
PFD dataincreases, the desirability of the Intuitiveness/usability of theSVS increases
b.) When the desirability of Degree of display clutter/Degree of overlay withPFD datadecreases, the desirability of the Intuitiveness/usability of theSVSdecreases
c.) When the desirability of the Intuitiveness/usability of the SVSincreases,the desirability of Degree of display clutter/Degree of overlay with PFDdatadecreases
d.) When the desirability of the Intuitiveness/usability of the SVSdecreases,the desirability of Degree of display clutter/Degree of overlay with PFDdataincreases
Classification: Unstable
Explanation of Scenarios:a.) Direct Relationship: If the SVS is uncluttered (but still displays
pertinent information when needed) and is therefore easy to read andinterpret it will be more intuitive and usable to the PF.
b.) Direct Relationship: If the SVS is extremely cluttered with PFD data,and it is therefore difficult to read and interpret, it will be less intuitiveand usable to the PF.
c.) Tradeoff: If the SVS display is highly intuitive for reasons besides thedegree of display clutter such as coloring, menu structure, etc., then itwill be less critical that the display maintain a low level of clutter.
d.) Tradeoff: If the SVS display is not intuitive to the PF for reasons otherthan the degree of display clutter, then it will be extremely critical theSVS display maintain a low degree of clutter (while still displayingpertinent information) because this measure will help to make thedisplay more intuitive and usable to the pilot.

Appendix G
Tradeoff Scenarios (Non-Varying Characteristics)
1
Explanation: The following characteristics were found to exist in a tradeoff relationshipwith other characteristics. However, these characteristics are unique in that they do not fitthe definition of a characteristic used thus far in this analysis. Until this point, we haveexamined characteristics that vary from a desirable to and undesirable state. However,characteristics such as those listed below were also included in the analysis in order tocover all aspects of the “Machine” category. For example, the characteristic “DisplaySize” may have undesirable and desirable states, but the research provided in this analysisdoes not answer the question “Which display size is most favorable”. Because we cannotexamine a tradeoff relationship containing this characteristic using the previous method,the possible tradeoff relationships containing these characteristics were looked at in amore general sense. It was simply asked, “What problems or tradeoffs, if any, can beexpected when this characteristic of the system is involved?”
Non-Varying Characteristics that were involved in tradeoff relationships include thefollowing:
Auditory vs. visual warningDisplay sizeFOV currently depicted on the SVS displayColor of symbols/textColor of terrainPictorial scene information density
1.) Difficulty of approach/landing/Display size
For this analysis, it was assumed that the SVS may have three possible display sizes (757EADI 5 x 5.25 inch, 777 PFD 6.4 x 6.4 inch, and rectangular flat-panel 8 x 10 inch). It ispossible that the display size chosen could have positive and/or negative consequences,especially because the possible display sizes are of very limited space. Theapproach/landing phase of flight could therefore become more or less difficult for the PFdepending on the SVS display size that is employed. For example, on a very smalldisplay, visual warning text may be too small for the pilot to easily notice, read, andinterpret. Also, terrain detail may be lost in smaller displays, and the FOV choices able tobe selected may be limited.
Despite these concerns, research conducted by Comstock, Glaab, Prinzel, and Elliot(2000) suggests that small display sizes, though not necessarily preferred by pilots, do notappear to produce performance deficits when raw horizontal and vertical guidanceinformation is present. However, there is some evidence from pilot preference data thatvery small display sizes have the effect of making the aircraft appear lower to the groundthan it actually is (Beringer (2000), Williams (2000), Willshire, Latorella & Glaab(2000)). This could be detrimental to the approach/landing phase of flight, and moreresearch needs to be conducted to determine if this is in fact an issue that needs to betaken into account.

Appendix G
Tradeoff Scenarios (Non-Varying Characteristics)
2
2.) Difficulty of approach/landing/Auditory vs. visual warning
It is presumed that the SVS will provide some type of warning when the aircraft is indanger of impacting terrain. This warning has the potential to be auditory, visual, or both.The type of warning presented has the potential to make the approach/landing phase offlight more or less difficult for the pilot depending on the type of warning used and thedegree to which the pilot can easily understand this warning. Typically, auditorywarnings are seen as beneficial because of their omnidirectional format (Wickens, 1998).In other words, they can be heard regardless of what the pilot is doing or where he/she isdirecting their attention. Obviously, a number of factors should be taken into accountwhen deciding which type of warning the SVS should present.
An auditory warning can be used if:• The display is highly cluttered, and the pilot may not see a visual warning• The pilot is experiencing a high level of mental workload• The pilot is not devoting a significant amount of attention to the SVS
• This could result from a lack of trust in the SVS, an inaccurate machine model, avery high or low degree of self-confidence, a high degree of display cross-checking, etc.
• The color used for a visual warning does not have high contrast with the backgroundused in the display
A visual warning can be used if:• The display has a low degree of clutter, and the pilot can easily see a visual warning• The pilot is experiencing a low level of mental workload• There is a high level of noise in the cockpit• The pilot is devoting a significant amount of attention to the SVS• The colors of symbols and text used in the warning have an adequate degree of
contrast with the background colors used in the display• The visual warning is in a prominent place on the display• The text of the warning is easily interpretable, and is large enough to be quickly
noticed• The text conveys to that pilot that there is a serious problem that must be taken
seriously, so the pilot does not ignore the warning
3.) Difficulty of approach/landing/ FOV currently depicted on the SVS display
For the current analysis, it was assumed that FOV was selectable by the pilot from fourpossible choices. The FOV currently displayed during the approach/landing phase offlight has the potential to make the approach/landing more or less difficult for the pilot.Research conducted by Comstock, Glaab, Prinzel, and Elliot (2000) suggests that pilotsprefer having the FOV be selectable, and also prefer to have the FOV larger at higheraltitudes, and smaller as they got closer to the runway in an approach.

Appendix G
Tradeoff Scenarios (Non-Varying Characteristics)
3
This suggests that FOV may have an impact on the difficulty of the approach/landingphase of flight. Further research needs to be conducted to investigate if various FOV’saffect pilot error in this phase of flight. If this is the case, then pilots should be trained onwhat FOV to select for various phases of flight when using the SVS display.
4.) Auditory vs. visual warning/Intuitiveness/usability of the SVS
As mentioned previously, the type of warning presented to the pilot can affect howintuitive or usable the SVS is for that individual. Various types of warnings are preferableunder different circumstances. Auditory displays will be more intuitive if they warning ispresented at the correct decibel level, is presented when there is a low level of noise inthe cockpit, is presented in a clear tone, is presented understandably, and is presented in away that conveys the degree of severity to the pilot. Visual warnings will be moreintuitive if they are presented in large enough text that they can be easily seen by the PF,are presented in a color that contrasts adequately with the background color of thedisplay, are in a prominent place on the display, and if they are presented in a way thatconveys the severity of the present situation.
5.) Color of symbols/text/Color of terrain
This relationship merely suggests that the color of symbols and text should have adequatecontrast with the colors used for the terrain displayed on the SVS display. Thisrelationship is not meant to suggest that certain colors are more appropriate, but that therelationship between various colors used in the display should be taken into account.
6.) Color of symbols/text/Intuitiveness/usability of the SVS
Based on a large body of previous research it is obvious that the type and amount ofcolors used in a display can influence it intuitiveness and usability for the pilot (Christ,1975). There is evidence that the color used for warnings, or for special symbols shouldbe unique to that symbol or text in order to aid in easy identification. Colors for the sameor similar attributes of the display should also remain consistent throughout the system,and the number of colors used should be kept in check, since a large array of colors cancause confusion, and contrast problems between elements.
7.) Color of symbols/text/Pictorial scene information density
This relationship suggests that the colors of symbols and text that will be overlaid on theterrain background should be different and have an adequate degree of contrast with thisbackground. This is not meant to suggest that certain colors are more appropriate orintuitive, but that this relationship should be considered.

Appendix G
Tradeoff Scenarios (Non-Varying Characteristics)
4
8.) Color of terrain/Intuitiveness/usability of the SVSPictorial scene information density/Intuitiveness/usability of the SVS
These two potential tradeoff relationships were grouped because it was determined thatthe characteristics “Color of terrain” and “Pictorial scene information density” producedthe same entries in the matrix, and can therefore be examined together. This is not to saythat the characteristics are the same, but that they affect and are effected by other systemcomponents in similar ways.
The prototypical SVS considered for this analysis was assumed to have three possibletypes of terrain rendering (pictorial scene information density). The SVS may have aphoto-realistic terrain display, a less detailed terrain texture display, or a wire-framerendering of terrain. It was not the aim of this analysis to determine which type ofpictorial scene information density would produce the least amount of error and would bethe most intuitive and usable to the pilot. However, this relationship suggests that the typeof rendering chosen has a great impact on the system and has the potential to influencethe usability of the display. Further research should be conducted in order to determinewhich type of rendering is best for use in the SVS.
9.) Degree of display clutter/Degree of overlay with PFD data/Pictorial scene informationdensity
This potential tradeoff relationship suggests that certain types of pictorial sceneinformation density may allow for more or less overlaid information to be presented onthe SVS. For example, a photo-realistic display may have significantly more graphicsthan a wire-frame rendering. This type of terrain rendering may therefore allow for lessinformation to be overlaid on it, since it may be difficult to easily see that informationbecause of the clutter produced. This should be taken into consideration when choosingthe type of terrain rendering to be used in the SVS. A detailed, visually appealing displaymay not always be the best choice if many symbols, text, PFD data, etc. need to beoverlaid on top of this terrain background.
10.) Display size/FOV currently depicted on the SVS display
This tradeoff relationship represents the possibility that small display sizes may limit theFOV that can be selected by the pilot. Or, if the FOV choices are not limited, there is stillthe possibility that the largest FOV would produce very small graphic representations ona small display. The interaction between these two characteristics needs to be consideredwhen designing the SVS display since both were found to have a significant impact onthe system.
Appendix G
Tradeoff Scenarios (Non-Varying Characteristics)
5
11.) Display size/Intuitiveness/usability of the SVS
Display size has the potential to influence how intuitive or usable the SVS is to the pilot.Small display sizes may have terrain renderings or symbols and text that are perceptuallydifficult to interpret. This can therefore influence the difficulty of the approach/landingfor the pilot. Please see the tradeoff relationship “Difficulty of approach/landing/Displaysize” mentioned above for a more detailed explanation.

Appendix H 1
Error Scenarios:
1. Amount of display cross-checking/Accuracy of the pilots mental model of theenvironment
If the pilot has an inaccurate mental model of the environment surrounding thedestination airport, he/she may waste time cross-checking information thatappears on the SVS display in an attempt to gain a better understanding of his/herenvironment. If the cross-checking between displays becomes excessive, the pilotmay not allocate enough time to the SVS display. This could result in inaccurateunderstanding of the terrain surrounding the destination airport, which could leadto errors. This error would likely be remedied with experience and training, whichwould effect the use of displays and facilitate an accurate mental model of theenvironment.
2. Amount of display cross-checking/Amount of time spent looking out thewindow
The error in this scenario depends on the desired action. If it is desirable to havethe pilot spend time looking out the window (perhaps to gain confidence in theSVS display by cross-checking its accuracy) then an error would occur if the pilotspent an excessive amount of time cross-checking between head-down displays. Ifthere is a high level of mental workload (which is normally the case in theapproach/landing phase of flight) then allocating attention to many displays tocross-check information may not be desirable. If, however, it is desirable to havethe pilot cross-check between displays (most likely in conditions of low mentalworkload, or in order to have the pilot gain trust in the SVS display) thenspending an excessive amount of time looking out the window could result in thistype of error because attention is taken away from the pertinent displays.
3. Amount of display cross-checking/Amount of time spent reading instrumentsother than the SVS
This relationship probably does not represent an error scenario because bothcharacteristics entail the pilot spending time viewing instruments other than theSVS. In this way, the two characteristics are similar, and an error scenario isdifficult to imagine.
4. Amount of display cross-checking/Amount of time spent viewing the SVSdisplay
The error in this pairing in obvious. If it is desirable to have the pilot allocate themajority of his/her attention to the SVS display, the spending time cross-checkingbetween displays would divert the pilots attention from the SVS which couldresult in the pilot having inaccurate or insufficient information about the terrainsurrounding the destination airport. This error will likely be remedied if the pilot

Appendix H 2
has sufficient experience with, and trust in, the SVS display, and is therefore lesslikely to cross-check information.
5. Amount of time spent looking out the window/Accuracy of the pilots mentalmodel of the environment
Because the SVS display would provide a clear picture of the outside environmentregardless of weather conditions, it would be more desirable to have the pilotallocating attention to the SVS display rather than looking out-the-window forthis information. Because of possible adverse weather conditions, the out-the-window view may be very limited and would therefore result in the pilot having aless accurate understanding of the environment surrounding the destinationairport.
6. Amount of time spent looking out-the-window/Amount of time spent readinginstruments other than the SVS
Like previous scenarios, the possible error represented in this pairing depends onthe desired actions, which depends on the current situation. If it is desirable tohave the pilot spend time looking out the window, possible in VFR conditions,then spending an excessive amount of time reading instruments could lead toerrors. However, the reverse situation is more likely considering that SVS willmost likely be implemented in high end businesses and commercial aircraft whichfly in IFR conditions. In this case, it is more desirable to trust ones instrumentsand not the out-the-window view. Therefore, spending time looking out thewindow and not at relevant instruments in order to obtain information wouldresult in an error.
7. Amount of time spent looking out-the-window/Amount of time spent viewingthe SVS display
An obvious error would result in the pilot did not pay attention to the SVSdisplay, and instead relied on out-the-window information. Because of possibleadverse weather conditions, the out-the-window view may not provide clearinformation about the terrain environment surrounding the destination airport,while the SVS display would provide a clear view of terrain regardless of weatherconditions. It is therefore more desirable for the PF to allocate attention to theSVS.
8. Amount of time spent viewing the SVS display/Accuracy of the pilots mentalmodel of the environment
Because the SVS provides a accurate representation of terrain surrounding thedestination airport, it should facilitate an accurate mental model of theenvironment. Therefore, an error would result if the pilot does not trust the SVS

Appendix H 3
and therefore does not rely on it in order to gain an understanding of his/herenvironment.
9. Experience and ability of the pilot/Accuracy of the pilots mental model of theenvironment
For obvious reasons, if the pilot has little experience with the environmentsurrounding the destination airport, his/her mental model of that environment willmost likely be less accurate. However, the SVS display is designed to facilitate anaccurate mental model of the terrain environment, in this way, even a pilot withlittle experience should be able to gain a more accurate understanding of theenvironment.
10. Experience and ability of the pilot/Amount of time spent looking out-the-window
If the pilot has little experience with the SVS display, he/she is more likely toallocate attention to the out-the-window view. Because the SVS is meant toreplace, or at least supplement the out-the-window view, it should provide aclearer picture of the terrain, and is a better source of information. Therefore,excessive time spent looking out-the-window could lead to errors.
11. Experience and ability of the pilot/Amount of time spent reading instrumentsother than the SVS
This scenario is very similar to number eleven (11). If the pilot has little overallexperience or little experience with the SVS display, he/she is more likely tospend an excessive amount of time reading instruments other than the SVS, whenthe SVS is often the better source of information. This is of course dependent onthe type of information that is needed, and the above error would only pertain tosituations in which the relevant information is available on the SVS display.
12. Experience and ability of the pilot/Amount of time spent viewing the SVSdisplay
Pilots who have little experience with the SVS, or little overall experience, aremore likely to spent less time viewing the SVS display, and will therefore rely onit less for information. This is a potential error since the SVS display shouldprovide the clearest picture of the terrain environment. This problem will likely bealleviated if the pilot gains experience with, and trust in, the SVS display.
*Note: The characteristics “Accuracy of GPS” and “Accuracy of terrain database” havebeen combined in the following section. This was done because the characteristicsresulted in the same entries in the matrix, and therefore, for our purposes, they have thesame influence and sensitivity in the system, and can be considered together.

Appendix H 4
13. Accuracy of the GPS/Terrain database/Accuracy of the pilots mental modelof the environment
The error in this pairing is obvious. If the GPS/Terrain database is inaccurate, thepilot’s metal model of the environment will be somewhat inaccurate. Inaccuracyof the GPS/Terrain database will also result in the pilot putting less trust in theSVS and therefore relying on it less.
14. Accuracy of the GPS/Terrain database/Amount of time spent looking out-the-window
If the GPS/Terrain database provides an inaccurate rendering of the terrainenvironment, and the pilot is aware of this because the images of the SVS and theout-the-window view are not aligned, then he/she will ignore the SVS display andwill rely on the out-the-window view for terrain information. This is an errorbecause the SVS is meant to enhance the pilots understanding of the terrainenvironment. The proper functioning of this system is therefore essential.
15. Accuracy of the GPS/Terrain database/Amount of time spent readinginstruments other than the SVS
This error scenario is similar to number fifteen (15). If the GPS/Terrain databaseis inaccurate, and the pilot is aware of this malfunction, then he/she will spendmore time viewing instruments other than the SVS.
16. Accuracy of the GPS/Terrain database/Amount of time spent viewing theSVS display
Again, if the GPS/Terrain database is inaccurate, and the pilot is aware of this,he/she will not allocate attention to the SVS, and will instead obtain neededinformation from other pertinent displays.
17. Glare on the SVS/Accuracy of the pilots mental model of the environment
If the glare on the SVS display is intense enough that the pilot can not accuratelyread information on the display, then the PF will have a less accurate mentalmodel of the environment. In order to correct this error, the SVS display shouldbe sunlight readable and tested in various positions on the cockpit.
18. Glare on the SVS/Amount of time spent looking out-the-window
This pairing represents an obvious error. If there is a intense glare on the SVS andthe pilot is having a difficult time getting information from the display, thenhe/she will allocate his/her attention elsewhere.

Appendix H 5
19. Glare on the SVS/Amount of time spent reading instruments other than theSVS
This pairing is essentially the same as number nineteen (19). If the SVS display isunreadable, the PF will allocate attention to instruments other than the SVS.
20. Glare on the SVS/Amount of time spent viewing the SVS display
Again, if the SVS display is unreadable, the pilot will spend less time viewing it,and will obtain needed information from other instruments.
21. Limitations of the machines processor/Accuracy of the pilots mental model ofthe environment
If the machine’s update rate or processor is slow, the display of current terraininformation will be delayed, and there will be a misalignment between the SVSdisplay and the out-the-window view. This will result in the PF having a lessaccurate mental model of the terrain environment, especially in IFR likeconditions. It is therefore essential that the two images are aligned as closely aspossible. This situation could be further improved by using the proposed FLIRsensor in order to check the accuracy of the GPS and terrain databases.
22. Limitations of the machines processor/Amount of time spent looking out-the-window
If the display of current terrain information is delayed because of processorlimitations, and the images from the SVS display and out-the-widow do not align,then the PF will spend more time looking out-the-window and less time viewingthe SVS display. This is an error because the purpose of the SVS display is toprovide a clearer picture of the terrain environment, and it is therefore undesirableto have the pilot gain this information from the out-the-window view instead. Thisis especially true if weather conditions are making it difficult to clearly viewterrain out-the-window.
23. Limitations of the machines processor/Amount of time spent readinginstruments other than the SVS.
Similar to the scenario in number twenty-three (23), if the images displayed onthe SVS are delayed, the SVS will be less usable, and the PF will most likelyallocate less attention to the SVS display.
24. Limitations of the machines processor/Amount of time spent viewing the SVSdisplay
Appendix H 6
The error here is quite obvious. If the images displayed on the SVS are delayedbecause of processor limitations, the information on the SVS will be less accurateand the PF is more likely to rely less on the SVS display, and therefore spend lesstime viewing it.
25. Pictorial scene information density
*Note: The characteristic “Pictorial scene information density” is paired with thecharacteristics “Accuracy of the pilots mental model of the environment”,“Amount of time spent looking out-the-window”, “Amount of time spent readinginstruments other than the SVS”, and “Amount of time spent viewing the SVSdisplay” in the error scenario matrix. Because this analysis did not attempt todetermine which type of pictorial scene information density (photo-realistic, lessdetailed terrain texture, or a wire-frame) was most desirable, it is difficult todetermine what the affect of each of these types would be on other characteristics.It should simply be taken into account that the type of rendering chosen has thepotential to effect how accuracy of the pilot’s mental model of the environment is,and how much attention the pilot devotes to the SVS display. The specifics ofthese relationships will be able to be determined with current research, which isattempting to determine the advantages and disadvantages of the variousdepictions.

Appendix H
Rec
eiver
sA
ccur
acy
ofpi
lots
men
tal m
odel
ofth
een
viro
nmen
t
Am
ount
oftim
esp
ent l
ooki
ngou
t-the
-win
dow
Am
ount
oftim
esp
ent r
eadi
ngin
stru
men
tsot
her t
han
SVS
Am
ount
oftim
esp
ent v
iew
ing
the
SVS
disp
lay
DriversAmount of display cross-checking 1 1 1 1
Amount of time spent looking out-the-window 1 1 1
Amount of time spent viewing the SVS display 1 1 1
Experience and ability of the pilot 1 1 1 1
Accuracy of GPS 1 1 1 1
Accuracy of terrain database 1 1 1 1
Glare on SVS 1 1 1 1
Limitations of the machines processor 1 1 1 1
Pictorial scene information density 1 1 1 1
SVS Error Matrix