Function and service pattern analysis for facilitating the reconfiguration of collaboration systems
7
Function and service pattern analysis for facilitating the reconfiguration of collaboration systems Sangil Lee a , Kwangyeol Ryu a,⇑ , Moonsoo Shin b , Gyu-Sung Cho c a Department of Industrial Engineering, Pusan National University, San30, Jangjeon-dong, Geumjeong-gu, Busan 690-735, Republic of Korea b Department of Industrial and Management Engineering, Hanbat National University, San 16-1, Duckmyoung-dong, Yuseong-gu, Daejeon 305-719, Republic of Korea c Department of Port Logistics System, Tongmyong University, 428 Sinseon-ro, Nam-gu, Busan 608-711, Republic of Korea article info Article history: Available online 7 December 2011 Keywords: Reconfiguration Data mining Pattern analysis Collaboration system abstract Recently, manufacturing companies have been attempting to increase competitiveness in their business collaboration with cooperative companies rather than within their own companies. In order to facilitate their collaboration, they are attempting to adopt or already using a collaboration system, which supports a number of functions and services. However, it is very difficult to apply existing systems into other orga- nizations or industrial sections without customization or reconfiguration because functional or service requirements of users usually differ according to their domain knowledge. In order to re-apply and dis- seminate an existing system to other companies, therefore, the system must be reconfigured by modify- ing, upgrading, or newly developing some portions of the system. During the customization processes, functions or services of the system must be refined in order to satisfy user requirements. For facilitating the reconfiguration of collaboration systems, in this paper, we first define user patterns, and subsequently propose a method for investigating and analyzing patterns based on data mining approach. The proposed method validates normal versus abnormal patterns that show a drastic increase in the use of a specific function or service, and automatically makes the system recognize abnormal patterns as new normal pat- terns when abnormal patterns continue for a long time. We conduct experiments and comparison studies using an Apriori-like approach in order to establish the effectiveness of the proposed method. We also suggest a guideline for the reconfiguration of function modules or services with a specific collaboration system. Crown Copyright Ó 2011 Published by Elsevier Ltd. All rights reserved. 1. Introduction Nowadays, the rapid change in the business environment re- quires manufacturing companies to constantly innovate. In addition, manufacturing companies are required to increase competitiveness in their collaboration with cooperative partners rather than within their own companies. However, it is not easy for most of small and medium enterprises (SMEs) to systematically cope with such chal- lenges because of a lack of budget and human resources. A government-led project in Korea, referred to as i-Manufactur- ing, has been providing web-based collaboration systems to SMEs since 2004 (Ryu, Lee, & Choi, 2006, 2007). The collaboration systems aim to promote online technological collaboration and support infrastructure for the SMEs. In reality, over 600 manufacturing com- panies are now using collaboration systems. The collaboration sys- tems are equipped with a number of functions that are requested by various users. However, the system continues to be function-cen- tric. Although the systems offer a variety of useful functions that effectively meet user requirements, too many functions may con- fuse the users and inconvenience them. Thus, the systems are required to provide customized services according to users. In other words, the systems must be trans- formed into service-centric systems, which effectively organize various functions into specific services. Then, when a new user (i.e., a new company) collaborates with other users using the sys- tem, specific services are reconfigured in order to meet the require- ments of the new user; in other words, some functions of the system are modified, upgraded, or newly developed. This paper proposes a reconfiguration methodology for the col- laboration systems in order to enable them to meet newly extracted usage patterns, which represent new user requirements or environ- mental changes. In particular, we introduce an analysis technique in order to investigate and analyze the usage patterns based on data mining. The concept of the analysis technique is based on the anomaly pattern mining, but calculation method is similar to that of frequent pattern mining. Two kinds of pattern mining methods are described in Section 2. By using the analysis technique, an abnormal pattern (e.g., drastic increase in the usage of specific func- tions that are not yet organized into a relevant service) is extracted, 0360-8352/$ - see front matter Crown Copyright Ó 2011 Published by Elsevier Ltd. All rights reserved. doi:10.1016/j.cie.2011.11.034 ⇑ Corresponding author. Tel.: +82 51 510 2473; fax: +82 51 512 7603. E-mail address: [email protected] (K. Ryu). Computers & Industrial Engineering 62 (2012) 794–800 Contents lists available at SciVerse ScienceDirect Computers & Industrial Engineering journal homepage: www.elsevier.com/locate/caie
-
Upload
sangil-lee -
Category
Documents
-
view
212 -
download
0
Transcript of Function and service pattern analysis for facilitating the reconfiguration of collaboration systems

Computers & Industrial Engineering 62 (2012) 794–800
Contents lists available at SciVerse ScienceDirect
Computers & Industrial Engineering
journal homepage: www.elsevier .com/ locate/caie
Function and service pattern analysis for facilitating the reconfigurationof collaboration systems
Sangil Lee a, Kwangyeol Ryu a,⇑, Moonsoo Shin b, Gyu-Sung Cho c
a Department of Industrial Engineering, Pusan National University, San30, Jangjeon-dong, Geumjeong-gu, Busan 690-735, Republic of Koreab Department of Industrial and Management Engineering, Hanbat National University, San 16-1, Duckmyoung-dong, Yuseong-gu, Daejeon 305-719, Republic of Koreac Department of Port Logistics System, Tongmyong University, 428 Sinseon-ro, Nam-gu, Busan 608-711, Republic of Korea
a r t i c l e i n f o
Article history:Available online 7 December 2011
Keywords:ReconfigurationData miningPattern analysisCollaboration system
0360-8352/$ - see front matter Crown Copyright � 2doi:10.1016/j.cie.2011.11.034
⇑ Corresponding author. Tel.: +82 51 510 2473; faxE-mail address: [email protected] (K. Ryu).
a b s t r a c t
Recently, manufacturing companies have been attempting to increase competitiveness in their businesscollaboration with cooperative companies rather than within their own companies. In order to facilitatetheir collaboration, they are attempting to adopt or already using a collaboration system, which supportsa number of functions and services. However, it is very difficult to apply existing systems into other orga-nizations or industrial sections without customization or reconfiguration because functional or servicerequirements of users usually differ according to their domain knowledge. In order to re-apply and dis-seminate an existing system to other companies, therefore, the system must be reconfigured by modify-ing, upgrading, or newly developing some portions of the system. During the customization processes,functions or services of the system must be refined in order to satisfy user requirements. For facilitatingthe reconfiguration of collaboration systems, in this paper, we first define user patterns, and subsequentlypropose a method for investigating and analyzing patterns based on data mining approach. The proposedmethod validates normal versus abnormal patterns that show a drastic increase in the use of a specificfunction or service, and automatically makes the system recognize abnormal patterns as new normal pat-terns when abnormal patterns continue for a long time. We conduct experiments and comparison studiesusing an Apriori-like approach in order to establish the effectiveness of the proposed method. We alsosuggest a guideline for the reconfiguration of function modules or services with a specific collaborationsystem.
Crown Copyright � 2011 Published by Elsevier Ltd. All rights reserved.
1. Introduction
Nowadays, the rapid change in the business environment re-quires manufacturing companies to constantly innovate. In addition,manufacturing companies are required to increase competitivenessin their collaboration with cooperative partners rather than withintheir own companies. However, it is not easy for most of small andmedium enterprises (SMEs) to systematically cope with such chal-lenges because of a lack of budget and human resources.
A government-led project in Korea, referred to as i-Manufactur-ing, has been providing web-based collaboration systems to SMEssince 2004 (Ryu, Lee, & Choi, 2006, 2007). The collaboration systemsaim to promote online technological collaboration and supportinfrastructure for the SMEs. In reality, over 600 manufacturing com-panies are now using collaboration systems. The collaboration sys-tems are equipped with a number of functions that are requested byvarious users. However, the system continues to be function-cen-tric. Although the systems offer a variety of useful functions that
011 Published by Elsevier Ltd. All r
: +82 51 512 7603.
effectively meet user requirements, too many functions may con-fuse the users and inconvenience them.
Thus, the systems are required to provide customized servicesaccording to users. In other words, the systems must be trans-formed into service-centric systems, which effectively organizevarious functions into specific services. Then, when a new user(i.e., a new company) collaborates with other users using the sys-tem, specific services are reconfigured in order to meet the require-ments of the new user; in other words, some functions of thesystem are modified, upgraded, or newly developed.
This paper proposes a reconfiguration methodology for the col-laboration systems in order to enable them to meet newly extractedusage patterns, which represent new user requirements or environ-mental changes. In particular, we introduce an analysis techniquein order to investigate and analyze the usage patterns based on datamining. The concept of the analysis technique is based on theanomaly pattern mining, but calculation method is similar to thatof frequent pattern mining. Two kinds of pattern mining methodsare described in Section 2. By using the analysis technique, anabnormal pattern (e.g., drastic increase in the usage of specific func-tions that are not yet organized into a relevant service) is extracted,
ights reserved.

S. Lee et al. / Computers & Industrial Engineering 62 (2012) 794–800 795
and it is automatically recognized as a new normal pattern whenthe abnormal pattern continues for a long period of time. Subse-quently, a new service is organized or an existing service is re-orga-nized in order to conform to the new normal pattern. We alsosuggest a reconfiguration guideline for reorganizing function mod-ules and services in a specific collaboration system, considering thefrequencies as well as collaborativeness of functions. The proposedmethod will facilitate reconfiguration of collaboration systemswhile improving user convenience. The guideline for reconfigura-tion proposed in this paper will also contribute to the evolution ofcollaboration systems.
The remainder of this paper is organized as follows: Section 2discusses studies associated with pattern mining. Section 3 focuseson the details of the proposed analysis technique. Section 4 pre-sents the results of the experiment. Section 5 describes a reconfig-uration guideline and Section 6 concludes the paper.
2. Related works
2.1. Anomaly pattern mining
Pattern mining is a data mining technique that involves identi-fying a pattern, so-called association rule, in a given data set (Zhao& Bhowmick, 2003). A model detecting abnormal patterns is re-quired to identify an anomaly through the change in user patterns.If a model has considerable historical data, the outcome of themodel becomes accurate. Therefore, the model has to use historicaldata and infer the result in advance (Javitz & Valdes, 1994). Gener-ally, the model that detects an anomaly uses its own historical dataor given data (Lee, Stolfo, & Mok, 1999). Nowadays, subjects suchas information in data packets or network-based models fordetecting and monitoring abnormality are being researched (Lee,Cho, & Kim, 2008). The data mining approach has been used foracquiring and refining data from web environments (Li, 2002;Lee & Yen, 2008). Some researchers have used genetic algorithmsfor attempting to resolve reconfiguration problems in the indus-trial automation field (Brennan et al., 2008; Astarloa et al., 2007;Montana & Hussain, 2004). Park et al. (2010) proposed a newmethod to detect anomaly intrusion on transactional audit logstreams, and Lee et al. (2011) proposed an anomaly detection mod-el framework using K-means and self-organizing map.
In this paper, we propose a generic method for identifyingabnormal patterns in collaboration systems. In order to validatethe effectiveness of this proposed method, a simulation study isperformed, which compares the proposed method with a well-known frequent pattern mining approach termed Apriori-like ap-proach (Agrawal, Imielinski, & Swami, 1993).
Fig. 1. Collaborative workflow between users.
2.2. Frequent pattern mining
Frequent pattern mining implies extracting patterns that havegreater support than a given minimum support threshold, wherethe support of a pattern is the number of times it occurs in the dataset. Agrawal and his colleagues made the first research effort tomine frequent patterns in 1993. Agrawal et al. (1993) proposedthe Apriori algorithm for identifying the association rules amongpatterns. Owing to its great success and widespread usage, manyresearchers have enhanced the algorithm and applied it to variousareas (Chen & Weng, 2008, 2009; Lim & Lee, 2010; Zaki, 2000).Apriori-like methods identify the frequent patterns of length k inthe kth pass by using the set of candidate patterns of lengthk � 1 that have already been generated in the previous pass. How-ever, Apriori-like methods have certain limitations that result fromthe requirement for repeatedly scanning a large number of candi-
date patterns, many of which become infrequent once the databasehas been scanned (Tanbeer, Ahmed, Jeong, & Lee, 2009).
On the other hand, Han, Pei, and Yin (2000) proposed the fre-quent pattern tree (FP-tree) and FP-growth algorithm, whereinthe number of scans is reduced to two and candidate generationis not required. The FP-tree is a highly condensed data structurefor storing databases, and the FP-growth algorithm employs a par-titioning-based method; thus, the efficiency of the FP-growthmethod may be highly impressive owing to the small search space(Li & Deng, 2010). However, since all the conditional pattern basesof the FP-tree need to be examined, the process of recursively con-structing and mining the tree is complex (Woon, Ng, & Lim, 2004).A complicatedly structured FP-tree resulting from heavy transac-tions of a target system limits the applicability of this algorithmto frequent pattern mining. Thus, the FP-tree approach is not suit-able for collaboration systems because the relationships betweenthe data or sets of items in these systems are rather complicated.
3. Detection of abnormal patterns using data mining
3.1. User patterns in collaboration systems
Collaboration systems are designed to enable various users touse various useful functions. However, the functions or servicesutilized by each company vary with the purpose of the systemusage. For example, a company may employ particular functionmodules and services more frequently than other functions andservices, whereas another company may not. Fig. 1 shows theinteraction between cooperative users in collaborative workflows.They help each other synchronously or asynchronously to performcollaborative works. The leadership to perform collaborative pro-cesses can be handed over between users, which is called ‘‘processturnover’’, and sometimes data can be passed in order to trigger theprocess of co-worker. To perform a collaborative work, as shown inFig. 1, functions and services that are normally employed differaccording to the role of users, even though they belong to the samecompany. Furthermore, even when the roles of the users are same,the functions or services used by them may be different if they be-long to different companies. In other words, various user patternsexist in a collaboration system.
A user pattern is represented by the following: (1) what is thetask, (2) who is involved in the collaboration, and (3) how fre-quently the pattern occurs. Unfortunately, it is difficult to obtaininformation regarding all the user patterns. Therefore, assumingthat predefined user patterns are considered normal patterns, this

796 S. Lee et al. / Computers & Industrial Engineering 62 (2012) 794–800
paper identifies a new user-pattern after extracting an abnormalpattern, which is not defined as a normal pattern, but shows highfrequency and collaborativeness levels. In this manner, user-pat-terns are incrementally defined, and the user-patterns classifiedas normal patterns are represented as a collaborative process. Sub-sequently, the relevant function modules and services are auto-matically reconfigured. Fig. 2 indicates an illustrative model ofcollaborative processes, which adopts a collaborative process mod-eling (CPM) method (Ryu & Yucesan, 2007). In reality, the collabo-ration systems developed by the i-Manufacturing project employsuch a modeling method.
3.2. Variables for pattern analysis
We are required to define the following sets of variables in or-der to analyze user patterns: (1) frequency (f), (2) level of collabo-ration (l) and (3) time slot (t). When a company contracts withother companies for working collaboratively, the frequencies ofusing some functions (e.g., online conference, document inter-change, etc.) will increase. Thus, collaboration-related functionmodules are utilized for determining the number of times thesefunctions are used. We define this with a variable f 2 F as follows:
F is a set of the frequency of using each function module duringa certain period.
F ¼ ffiji ¼ 1;2;3; . . . ;ng; n P 1 ð1Þ
where i = index of function, fi = frequency of using function i.Subsequently, we are required to determine whether a function
is related to collaborative works or not. We classify the collabora-tiveness of each function, which is represented by a variable l 2 L,into five levels as follows:
L is a set of the collaborativeness level of each function. A biggervalue of li implies that function i is a more collaborative function.
L ¼ ½li 2 f1;2;3;4;5gji ¼ 1;2; . . . ; n� ð2Þ
where li = collaborativeness level of function i.We are also required to measure f during a certain period. Thus,
we define each measurable time slot with variable t 2 T in the fol-lowing manner:
Fig. 2. Illustrative
T is a set of measureable time slots. We may set the unit of timeslots for 1 day in the following manner:
T ¼ ftdjd ¼ 1;2;3; . . . ;Dg; D P 1 ð3Þ
where td = time slot for the dth day.Finally, we need to determine the limit values for the aforemen-
tioned variables including f, l, and C. The value of C will be ex-plained in the following sub-section. In order to simplify ourmodel and computation, we define and use one limit value eachfor f, l, and C. The detected variable is compared with a limit value,that is, f is compared with xf, l with xl, and C with xc, in order toidentify abnormal user patterns. The limit values of variables f, l,and C are defined with X in the following manner:
_X is a vector including the limit values of three variables f, l, andC.
_X ¼ ½xf ; xl; xc� ð4Þ
where xf = the limit value of variable f 2 F, xl = the limit value of var-iable l 2 L, xc = the limit value of variable C.
3.3. Analysis technique and abnormal patterns
Based on the information regarding the variables defined by us,we use the data mining technique in order to detect and analyzeabnormal user patterns that may emerge while using functionsin the system. If the frequencies of using some functions increasedrastically, then the system identifies such a situation as a functionabnormally used by means of detecting rules. It is useful to use thedata mining technique in order to extract a particular pattern fromuser patterns (Liao & Triantaphyllou, 2007). Most of the data min-ing methods establish marginal values and compare them with tar-get values. In this research, the target values indicate the values ofvariables with respect to individual function modules. This ap-proach is suitable for detecting abnormal patterns because it isexcellent in extracting information among user patterns (Park &Ryou, 2003). The procedure of detecting abnormal user patternsusing _X is as follows. Note that a set of functions abnormally usedis defined as FA1.
CPM model.

Table 1Randomly generated frequency lev-els of a company.
fi Number of fi
0 91 92 73 114 95 136 117 188 13
Total 100
Table 2Randomly generated collaborative-ness levels of a company.
li Number of li
1 232 123 214 235 21
Total 100
S. Lee et al. / Computers & Industrial Engineering 62 (2012) 794–800 797
Initially, we have to collect data regarding the frequencies of allfunction modules in a company. Subsequently, we compare col-lected data with the variable F. If there exists fi in F that is greaterthan or equal to the limit value for F, that is, xf, during the time per-iod td, then the system will detect fi and classify it into FA1.
if f i P xf ;during td;
then f i is classified into FA1ð5Þ
Following this, we evaluate the collaborativeness of all func-tions in FA1. Here, FA1 can be defined as shown in Eq. (6), and thevalue y denotes the index of the detected function.
FA1 ¼ fyjjfy P xf ; j ¼ 1;2; . . . ; Jg ð6Þ
If the value of collaborativeness of a function (lyj) is greater than
or equal to the predefined marginal value for L (i.e., xl), then thesystem will classify the function into FA2, as described in Eq. (7).Here, among the functions in FA1, FA2 indicates a set of functionswith higher collaborativeness values than xl. FA2 can be definedas shown in Eq. (8), and the value z denotes the index of the func-tion classified into FA2.
if lyjP xl;during td;
then f yjis classified into FA2
ð7Þ
FA2 ¼ fzkjlz P xl; k ¼ 1;2; . . . ;Kg ð8Þ
If there is any zk for all k, then we proceed to the next step toconclude that it is an abnormal user pattern. If not, then we cannotidentify any abnormal patterns during the period of td; therefore,we proceed to the next day (i.e., td+1).
In case K is not zero, we calculate C, which indicates the utiliza-tion of collaborative functions. The value of C may be calculatedusing Eq. (9).
C ¼PK
k¼1fzkPNi¼1fi
� 100 ð9Þ
In order to decide an abnormal user pattern, we compare thevalue of C with its predefined marginal value, xc. The reason to cal-culate the coefficient of utilization C is that if the value of C is toolow, then it is difficult to decide a new type one. In other words, if acompany rarely uses the collaboration system, a reconfigurationservice will not be provided. For example, if a company uses thecollaboration system once a month, then we are uncertain whetherthe reconfiguration service is necessary or not. In this case, a recon-figuration service will not be provided in order to reduce the loadon the system. If the value of C is greater than xc, the current statusof using functions in K is considered to be abnormal. If not, the cur-rent status appears to be normal. Therefore, the system finallydetermines the current status to be either a normal or abnormaluser pattern, and subsequently, reconfigures functions relevant tothe abnormal patterns into a new service.
if C P xc during td;
then the current status is abnormalð10Þ
4. Experimental study
4.1. Experimental setup
In order to validate the proposed method, we conducted asimulation study, assuming 10 randomly generated companiesand 100 randomly generated functions. Each function has arandom value between 0 and 8 as its frequency level, as shownin Table 1, and another random value between 1 and 5 as its collab-orativeness level, as indicated in Table 2. In order to ensure a
simple computation, we considered a time slot of only one period,that is, d = 1. Using the experimental data set, the proposed ap-proach was compared with a frequent pattern mining approach.
4.2. Abnormal pattern detecting
The proposed approach detects abnormal patterns. For experi-mentation, xf is assumed to be 6, which is the third quartile ofthe frequency levels. Setting a discriminant value with the thirdquartile of the maximum frequency appears to be reasonable.However, when the total number of functions classified into FA1
exceed a quarter of the total number of functions in our experi-mentation (i.e., 25), then xf is autonomously updated by adding1, except that the initial value of xf has the maximum value. Forexample, if the system classifies more than 25 functions into FA1
with an initial xf of 6, then xf is autonomously updated to 7. Onthe other hand, the value of xl is assumed to be 3 because it isthe median of the collaborativeness level. The value of xc is reason-ably assumed to be 30%. All algorithms were coded in java.
In order to detect abnormal user patterns, we analyze user pat-terns belonging to individual companies, following the threephases illustrated in Fig. 3. Table 3 summarizes the results of phaseI. As shown in the table, a total of 31 functions are classified intoFA1. Thus, the value of xf is required to be updated from 6 (initialvalue) to 7. Note that according to Table 3, the minimum valueof lj is 7.
In phase II, the system compares lj in Table 3 with xl, and subse-quently, extracts functions with higher collaborativeness levels. InPhase III, the system computes the utilization of collaborative func-tions and compares it with xc. Table 4 shows the results of the cal-culations in phases II and III.
As a result, a total of 22 functions are classified into FA2, and thefinal utilization of functions in FA2 is 35.98%. In other words, a com-pany frequently uses the 22 functions for collaboration during aparticular period of time. Since xc was set at 30%, it can be deter-mined that the user patterns in the company are abnormal. Basedon this conclusion, the system classifies the 22 functions into sev-eral groups, and reconfigures them as new services for the com-pany. However, not all the companies have abnormal patterns.

Fig. 3. Sequence diagram for detecting user patterns.
Table 3Results of phase I.
j yj lj
1 6 82 12 83 13 8
..
. ... ..
.
29 94 730 98 731 100 7
Table 4Results of phases II and III.
k zk C
1 6 35.98%2 123 18
..
. ...
21 9822 100
798 S. Lee et al. / Computers & Industrial Engineering 62 (2012) 794–800
According to the experimental result and as shown in Table 5, only5 companies have some abnormal patterns.
4.3. Frequent pattern mining
As previously mentioned, we adopted an Apriori-like approachfor comparative study. Lower and upper bounds for minimum sup-port are set to 10% and 100%, respectively. The number of extractedassociation rules is 25, and the aimed confidence level is 95%. Inthis paper, we employed Weka 3.6.4 as a data mining tool, whichhas been developed by the University of Waikato; Weka 3.6.4 isa popular suite of machine learning (Weka, 2011). Fig. 4 showsthe initial condition of the experiment.
As a result, initially, 22 functions were detected as frequentpatterns. Subsequently, once the functions with collaborativenesslevels of less than 3 were eliminated, only 13 functions were left.
However, the experimental result was concluded without distin-guishing users or companies. Generally, frequent pattern miningdepends on historical data. If historical data (i.e., a set of items)is not sufficient, the experimental result lacks credibility. Occasion-ally, the frequent pattern mining results show all the patternsincluding patterns that have been used only once.
4.4. Comparison of the proposed method with frequent pattern mining
Table 6 summarizes the experimental results of the two ap-proaches. As mentioned before, the abnormal pattern detecting ap-proach proposed by this paper proposes the reconfiguration offunctions only to five companies, whereas the frequent patternmining approach suggests the reconfiguration of commonly fre-quent functions to every 10 company. Since each company usesdistinct functions from others according to its own workflow, acommon recommendation from the frequent pattern mining ap-proach is not suitable for the reconfiguration of the collaborationsystem.
On the other hand, the proposed approach enables the collabo-ration system to consider distinct workflows of individual users orcompanies in the process of reconfiguration. The frequent patternmining approach obviously recommends the reconfiguration basedonly on the frequency of used functions. However, the frequentpattern mining approach also recommends the reconfiguration offunctions with low collaborativeness level. For example, a user fre-quently uses e-mail and a document management function.Although the frequency of utilizing these functions is high, theircollaborativeness level may be low. In this case, these functionsdo not need to be reconfigured. As described in Table 6, the num-bers of functions or services to be reconfigured are 22 and 13 underthe frequent pattern mining approach without and with consider-ation of collaborativeness, respectively. The gap between them(i.e., 9) is larger than that of the proposed method (averagegap = 7.6), and this indicates that the frequent pattern mining ap-proach recommends more functions with low collaborativeness le-vel. This also shows that the proposed approach can find the rightfunctions to support collaboration. The purpose of the proposedapproach is to extract the functions associated with collaborativetasks and to reconfigure appropriate services for system users.Thus, the proposed approach is more efficient in providing custom-ized services to various users.
5. Guideline for reconfiguration
The collaboration systems that have been investigated in thispaper are based on function-centric architecture. Function-centricsystems have many advantages, which are listed as follows: (1)they support a number of functions, (2) it is easy to instinctivelyunderstand the composition of their menus, and (3) it is easy to de-velop or modify them. Even though the customization of a func-tion-centric system involves significant costs including humanresources and time, the system must continuously be reconfiguredaccording to the changes in environmental requests. In order to
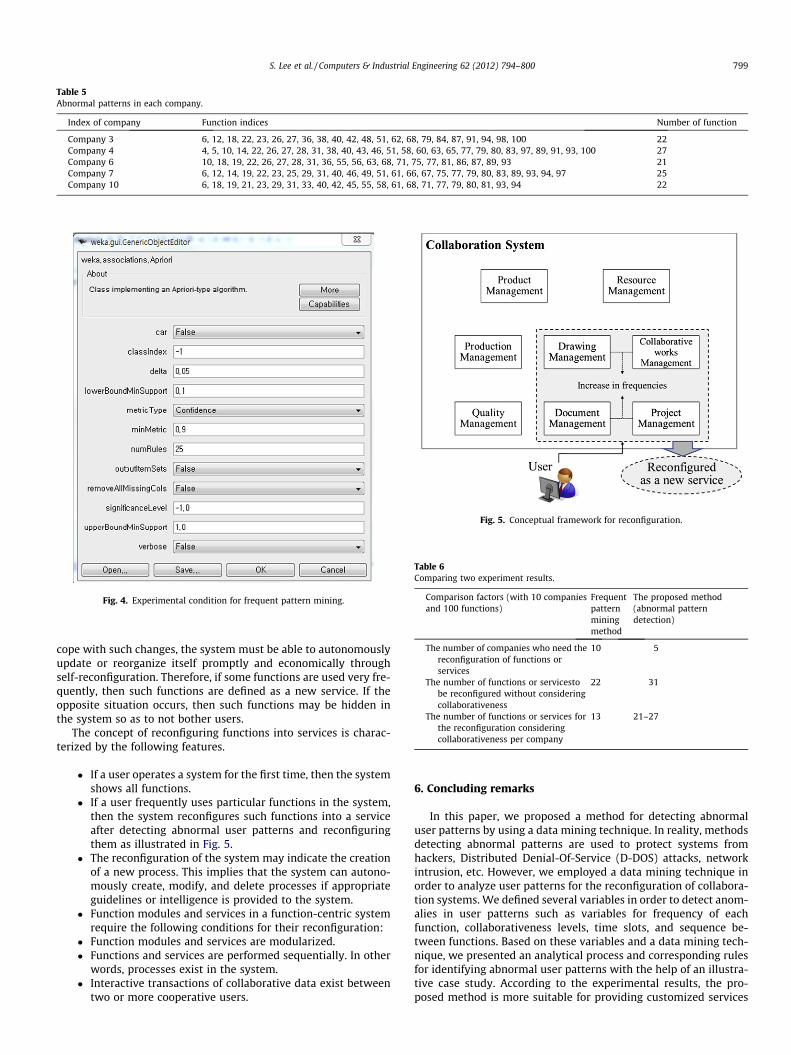
Table 5Abnormal patterns in each company.
Index of company Function indices Number of function
Company 3 6, 12, 18, 22, 23, 26, 27, 36, 38, 40, 42, 48, 51, 62, 68, 79, 84, 87, 91, 94, 98, 100 22Company 4 4, 5, 10, 14, 22, 26, 27, 28, 31, 38, 40, 43, 46, 51, 58, 60, 63, 65, 77, 79, 80, 83, 97, 89, 91, 93, 100 27Company 6 10, 18, 19, 22, 26, 27, 28, 31, 36, 55, 56, 63, 68, 71, 75, 77, 81, 86, 87, 89, 93 21Company 7 6, 12, 14, 19, 22, 23, 25, 29, 31, 40, 46, 49, 51, 61, 66, 67, 75, 77, 79, 80, 83, 89, 93, 94, 97 25Company 10 6, 18, 19, 21, 23, 29, 31, 33, 40, 42, 45, 55, 58, 61, 68, 71, 77, 79, 80, 81, 93, 94 22
Fig. 4. Experimental condition for frequent pattern mining.
Fig. 5. Conceptual framework for reconfiguration.
Table 6Comparing two experiment results.
Comparison factors (with 10 companiesand 100 functions)
Frequentpatternminingmethod
The proposed method(abnormal patterndetection)
The number of companies who need thereconfiguration of functions orservices
10 5
The number of functions or servicestobe reconfigured without consideringcollaborativeness
22 31
The number of functions or services forthe reconfiguration consideringcollaborativeness per company
13 21–27
S. Lee et al. / Computers & Industrial Engineering 62 (2012) 794–800 799
cope with such changes, the system must be able to autonomouslyupdate or reorganize itself promptly and economically throughself-reconfiguration. Therefore, if some functions are used very fre-quently, then such functions are defined as a new service. If theopposite situation occurs, then such functions may be hidden inthe system so as to not bother users.
The concept of reconfiguring functions into services is charac-terized by the following features.
� If a user operates a system for the first time, then the systemshows all functions.
� If a user frequently uses particular functions in the system,then the system reconfigures such functions into a serviceafter detecting abnormal user patterns and reconfiguringthem as illustrated in Fig. 5.
� The reconfiguration of the system may indicate the creationof a new process. This implies that the system can autono-mously create, modify, and delete processes if appropriateguidelines or intelligence is provided to the system.
� Function modules and services in a function-centric systemrequire the following conditions for their reconfiguration:
� Function modules and services are modularized.� Functions and services are performed sequentially. In other
words, processes exist in the system.� Interactive transactions of collaborative data exist between
two or more cooperative users.
6. Concluding remarks
In this paper, we proposed a method for detecting abnormaluser patterns by using a data mining technique. In reality, methodsdetecting abnormal patterns are used to protect systems fromhackers, Distributed Denial-Of-Service (D-DOS) attacks, networkintrusion, etc. However, we employed a data mining technique inorder to analyze user patterns for the reconfiguration of collabora-tion systems. We defined several variables in order to detect anom-alies in user patterns such as variables for frequency of eachfunction, collaborativeness levels, time slots, and sequence be-tween functions. Based on these variables and a data mining tech-nique, we presented an analytical process and corresponding rulesfor identifying abnormal user patterns with the help of an illustra-tive case study. According to the experimental results, the pro-posed method is more suitable for providing customized services

800 S. Lee et al. / Computers & Industrial Engineering 62 (2012) 794–800
to various users in collaboration systems than a well-known fre-quent pattern mining or Apriori-like approach. We also suggesteda guideline for the reconfiguration of functional modules into ser-vices in this paper. The proposed method will facilitate theenhancement of the self-reconfigurability of the system; this willenable the system to change its composition of functions and ser-vices autonomously and adaptively.
However, we used artificial data for experimentation becausethe existing systems could not support appropriate data. In orderto apply the proposed method to collaboration systems, futurestudies will need to undertake experimentation with real data. Inaddition, further studies need to be conducted for determiningthe optimal values of xf, xl, and xc. In reality, the marginal valuesfor frequencies and collaborativeness levels are very important fac-tors for identifying abnormal patterns. Moreover, the developmentof a method for supplying intelligence to the system and conduct-ing intensified simulation studies are also subjects for furtherresearch.
Acknowledgements
This research was supported by i-Manufacturing projectsfunded by the Ministry of Knowledge Economy (MKE) and BasicScience Research Program through the National Research Founda-tion of Korea (NRF) funded by the Ministry of Education, Scienceand Technology (2009-0087861). The authors would like to ex-press their gratitude for the support.
References
Agrawal, R., Imielinski, T., & Swami, A. (1993). Mining association rules betweensets of items in large databases. In Proceedings of the ACM SIGMOD internationalconference on management of data (pp. 207–216).
Astarloa, A., Zuloaga, A., Bidarte, U., Martín, J. L., Lázaro, J., & Jiménez, J. (2007).Tornado: A self-reconfiguration control system for core-based multiprocessorCSoPCs. Journal of Systems Architecture, 53(9), 629–643.
Brennan, R. W., Vrba, P., Tichy, P., Zoitl, A., Sünder, C., Strasser, T., et al. (2008).Developments in dynamic and intelligent reconfiguration of industrialautomation. Computers in Industry, 59(6), 533–547.
Chen, Y. L., & Weng, C. H. (2008). Mining association rules from imprecise ordinaldata. Fuzzy Sets and Systems, 159(4), 460–474.
Chen, Y. L., & Weng, C. H. (2009). Mining fuzzy association rules from questionnairedata. Knowledge-Based Systems, 22(1), 46–56.
Han, J., Pei, J., & Yin, Y. (2000). Mining frequent patterns without candidategeneration. In Proceedings of 2000 ACM SIGMOD international conference onmanagement of data (pp. 1–12).
Javitz, H. S., & Valdes, A. (1994). The NIDES Statistical Component Description andJustification. Annual report, SRI International.
Lee, S., Cho, S., & Kim, Y. (2008). The design and implementation of anomaly trafficanalysis system using data mining. International Journal of Fuzzy Logic andIntelligent Systems, 8(4), 316–321.
Lee, S., Kim, G., & Kim, S. (2011). Self-adaptive and dynamic clustering for onlineanomaly detection. Expert Systems with Applications, 38(12), 14891–14898.
Lee, W., Stolfo, S. J., & Mok, K. (1999). Data mining in work flow environments:Experiences in network intrusion detection. In Proceedings of the 1999conference on knowledge discovery and data mining (pp. 114–124).
Lee, Y., & Yen, S. (2008). Incremental and interactive mining of web traversalpatterns. International Journal of Information Sciences, 178(2), 287–306.
Li, S. (2002). Web-aware interoperable data mining system. International Journal ofExpert Systems with Applications, 22(2), 135–146.
Li, X., & Deng, Z. H. (2010). Mining frequent patterns from network flows formonitoring network. Expert Systems with Applications, 37(12), 8850–8860.
Liao, T. W., & Triantaphyllou, E. (2007). Recent advances in data mining of enterprisedata: Algorithms and applications. Series on computers and operations research(vol. 6). World Scientific.
Lim, H. L., & Lee, C. S. (2010). Processing online analytics with classification andassociation rule mining. Knowledge-Based Systems, 23(3), 248–255.
Montana, D., & Hussain, T. (2004). Adaptive reconfiguration of data networks usinggenetic algorithms. International Journal of Applied Soft Computing, 4(4),433–444.
Park, K., & Ryou, H. (2003). Anomaly detection scheme using data mining methods.Journal of Korea Institute of Information Security and Cryptology, 13(2), 99–106.
Park, N., Oh, S., & Lee, W. (2010). Anomaly intrusion detection by clusteringtransactional audit streams in a host computer. Information Sciences, 180(12),2375–2389.
Ryu, K., Lee, S., & Choi, H. (2006). Toward e-manufacturing by integrating on-lineand offline collaboration. In Proceedings of the 36th international conference oncomputers and industrial engineering (pp. 4567–4577).
Ryu, K., Lee, S., & Choi, H. (2007). Strategies based on collaboration formanufacturing innovation in Korea. In Proceedings of the 37th internationalconference on computers and industrial engineering (pp. 954–960).
Ryu, K., & Yucesan, E. (2007). CPM: A collaborative process modeling for cooperativemanufacturers. Advanced Engineering Informatics, 21(2), 231–239.
Tanbeer, S. K., Ahmed, C. F., Jeong, B., & Lee, Y. (2009). Sliding window-basedfrequent pattern mining over data streams. International Journal of InformationSciences, 179(22), 3843–3865.
Weka. <http://www.cs.waikato.ac.nz/ml/weka/> Accessed 20.04.11.Woon, Y. K., Ng, W. K., & Lim, E. P. (2004). A support-ordered trie for fast frequent
pattern discovery. IEEE Transactions on Knowledge and Data Engineering, 16(7),875–879.
Zaki, M. J. (2000). Scalable algorithms for association mining. IEEE Transactions onKnowledge and Data Engineering, 12(3), 372–390.
Zhao, Q., & Bhowmick, S. S. (2003). Sequential pattern mining: A survey, TechnicalReport 2003118, Nanyang Technological University.