Full Year Review For personal use only€¦ · ADVISORY DIVISION • The FY2018 Advisory...
12
Full Year Review TWELVE MONTHS TO 30 JUNE 2018 For personal use only
Transcript of Full Year Review For personal use only€¦ · ADVISORY DIVISION • The FY2018 Advisory...

Full Year ReviewTWELVE MONTHS TO 30 JUNE 2018
For
per
sona
l use
onl
y
2018 FINANCIAL YEAR SUMMARY
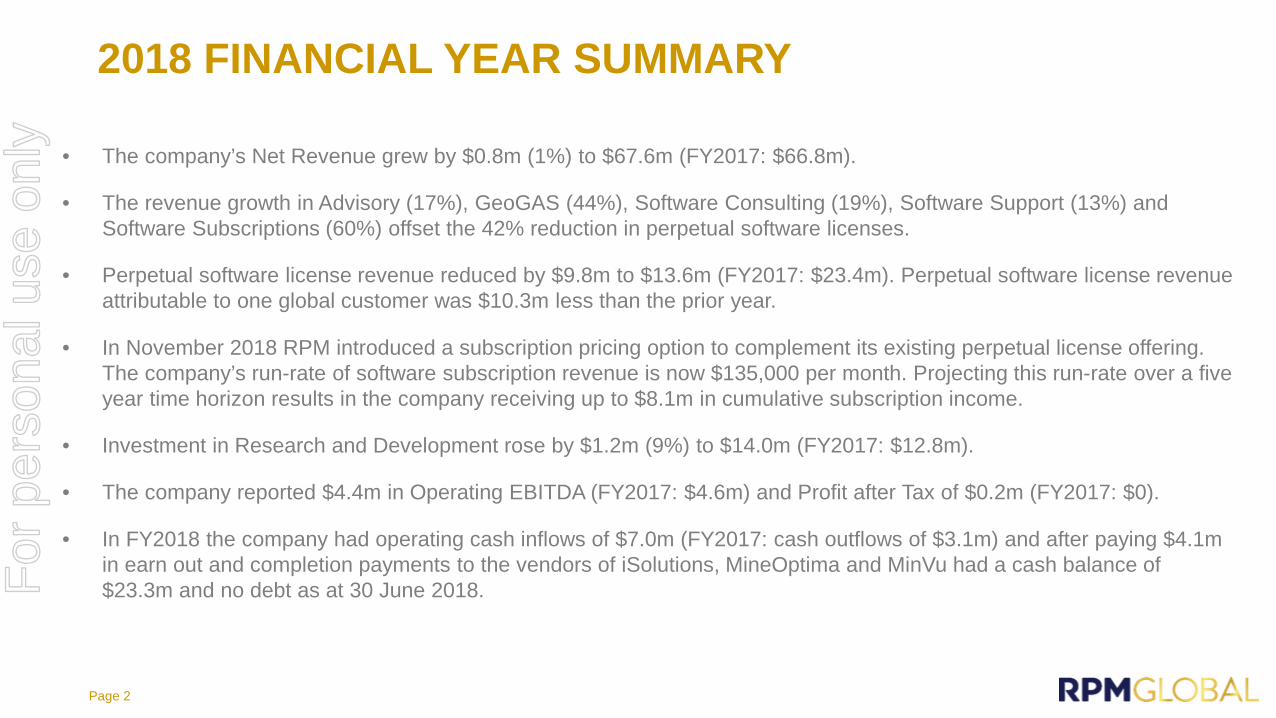
• The company’s Net Revenue grew by $0.8m (1%) to $67.6m (FY2017: $66.8m).
• The revenue growth in Advisory (17%), GeoGAS (44%), Software Consulting (19%), Software Support (13%) and Software Subscriptions (60%) offset the 42% reduction in perpetual software licenses.
• Perpetual software license revenue reduced by $9.8m to $13.6m (FY2017: $23.4m). Perpetual software license revenue attributable to one global customer was $10.3m less than the prior year.
• In November 2018 RPM introduced a subscription pricing option to complement its existing perpetual license offering. The company’s run-rate of software subscription revenue is now $135,000 per month. Projecting this run-rate over a five year time horizon results in the company receiving up to $8.1m in cumulative subscription income.
• Investment in Research and Development rose by $1.2m (9%) to $14.0m (FY2017: $12.8m).
• The company reported $4.4m in Operating EBITDA (FY2017: $4.6m) and Profit after Tax of $0.2m (FY2017: $0).
• In FY2018 the company had operating cash inflows of $7.0m (FY2017: cash outflows of $3.1m) and after paying $4.1m in earn out and completion payments to the vendors of iSolutions, MineOptima and MinVu had a cash balance of $23.3m and no debt as at 30 June 2018.
Page 2
For
per
sona
l use
onl
y
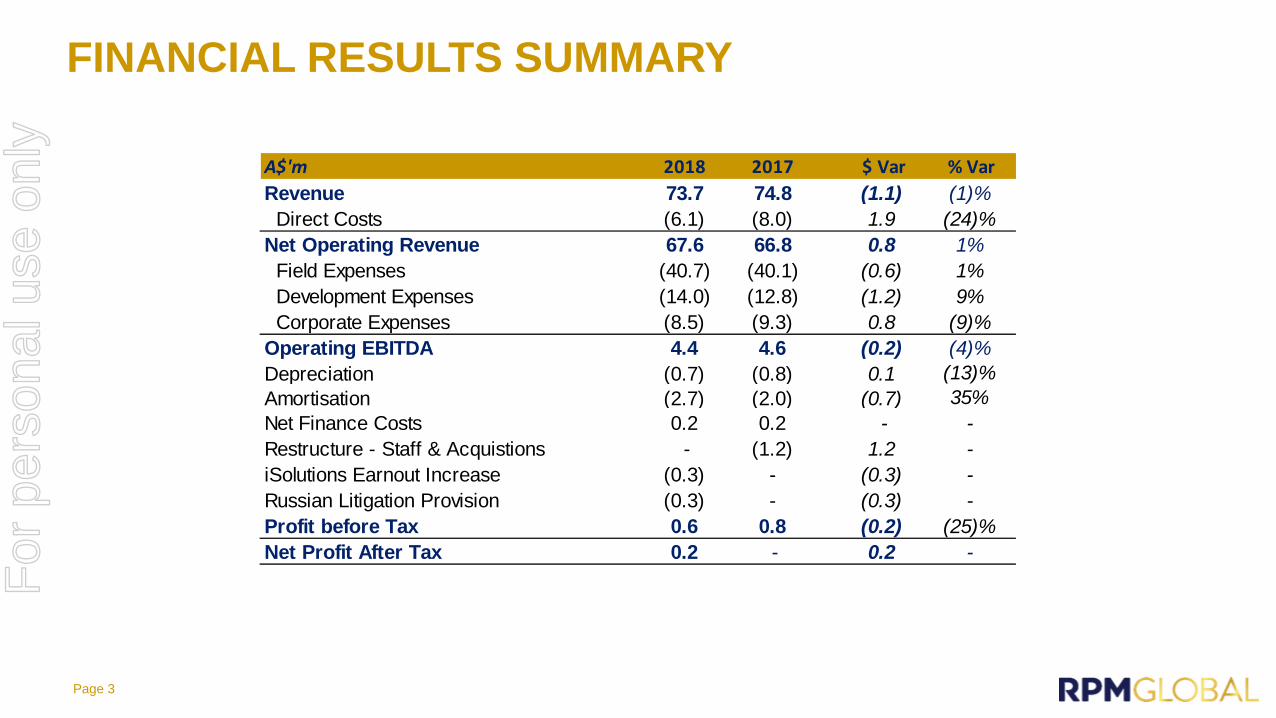
FINANCIAL RESULTS SUMMARY
Page 3
A$'m 2018 2017 $ Var % VarRevenue 73.7 74.8 (1.1) (1)% Direct Costs (6.1) (8.0) 1.9 (24)%Net Operating Revenue 67.6 66.8 0.8 1% Field Expenses (40.7) (40.1) (0.6) 1% Development Expenses (14.0) (12.8) (1.2) 9% Corporate Expenses (8.5) (9.3) 0.8 (9)%Operating EBITDA 4.4 4.6 (0.2) (4)%Depreciation (0.7) (0.8) 0.1 (13)%Amortisation (2.7) (2.0) (0.7) 35%Net Finance Costs 0.2 0.2 - -Restructure - Staff & Acquistions - (1.2) 1.2 -iSolutions Earnout Increase (0.3) - (0.3) -Russian Litigation Provision (0.3) - (0.3) -Profit before Tax 0.6 0.8 (0.2) (25)%Net Profit After Tax 0.2 - 0.2 -
For
per
sona
l use
onl
y
BALANCE SHEET
Page 4
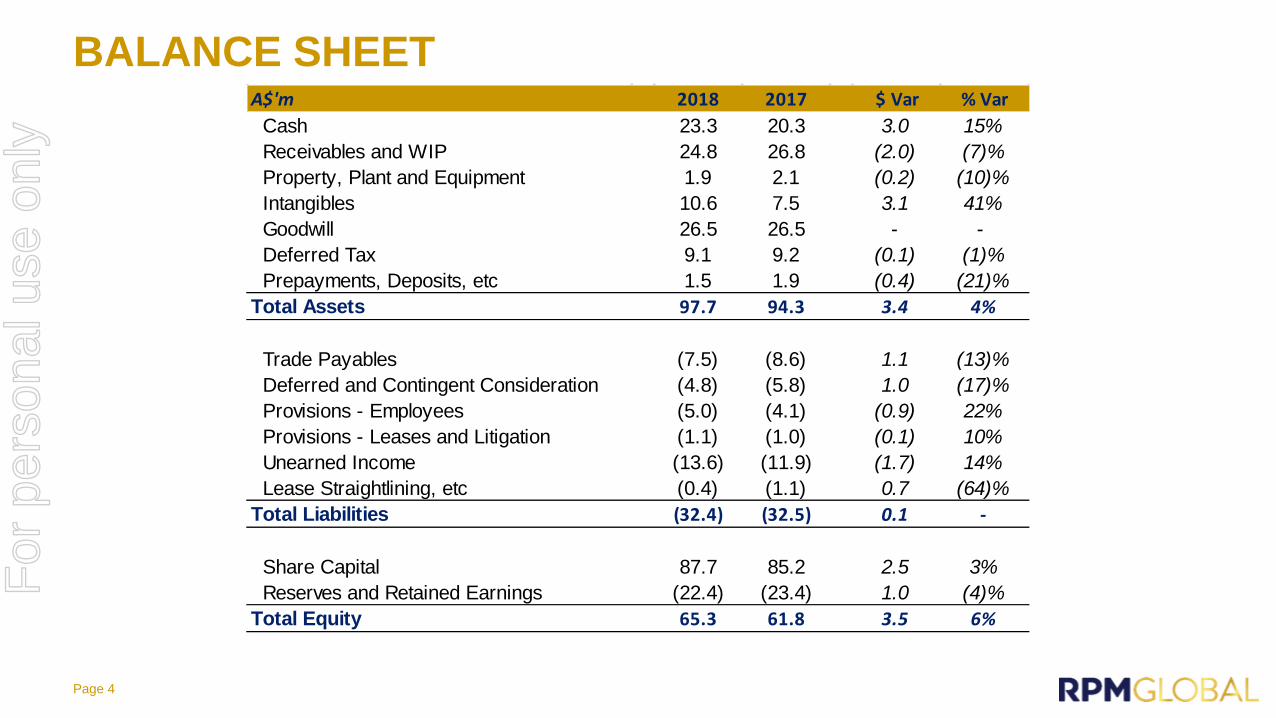
A$'m 2018 2017 $ Var % Var Cash 23.3 20.3 3.0 15% Receivables and WIP 24.8 26.8 (2.0) (7)% Property, Plant and Equipment 1.9 2.1 (0.2) (10)% Intangibles 10.6 7.5 3.1 41% Goodwill 26.5 26.5 - - Deferred Tax 9.1 9.2 (0.1) (1)% Prepayments, Deposits, etc 1.5 1.9 (0.4) (21)%Total Assets 97.7 94.3 3.4 4%
Trade Payables (7.5) (8.6) 1.1 (13)% Deferred and Contingent Consideration (4.8) (5.8) 1.0 (17)% Provisions - Employees (5.0) (4.1) (0.9) 22% Provisions - Leases and Litigation (1.1) (1.0) (0.1) 10% Unearned Income (13.6) (11.9) (1.7) 14% Lease Straightlining, etc (0.4) (1.1) 0.7 (64)%Total Liabilities (32.4) (32.5) 0.1 -
Share Capital 87.7 85.2 2.5 3% Reserves and Retained Earnings (22.4) (23.4) 1.0 (4)%Total Equity 65.3 61.8 3.5 6%
For
per
sona
l use
onl
y

CASH FLOW
Page 5
$'m 2018 2017 $ Var 2016
Net Cash Opening Balance 20.3 18.1 2.2 22.6
Cash from Operations 7.0 (3.1) 10.1 (0.8)
Payments for:Property Plant & Equipment (0.5) (0.6) 0.1 (0.6)Software Acquisitions (4.1) (8.2) 4.1 (0.2)
(4.6) (8.8) 4.2 (0.8)
Proceeds from Exercise of Options, Capital Raising 0.3 14.4 (14.1) -Payments for Share Buyback - - - (2.9)
Net Increase in Cash 2.7 2.5 0.2 (4.5)FX Restatement 0.3 (0.3) 0.6 - Net Cash Closing Balance 23.3 20.3 3.0 18.1
For
per
sona
l use
onl
y

ADVISORY DIVISION
• The FY2018 Advisory Contribution was the highest since FY2014 ($1.4m).
• Average gross utilisation for the team increased by 20% year on year.
• Annual revenue per employee grew by 13% to $288,000.
• The company has continued to hire Advisory professionals to broaden its domain knowledge.
• Remain clear leader in coal advisory with 40% year-on-year growth in metals sales.
Page 6
A$'m 2018 2017 $ Var % Var 2016Advisory Revenue 23.9 20.4 3.5 17% 20.3Direct Expenses (3.8) (4.1) 0.3 (7)% (3.4)Net Revenue 20.1 16.3 3.8 23% 16.9Operating Expenses (17.2) (15.3) (1.9) 12% (16.2)Contribution 2.9 1.0 1.9 190% 0.7
For
per
sona
l use
onl
y
FY18 OPERATIONAL HIGHLIGHTS - SOFTWARE
• In July 2017 RPM released its Underground Metals Solution (UGMS) which filled a significant gap in the company’s product offering. One customer has fully implemented UGMS into four of its underground mines.
• In August 2017 RPM acquired MineOptima, the industry standard software product for designing the optimal equipment access layouts for underground mines. The RPM development team is in the final development cycles of incorporating Stope Optimiser and Decline Optimiser functionality into UGMS which will significantly improve the competitiveness of this solution.
• In January 2018 RPM continued its push into mining shift operations through the acquisition of MinVu.
• In April 2018 the company released its Steeply Dipping Coal Solution (SDCS). RPM has already sold this product into two large mining companies who will each pilot this solution in their operating mines.
• Considerable development time was devoted to the new Underground Coal Solution which RPM expects to release in 2H19.
• The company completed 24 major software upgrades and 51 major functional upgrades during FY18.
Page 7
For
per
sona
l use
onl
y
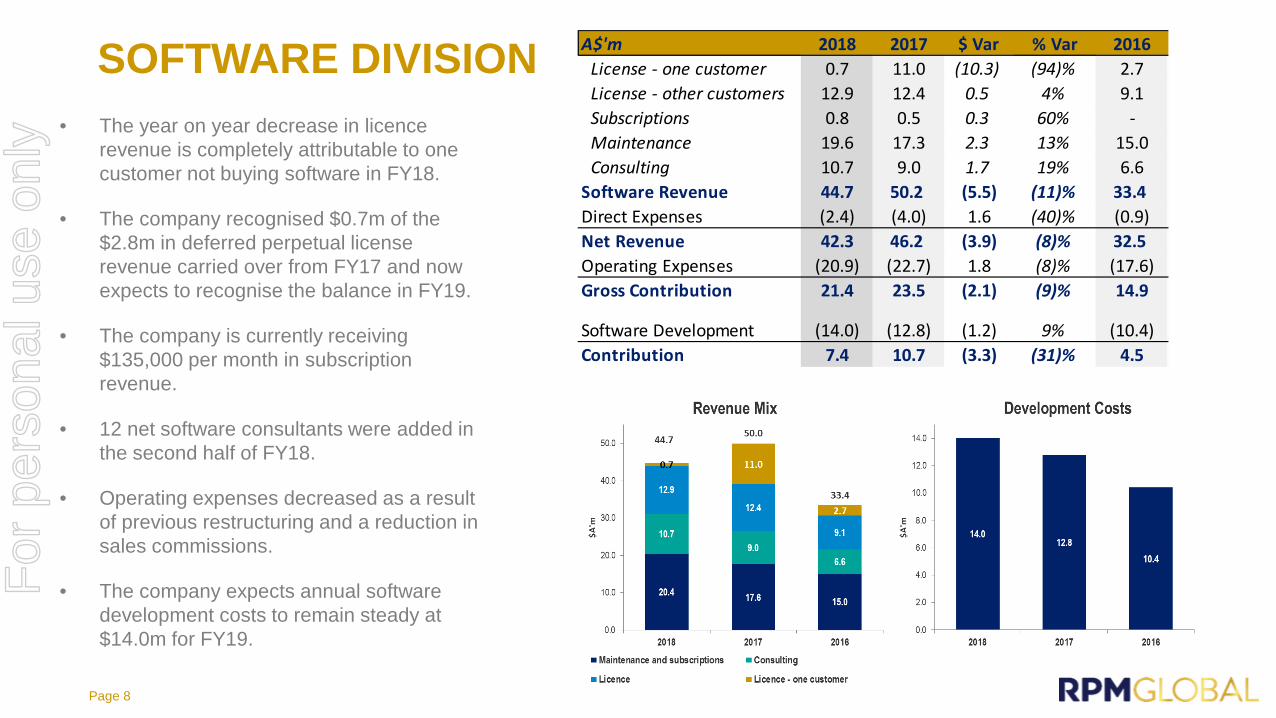
SOFTWARE DIVISION• The year on year decrease in licence
revenue is completely attributable to one customer not buying software in FY18.
• The company recognised $0.7m of the $2.8m in deferred perpetual license revenue carried over from FY17 and now expects to recognise the balance in FY19.
• The company is currently receiving $135,000 per month in subscription revenue.
• 12 net software consultants were added in the second half of FY18.
• Operating expenses decreased as a result of previous restructuring and a reduction in sales commissions.
• The company expects annual software development costs to remain steady at $14.0m for FY19.
Page 8
A$'m 2018 2017 $ Var % Var 2016 License - one customer 0.7 11.0 (10.3) (94)% 2.7 License - other customers 12.9 12.4 0.5 4% 9.1 Subscriptions 0.8 0.5 0.3 60% - Maintenance 19.6 17.3 2.3 13% 15.0 Consulting 10.7 9.0 1.7 19% 6.6Software Revenue 44.7 50.2 (5.5) (11)% 33.4Direct Expenses (2.4) (4.0) 1.6 (40)% (0.9)Net Revenue 42.3 46.2 (3.9) (8)% 32.5Operating Expenses (20.9) (22.7) 1.8 (8)% (17.6)Gross Contribution 21.4 23.5 (2.1) (9)% 14.9
Software Development (14.0) (12.8) (1.2) 9% (10.4)Contribution 7.4 10.7 (3.3) (31)% 4.5
For
per
sona
l use
onl
y

NEW SOFTWARE CUSTOMERS
Page 9
During FY2018 RPM welcomed 25 customers who licensed RPM software for the first time. These customers acquired specific RPM solutions to address their particular business needs.
For
per
sona
l use
onl
y

NEW PRODUCT ADOPTION - FY2018
Page 10
For
per
sona
l use
onl
y

2019 FINANCIAL YEAR OUTLOOK• Sustained positive commodity prices are providing mining companies with confidence to investigate or develop new
sources of resource supply. As a result RPM forecasts its Advisory division to continue to perform strongly during FY19.
• It has become clear that the competitive advantage that RPM’s asset maintenance products (AMT) have in the heavy mobile equipment space can cross-over into other asset intensive industries. This is an area RPM will explore in FY19.
• Mining companies are increasingly wanting to use live data to compare mining equipment performance against shift plans. The combination of MinVu and RPM’s other solutions strategically places the company in a very strong position to address this multi fleet challenge in the near term which in turn is forecasted to result in growth in sales of the MinVu product suite during FY19.
• RPM expects to see a greater percentage of subscription license transactions concluded in FY19 now that the company has a better understanding of the metrics different industry participants want to use.
• RPM’s Board and Management remain excited about RPM’s Software division and in particular the number of new customers (25 in FY18) who have purchased RPM’s products. It is believed that as these customers become more familiar with the breadth and depth of RPM’s software offering and the value that can be extracted from those solutions through enterprise integration they will look to expand their use across all of their operations.
Page 11
For
per
sona
l use
onl
y
The material in this presentation is a summary of the results of RPMGlobal Holdings Limited (RPM) for the full year ending 30 June 2018 including
historical financial information from the prior financial year’s results as announced to the market and an update on RPM’s business and activities
and is current at the date of preparation, 29 August 2018. Events (including changes to any of the data and information that RPM used in
preparing this presentation) may have occurred since that date which may impact on the information contained in this presentation and make them
unreliable. RPM is under no duty to update this presentation though it reserves the right to do so.
Further details are provided in RPM’s Appendix 4E and Annual Report for the full year ended 30 June 2018 released on 30 August 2018.
This presentation provides information in summary form only and is not intended to be complete. It is not intended to be relied upon as advice to
investors or potential investors and does not take into account the investment objectives, financial situation or needs of any particular investor.
No representation, express or implied, is made as to the fairness, accuracy, completeness or correctness of information contained in this
presentation, including the accuracy, likelihood of achievement or reasonableness of any forecasts, prospects, returns or statements in relation to
future matters contained in the presentation (“forward-looking statements”). Such forward-looking statements are by their nature subject to
significant uncertainties and contingencies and are based on a number of estimates and assumptions that are subject to change (and in many
cases are outside the control of RPM and its Directors and Officers) which may cause the actual results or performance of RPM to be materially
different from any future results or performance expressed or implied by such forward-looking statements.
Due care and consideration should be undertaken when considering and analysing RPM’s financial performance. All references to dollars are to
Australian Dollars unless otherwise stated.
To the maximum extent permitted by law, neither RPM nor its related corporations, Directors, Officers, employees or agents, nor any other person,
accepts any liability, including, without limitation, any liability arising from fault or negligence, for any loss arising from the use of this presentation
or its contents or otherwise arising in connection with it. This presentation should be read in conjunction with other publicly available material
including but not limited to RPM’s Appendix 4E and Annual Report for the full year ended 30 June 2018 released on 30 August 2018. Further
information including historical results and a description of the activities of RPM is available on our website, www.rpmglobal.com.
RPMGlobal and the RPM software products and services referenced in this presentation are the registered and unregistered trademarks of
RPMGlobal Holdings Limited. The material in this presentation is the copyright of RPMGlobal Holdings Limited and may not be re-used or relied
upon in whole or in part without the prior written consent of RPM.
For
per
sona
l use
onl
y