Full year results analyst and investor presentation
51
Full year results analyst and investor presentation Tuesday 17 November 2015
Transcript of Full year results analyst and investor presentation

Full year results analyst and investor
presentation
Tuesday 17 November 2015

Introduction
Carolyn McCall
Chief Executive Officer

3 3
Footer box on intersect of lines line h=8.03 9 and v=8.75 with font 10pt Arial not bold
easyJet strategy delivers record results
Profit before tax has increased for the fifth consecutive year
Passengers + 6.0% 69 million
Revenue + 3.5% £4,686m
Profit before tax + 18.1% £686m
PBT margin +1.8ppts 14.6%
EPS + 21.5% 139.1p
Operating cash flow + 12.9% £895m
DPS + 21.6% 55.2p
ROCE + 1.7ppt 22.2%
TSR +28%
3

Financial review
Andrew Findlay
Chief Financial Officer

5 5
Footer box on intersect of lines line h=8.03 9 and v=8.75 with font 10pt Arial not bold
Strong financial performance
5
FY 2015
£ m
FY 2014
£ m
Change
%
Change
% @ CC
Total revenue 4,686 4,527 3.5% 6.5%
Fuel (1,199) (1,251) 4.2% 4.6%
Costs excluding fuel (2,801) (2,695) (3.9%) (8.7%)
Profit before tax 686 581 18.1% 20.2%
Profit before tax margin 14.6% 12.8% 1.8ppt
EBITDAR 940 823 14.1% 16.7%
EBITDAR margin 20.0% 18.2% 1.8ppt
Earnings per share 139.1 114.5 21.5%
Dividend per share 55.2 45.4 21.6%
Return on capital employed 22.2% 20.5% 1.7ppt

6 6
Footer box on intersect of lines line h=8.03 9 and v=8.75 with font 10pt Arial not bold
Profit before tax increased 18%
Profit/(loss) bridge
6
686
12
159
52
600
800
750
700
650
0 FY 2014
698
581
Fuel FY 2015 Other Costs Revenue
(68)
(38)
Crew resilience,
de-icing and disruption
FY 2015 @ CC
686
Fx

7 7
Footer box on intersect of lines line h=8.03 9 and v=8.75 with font 10pt Arial not bold
Revenue performance
7
4.9%
1.5%
7.0%
3.2% 4.7%
-2.8%
4.3%
1.4% 2.9%
3.7%
easyJet capacity growth
RPS growth at constant currency
Q1 Q2 Q3 Q4 FY
£m FY 2015 FY 2014 Change
Passengers (m) 68.6 64.8 6.0%
Load factor (%) 91.5% 90.6% +0.9ppt
Seats flown (m) 75.0 71.5 4.9%
Average sector length (km) 1,118 1,112 0.5%
Total revenue - reported (£m) 4,686 4,527 3.5%
Total revenue - constant currency (£m) 4,821 4,527 6.5%
Total revenue per seat - reported (£) 62.48 63.31 (1.3%)
Total revenue per seat - constant currency (£) 64.28 63.31 1.5%

8 8
Footer box on intersect of lines line h=8.03 9 and v=8.75 with font 10pt Arial not bold
A strong focus on costs
Total cost per seat bridge
0.360.160.12
0.120.250.58
0.130.43
0.38
Fuel
1.53
De-icing and disruption
Regulated airports inflation
FY 2014 FY 2014 engine deal
Net other cost savings
56.50
1.64
Eurocontrol settlement
Before movement in fuel and
FX
56.71
FX A320 mix
53.33
FY 2015 Crew resilience
Load factor
55.19
Before management
action
Other inflation
Management action
External factors
8
• Cost per seat ex-fuel: -0.9%
• Cost per seat ex-fuel @ constant currency: +3.6%

9 9
Footer box on intersect of lines line h=8.03 9 and v=8.75 with font 10pt Arial not bold
Impact of fuel & currency
9
FY 2015 fuel impact favourable / (adverse) FY 2015 FY 2014
Fuel $ per metric tonne
Market rate 619 973
Effective price 872 977
US dollar rate
Market rate 1.54 1.66
Effective price 1.58 1.59
Actual cost of fuel £ per metric tonne 553 614
FY 2015 currency impact favourable / (adverse) EUR CHF USD Other Total
£m
Revenue (131) (1) 4 (7) (135)
Fuel 0 0 (6) 0 (6)
Costs excluding fuel 127 (3) 5 0 129
Total (4) (4) 3 (7) (12)
(1 cent)
61
Change B/(W)
354
105
(12 cents)

10 10
Footer box on intersect of lines line h=8.03 9 and v=8.75 with font 10pt Arial not bold
Strong cash generation underpins dividend policy and fleet growth
10
16621
92
536
9850
138
688
Net cash Sep 2015
435*
Dividend paid
180
FX Other
615
Net cash before
dividend
Restricted cash
Own shares
CAPEX Tax Net working capital
Depn & amort
Operating profit
Net cash Sep 2014
422*
*Includes money market deposits but excludes restricted cash

11 11
Footer box on intersect of lines line h=8.03 9 and v=8.75 with font 10pt Arial not bold
Strong balance sheet
* Other liabilities (excluding debt) includes unearned revenue of £619m (FY 2014 : £572m) .
** Gearing is defined as (debt + 7 x annual lease payments – cash) divided by (shareholders’ equity + debt + 7 x annual lease payments – cash)
11
£m FY 2015 FY 2014
Goodwill and other intangible assets 492 478
Property, plant and equipment 2,877 2,542
Derivative fiancial instruments (297) (21)
Other assets 348 388
Other liabilities (excluding debt) * (1,606) (1,637)
Capital employed 1,814 1,750
Cash and money market deposits 939 985
Debt (504) (563)
Net cash 435 422
Net assets 2,249 2,172
Gearing ** 14% 17%

12 12
Footer box on intersect of lines line h=8.03 9 and v=8.75 with font 10pt Arial not bold
Future capital investment
FY15 FY16 FY17 FY18 2019-2022
Additional aircraft 55% 58% 73% 53% 37%
Replacement aircraft
18% 14% 4% 29% 43%
Maintenance 27% 28% 23% 18% 20%
Total 100% 100% 100% 100% 100%
Total expected fleet acquisition and overhaul expenditure as a % of easyJet revenue
11% 11% 13% 17% 12%
Fleet acquisition and overhauls will be funded through a combination of debt, easyJet’s strong cash flow and sale and leaseback transactions
2015, based on actual revenue for the 2015 Financial Year Future years based on estimated revenue
12

13 13
Footer box on intersect of lines line h=8.03 9 and v=8.75 with font 10pt Arial not bold
Debt repayment profile
13
Total debt: £504 million
0
50
100
150
200
FY20 FY21
£54m
£74m
£46m
FY16 FY18
£60m
FY17
£182m
£88m
FY19

14 14
Footer box on intersect of lines line h=8.03 9 and v=8.75 with font 10pt Arial not bold
Outlook
Capacity (seats flown)
• H1 c.+8.0% (before disruption )
• FY c.+7% (before disruption)
Revenue per seat (constant currency)
• H1: Slight decline (assuming normal levels of disruption and constant load factors)
Cost per seat including Fuel (constant currency)
• FY c.-1% (assuming normal levels of disruption and constant load factors)
Cost per seat ex fuel (constant currency)
• FY c.+2% (assuming normal levels of disruption and constant load factors)
• Weighted towards first half
FX
• H1: c.£15 million adverse movement from foreign exchange rates
• FY: c.£40 million adverse movement from foreign exchange rates
Fuel
• H1: unit fuel costs £75 million to £85 million favourable
• FY: unit fuel costs £140 million to £160 million favourable
Rates at 13 November 2015 £/USD: 1.522; £/EUR: 1.4106 Unit fuel guidance based on Jet fuel trading range of $450 / metric tonne to $550 / metric tonne
14

15 15
Footer box on intersect of lines line h=8.03 9 and v=8.75 with font 10pt Arial not bold
Initial thoughts and areas of focus
15
Initial Thoughts:
• Great people with passion and commitment to the business
• An enviable customer proposition
• A strategy that continues to deliver sustainable shareholder returns
• Significant opportunities for growth
Areas of focus for me:
• Reinforce our cost focus
• Review of capital structure to balance risk and efficiency whilst maximising returns

Business Review
Carolyn McCall
Chief Executive Officer

17 17
Footer box on intersect of lines line h=8.03 9 and v=8.75 with font 10pt Arial not bold
Continuing to win
• easyJet has delivered another record performance in 2015
• Delivering through the cycle – favourable trends will support strong demand for easyJet
• Future growth and returns drivers
• Network offers significant opportunity
• Best customer proposition and sector-leading digital offering
• Operational excellence to deliver stable margins
• Capital discipline and strong financial footing
• Delivering sustainable shareholder returns
17

18 18
Footer box on intersect of lines line h=8.03 9 and v=8.75 with font 10pt Arial not bold
Favourable economic trends
Source: IMF, Euromonitor, Capital IQ, Bloomberg as at 07-Oct-2015
(2.5)
(2.0)
(1.5)
(1.0)
(0.5)
0.0
0.5
1.0
1.5
2.0
2.5
2000A 2002A 2004A 2006A 2008A 2010A 2012A 2014A 2016E
Co
nsu
me
r C
on
fid
en
ce
In
de
x, s
tan
da
rdis
ed
UK France Spain
Italy Switzerland Germany
Positive outlook across key markets Recovery in consumer confidence
2.7
1.2
2.5
0.5
0.8
1.6
2.3
1.5
2.0
1.1 1.2
1.7
2.2
1.7 1.8
1.1
1.5 1.5
UK France Spain Italy Switzerland Germany
Re
al G
DP
Gro
wth
Yo
Y (
%)
2015 2016 2017
Business model outperforms through the cycle
18

19 19
Footer box on intersect of lines line h=8.03 9 and v=8.75 with font 10pt Arial not bold
2015 – outperformance in a competitive market
Market capacity increase/(decrease)
easyJet
Sector RASK growth
FY15 easyJet constant currency RASK vs median Sector RASK, year on year change
19
Market capacity growth (%) % rev. change
Note: RASK at constant currency. Sector median RASK includes IAG, LHA, AF-KLM, Ryanair & Norwegian. Note that Ryanair and Norwegian do not report constant currency, therefore reported data used
-0.8
-6
-4
-2
0
2
4
3.0
3.5
4.0
4.5
5.0
5.5
6.0
Q4
2.4
-1.9
Q3
-3.9 -4.8
Q2
1.8
Q1
3.7
-0.7

20 20
Footer box on intersect of lines line h=8.03 9 and v=8.75 with font 10pt Arial not bold
Exciting initiatives underway
20
Embedded (with more to chase)
Launch in FY2016 Launch in FY2017
Revenue - Business passenger - Base openings (Amsterdam,
Naples)
- Base in Venice - New leading edge website - New call centre online - Flight Club launch
- New base openings - Continue RMS and Network
optimisation development
Cost
- AJW maintenance agreement
- Gatwick long term deal - CFM engine deal
- New crew portal - New components supplier - New maintenance hanger - Gatwick consolidation - ADP passenger charges - 1st 186 seat A320
- 1st A320 NEO delivered
Both - Oporto base opening - Mobile platform
- Rome base closure - Barcelona base opening
- Begin retrofit of extra 6 seats - Leading edge commercial
platform
- Based on easyJet financial year, October to September

21 21
Footer box on intersect of lines line h=8.03 9 and v=8.75 with font 10pt Arial not bold
easyJet operates in the right airports and markets
1) Catchment areas defined as population living within 50km of airports within the market and ranked according to GDP for that area; 2) Rank of short haul capacity for the 12 months to September 2015; 3) Manchester catchment includes Liverpool airport; 4) Dusseldorf catchment includes Cologne, Dortmund, Friedrichshafen, Nuremburg and Paderborn; 5) Zurich catchment includes Basel
21
easyJet network
- Number 1 or 2 position in the primary airport in 12 of Europe’s top 25 catchment areas by GDP1
Best Network

22 22
Footer box on intersect of lines line h=8.03 9 and v=8.75 with font 10pt Arial not bold
LGW GVA MXP LTN SXF CDG AMS BSL BFS BRS
2011 easyJet Capacity 2015 easyJet Capacity
No 1 European network
easyJet No.1
easyJet No.2
Other
% of easyJet capacity currently holding a No.1 , No.2 or other market share position
Airport
Market Share1
Based aircraft
Touching aircraft
LGW 48% 61 61
GVA 40% 14 23
MXP 47% 18 22
LTN 41% 18 18
SXF 58% 9 15
CDG 11% 9 14
AMS 11% 3 14
BSL 54% 9 13
BFS 84% 5 13
EDI 28% 7 11
Positions built over time
No.1 & 2 positions drive returns
easyJet has grown capacity by over 7m seats with a CAGR of c.5% at our top 10 airports over the past 5 years
Strong share at key airports
22
Best Network
+38%
+34% +14%
+16% +23% +4% +32% +68%
+23% +10%
Se
ats
% growth in seats 2011-15
1. easyJet capacity as a % of total short haul capacity at airport
Source: OAG

23 23
Footer box on intersect of lines line h=8.03 9 and v=8.75 with font 10pt Arial not bold
Profitably growing our network
23
easyJet capacity growth
Market capacity growth ROCE
2013 3.3% 1.3% 17.4%
2014 5.1% 4.3% 20.5%
2015 4.9% 5.4% 22.2% Re
turn
s
Routes
CPBH FY13 CPBH FY14 CPBH FY15
12% ROCE
Improving returns in all market conditions
Best Network

24 24
Footer box on intersect of lines line h=8.03 9 and v=8.75 with font 10pt Arial not bold
Progression of returns with increased share over time (base illustration)
Profitably deepening our network
Increasing share drives higher returns1 Adding frequency increases contribution2
Increasing share and frequencies delivers higher returns
24
Best Network
1. Based on performance of 2 easyJet bases through 2015 2. Based on the performance of 2 easyjet routes
-
1,000
2,000
3,000
4,000
5,000
2011 2012 2013 2014 2015
Seat
s [M
illio
ns]
CP
BH
[£
/BH
]
Seats (right axis) CPBH
-
500
1,000
1,500
2,000
2,500
3,000
3,500
4,000
2011 2012 2013 2014 2015
Seat
s [M
illio
ns]
CP
BH
[£
/BH
]
Route A
Route B
CP
BH
(£
/BH
)
Market share (%)
2011
2012
2013
2014
2015

25 25
Footer box on intersect of lines line h=8.03 9 and v=8.75 with font 10pt Arial not bold
We make rational capital allocation decisions
easyJet disciplined allocation of capital delivers higher returns
• 8 Madrid-based aircraft were moved to other bases
• Delivered an incremental network contribution of c.£25m
• We expect a similar outcome from reallocating the aircraft based in Rome FCO
25
8
Madrid Rome
MXP
NAP
Best Network

26 26
Footer box on intersect of lines line h=8.03 9 and v=8.75 with font 10pt Arial not bold
0
50
100
150
200
250
300
350
400
FY20 easyJet
opportunity
Growth opps
Minimum easyJet
fleet
easyJet case FY20
Maximum easyJet
fleet
Invest in existing network
Natural market growth
Route churn
Current easyJet
fleet
2
3
Much more to go for
50-80
35-50 331-396
25-35 10-20
3
241 227
346
Number of aircraft
- Thickening routes - Join the dots
- New bases - New network points - New routes
- As at 30 September 2015
- Forecast passenger growth on easyJet current markets
335
- Expected churn FY15 – FY20
Range of easyJet FY20 fleet size
26
Significant number of low risk opportunities to pursue
Market share
easyJet share
Other airlines (opportunities to grow)
UK
France
Switzerland
Italy
Germany
Netherlands
Portugal
20%
14%
23%
12%
4%
9%
13%
80%
86%
77%
88%
96%
91%
87%
Best Network

27 27
Footer box on intersect of lines line h=8.03 9 and v=8.75 with font 10pt Arial not bold
Utilising flexibility to take market opportunities
27
241
257
280
303
333
346
359 358
312 335
346 347
239
212 227 221
233
294
304 304 311 311
205
230
255
280
305
330
355
2015 2016 2017 2018 2019 2020 2021 2022
Contracted Max
Base Case
Contracted Min
Previous Base Case
Extra aircraft allows for greater flexibility in fleet planning
4.9% 7.1% 8.7% 7.9% 6.3% 7.9% 6.0% 2.5%
4.9% 7.1% 8.7% 7.5% 5.3% 3.1% 2.1% 2.4%
New base case seat capacity
Old base case seat capacity
Best Network

28 28
Footer box on intersect of lines line h=8.03 9 and v=8.75 with font 10pt Arial not bold
65
78 74
77 79
86 83
72
82 79
88 87
92 90
68
75 78 79
84 83
88
30%
40%
50%
60%
70%
80%
90%
100%
2008 2009 2010 2011 2012 2013 2014
16-24 25-34 35-44 All
Favourable easyJet customer trends
Source: BLS, Association of National Advertisers, Barkley, SMG, BCG, Yupe, IPG Media Labs, ONS
Purchased Something on the Internet the last 12 Months, UK
Increasing propensity to spend Customers spending more time online
£0
£50
£100
£150
£200
£250
£300
£0
£5,000
£10,000
£15,000
£20,000
£25,000
18 23 28 33 38 43 48 53 58 63 68 73
Avera
ge b
ookin
g v
alu
e
% C
onsu
mer
Ave s
pend b
y a
ge
Consumer Ave spend
easyJet Ave booking value
eas
yjet
Ave
booki
ng
ag
e 2
010
eas
yjet
Ave
booki
ng
ag
e 2
015
easyJet customers have higher propensity to spend
28
Customer proposition
29 29
Footer box on intersect of lines line h=8.03 9 and v=8.75 with font 10pt Arial not bold
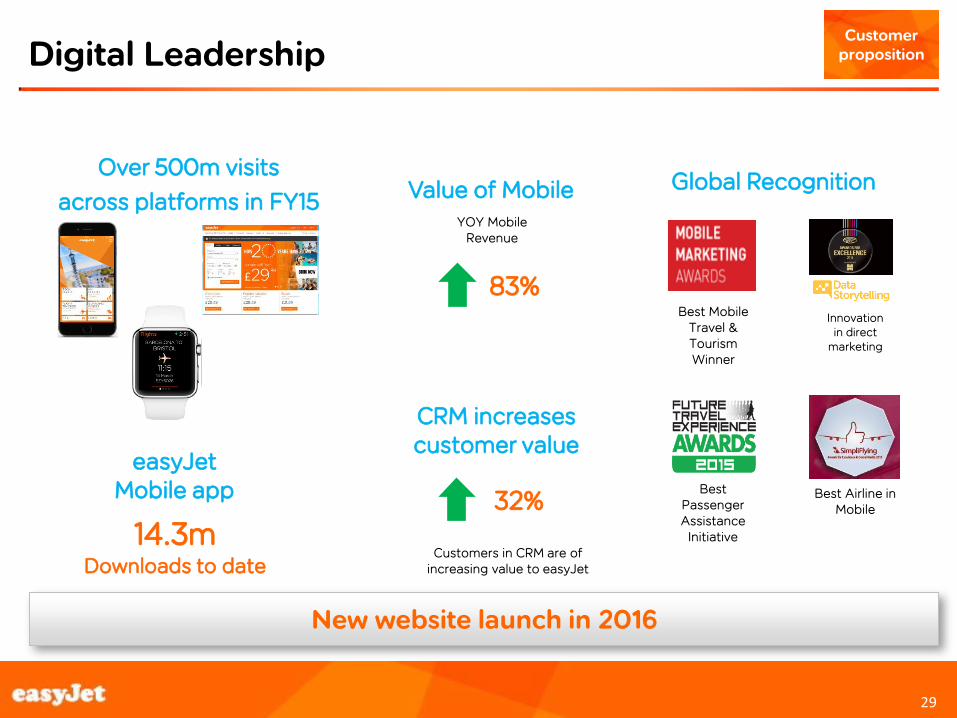
Digital Leadership
Best Airline in Mobile
Global Recognition
Best Passenger Assistance
Initiative
Best Mobile Travel & Tourism Winner
Over 500m visits
across platforms in FY15
CRM increases customer value
Value of Mobile YOY Mobile
Revenue
83%
Customers in CRM are of increasing value to easyJet
32%
Innovation in direct
marketing
29
Customer proposition
easyJet Mobile app
14.3m Downloads to date
New website launch in 2016

30 30
Footer box on intersect of lines line h=8.03 9 and v=8.75 with font 10pt Arial not bold
Strengthening our customer relationships
% seats booked by returning customers
Source: Millward Brown brand tracker FY15 vs FY13) Source: easyJet customer database
Brand consideration
Value perceptions 68% 69%
70% 72%
73% 74%
50%
55%
60%
65%
70%
75%
80%
10 11 12 13 14
% f
rom
Re
turn
ing
cu
sto
me
rs
Nu
mb
er
of
sea
ts
New Existing % Existing
30
Growth coming from valuable repeat customers
Customer proposition
30
15

31 31
Footer box on intersect of lines line h=8.03 9 and v=8.75 with font 10pt Arial not bold
Rewarding our loyal customers
31
Customer proposition
FLIGHT CLUB
• Aim to recognise and retain our high frequency and loyal customers
• Simple and low cost to administer
• Will continue to encourage customer loyalty
• Hundreds of thousands of passengers to be part of flight club

32 32
Footer box on intersect of lines line h=8.03 9 and v=8.75 with font 10pt Arial not bold
Business opportunity continuing to develop
32
Increase in business passengers of 25% over next 3 years
TMC GDS sales grew 32% YOY
Business fares grew at 58% YOY
Average 38% Saving on top
Business Routes
Increased focus on FTSE/CAC
& DAX companies
Award winning Business Program
Business Sense Marketing Campaign
Customer proposition

33 33
Footer box on intersect of lines line h=8.03 9 and v=8.75 with font 10pt Arial not bold
Leisure leadership
• Launched almost 60 new leisure routes in 2016
• easyJet holidays revenue per seat increased by 144% in summer 2015
• easyJet has launched around 60 new leisure routes in the 2016 schedule.
33
Customer proposition

34 34
Footer box on intersect of lines line h=8.03 9 and v=8.75 with font 10pt Arial not bold
1. At the end of the relevant Financial Year 2. Based on fleet plan – base case 3. Maximum fleet does not include the purchase rights
34
61% 52%
47% 39%
32% 29% 28% 28%
39% 44%
19%
3%
33%
53%
51% 47% 46% 45%
8% 18%
24% 26% 26%
0%
10%
20%
30%
40%
50%
60%
70%
80%
90%
100%
FY15 FY16 FY17 FY18 FY19 FY20 FY21 FY22
A319 A320 A320 '186 A320 NEO
Mix
of
fle
et
(%)
71% A320’s
Fleet up-gauging Up-gauging delivering CPS savings
easyJet fleet mix
156 sets 186 seats
Current generation
A319
New generation A320neo
13% -14%
Cost £110m opportunity from up-gauging by 2021

35 35
Footer box on intersect of lines line h=8.03 9 and v=8.75 with font 10pt Arial not bold
easyJet lean – c. £50 million savings in 2016
Short term <1yrs
Medium term 2 – 4 yrs
Long term 4yrs>
Increased pipeline of initiatives
Size of savings per annum
(larger circle means bigger saving opportunity)
Cost
35
• easyJet lean continues to deliver and develop significant cost reductions across
• Maintenance : AJ Walters
• Airports/Handling: deals, automation, structure of charges
• Navigation - SESAR
• Process and efficiency savings enabled by Technology
• Productivity savings enabled by scale in our bases

36 36
Footer box on intersect of lines line h=8.03 9 and v=8.75 with font 10pt Arial not bold
36
0%
10%
20%
30%
40%
50%
60%
70%
80%
90%
100%
2010 2011 2012 2013 2014 2015
1. Network remains robust
2. Gatwick improving
3. Opportunity for step change in operational excellence at Gatwick airport
easyJet network OTP
Building increased resilience Gatwick north terminal consolidation
Cost Operational excellence

37 37
Footer box on intersect of lines line h=8.03 9 and v=8.75 with font 10pt Arial not bold
What does this mean for our shareholders?
40% annual dividend payout
Stable margins over the cycle
Strong EPS growth
Expected passenger growth of
7% - 8% CAGR
37

38 38
Footer box on intersect of lines line h=8.03 9 and v=8.75 with font 10pt Arial not bold
easyJet is a structural winner
• Europe's best network of primary airports
• Best customer and digital proposition
• Constant innovation to drive demand and loyalty
• Cost discipline, up-gauging will deliver savings of £110
million by 2021
• Strong balance sheet
38

Q & A

appendix

41 41
Footer box on intersect of lines line h=8.03 9 and v=8.75 with font 10pt Arial not bold
Fuel and foreign exchange hedging
Sensitivities – FY16
• $10 per tonne change in fuel price will impact the full year pre-tax result by +/- $3.5 million
• One cent movement in the £/$ will impact the full year pre-tax result by +/- £1.5 million
• One cent movement in the £/€ will impact the full year pre-tax result by +/- £0.7 million
• One cent movement in the £/CHF will impact the full year pre-tax result by +/- £0.4 million
Fuel
requirement US dollar
requirement Euro surplus CHF surplus
Six months ending 31 March 2016
85% at $852 / metric tonne
89% at $1.62/£ 75% at €1.20/£ 69% at CHF1.46/£
Full year ending 30 September 2016
83% at $830 / metric tonne
81% at $1.63/£ 80% at €1.22/£ 67% at CHF1.46/£
Full year ending 30 September 2017
60% at $664 / metric tonne
61% at $1.55/£ 54% at €1.33/£ 51% at CHF1.43/£
As at 13 November 2015
41

42 42
Footer box on intersect of lines line h=8.03 9 and v=8.75 with font 10pt Arial not bold
H1 forward bookings
% seats sold *
H1 (October 2015 to March 2016) as at 13 November 2015
H1 bookings in line with prior year
42
91%
49%
93%
49%
Oct Nov Dec Jan Feb Mar H1
Winter '15 Winter '16

43 43
Footer box on intersect of lines line h=8.03 9 and v=8.75 with font 10pt Arial not bold
United Kingdom c. +9%
France c. +6%
Italy c. +3%
Spain c. +4% Switzerland c. +8%
Germany c. +7%
Source : OAG, scheduled data and Internal easyJet projection September 2015. Country capacity growth is based on network touching seats.
Profitably growing our business in 2016
Overall c. 8.0% capacity growth over winter
Netherlands c. +27%
Portugal c. +21%
43

44 44
Footer box on intersect of lines line h=8.03 9 and v=8.75 with font 10pt Arial not bold
easyjet
Ryanair
BA
Vueling
Other
Capacity environment H1 2016
Source: Market capacity data from OAG scheduled data, as at 6 September2015 easyJet markets based on internal easyJet definition.
Short-haul market easyJet city to city pairs
7.4% split by carrier
44
5.2%
3.7%
7.7%
6.8% 7.0%
7.8%
6.8%
7.4%
Capacity change totalSH Market
easyJet capacity change Competitors on easyJetmarkets
Capacity ChangeeasyJet markets
Winter 14/15 Winter 15/16

45 45
Footer box on intersect of lines line h=8.03 9 and v=8.75 with font 10pt Arial not bold
Profit after tax
45
£m FY 2015 FY 2014 Change
Profit before tax 686 581 18.1%
Tax charge (138) (131) (5.3%)
Profit after tax 548 450 21.8%
Effective tax rate 20.1% 22.5% 2.4ppt

46 46
Footer box on intersect of lines line h=8.03 9 and v=8.75 with font 10pt Arial not bold
Revenue per seat
46
£ per seat FY 2015 FY 2014 Change
Seat revenue 61.54 62.40 (1.4%)
Non-seat revenue 0.94 0.91 2.2%
Total revenue 62.48 63.31 (1.3%)

47 47
Footer box on intersect of lines line h=8.03 9 and v=8.75 with font 10pt Arial not bold
Revenue, profit and margin growth in H2
47
Reported £m H2 2015 H2 2014 Change
Total revenue 2,919 2,825 3.3%
Fuel (683) (714) 4.3%
Operating costs (excluding fuel) (1,426) (1,352) (5.5%)
EBITDAR 810 759 6.6%
Ownership costs (131) (125) (3.4%)
Pre-tax profit 679 634 7.2%
PBT margin 23.3% 22.4% 0.8ppt
Seats (m) 42.8 40.5 5.9%
Constant currency £ per seat H2 2015 H2 2014 Change
Total revenue 70.35 69.85 0.7%
Fuel (15.68) (17.64) 11.1%
Operating costs (excluding fuel) (34.98) (33.44) (4.6%)
EBITDAR 19.69 18.77 4.9%
Ownership costs (3.14) (3.11) (1.0%)
Pre-tax profit 16.55 15.66 5.6%

48 48
Footer box on intersect of lines line h=8.03 9 and v=8.75 with font 10pt Arial not bold
Cost per seat excluding fuel - key drivers
48
Cost per seat
excluding
fuel
£
Variance at
constant
currency
£
Variance at
constant
currency
%
Weighted variance
at constant
currency
£
Drivers
Airports and ground handling 14.96 (0.37) (2.4%) (1.0%)
• Regulated airport charges
• Impact of higher load factor
• Increase in de-icing costs due to colder weather
• Offset by savings of new contracts
Overhead 5.06 (0.30) (7.3%) (0.7%) • Higher disruption costs including FCO fire
Crew 6.73 (0.25) (3.8%) (0.7%)• Pay increase broadly in line with inflation
• Early recruitment in winter to meet summer
demand
Navigation 4.17 (0.22) (5.1%) (0.6%)• Inflationary increases
• Settlement of the historic Eurocontrol dispute
Maintenance 3.06 (0.11) (3.8%) (0.3%) • One-off benefit of new engine deal in FY 2014
Ownership 3.46 (0.02) (0.4%) (0.0%)• Depreciation on new aircraft purchased
• Offset against decreasing lease costs
37.44 (1.27) (3.4%) (3.3%)
Net Exchange (gains)/losses (0.09) (0.10) 100.0% (0.3%)• Effect of movements in foreign exchange rates
on Balance sheet revaluation
Total CPS excluding fuel 37.35 (1.37) (3.6%) (3.6%)

49 49
Footer box on intersect of lines line h=8.03 9 and v=8.75 with font 10pt Arial not bold
Increasing proportion of A320’s
49
FY 2015 FY 2014 Change
A319 (operating lease) 49 54 (5)
A319 (owned / finance lease) 99 99 0
A319 Total 148 153 (5)
A320 (operating lease) 18 18 0
A320 (owned / finance lease) 75 55 20
A320 Total 93 73 20
Total fleet 241 226 15
Operating lease 28% 32% (4ppt)
Number unencumbered 114 94 20
Percentage of A320s in fleet 39% 32% 7ppt
50 50
Footer box on intersect of lines line h=8.03 9 and v=8.75 with font 10pt Arial not bold
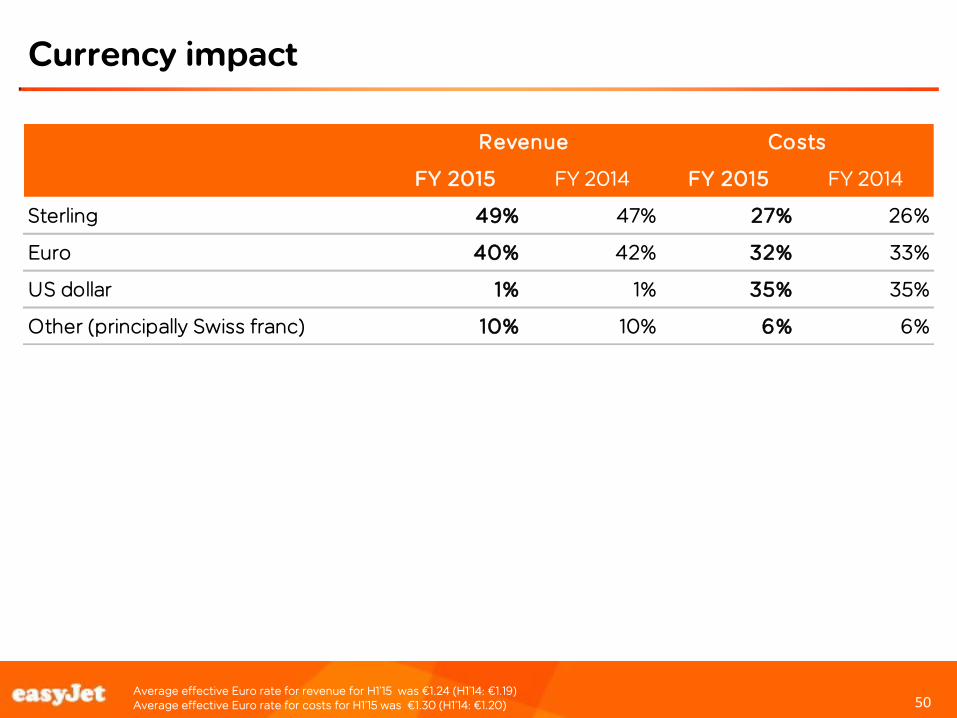
Currency impact
Average effective Euro rate for revenue for H1’15 was €1.24 (H1’14: €1.19) Average effective Euro rate for costs for H1’15 was €1.30 (H1’14: €1.20)
50
FY 2015 FY 2014 FY 2015 FY 2014
Sterling 49% 47% 27% 26%
Euro 40% 42% 32% 33%
US dollar 1% 1% 35% 35%
Other (principally Swiss franc) 10% 10% 6% 6%
Revenue Costs

51 51
Footer box on intersect of lines line h=8.03 9 and v=8.75 with font 10pt Arial not bold
ROCE calculation – including 7x lease adjustment
Reported £m FY 2015 FY 2014
Earnings before interest and tax – reported 688 581
Interest element of operating lease payments 38 41
Earnings before interest and tax - adjusted 726 622
Tax 20% 21%
Normalised operating profit after tax (NOPAT) 581 491
Average shareholders’ equity – reported 2,211 2,095
Average net cash – reported (429) (490)
Average capitalised leases 833 791
Average capital employed 2,615 2,396
Return on capital employed – 7x basis 22.2% 20.5%
51