Full Year Results 2002
26
Full Year Results 2002 20 th November 2002
-
Upload
henriette-angel -
Category
Documents
-
view
41 -
download
1
description
Full Year Results 2002. 20 th November 2002. Overview. Result highlights & achievements Financial performance Strategy & outlook. Andrew Lindberg. Managing Director. 2002 result highlights. Net profit after tax of $107.2m, up 28% Total operating revenue of $2.3b, up 19% - PowerPoint PPT Presentation
Transcript of Full Year Results 2002
Full Year Results 2002
20th November 2002
Overview
• Result highlights & achievements
• Financial performance
• Strategy & outlook
Andrew Lindberg
Managing Director
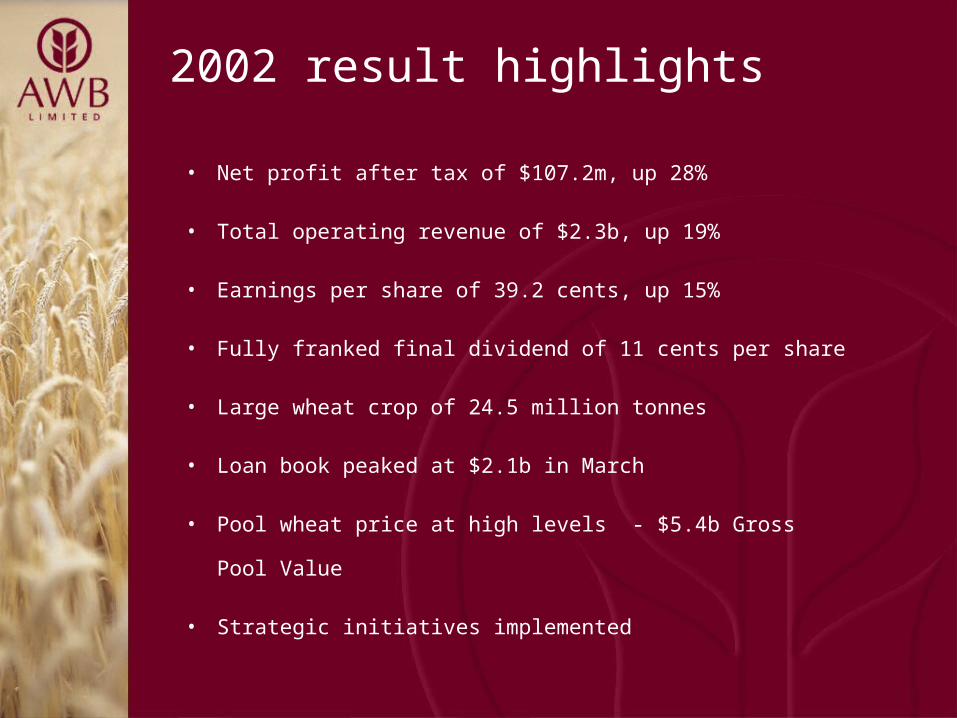
2002 result highlights
• Net profit after tax of $107.2m, up 28%
• Total operating revenue of $2.3b, up 19%
• Earnings per share of 39.2 cents, up 15%
• Fully franked final dividend of 11 cents per share
• Large wheat crop of 24.5 million tonnes
• Loan book peaked at $2.1b in March
• Pool wheat price at high levels - $5.4b Gross Pool Value
• Strategic initiatives implemented
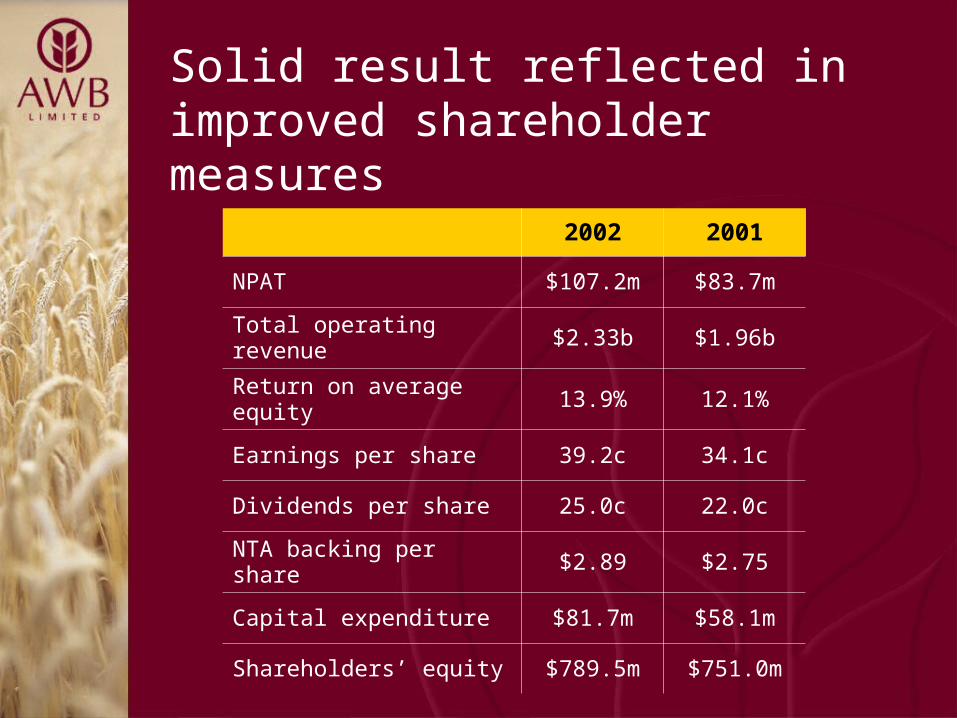
2002 2001
NPAT $107.2m $83.7m
Total operating revenue $2.33b $1.96b
Return on average equity 13.9% 12.1%
Earnings per share 39.2c 34.1c
Dividends per share 25.0c 22.0c
NTA backing per share $2.89 $2.75
Capital expenditure $81.7m $58.1m
Shareholders’ equity $789.5m $751.0m
Solid result reflected in improved shareholder measures
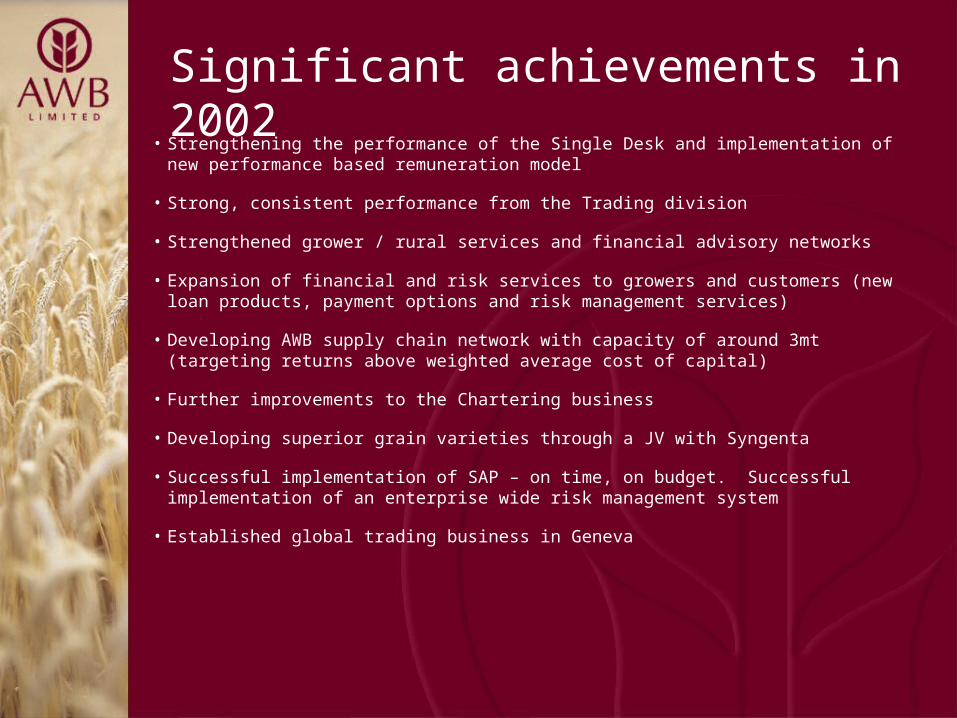
Significant achievements in 2002
• Strengthening the performance of the Single Desk and implementation of new performance based remuneration model
• Strong, consistent performance from the Trading division
• Strengthened grower / rural services and financial advisory networks
• Expansion of financial and risk services to growers and customers (new loan products, payment options and risk management services)
• Developing AWB supply chain network with capacity of around 3mt (targeting returns above weighted average cost of capital)
• Further improvements to the Chartering business
• Developing superior grain varieties through a JV with Syngenta
• Successful implementation of SAP – on time, on budget. Successful implementation of an enterprise wide risk management system
• Established global trading business in Geneva
Paul Ingleby
Chief Financial Officer
Overview
• Statement of financial performance
• Cashflow
• Capital expenditure
• Statement of financial position
• Business operations
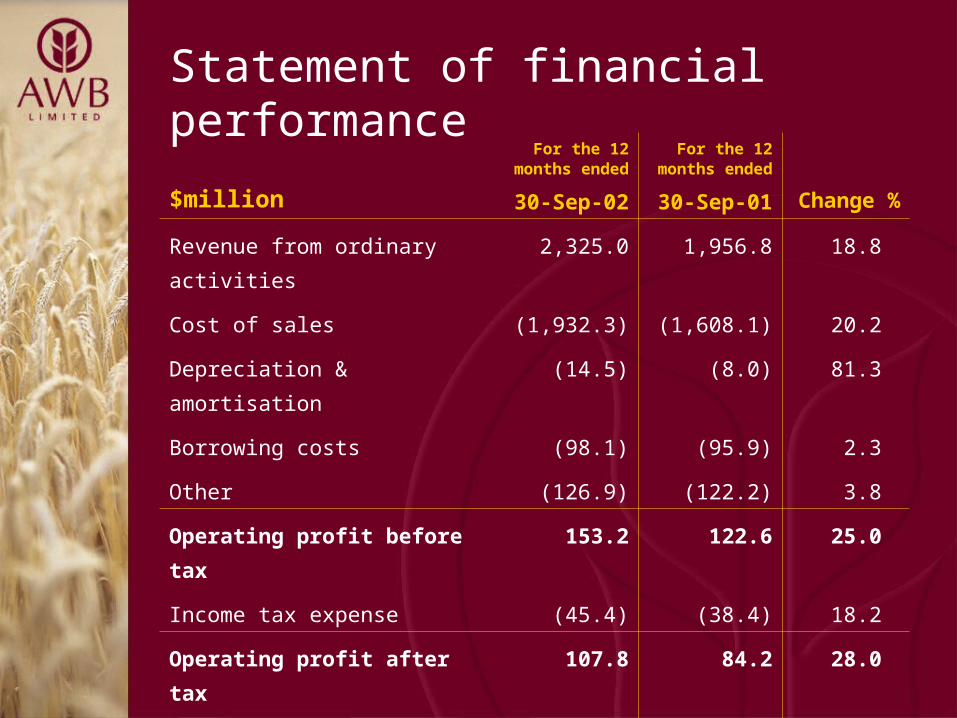
Statement of financial performance
$million
For the 12 months ended
30-Sep-02
For the 12 months ended
30-Sep-01 Change %
Revenue from ordinary activities 2,325.0 1,956.8 18.8
Cost of sales (1,932.3) (1,608.1) 20.2
Depreciation & amortisation (14.5) (8.0) 81.3
Borrowing costs (98.1) (95.9) 2.3
Other (126.9) (122.2) 3.8
Operating profit before tax 153.2 122.6 25.0
Income tax expense (45.4) (38.4) 18.2
Operating profit after tax 107.8 84.2 28.0
Outside entity interest (0.6) (0.5) 20.0
Net profit 107.2 83.7 28.1
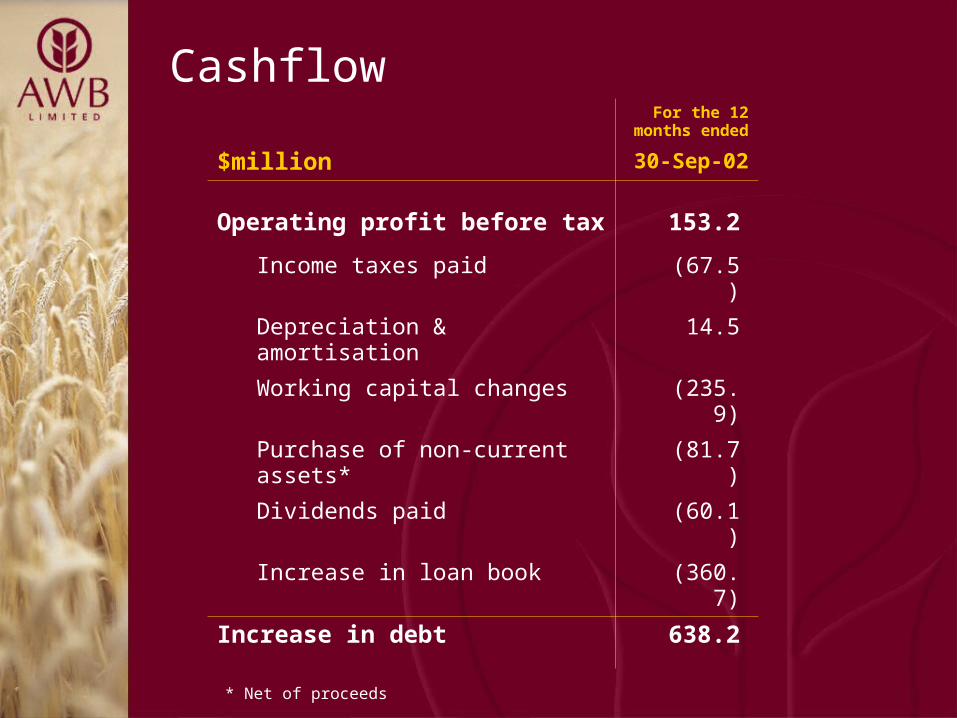
Cashflow
$million
For the 12 months ended
30-Sep-02
Operating profit before tax 153.2
Income taxes paid (67.5)
Depreciation & amortisation 14.5
Working capital changes (235.9)
Purchase of non-current assets* (81.7)
Dividends paid (60.1)
Increase in loan book (360.7)
Increase in debt 638.2
* Net of proceeds
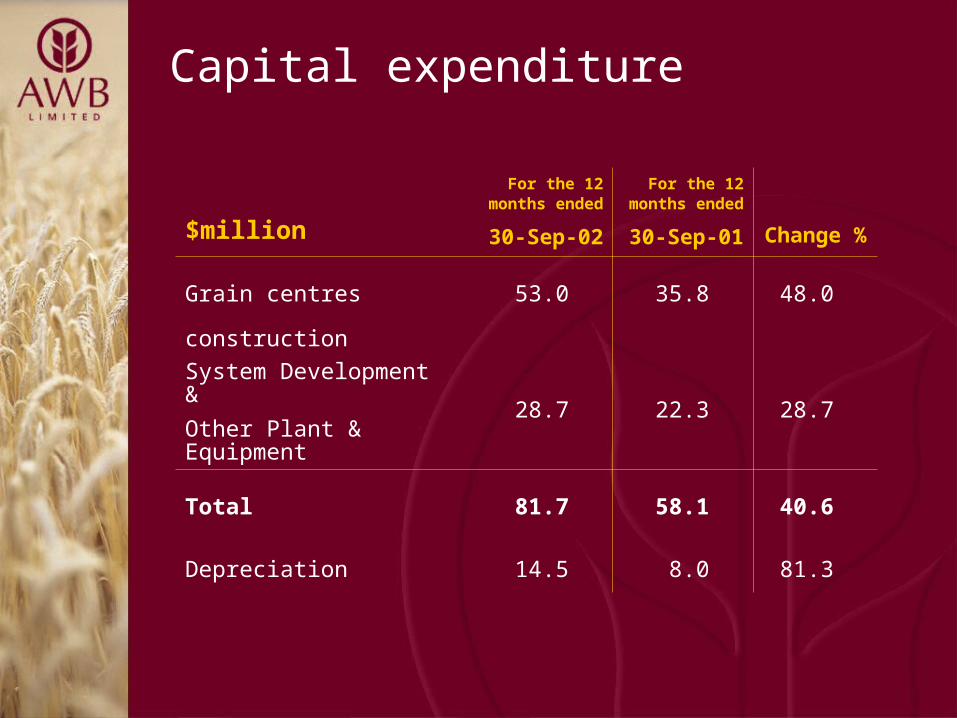
Capital expenditure
$million
For the 12 months ended
30-Sep-02
For the 12 months ended
30-Sep-01 Change %
Grain centres construction 53.0 35.8 48.0
System Development &
Other Plant & Equipment 28.7 22.3 28.7
Total 81.7 58.1 40.6
Depreciation 14.5 8.0 81.3
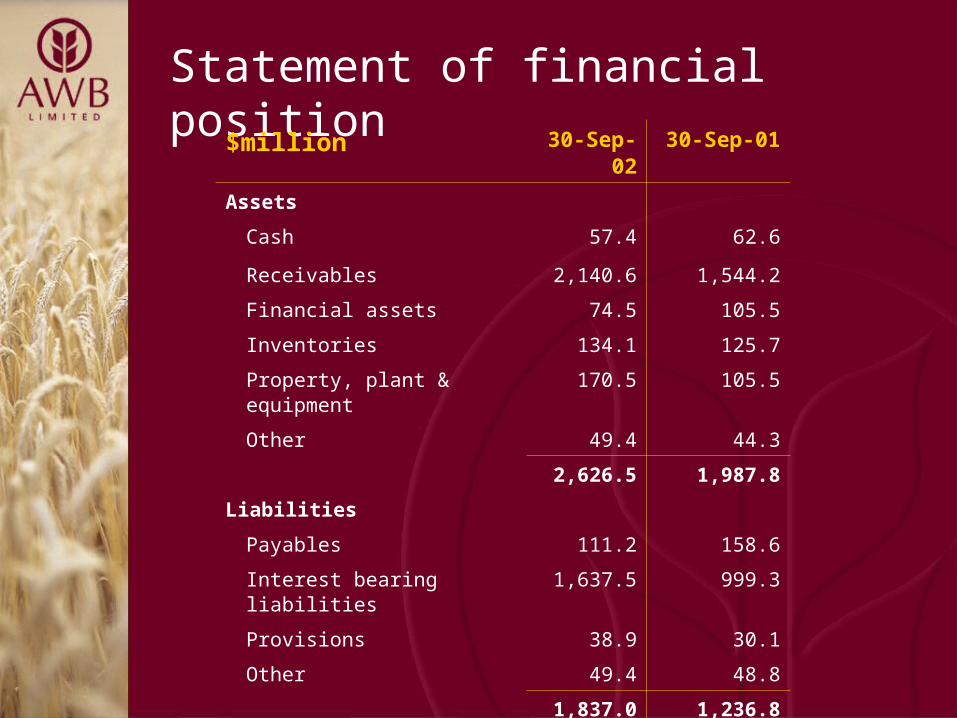
Statement of financial position
$million 30-Sep-02 30-Sep-01
Assets
Cash 57.4 62.6
Receivables 2,140.6 1,544.2
Financial assets 74.5 105.5
Inventories 134.1 125.7
Property, plant & equipment 170.5 105.5
Other 49.4 44.3
2,626.5 1,987.8
Liabilities
Payables 111.2 158.6
Interest bearing liabilities 1,637.5 999.3
Provisions 38.9 30.1
Other 49.4 48.8
1,837.0 1,236.8
Net Assets 789.5 751.0
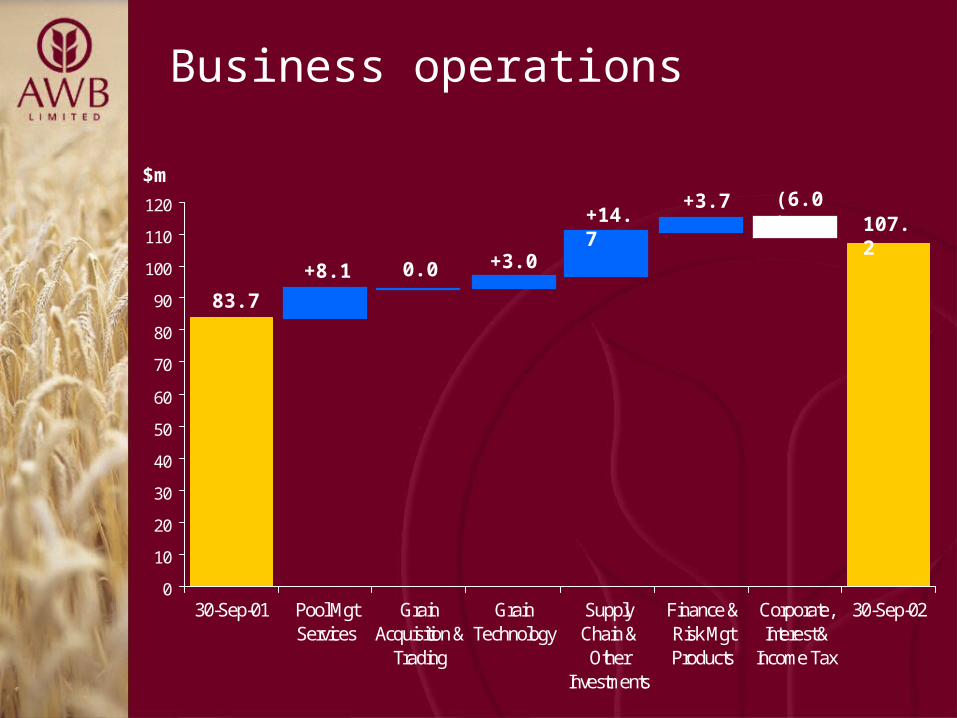
Business operations
0
10
20
30
40
50
60
70
80
90
100
110
120
30-Sep-01 Pool MgtServices
GrainAcquisition &
Trading
GrainTechnology
SupplyChain &
OtherInvestments
Finance &Risk MgtProducts
Corporate,Interest &
Income Tax
30-Sep-02
83.7
+8.1 0.0 +3.0
+14.7+3.7 (6.0)
107.2
$m
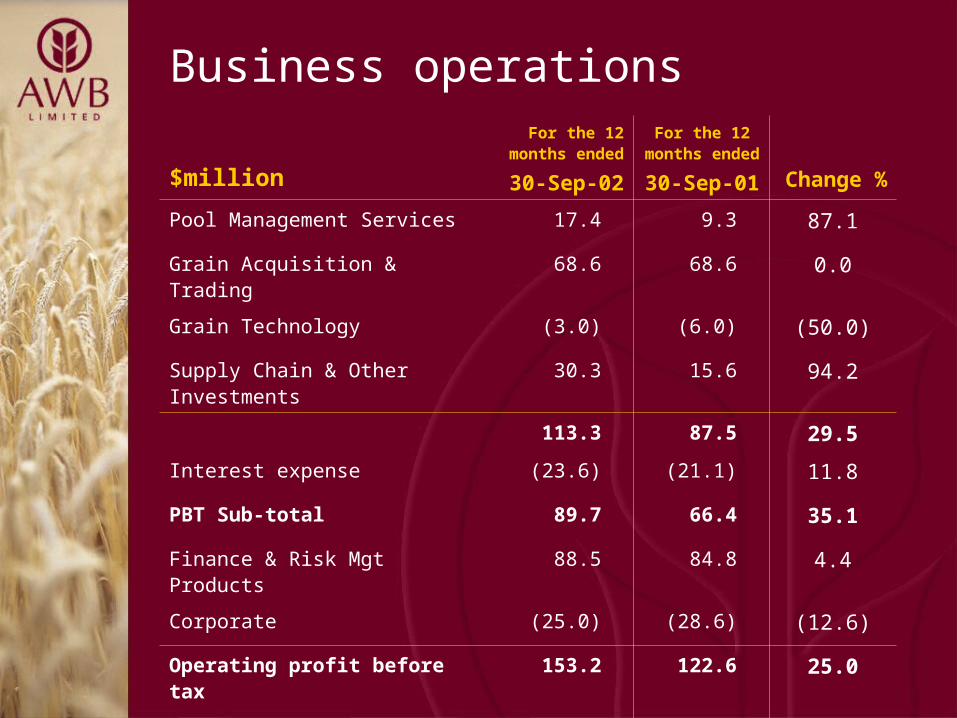
Business operations
$million
For the 12 months ended
30-Sep-02
For the 12 months ended
30-Sep-01 Change %
Pool Management Services 17.4 9.3 87.1
Grain Acquisition & Trading 68.6 68.6 0.0
Grain Technology (3.0) (6.0) (50.0)
Supply Chain & Other Investments 30.3 15.6 94.2
113.3 87.5 29.5
Interest expense (23.6) (21.1) 11.8
PBT Sub-total 89.7 66.4 35.1
Finance & Risk Mgt Products 88.5 84.8 4.4
Corporate (25.0) (28.6) (12.6)
Operating profit before tax 153.2 122.6 25.0
Net profit after tax 107.2 83.7 28.1
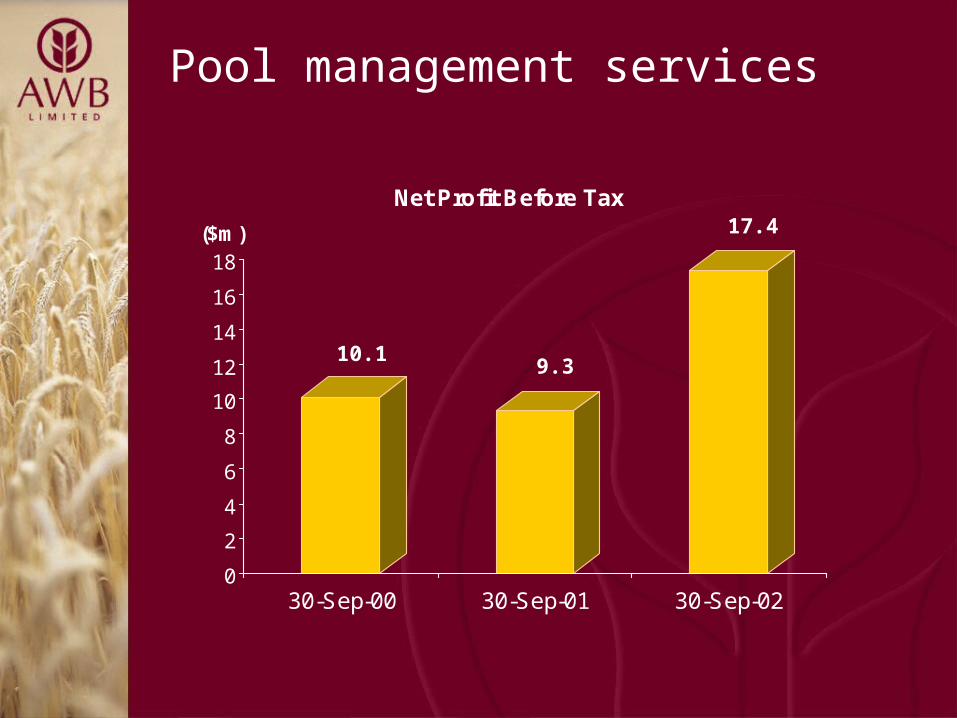
Pool management services
0
2
4
6
8
10
12
14
16
18($m)
30-Sep-00 30-Sep-01 30-Sep-02
Net Profit Before Tax
10.19.3
17.4
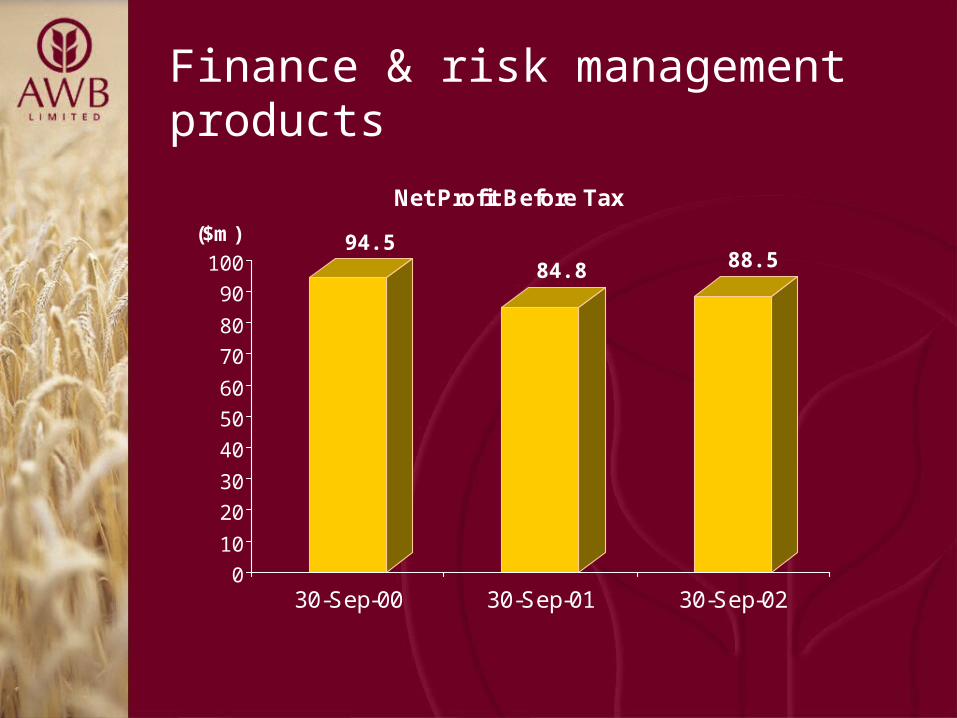
Finance & risk management products
0
10
20
30
40
50
60
70
80
90
100
($m)
30-Sep-00 30-Sep-01 30-Sep-02
Net Profit Before Tax
94.584.8 88.5
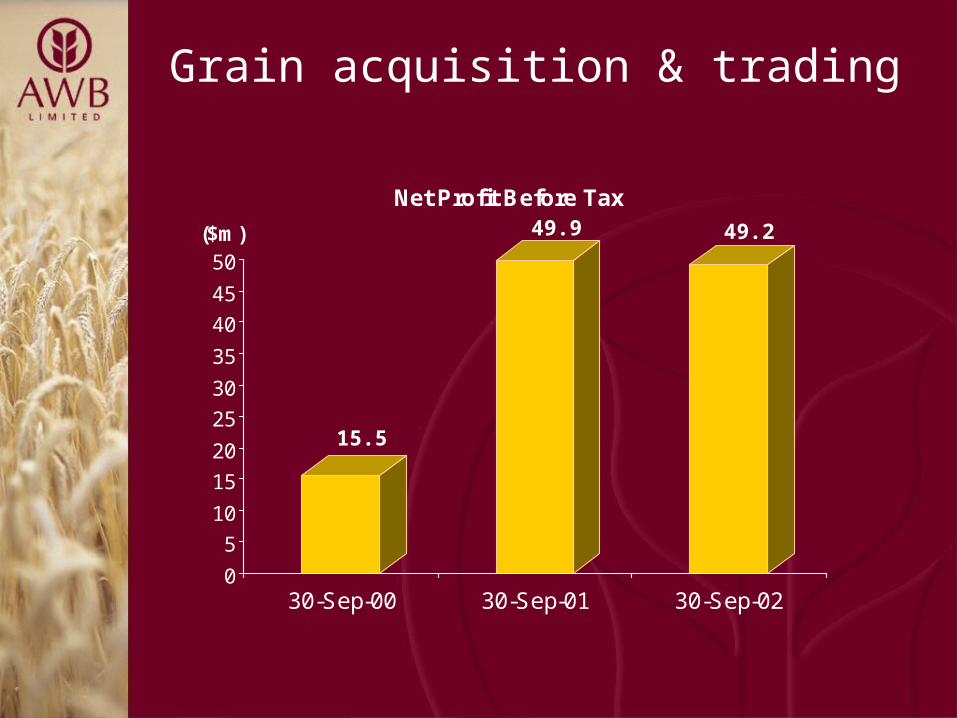
Grain acquisition & trading
0
5
10
15
20
25
30
35
40
45
50($m)
30-Sep-00 30-Sep-01 30-Sep-02
Net Profit Before Tax
15.5
49.9 49.2
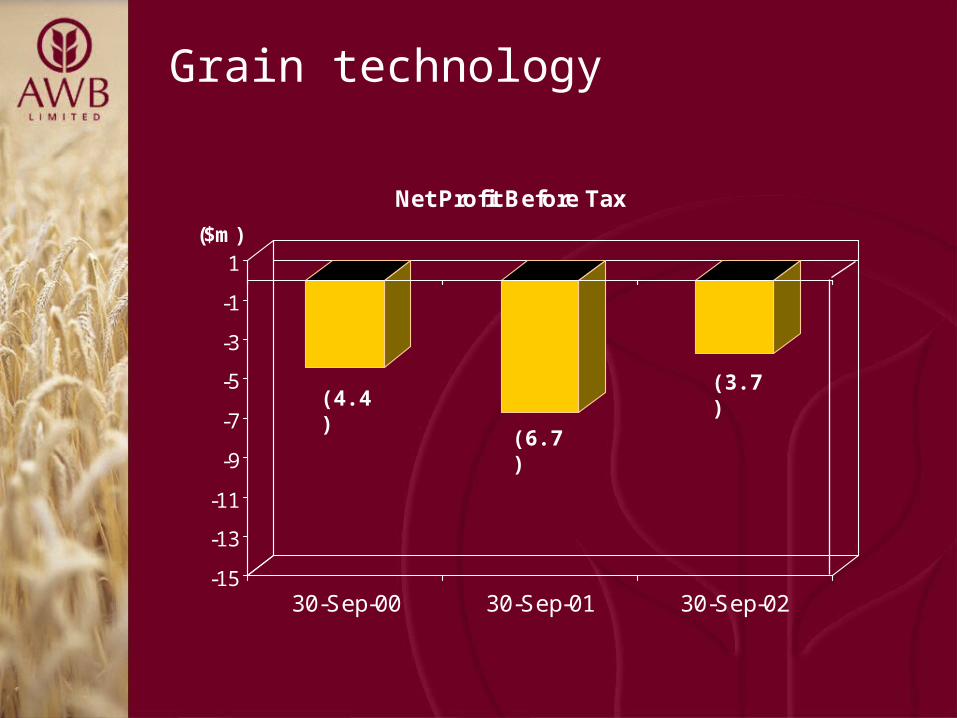
Grain technology
-15
-13
-11
-9
-7
-5
-3
-1
1($m)
30-Sep-00 30-Sep-01 30-Sep-02
Net Profit Before Tax
(4.4)
(6.7)
(3.7)
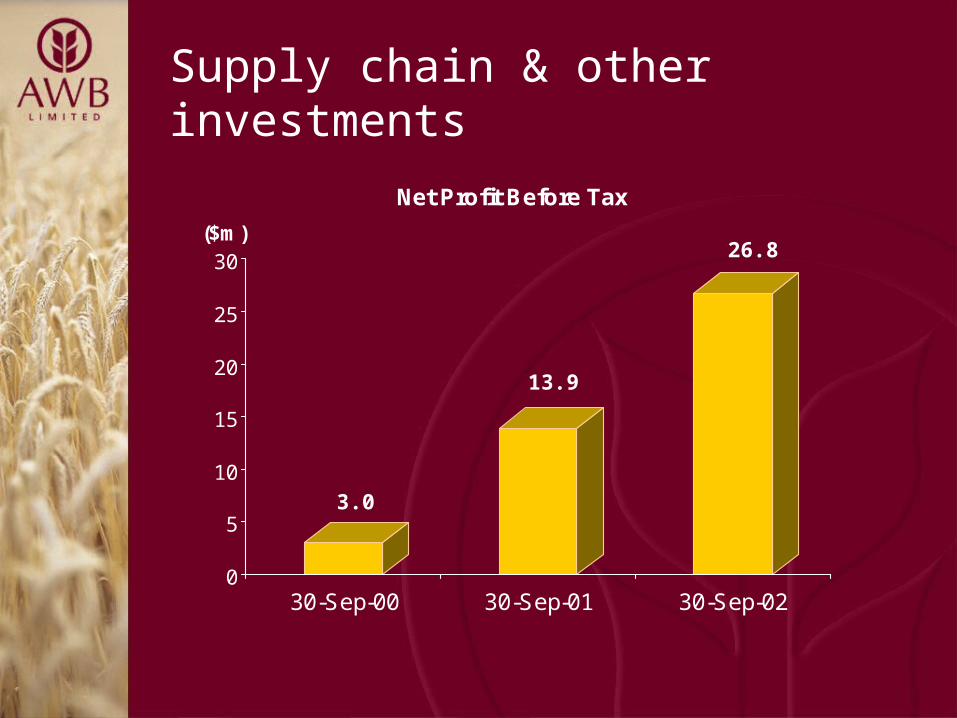
Supply chain & other investments
0
5
10
15
20
25
30($m)
30-Sep-00 30-Sep-01 30-Sep-02
Net Profit Before Tax
3.0
13.9
26.8
Strategy & Outlook
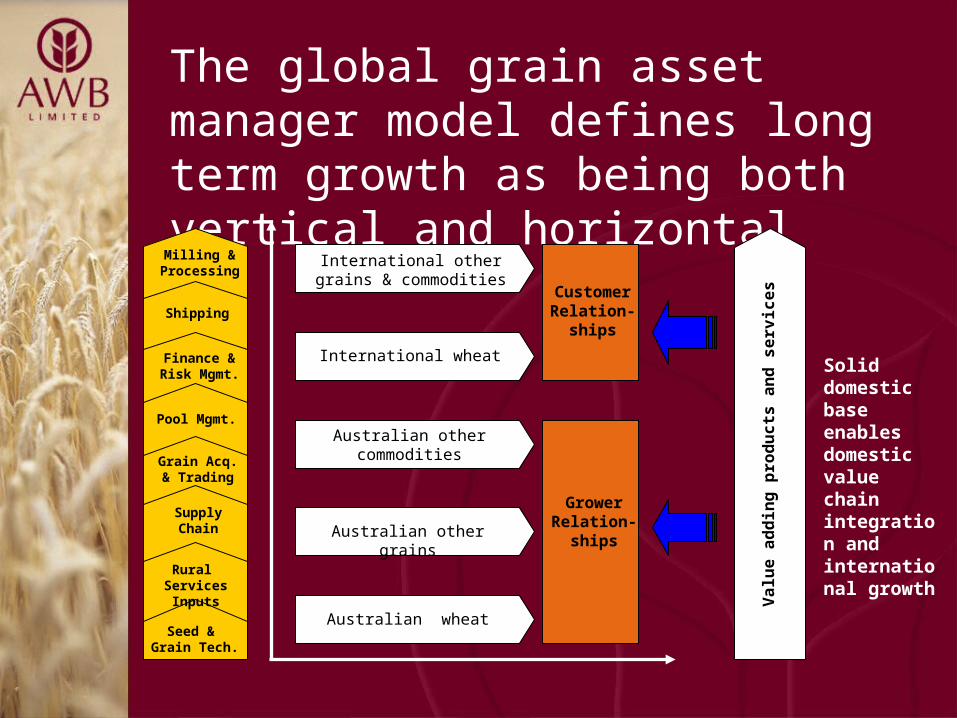
The global grain asset manager model defines long term growth as being both vertical and horizontal
Australian other grains
Australian other commodities
Australian wheat
International wheat
International other grains & commodities
Solid domestic base enables domestic value chain integration and international growth
Grower Relation-
ships
Customer Relation-
ships
Va
lue
ad
din
g p
rod
uc
ts a
nd
se
rvic
es
Rural Services Inputs
Seed & Grain Tech.
Shipping
Finance & Risk Mgmt.
Grain Acq. & Trading
Supply Chain
Milling & Processing
Pool Mgmt.
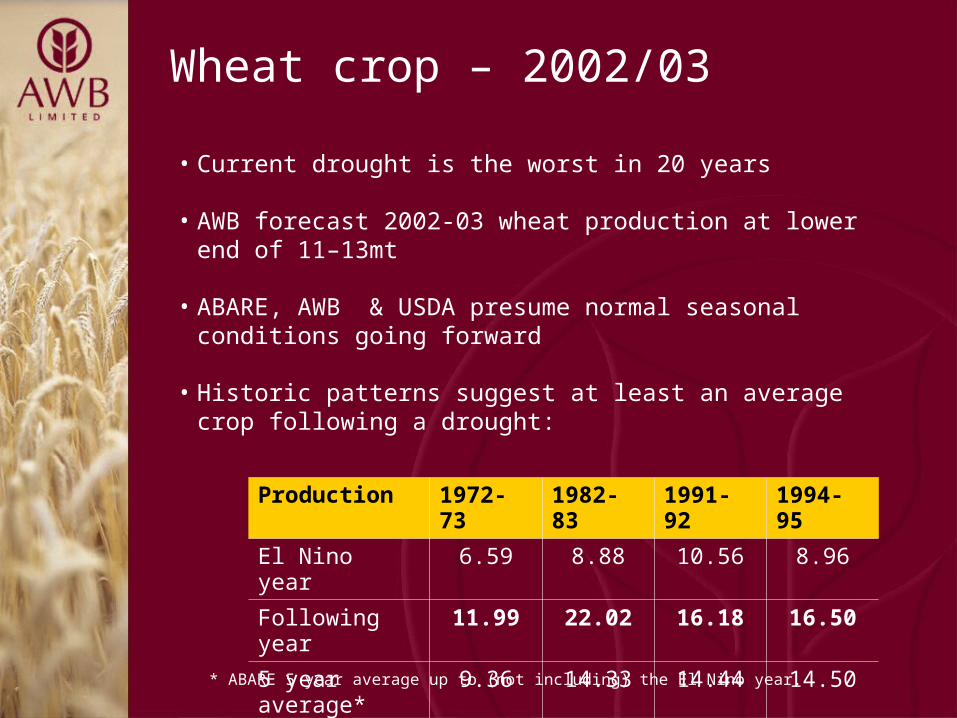
Wheat crop – 2002/03
• Current drought is the worst in 20 years
• AWB forecast 2002-03 wheat production at lower end of 11–13mt
• ABARE, AWB & USDA presume normal seasonal conditions going forward
• Historic patterns suggest at least an average crop following a drought:
* ABARE 5 year average up to (not including) the El Nino year.
Production 1972-73 1982-83 1991-92 1994-95
El Nino year 6.59 8.88 10.56 8.96
Following year 11.99 22.02 16.18 16.50
5 year average* 9.36 14.33 14.44 14.50
Outlook
• Production of around 11mt, over 50% below the 5 year average (22.2mt) – major impact on 2003 earnings.
• Stable dividend payment for 2002-03 despite reduction in earnings.
• Strategic investment in Futuris Limited – complimentary business streams and represents good value at current prices.
• Efficient capital management is a key financial objective. Plans to establish a “ring-fenced” funding platform.
• Further additions to the existing suite of finance & risk management products and investment in the supply chain.
• Further growth and diversification – aim to be less than 80% reliant on the wheat crop by end of 2004.
AWB is well positioned
• One of the largest integrated global wheat managers
• Manager of the Single Desk
• Potential to broaden range of products, services to a large existing customer base in Australia and overseas
• Balance sheet strength – strong dividend paying capacity

Questions
For more information contact:
Michael Thomas
GM, Stakeholder Relations
Ph: +61 3 9209 2064
Email: [email protected]
www.awb.com.au