
Full-scale experimental testing and finite element ... Journal/2017/May-June... · ˜ The totally...
17
Transcript of Full-scale experimental testing and finite element ... Journal/2017/May-June... · ˜ The totally...

72 PCI Journal | May–June 2017
Increasing traf�c demands require further expansion of highway and bridge components, including substruc-ture systems. The conventional construction process
performed to accommodate such an expansion is generally accompanied by traf�c interruptions, lane closures, and prolonged construction times, which lead to higher costs. As a result, several departments of transportation are seeking accelerated construction techniques to reduce the impact of the long construction periods associated with conventional construction methods. Current accelerated construction techniques use precast concrete systems, which provide several economic advantages over conven-tional cast-in-place concrete construction methods. The use of precast concrete systems for highway and bridge construction can potentially reduce the site preparation procedures, overall construction period, and environmen-tal impact. Moreover, it is credited with promoting work zone safety and reducing the number of injuries caused by exposing workers to active traf�c.
Although precast concrete systems provide several eco-nomic, social, and environmental advantages, plenty of re-search is still required to develop precast concrete systems for substructures such as retaining walls and abutments. As a response, a totally prefabricated counterfort retaining wall system was developed as a retaining wall solution for highway applications. The proposed system was developed and optimized1,2 as a response to growing needs such as speed of construction, strength and durability, minimization of traf�c �ow interruption, safety, and cost.
■ The overall structural behavior of a totally prefabri-cated counterfort retaining wall system was exam-ined experimentally and analytically using nonlinear finite element analysis.
■ The anchors succeeded in maintaining serviceability and ultimate strength requirements.
■ The totally prefabricated counterfort retaining wall system has proven to be an innovative and e�ective solution for multiple requirements, such as speed of construction, strength, durability, and safety.
Full-scale experimental testing and finite element analysis of a totally prefabricated counterfort retaining wall system
Maen Farhat, Mohsen Issa, Mustapha Ibrahim, and Momenur Rahman

73PCI Journal | May–June 2017
ment length. Starting from the furthermost anchor to the rear face of the face panel, no. 7 (22M) anchors were used for the �rst two rows, and no. 6 (19M) anchors were used for the remaining three rows. The extended anchors were grouted to predesigned conical-shaped shear pockets in the base slab (Fig. 2 and 4). The shear pockets in the slab were tapered from 5 in. (130 mm) in diameter at the top to 6 in. (150 mm) in diameter at the bottom to enhance the bond between components. Figure 4 summarizes the dimensions of the proposed totally prefabricated counterfort retaining wall system.
Background
The use of precast concrete elements for bridge construc-tion and rehabilitation is considered economically ef�cient because it requires less time for construction.5 Although cast-in-place concrete abutments, piers, and deck slabs are widely used in bridge applications, their construction sequences and procedures are considered time intensive.6
Several activities related to cast-in-place concrete proce-dures have created problems related to time schedules, safety priorities, and the environment. These activities include the following:
• site preparation procedures, such as installing form-work and casting and curing concrete
• traf�c detours and lane closures, which cause traf�c congestion
• construction work that exposes workers to active traf�c
• �nishing work that requires skilled workers
The totally prefabricated counterfort retaining wall system is composed of two prefabricated components: the wall component, consisting of a face panel with three counter-forts, and the base slab component (Fig. 1 and 2). Counter-forts act as stiffeners to the face panel and connect the wall and the base slab. Headed anchors are used to connect each counterfort to the base slab, thus enforcing the integrity of the system to achieve full composite action.
Counterforts are added along the width of the wall at discrete locations to enhance the serviceability of the face panel and to increase the stiffness of the system without increasing the thickness of the face panel. In fact, coun-terfort retaining wall systems exhibit lower stress states than their cantilever counterparts. Senthil et al.3 performed a three-dimensional �nite element analysis to study the structural performance of both cantilever- and counter-fort-type retaining walls subjected to lateral earth pressure. The study shows that retaining walls with counterforts of 1.2 m (3.9 ft) below the top surface of the face panel exhibit lower stress levels than cantilever retaining walls of the same height.
Figure 3 shows the front elevation of the proposed totally prefabricated counterfort retaining wall system and the extended counterforts.
In this study, the overall structural behavior of a totally prefabricated counterfort retaining wall system was exper-imentally studied and analytically evaluated using non-linear �nite element analysis. A 20 ft 2 in. (6.09 m) high, 13 ft 10 in. (4.21 m) wide, full-scale totally prefabricated counterfort retaining wall prototype was designed in accor-dance with the requirements of the American Association of State Highway and Transportation Of�cials’ AASHTO LRFD Bridge Design Speci�cations.4
The system was manufactured in a precast concrete plant. Headed anchors were embedded in each counterfort during casting with 1 ft (0.3 m) spacing and suf�cient develop-
Figure 1. Totally prefabricated counterfort retaining wall system during erection showing anchors extending from the counterfort.
Figure 2. Base slab during erection showing predesigned shear pockets for anchor embedment.
Figure 3. Front elevation of the totally prefabricated counter-fort retaining wall system with wing walls.
Counterforts
Face panel
Anchor
Shear pockets
12
3 45

74 PCI Journal | May–June 2017
for using partially or fully precast concrete superstructure systems.
Numerous studies involve precast concrete bridge compo-nents to promote accelerated bridge construction in super- and substructures.16–21 The use of precast concrete technol-ogies in bridge substructure construction such as bent caps, columns, and footings has been frequently reported;22–23
however, studies on the development or optimization of the end supports of bridges, such as retaining walls and abut-ments, are scarce. A precast concrete cantilever retaining wall system was developed by the Michigan Department of Transportation to reduce construction time and improve work zone safety.24 The precast concrete cantilever-type
These challenges have led to more focus on precast con-crete products due to the ef�ciency of their production and assembly processes. Moreover, precast concrete products are typically produced in a controlled plant environment, thereby taking advantage of the uniformity and consistency of high-performance concrete properties and reducing the risk of errors on-site.
Precast concrete bridge components are divided into super-structure elements (such as decks and beams) and sub-structure elements (such as piers, abutments, and retaining walls). Generally, most of the research found in the litera-ture focuses on developing precast concrete superstructure systems.7–15 The research resulted in details and guidelines
1 ft 2 in.20
ft 2
in.
5 ft17 ft 9 in.
4 ft 7 in. 7 ft 8 in.
6 in.6 in.
18 ft
1 ft 2 in.
6 in.
13 ft 10 in.
20 ft
2 in
.
2 ft 4 ft 11 in. 2 ft4 ft 11 in.
19 ft
0 in
.
19 ft
6 in.
Hee
l par
t
Toe
part
Typical anchor location
Limit of extension 20 in. from the top
Detail A Detail A
Centerline of counterfort
2 in. deep shear key for wall placement
88°
0.5 in./ft slope
1 ft
3 in
.13
ft 1 2 i
n.Typical spacing between anchors
1ft
6 in. face panel
3 ft 0 in. 11 ft 9 in.7 ft 1 in. 4 ft 8 in. 1 ft 10 in.
4 ft
8 in
.4
ft 8
in.
1 ft 10 in.
6 in.
15 ft 3 in.
13 ft
0 in
.L
L0.
41L
0.41
L
1 ft 2 in.
20 ft
2 in
.
5 ft17 ft 9 in.
4 ft 7 in. 7 ft 8 in.
6 in.6 in.
18 ft
1 ft 2 in.
6 in.
13 ft 10 in.
20 ft
2 in
.
2 ft 4 ft 11 in. 2 ft4 ft 11 in.
19 ft
0 in
.
19 ft
6 in.
Hee
l par
t
Toe
part
Typical anchor location
Limit of extension 20 in. from the top
Detail A Detail A
Centerline of counterfort
2 in. deep shear key for wall placement
88°
0.5 in./ft slope
1 ft
3 in
.13
ft 1 2 i
n.Typical spacing between anchors
1ft
6 in. face panel
3 ft 0 in. 11 ft 9 in.7 ft 1 in. 4 ft 8 in. 1 ft 10 in.
4 ft
8 in
.4
ft 8
in.
1 ft 10 in.
6 in.
15 ft 3 in.
13 ft
0 in
.L
L0.
41L
0.41
L
Figure 4. Geometric layouts of the totally prefabricated counterfort retaining wall system. Note: L = center-to-center spacing between two adjacent counterforts. 1 in. = 25.4 mm; 1 ft = 0.305 m.
Side elevation Front elevation and dimensions
Base slab plan view

75PCI Journal | May–June 2017
for connections in precast concrete bridge components, including retaining walls and abutments used in various states in the United States.27
This study examines the structural performance of the proposed totally prefabricated counterfort retaining wall system through full-scale experimental testing and non-linear �nite element analysis. The structural behavior of each component during load application is presented and compared with the results obtained from the �nite element analysis. Figure 5 summarizes the reinforcement details of the totally prefabricated counterfort retaining wall sys-tem. The overall resulting weight of the structure is about 73.3 kip (326 kN).
Material properties
The material properties used in the analysis, design, and experimental testing of the totally prefabricated counter-fort retaining wall system and the soil back�ll include the following:
• yield strength of steel reinforcement fy = 60 ksi (410 MPa)
• steel modulus of elasticity Es = 29,000 ksi (200,000 MPa)
• concrete compressive strength fc' = 7.2 ksi (50 MPa)
• unit weight of concrete γc = 150 lb/ft3 (2400 kg/m3)
walls consisted of 5000 psi (34 MPa) precast concrete footing and stem segments. The height of each segment was limited to 12 ft (3.7 m) to facilitate transportation and erection. Full moment connection was provided between the stem and the footing through grout-�lled mechanical splicers. Vertical joints between precast concrete elements used shear keys, which were �lled with nonshrink high-strength grout. Retaining wall heights ranged from 4 ft (1.2 m) to a maximum of 26 ft (7.9 m). Because the wall was a regular cantilever wall, a thick wall section was used to control de�ection and cracking and meet the structural design considerations.
Similarly, a precast concrete bridge was constructed in only eight days in New Hampshire in 2004.25 The system con-sisted of a precast concrete footing and a precast concrete abutment stem. Reinforcement extended from the base footing into predesigned splice sleeve connectors in the precast concrete stem. These sleeves were grouted using high-strength grout through splice ports. The splice sleeves were aligned with the extended bars within a tolerance of ½ in. (13 mm). The wall stem was placed in a pocket to facilitate grouting and improve shear resistance.
In addition, Donkada and Menon26 have presented an opti-mization approach with cast-in-place concrete counterfort retaining walls of varying heights that takes into account geometric, reinforcement, and cost parameters. A report summarized the work done in the �eld and showed details
Figure 5. Steel reinforcement details of the totally prefabricated counterfort retaining wall system. Note: L = center-to-center spacing between two adjacent counterforts. Note: no. 4 = 13M; no. 5 = 16M; no. 6 = 19M; 1 in. = 25.4 mm; 1 ft = 0.305 m.
4 ft 11 in.4 ft 11 in.2 ft 2 ft
Counterfort stem
Face panel
Anchors 1 to 5
Counterfort main reinforcement
Anchor 1Anchor 5
No. 4 at 12 in. horizontalNo. 4 at 12 in. vertical
Headed anchors
Counterfort main reinforcement 4 no. 6 bars
No. 6 anchors
No. 7 anchors
90 degree hooked bar:No.4 reinforcing bar at 9 in. vertical spacing and 4 in. development into the face panel
4 ft 11 in.4 ft 11 in.2 ft 2 ft
Extension above counterfort stem Hooked C bars:
No. 4 reinforcing bar at 9 in. vertical spacing and 4 in. development into the the face panel
No. 5 at 12 top and bottomboth direction
LL0.41L 0.41L
A
Section B-B
Section A-A
B B
A
4 ft 11 in.4 ft 11 in.2 ft 2 ft
Counterfort stem
Face panel
Anchors 1 to 5
Counterfort main reinforcement
Anchor 1Anchor 5
No. 4 at 12 in. horizontalNo. 4 at 12 in. vertical
Headed anchors
Counterfort main reinforcement 4 no. 6 bars
No. 6 anchors
No. 7 anchors
90 degree hooked bar:No.4 reinforcing bar at 9 in. vertical spacing and 4 in. development into the face panel
4 ft 11 in.4 ft 11 in.2 ft 2 ft
Extension above counterfort stem Hooked C bars:
No. 4 reinforcing bar at 9 in. vertical spacing and 4 in. development into the the face panel
No. 5 at 12 top and bottomboth direction
LL0.41L 0.41L
A
Section B-B
Section A-A
B B
A
Side elevation
Section A-A
Section B-B

76 PCI Journal | May–June 2017
results obtained from the experimental testing and the �nite element analysis (as will be discussed in later sections) indicated that the de�ection at the top of the wall was too small to initiate minimum active pressure as per Table C3.11.1-1 of the AASHTO LRFD speci�cations. The �nal design submitted to the precast concrete facility assumed at-rest soil conditions.
The concrete mixture design proportions include the fol-lowing:
• sand: 1325 lb/yd3 (785.2 kg/m3)
• coarse aggregate: 1527 lb/yd3 (904.9 kg/m3)
• cementitious materials: 700 lb/yd3 (415 kg/m3)
• water-cement ratio w/c: 0.38
• air content: 6.50%
Table 1 shows the results of the concrete average com-pressive strength properties for each component in the totally prefabricated counterfort retaining wall system. The ultimate compressive strength of concrete was 7200 psi (50 MPa). This value was used for the design and �nite element analysis of both the wall and base slab.
Design limit states and stability requirements
Service I and Strength I design limit states are used for load calculations per Table 3.4.1-1 of the AASHTO LRFD speci�cations. Table 2 gives the load notation and factors.
The check for stability requirements is performed at the service limit state for the overturning moment, bearing resistance, eccentricity, and sliding. At the strength limit state, stability is checked for bearing resistance, eccen-
• modulus of elasticity of concrete Ec = 4888 ksi
(33,700 MPa)
• modular ratio n (Es/E
c) = 6
• dry unit weight of the soil γd = 125 lb/ft3 (2000 kg/m3)
• angle of internal friction ϕs = 28.0 degrees
• coef�cient of active earth pressure ka
= 0.361
• allowable soil bearing capacity assumed for designq
all = 2.5 kip/ft2 (120 kN/m2) (assumed to obtain worst-
case scenario for weak soil conditions)
• allowable soil bearing resistance provided by geotech-nical report q
all_prov = 10 kip/ft2 (480 kN/m2) (actual soil
conditions in the �eld)
• factored soil bearing resistance provided by geotech-nical report q
u_prov = 15 kip/ft2 (720 kN/m2) (actual soil
conditions in the �eld)
Soil properties were obtained from the geotechnical report. For testing purposes, the initial design assumed active earth pressure to mitigate the worst-case scenario. However, the
Table 1. Concrete compressive strength of di�erent wall components at 28 days
SpecimenNumber of specimens
Specimen size, in.Average ultimate
stress, psi
Base 9 6 × 12 9400
Wall 7 6 × 12 7280
Grout 4 3 × 6 7660
Note: 1 in.= 25.4 mm; 1 psi = 6.895 kPa.
Table 2. Load notation and load factors
Load description Notation
Load Factors
Service IStrength I
Minimum Maximum
Vertical loads
Self-weight of face panel DC1
1.0 0.9 1.25Self-weight of base DC2
Self-weight of counterfort stem DC3
Vertical earth pressure on base heel EV41.0 1.0 1.35
Vertical earth pressure on base toe EV5
Vertical surcharge load LSv 1.0 0.0 1.75
Lateral loads
Horizontal earth pressure PEH 1.0 0.9 1.50
Horizontal surcharge load LSh 1.0 0.0 1.75

77PCI Journal | May–June 2017
used to simulate the concrete volume. The cracking and crushing of concrete are de�ned by the Willam and Warnke model, though the crushing capability of concrete was ignored in several studies to avoid �ctitious crushing.28–30
Instead, uniaxial multilinear stress-strain concrete cylinder test data from an actual test specimen were used to de�ne the compressive behavior of concrete. A value of 0.2 was used for the Poisson’s ratio of the concrete.
The steel reinforcement and anchors were modeled with the steel link elements. The steel material was assumed to be bilinear elastic-perfectly plastic—that is, identical in both tension and compression—with an elastic modu-lus of 29,000 ksi (200 GPa) and Poisson’s ratio of 0.2.31
The interface between the concrete elements is assumed to be fully bonded. Contact elements were used to de�ne the frictional interface between the bottom surface of the precast concrete face panel and the top surface of the base slab.
Loading and boundary conditions
A perfectly elastic medium was placed below the retain-ing wall to mitigate the soil conditions. The �nite element
tricity, and sliding, taking into account the minimum and maximum load combinations speci�ed in sections 11.6.3.2, 11.6.3.3, and 11.6.3.6, respectively, of the AASHTO LRFD speci�cations. Table 3 summarizes the stability checks and shows that the design meets the stability requirements per section 11.6.3 of the AASHTO LRFD speci�cations. The system was not studied for overall stability. The total service load of 144 kip (641 kN) was calculated using a Service I limit state and the total ultimate load of 216.5 kip (963.0 kN) was calculated using a Strength I limit state.
Nonlinear finite element analysis
Simulation software was used to develop a three-di-mensional �nite element model to analyze the structural behavior of the totally prefabricated counterfort retaining wall system.
Following is the purpose of �nite element modeling:
• to verify whether the design based on the AASHTO LRFD speci�cations satis�es the structural stability and integrity of the system under both service and ultimate loads
• to investigate the de�ection of the wall at the top of the wall, H/2, and H/3, where H is the height of wall
• to evaluate the structural behavior of anchors connect-ing the counterforts and base slab
• to investigate the required amount of steel reinforce-ment in the counterforts
Concrete, steel reinforcement, and anchors
A three-dimensional solid concrete element model able to simulate both cracking and crushing of concrete was
Figure 6. Deflection versus load plots at H/3, H/2, and top of wall. Note: H = height of wall.
0 2 4 6 8 10 12 14
0
200
400
600
800
1000
0
50
100
150
200
250
0.00 0.10 0.20 0.30 0.40 0.50 0.60
Deflection, mm
Load
, kN
Load
, kip
Deflection, in
Top of wall Top of wall T
H/2 H/2 H
H/3 H/3 H
Table 3. Stability checks based on 2014 AASHTO LRFD specifications 11.6.3
Limit state Stability check Factor of safety/limit Calculated factor of safety Check
Service I
Failure due to overturning 2 3.39 OK
Failure due to sliding 1.5 1.55 OK
Eccentricity limits1/3 base 5
OK OK2/3 base 10
Bearing capacity failure 2.9 2.47 OK
Strength I
Failure due to sliding 1.5 1.8 OK
Eccentricity limits1/6 base 2.5
OK OK5/6 base 12.5
Bearing capacity failure 7.25 6.41 OK

78 PCI Journal | May–June 2017
Deflection versus load curve Figures 6 and 7 show the de�ection results and de�ection contours, respectively, of the totally prefabricated counterfort retaining wall system obtained from �nite element analysis at different heights of the face panel. Figure 6 shows that under service loads, the de�ection at the top of the wall was estimated to be about 0.21 in. (5.4 mm). In addition, the de�ections at midheight H/2 and one-third height H/3 of the wall were 0.072 and 0.1 in. (1.7 and 2.5 mm), respectively. When the load was increased to 216.5 kip (963.0 kN), the de�ection at the top of the wall was 0.44 in. (11 mm) and the de�ections at midheight H/2 and one-third height H/3 of the wall were 0.2 and 0.13 in. (5.2 and 3.3 mm), respectively.
Strain versus stress results in anchors Figure 8presents the strain variations in the anchors for the middle counterfort. Figure 8 shows that the strain values exhibit a decreasing general trend starting from the outermost anchor approaching the face of the face panel, as expected. It reveals that anchor 1, the farthest anchor from the face panel (no. 7 [22M] anchor), yielded at a load of 170 kip (760 kN). Anchor 2 shows a yielding strain of 2083 × 10-6
at a load of 215 kip (956 kN). Anchors 3, 4, and 5 did not yield. The described behavior of the anchors was expect-ed because anchors with longer moment arms experience higher �exural moment.
Experimental program
Fabrication
A totally prefabricated counterfort retaining wall system was formed of two totally precast concrete components: the face panel and counterforts, which are cast as one component, and the base slab, which is cast as a separate component. Based on structural analysis supported by �nite element analysis, the face panel and counterforts are reinforced with one layer of steel reinforcement. The base slab is reinforced with
model was focused on studying the structural behavior of the totally prefabricated counterfort retaining wall system. Therefore, soil–structure interaction under various soil conditions was ignored. An elastic foundation modulus of 40 ksi (280 MPa) was assigned to the soil medium, which corresponds to medium clay soil. The analysis was conducted over several load steps. The sequence of load steps included the self-weight of the wall, soil back�lling, a 2 ft (0.6 m) surcharge load to simulate the Service I limit state (according to the AASHTO LRFD speci�cations), and a nodal load of 200 kip (890 kN) from the hydraulic cylinders that was applied at one-third the height of the wall H/3 (divided over the three counterforts) to carry the system to ultimate load capacity (Strength I). The nodal load was distributed over a group of nodes that outlines the location on which the actual load was applied during experimental testing.
Analysis and discussion of nonlinear finite element analysis results
The de�ections of the wall as well as the variation of the strain in the concrete, steel reinforcement, and anchors are discussed in this section.
Figure 8. Strain versus applied load at each anchor in the middle counterfort.
0 0.001 0.002 0.003 0.004
0
200
400
600
800
1000
0
50
100
150
200
250
0.000 0.001 0.002 0.003 0.004
Strain, mm/mm
Load
, kN
Load
, kip
Strain, in./in.
Anchor 1 Anchor 2 Anchor 3 Anchor 4 Anchor 5
Figure 7. Deflection results obtained from finite element analysis.
Deflection contours at service load of 144 kip (641 kN) Deflection contours at ultimate load of 216.5 kip (963.0 kN)

79PCI Journal | May–June 2017
the base slab from one side and the counterforts from the other side through the headed anchors.
The erection process was started at the level of the base slab. The base slab was cast and delivered to the site. It was placed 2 ft (0.6 mm) below grade level on spacers, which guaranteed a 1 in. (25 mm) offset from the ground to allow for grouting below the base. The base was grouted to elim-inate any voids so that the base would rest uniformly on the ground. The grout was pumped through four holes until all voids below the base were �lled. The wall was erected by aligning each headed anchor with the speci�ed shear pocket of the base slab. The shear pockets were then �lled with high-performance, fast-setting (15 minutes) grout.
Two circular openings were included in the design of the two external counterforts for handling and erec-tion purposes. The effect of wind load on the stability of the system during construction was calculated and was found to be negligible. Thus, the crane was able to handle the wall without a temporary bracing system.
Setup and testing procedure
Testing on the erected retaining wall was conducted in the following order:
1. Soil back�lling. Soil pressure was applied by back�lling the retaining wall with soil with a 95% compaction level.
2. Surcharge load. The load was applied using bulldozers to simulate live surcharge conditions.
3. Test 1. Two hydraulic cylinders applied up to 178 kip (792 kN) at H/3 of the wall acting at six points distributed over three counterforts. It
two identical layers. Table 4 summarizes the steel reinforcement of the totally prefabricated counterfort retaining wall system at the level of each component.
Each counterfort is connected to the base slab using �ve headed anchors. Each headed anchor is embed-ded 11.5 in. (292 mm) into the base slab. The anchors are placed with 1 ft (0.3 m) spacing starting at 6 in. (150 mm) from the internal face of the wall. The de-velopment length of the L bars can also be reduced by reducing the spacing between them. The details for fab-rication and erection can be found in Farhat et al.32
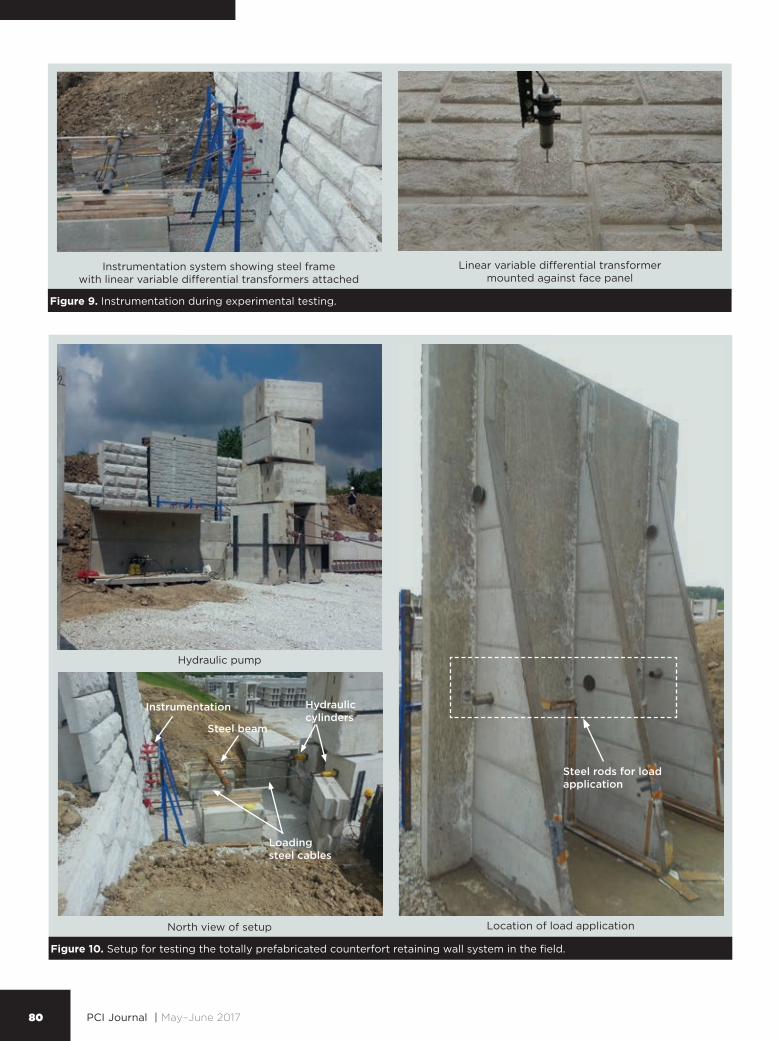
Instrumentation
Linear variable differential transformers were placed against the face panel of the wall at seven different locations. Four were placed at one-third of the height of the wall and three at midheight of the wall. The purpose of this con�guration was to study the de�ection of the wall at the counterforts and at the midspan between them. The seven linear variable differential transformers were �xed to a steel frame against the wall and connected to a portable data logger system that provided instantaneous reading of the wall de�ection.
Forty-two strain gauges were installed at different loca-tions. Twelve strain gauges were mounted on concrete, and the rest were mounted on steel covering the critical locations of the totally prefabricated counterfort retain-ing wall system, such as the anchors, the face panel, the base slab, and the main reinforcement in the coun-terforts and extensions above the counterfort. Figure 9shows a typical linear variable differential transform-er and strain gauge attachment to the face panel.
For the face panel, strain gauges were used to study the response of the steel at the locations of positive (midspan) and negative (counterfort) moments.
Erection
The erection process is divided into three stages:
1. Placement of the base slab. The base slab is placed and leveled on-site. Grout is pumped below the slab to eliminate any voids and to ensure uniform distribution of the soil pressure below the base.
2. Erection of the wall component. The wall compo-nent is erected using steel cables wrapped in openings in the counterforts intended for handling purposes. The wall is placed and leveled so that each head-ed anchor is placed in a speci�ed shear pocket.
3. Grouting of shear pockets. The shear pockets are grouted to ensure the required anchorage between
Table 4. Reinforcement details at all wall sections
Assembly part
Number of layers
Vertical Horizontal Inclined
Face OneNo. 4 at 12 in.
No. 4 at 12 in.
n/a
Counterfort OneNo. 4 at 12 in.
No. 4 at 6 in.
Four no. 6
Base TwoNo. 5 at 12 in.
No. 5 at 12 in.
n/a
Anchors n/aTwo no. 7 and three no. 6 on each counterfort
Note: n/a = not applicable. No. 4 = 13M; no. 5 = 16M; no. 6 = 19M; no. 7 =
22M; 1 in. = 25.4 m.
80 PCI Journal | May–June 2017
Figure 9. Instrumentation during experimental testing.
Instrumentation system showing steel frame with linear variable di�erential transformers attached
Linear variable di�erential transformer mounted against face panel
Figure 10. Setup for testing the totally prefabricated counterfort retaining wall system in the field.
North view of setup
Hydraulic pump
Location of load application
Steel rods for load application
Instrumentation
Steel beam
Hydraulic cylinders
Loading steel cables

81PCI Journal | May–June 2017
(38 mm) diameter steel cables were hooked to the hydrau-lic cylinders from one side and to a 7 in. (180 mm) diam-eter solid steel section from the other side. The solid steel section served as a connection element to transfer the load from the cylinders to the wall. Figure 11 shows a diagram of the testing setup as performed in the �eld.
Analysis and discussion of experimental test results
Deflection results
Figures 12 and 13 show the de�ection results. The data were collected continuously throughout the project. The testing times are indicated in the �gures. After each test was completed, the load was removed. The three linear variable differential transformers located at H/2 showed similar readings. The de�ections at H/2 showed a maximum value of 0.1 in. (2.5 mm) at the end of back�lling. Upon adding the surcharge load, the de�ection at H/2 increased to 0.115 in. (2.85 mm). Finally, the registered de�ection at tests 1, 2, 3, and 4 were 0.158, 0.160, 0.163, and 0.212 in. (4.01, 4.06, 4.14, and 5.38 mm), respectively.
The de�ection results show that the critical locations at left midspan, middle counterfort, and right midspan at H/3 of the wall exhibit a similar behavior. Figure 13 shows that the maximum de�ection at H/3, recorded during test 4, was found to be 0.167 in. (4.25 mm) at the left counterfort. A slightly smaller value of 0.14 in. (3.6 mm) was recorded by the three other linear variable differential transformers at the same level.
The test results show consistent de�ection values between the counterforts and the midspans of the walls throughout various testing times. This is due to the ef�cient geometric con�guration that minimizes the load resisted by the face panel. The counterforts are designed to resist the total lateral load, while the face panel is designed to resist the lateral load due to soil pressure in the longitudinal direction spanning two counterforts. Thus, using a small
was followed by a hydraulic actuator delivering 160 kip (710 kN) at the top of the wall.
4. Test 2. Two hydraulic cylinders applied up to 136 kip (605 kN) at H/3 of the wall acting at six points distrib-uted over three counterforts.
5. Test 3. Two hydraulic cylinders applied up to 97 kip (430 kN) at H/3 of the wall acting at two points on the middle counterfort.
6. Test 4. Two hydraulic cylinders applied up to 192.4 kip (855.8 kN) at H/3 of the wall acting at six points distributed as two points per counterfort.
Soil backfilling The soil was �lled at 6 in. (150 mm) increments. At each increment, the soil was compacted
using a sheep-foot roller compacting machine. The goal was to maintain a 95% compaction level. The proctor test revealed that the wet density of the soil was 130 lb/ft3
(20 kN/m3). The moisture level by the end of back�lling was estimated to be 12%. The top surface of the soil was �nished at almost a level surface.
Surcharge load To simulate the surcharge load stated by the AAHSTO LRFD speci�cations that would account for the live load, two vehicular live loads of 27 and 37 kip (120 and 165 kN) were placed at the top of the back�ll. A bulldozer was placed 2 ft (0.6 m) away from the wall to simulate a worst-case scenario. The live load application was followed by the application of a lateral load of 16 kip (71 kN) at the top of the wall by a hydraulic cylinder mounted against the bulldozer.
Load application using hydraulic cylinders Tests 1 through 4 were performed using two hydraulic cylin-ders (Fig. 10). The cylinders were anchored to a stack of 10 concrete blocks for additional support. Four 1.5 in.
Figure 12. Deflection measured by the three linear variable di�erential transformers at H/2. Note: H = height of wall.
0
1
2
3
4
5
6
0
0.05
0.1
0.15
0.2
0 48 96 144 192 240 288 336
Def
lect
ion,
mm
Def
lect
ion,
in.
Elapsed time, hours
Left counterfort (C1) Left midspan Middle counterfort (C2)
Test 1 Test 2 Test 3
Soil backfill
Live load surcharge
Test 4
Figure 13. Deflection measured by the four linear variable di�erential transformers at H/3. Note: H = height of wall.
0
1
2
3
4
5
6
0
0.05
0.1
0.15
0.2
0 48 96 144 192 240 288 336
Def
lect
ion,
mm
Def
lect
ion,
in.
Elapsed time, hours 144 Elapsed time, hours 144 192 Elapsed time, hours 192
Left counterfort (C1) Left midspan Middle counterfort (C2) Right midspan
Test 1 Test 2 Test 3
Soil backfill
Live load surcharge
Test 4
Figure 11. Representation of testing setup as performed in the field. Note: 1 in. = 25.4 mm; 1 ft = 0.305 m.
1.5 in. steel cable 1.5 in. steel cable
3/4 in. steel cables
1 ft 6 in.
3 in.
3 in.
Concrete block for support
Steel plate for anchorage
Hydraulic cylinder
Cable support fixture
7 in. steel beam
3 in. opening to extend cable
3 in. opening to place the anchorage rod

82 PCI Journal | May–June 2017
followed by a gradual increase throughout testing. This increase was in the form of sharp spikes whenever the load was applied by hydraulic cylinders. The spikes were followed by drops as soon as the load was removed. This indicates that the anchors did not yield until loaded to an ultimate load (test 4). The yielding limit of the anchor was observed in test 4, where it reached 2421 × 10-6 when sub-jected to an ultimate load of 192.4 kip (855.8 kN).
The high tensile strain result in the outermost anchors is expected because of the large moment arm measured from the outside face of the face panel to the center of each an-chor. As a result, the design is controlled by the outermost anchors, for which no. 7 (22M) bars or higher are recom-mended. Smaller bar sizes can be used for anchors close to the face panel (anchors 4 and 5) because they experience smaller tensile strain. The anchors also play an important role in maintaining the overall stability of the system.
Figure 15 also shows a pattern in the strain readings of gradual increases followed by decreases over time between tests. A gradual drop in the strain reading was observed during nighttime and the inverse during the day. This is attributed to temperature variations between day and night as the test was performed in �eld conditions.
Face panel and main reinforcement in the counterfort
A thorough visual inspection of the face panel revealed no visible cracks in the front of the face panel during testing. This is attributed to the ef�ciency of the geometric con�guration, which helped lower the stresses in the face panel and achieved a successful design using one layer of steel with a wall thickness of 6 in. (150 mm). The results showed that no yielding occurred in the main reinforcement of the face panel. Figure 16 shows sample strain readings in the face panel at the left midspan between counterforts and over the middle counterfort. The maximum strain readings at H/3 at the midspan between the counterforts and over the counterforts were similar and ranged from 500 to 600 × 10-6.
spacing-to-height ratio (0.245) minimizes the lateral loads caused by soil pressure on the face panel.
To assume active earth pressure, the AASHTO LRFD speci�cations specify a de�ection-to-height ratio ranging from 0.001 to 0.01 for soil types varying from dense sand to compacted clay, respectively (0.001 < D/H < 0.01, where D is the de�ection at the top of the wall). The value of de�ection necessary to initiate active earth conditions corresponding to a wall height of 20 ft 2 in. (6.09 m) varies from 0.241 to 2.41 in. (6.12 to 61.2 mm). The maximum de�ection obtained from the experimental testing at service limit state was about 0.212 in. (5.39 mm). This indicates that the de�ection at the top of the wall was too small to initiate the minimum active pressure per Table C3.11.1-1 of the AASHTO LRFD speci�cations. Thus, the design of the counterfort retaining wall in future applications should consider at-rest earth conditions.
Strain in the anchors
Figure 14 presents the maximum strain readings in the headed anchors at the middle and left counterforts. Figure 20 shows that the strain results in the headed anchors varied depending on the location of the anchor with respect to the wall and location of the counterfort. The outermost two anchors from the face panel gave the highest strain readings due to their longer moment arms with respect to the wall. These readings gradually decreased in the anchors closer to the wall. The strain readings in anchors 1 and 2 at the middle counterforts were 2659 × 10-6 and 2203 × 10-6, respectively, and therefore exceeded the yield limit strain of steel, 2070 × 10-6. The strain reading in anchor 1 at the left counterfort was found to be 2421 × 10-6, which also exceeded 2070 × 10-6. However, anchor 2 showed a strain value of 2010 × 10-6, which is close to the yield limit strain of steel.
Figure 15 shows the strain variation at the testing times for anchor 1 (no. 7 [22M] bar), located at the left coun-terfort throughout various loading conditions. During soil back�lling, the strain increased to 1360 × 10-6. It was then
Figure 14. Maximum strains in headed anchors at the middle and left counterforts. Note: Strain units are microstrain.
2659
2203
1748
1292836
2421
2010
1599
1189778
0
500
1000
1500
2000
2500
3000
1 2 3 4 5 6
Max
imum
str
ain,
Number of anchors from farthest to closest to face of wall
Anchor 2 (no. 7)
Anchor 3
(no. 6)
Anchor 4
(no. 6)
Anchor 1 (no. 7)
7) 7) 7) 7) 7) 7)
Anchor 5Anchor 5(no. 6)
Internal face of wall
Left counterfort Middle counterfort Middle counterfort
Figure 15. Strain variation curve at the times of testing for anchor 1 in left counterfort. Note: Strain units are microstrain.
0
500
1000
1500
2000
2500
3000
0 48 96 144 192 240 288 336
Stra
in,
Elapsed time, hours
Test 1 Test 1 Test 1 Test 2 Test 2 Test 2 Test 3 Test 3 Test 3
Soil backfill
Live load surcharge surcharge surcharge Test 4 Test 4 Test 4

83PCI Journal | May–June 2017
ture and shrinkage reinforcement (vertical bars) are used to control the mode of failure by arresting the cracks propagating toward the middle of the counter-fort web. Thus, the failure mode of the counterforts can be controlled by reducing the spacing of the vertical bars to obtain a controlled �exural mode of failure.
Results and analysis for strain in top extension steel
Figure 19 shows the strain readings in the steel at the top extension of the left and middle counterforts. It shows that the strain readings of the steel reinforcement at the top of the counterforts at the extension steel exhibited no signi�cant changes except in test 1. In test 1, a 16 kip (71 kN) load was applied at the top of the wall using a hydraulic cylinder mounted against the bulldozer, which in turn was used as live load surcharge resulting in high bending stresses at the level of the extension steel. These stresses were re�ected in a high jump in the strain readings: 1100 × 10-6 in the left counterfort and about 1700 × 10-6 in the middle counterforts. These strain readings indicate that the steel at the top of the counterforts did not yield when subjected to a lateral load of 16 kip.
Figure 17 gives the strain readings at the main reinforce-ment of the right and middle counterforts. The strain readings show a maximum value of 1957.5 × 10-6 record-ed in test 1 and almost similar values recorded in tests 2 and 4. These values dropped to their initial values after each test. This indicates that the main reinforcement did not undergo yielding. This behavior was not witnessed in test 3 due to the nature of the loading setup, which only focused on the behavior of the middle counterfort.
Cracks developed in the concrete at the level of the inclined surface to the counterforts due to a high overturning moment resisted by the T section of the counterforts and the face panel. This observation was veri�ed using �nite element analysis (Fig. 18).
The �nite element analysis revealed an important as-pect of the counterfort behavior. Anchors are subject-ed to tension when the lateral loads are applied. Thus, cracks are expected to generate at the location of the anchors. These cracks are likely to propagate toward the middle of the counterfort as the load increases, as proved by the �nite element analysis. (Fig. 24).
In this case, shear failure will be the dominant mode of failure due to the large counterfort depth. Tempera-
Figure 18. Development of cracks in the counterforts and base slab using finite element analysis.
Crack development at 67 kip (300 kN)
Crack development at 216.5 kip (963.0 kN)
Crack development at 144 kip (641 kN)
Figure 17. Strain readings at the main reinforcement of the right and middle counterforts. Note: Strain units are microstrain.
0
500
1000
1500
2000
2500
0 48 96 144 192 240 288 336
Stra
in,µ
Elapsed time, hours
Test 1 Test 2 Test 3
Soilbackfill
Live load surcharge Test 44
Figure 16. Time versus strain readings for face panel steel re-inforcement located at H/3 at the middle counterfort and left midspan. Note: Strain units are microstrain. H = height of wall.
0 100 200 300 400 500 600 700 800 900
1000
0 48 96 240 288 336
Stra
in,
144 192 Elapsed time, hours
Middle counterfort Left midspan Test 1 Test 2 Test 2 Test 2 Test 2 Test 3 Test 3 Test 3 Test 3 Live load
surcharge surcharge surcharge surcharge Test 4 Test 4 Test 4 Test 4
Soil backfill

84 PCI Journal | May–June 2017
�nite element model veri�ed the behavior exhibited by the totally prefabricated counterfort retaining wall system during experimental testing.
Conclusion
Full-scale experimental testing and nonlinear �nite element analysis were performed to examine the overall structural behavior of a totally prefabricated counterfort retaining wall system. The wall was 20 ft 2 in. (6.09 m) high and 13 ft 10 in. (4.21 m) wide. The system was optimized using conventional beam theory and �nite element analysis.
Headed anchors played the most important role in enforcing full composite action between the counterfort and the base slab. The wall was subjected to soil back�lling, live load surcharge, and additional loads of up to 192.4 kip (855.8 kN) using hydraulic cylinders to bring the system to ultimate load. The de�ection in the face panel at H/3 and H/2 was monitored. In addition, strain readings in the headed anchors, main counterfort reinforcement, face panel, and base slab were monitored.
Based on the experimental test and the �nite element anal-ysis results, the following can be concluded:
Validation of nonlinear finite element analysis results with experimental results
At service load, the �nite element analysis de�ection results at H/2 and H/3 of the wall were 0.1 and 0.065 in. (2.5 and 1.6 mm), respectively. The experimental results showed average de�ections at H/2 and H/3 equal to 0.11 and 0.075 in. (2.8 and 1.9 mm), respectively. In addition, the nonlinear �nite element analysis de�ections at ultimate load at H/2 and H/3 were 0.203 and 0.13 in. (5.16 and 3.3 mm), respectively. The experimental results at ultimate load showed average de�ections at H/2 and H/3 of 0.22 and 0.14 in. (5.6 and 3.5 mm), respectively. The nonlinear �nite element analysis results are in good agreement with the experimental results (Fig. 20).
The de�ection at the top of the wall was estimated us-ing linear extrapolation for the experimental results. The de�ection values at the top were found to be 0.22 in. (5.6 mm) at service load and 0.44 in. (11 mm) at ultimate load. The results obtained from linear extrapolation were con�rmed using nonlinear �nite element analysis. Table 5summarizes the experimental test results compared with the nonlinear �nite element analysis results.
The �nite element analysis results for the headed anchors showed a good correlation with the experimental test results. The �nite element analysis showed that at ultimate load, the strain was estimated to be about 2780 × 10-6 in the outermost anchor at 215.5 kip (963.0 kN) load (test 4). In addition, the trend obtained from the �nite element analysis at ultimate load showed that yielding occurs at the �rst two anchors (anchors 1 and 2). The strain readings in the anchors decreased as they were taken closer to the face panel (moving from anchor 1 to 5).
Figure 21 presents a comparison of strain readings in the anchors between the experimental test results and the �nite element analysis results. It shows that the results obtained from the �nite element analysis are validated by those ob-tained from the experimental testing. The anchors exhibited a trend consistent with that of the experimental results. The
Figure 19. Strain readings in steel at the top extension of the left and middle counterforts. Note: Strain units are microstrain.
-400
100
600
1100
1600
2100
0 0 0 0 48 48 96 144 192 240 288 336 336
Stra
in,
Elapsed time, hours
Left counterfort Middle counterfort
Test 1 Test 2 Test 3
Soil backfill
Live load surcharge Test 4
Figure 20. Deflection results from the experimental test and nonlinear finite element analysis at service load.
0
1
2
3
4
5
6
0 0.05 0.1
0.15 0.2
0.25 0.3
0.35 0.4
0.45 0.5
H H/3
Def
lect
ion,
mm
Def
lect
ion,
in.
Finite element analysis (ultimate) Experimental test (ultimate) Finite element analysis (service) Experimental test (service)
t t t
Figure 21. Comparison of strain readings in the anchors be-tween experimental results and nonlinear finite element analy-sis. Note: Strain units are microstrain. no. 6 = 19M; no. 7 = 22M.
2659 2659
2204 2204
1748 1748 1292
837
0
500
1000
1500
2000
2500
3000
1 2 3 4 5 6
Max
imum
str
ain,
Linear (experimentalLinear (experimental ttest) est) test) ttest) tLinear (nonlinear finite element analysis)
Anchor 2 (no. 7)
Anchor 3 (no. 6)
Anchor 4 (no. 6)
Anchor 5(no. 6)
Anchor 1 (no. 7)
Internal face of wall8566'
Number of anchors from farthest to closest to face of wall

85PCI Journal | May–June 2017
bending moments. This reduces the overall volume of concrete, which provides great advantages in transpor-tation and cost reduction.
• Cracks can initiate in the regions of the internal anchors that are subjected to tensile stresses. These cracks propagate toward the web of the counterforts as the load increases. The spacing between the vertical reinforcement in the counterfort stems should be reduced to 6 in. (150 mm) to provide an arrest mech-anism for the cracks and prevent shear failure in the counterforts, as veri�ed by �nite element analysis.
• The totally prefabricated counterfort retaining wall system exhibited a suf�ciently good performance for use in highway applications. It satis�es the need for fast-track construction. Although the impact factor speci�ed by the AASHTO LRFD speci�cations was implemented in the design, further research might be required to study the behavior of totally prefabricated counterfort retaining wall systems under traf�c collision force.
Acknowledgments
This study was funded and supported by Utility Concrete Products LLC (UCP) in Morris, Ill. The authors thank UCP for performing the fabrication and erection and for providing all of the means for the experimental testing that was performed at the UCP facility. In addition, the authors thank Claudio Fazio from V3 for his help and support. Special thanks go to all who provided help and support to complete this project.
References
1. Farhat, M., M. Rahman, M. Ibrahim, and M. A. Issa. “Design Optimization and Modeling of a Totally Precast Concrete Counterfort Retaining Wall System”
• Headed anchors showed excellent performance in maintaining the composite action between the precast concrete wall and the base slab at service and ultimate loads. This was veri�ed by the nonlinear �nite element analysis and the experimental testing. The de�ection measured at the midheight of the wall was found to be about 0.2 in. (5 mm). Counterforts added stiffness to the structure by increasing the section at which the bending moment is resisted due to the applied load. The L bars that connected the face panel to the stems were found to be effective in maintaining the compos-ite action between both components.
• The strain readings in the anchors indicate that the outermost anchors experienced the highest strain. The design is controlled by the outermost anchors, and smaller bar sizes can be used for anchors close to the face panel because they experience smaller tensile strain. In addition, the strain readings in the main steel of the counterforts showed that the counterforts resist the entire subsequently applied load. Therefore, the following two assumptions can be made by the designer:
— The anchors should be properly designed to resist the entire applied bending moment and shear forces.
— When the anchors are designed, the main steel in the counterforts should be designed to resist the entire lateral load, assuming that the bottom of the counterforts is fully bonded to the base slab.The anchors also play an important role in main-taining the overall stability of the system.
• The steel in the face panel showed insigni�cant and almost equivalent readings in the positive and negative regions. This supports the assumption that the cross section can be signi�cantly reduced and one layer of steel can be used to resist both positive and negative
Table 5. Summary of deflection results compared with nonlinear finite element analysis
Load level Location Experimental data, in.Nonlinear finite element
analysis data, in.Di�erence, %
Ultimate load (216 kip)
H 0.440 0.438 0.40
H/2 0.220 0.203 7.59
H/3 0.140 0.129 7.57
Service load (144 kip)
H 0.220 0.214 2.82
H/2 0.110 0.099 9.62
H/3 0.075 0.065 12.74
Note: H = height of wall. 1 in. = 25.4 mm; 1 kip = 4.448 kN.

86 PCI Journal | May–June 2017
perimental Behavior of Full-Depth Precast Concrete Panels for Bridge Rehabilitation.” ACI Structural Jour-nal 97 (3): 397–407.
14. Issa, M. A., A. Idriss, I. I. Kaspar, and S. Y. Khayyat. 1995. “Full Depth Precast and Precast, Prestressed Concrete Bridge Deck Panels.” PCI Journal 40 (1): 59–80.
15. Issa, M. A., A. A. Yousif, M. A. Issa, I. I. Kaspar, and S. Y. Khayyat. 1998. “Analysis of Full Depth Concrete Bridge Deck Panels.” PCI Journal 43 (1): 74–85.
16. Billington, S. L., R. W. Barnes, and J. E. Breen. 2001. “Alternate Substructure Systems for Standard Highway Bridges.” Journal of Bridge Engineering 6 (2): 87–94.
17. Billington, S. L., R. W. Barnes, and J. E. Breen. 1998. A Precast Substructure Design for Standard Bridge Systems. Report 1410-2F. Austin, TX: Center for Transportation Research, University of Texas at Austin.
18. Culmo, M. P. 1991. “Bridge Deck Rehabilitation Using Precast Concrete Slabs.” In Eighth Annual Internation-al Bridge Conference Proceedings, June 1991, Pitts-burgh, Pennsylvania, IBC-91-55, 389–396. Pittsburgh, PA: Engineers’ Society of Western Pennsylvania.
19. Culmo, M. P. 2000. “Rapid Bridge Deck Replacement with Full-Depth Precast Concrete Slabs.” Transporta-tion Research Record 1712: 139–146.
20. Badie, S. S., M. C. Baishya, and M. K. Tadros. 1998. “NUDECK—An Ef�cient and Economical Precast Prestressed Bridge Deck System.” PCI Journal 43 (5): 56–74.
21. LoBuono, Armstrong, and Associates. 1996. “Devel-opment of Precast Bridge Structures.” Report prepared for the Florida Department of Transportation.
22. Medlock, R., M. Hyzak, and L. Wolf. 2002. “Inno-vative Prefabrication in Texas Bridges.” In Proceed-ings of the Texas Section, American Society of Civil Engineers, Spring Meeting, March 2002. Austin, TX: American Society of Civil Engineers—Texas Section.
23. Hewes, J. T. 2013. Analysis of the State of the Art of Precast Concrete Bridge Substructure Systems. Report FHWA-AZ-13-687. Phoenix, AZ: Arizona Department of Transportation Research Center.
24. Darwish, I., and M. Kasi. 2013. “Innovative Precast Concrete Cantilever Retaining Wall System.” Aspire, Spring, 21.
In 16th European Bridge Conference in Edinburgh, UK, 22–25 June 2015. Edinburgh, UK: ECS Publications.
2. Farhat, M., M. Rahman, M. Ibrahim, and M. A. Issa. 2014. “Design, Fabrication, Modeling and Experi-mental Study of a Totally Precast Concrete Counter-fort Retaining Wall System for Highways.” In 60th Anniversary 2014 Convention and National Bridge Conference Proceedings. Chicago, IL: PCI. CD-ROM.
3. Senthil, K., M. A. Iqbal, and A. Kumar. 2014. “Be-havior of Cantilever and Counterfort Retaining Walls Subjected to Lateral Earth Pressure.” International Journal of Geotechnical Engineering 8 (2): 167–181.
4. AASHTO (American Association of State Highway and Transportation Of�cials). 2014. AASHTO LRFD Bridge Design Speci�cations. 7th ed., customary U.S. units. Washington, DC: AASHTO.
5. Biswas, M. 1986. “Precast Bridge Deck Design Sys-tems.” PCI Journal 31 (2): 40–94.
6. Hieber, D. G., J. M. Wacker, M. O. Eberhard, and J. F. Stanton. 2005. State-of-the-Art Report on Precast Concrete Systems for Rapid Construction of Bridges. Report WA-RD 594.1. Olympia, WA: Washington State Department of Transportation.
7. Goldberg, D. 1987. “Precast Prestressed Concrete Bridge Deck Panels.” PCI Journal 32 (2): 26–45.
8. PCI Northeast Technical Committee. 2001. Precast Deck Panel Guidelines. Report PCINER-01-PDPG. Belmont: MA: PCI Northeast.
9. PCI Northeast Technical Committee. 2002. Full Depth Precast Concrete Deck Slabs. Report PCINER-02-FD-PCDS. Belmont: MA: PCI Northeast.
10. Tadros, M. K., and M. C. Baishya. 1998. Rapid Replacement of Bridge Decks. NCHRP (National Cooperative Highway Research Program) report 407. Washington, DC: NCHRP.
11. Issa, M. A., A. A. Yousif, and M. A. Issa. 1995. “Con-struction Procedures for Rapid Replacement of Bridge Decks.” Concrete International 17 (2): 49–52.
12. Issa, M. A., A. A. Yousif, M. A. Issa, I. I. Kaspar, and S. Y. Khayyat. 1995. “Field Performance of Full Depth Precast Concrete Panels in Bridge Deck Re-construction.” PCI Journal 40 (3): 82–108.
13. Issa, M. A., A. A. Yousif, and M. A. Issa. 2000. “Ex-

87PCI Journal | May–June 2017
H = height of wall
ka
= coef�cient of active earth pressure (AASHTO LRFD speci�cations 3.11.5.7.1)
L = center-to-center spacing between two adjacent counterforts
n = modular ratio Es/E
c (AASHTO LRFD speci�ca-
tions 5.7.1)
qall
= allowable soil bearing capacity assumed for design
qall_prov
= allowable soil bearing resistance provided by geotechnical report
qu_prov
= factored soil bearing resistance provided by geotechnical report
w/c = water-cement ratio
ϕs
= angle of internal friction
γc
= unit weight of concrete
γd
= dry unit weight of soil
25. Stamnas, P. E., and M. D. Whittemore. 2005. “All-Precast Substructure Accelerates Construction of Prestressed Concrete Bridge in New Hampshire.” PCI Journal 50 (3): 26–39.
26. Donkada, S., and D. Menon. 2012. “Optimal Design of Reinforced Concrete Retaining Walls.” The Indian Concrete Journal, April: 9–18.
27. Culmo, M. P. 2009. Connection Details for Prefabricated Bridge Elements and Systems. FHWA-IF-09-010. McLean, VA: Federal Highway Administration, U.S. Department of Transportation.
28. Kachlakev, D., T. Miller, S. Yim, K. Chansawat, and T. Potisuk. 2001. Finite Element Modeling of Concrete Structures Strengthened with FRP Laminates. SPR 316. Salem, OR: Oregon Department of Transportation.
29. Zhou, S., D. C. Rizos, and M. F. Petrou. 2004. “Effects of Superstructure Flexibility on Strength of Reinforced Concrete Bridge Decks.” Computers & Structures 82 (1): 13–23.
30. Si, B. J., Z. G. Sun, Q. H. Ai, D. S. Wang, and Q. X. Wang. 2008. “Experiments and Simulation of Flexural-Shear Dominated RC Bridge Piers under Reversed Cyclic Loading.” In The 14th World Conference on Earthquake Engineering Proceedings, October 2008, Beijing, China. Heilongjiang, China: Chinese Association of Earthquake Engineering.
31. Al-Rousan, R., and M. Issa. 2011. “Fatigue Performance of Reinforced Concrete Beams Strengthened with CFRP Sheets.” Construction and Building Materials 25 (8): 3520–3529.
32. Farhat, M., and Issa, M. A. “Fabrication and Construction of Totally Prefabricated Counterfort Retaining Wall System for Highways.” Practice Periodical on Structural Design and Construction 22 (2). Published electronically .
Notation
D = de�ection at top of the wall
Ec
= modulus of elasticity of concrete
Es
= steel modulus of elasticity
f 'c
= concrete compressive strength
fy
= yield strength of steel reinforcement

88 PCI Journal | May–June 2017
About the authors
Maen Farhat is a graduate research assistant and PhD candidate in the department of Civil and Materials Engineering at the University of Illinois at Chicago. His current research interests are accelerated bridge construction, precast
concrete, and recycled high-density polyethylene crossties for high-speed rail applications.
Mustapha Ibrahim is a graduate research assistant and PhD candidate in the department of Civil and Materials Engineering at the University of Illinois at Chicago. He is involved in various research topics including concrete
materials with an emphasis on concrete durability and sustainability, applications of advanced composites in concrete, and ultra-high-performance concrete.
Mohsen Issa, PhD, PE, SE, FACI, FASCE, is a professor of structural and materials engineering in the department of Civil and Materials Engineering at the University of Illinois at Chicago. His research interests include structural build-
ings and bridges, development of experimental and analytical techniques for monitoring and rating existing highway bridges, advanced composites, concrete durability, recycled plastic materials, accelerated bridge construction techniques, and sustainability.
Momenur Rahman is a graduate research assistant in the depart-ment of Civil and Materials Engineering at the University of Illinois at Chicago. He is involved in various research topics includ-ing �nite element analysis,
behavior of beam-column joints under seismic loading, lightweight concrete, and applications of advanced composites in concrete.
Abstract
The overall structural behavior of a totally prefabri-cated counterfort retaining wall system was exam-ined experimentally and analytically using nonlinear �nite element analysis. A 20 ft 2 in. (6.09 m) high, 13 ft 10 in. (4.21 m) wide full-scale prototype was designed meeting the requirements of the AASHTO LRFD speci�cations, assembled, constructed, instru-mented, and tested in a precast concrete plant. The design was optimized and validated using nonlinear �nite element analysis. Five headed anchors extended from each counterfort and were grouted to the base slab using truncated conical shear pockets to ensure full connectivity between the precast concrete components.
The results obtained from the experimental testing show that the wall experienced a de�ection of 0.2 in. (5 mm) at its middle. Moreover, the anchors succeeded in maintaining serviceability and ultimate strength requirements. The totally prefabricated precast concrete counterfort retaining wall system has proven to be an innovative and effective solution for multiple requirements such as speed of construction, strength, durability, and safety.
Keywords
Accelerated construction, assessment and monitoring, construction, creative/innovative solutions and structures, headedanchors, retaining wall.
Review policy
This paper was reviewed in accordance with the Precast/Prestressed Concrete Institute’s peer-review process.
Reader comments
Please address reader comments to [email protected] or Precast/Prestressed Concrete Institute, c/o PCI Journal, 200 W. Adams St., Suite 2100, Chicago, IL 60606. J