Full scale dynamic Response Analysis of RC Building under weak seismic motions
20
1/20 FULL SCALE DYNAMIC RESPONSE OF A RC BUILDING UNDER WEAK SEISMIC MOTIONS USING EARTHQUAKE RECORDINGS, AMBIENT VIBRATIONS AND MODELLING Clotaire MICHEL 1 , Philippe GUEGUEN 2 Saber EL AREM 3 , Jacky MAZARS 3 , Panagiotis KOTRONIS 3 1 Applied Computing and Mechanics Laboratory (IMAC), Ecole Polytechnique Fédérale de Lausanne, Switzerland 2 LGIT, University Joseph Fourier, CNRS, LCPC, France 3 3S-R, University Joseph Fourier, CNRS, INPG, Fran ce submitted for Earthquake Engineering and Structural Dynamics Laboratoire de Géophysique Interne et Tectonophysique (LGIT) Université de Grenoble 1381 rue de la Piscine 38041 Grenoble Cedex 9 FRANCE Corresponding author P. Guéguen LGIT BP 53 38041 Grenoble cedex 9 France pgueg@o bs.ujf-gren oble.fr
-
Upload
juan-carlos-jimenez-pacheco -
Category
Documents
-
view
224 -
download
0
Transcript of Full scale dynamic Response Analysis of RC Building under weak seismic motions

8/14/2019 Full scale dynamic Response Analysis of RC Building under weak seismic motions
http://slidepdf.com/reader/full/full-scale-dynamic-response-analysis-of-rc-building-under-weak-seismic-motions 1/20
1/20
FULL SCALE DYNAMIC RESPONSE OF A RC BUILDING UNDER
WEAK SEISMIC MOTIONS USING
EARTHQUAKE RECORDINGS, AMBIENT VIBRATIONS AND MODELLING
Clotaire MICHEL1, Philippe GUEGUEN
2
Saber EL AREM3, Jacky MAZARS
3, Panagiotis KOTRONIS
3
1 Applied Computing and Mechanics Laboratory (IMAC), Ecole Polytechnique Fédérale de
Lausanne, Switzerland
2 LGIT, University Joseph Fourier, CNRS, LCPC, France
3 3S-R, University Joseph Fourier, CNRS, INPG, France
submitted for Earthquake Engineering and Structural Dynamics
Laboratoire de Géophysique Interne et Tectonophysique (LGIT)
Université de Grenoble
1381 rue de la Piscine
38041 Grenoble Cedex 9 FRANCE
Corresponding author
P. GuéguenLGIT
BP 5338041 Grenoble cedex 9
France [email protected]

8/14/2019 Full scale dynamic Response Analysis of RC Building under weak seismic motions
http://slidepdf.com/reader/full/full-scale-dynamic-response-analysis-of-rc-building-under-weak-seismic-motions 2/20
2/20
Abstract
In countries with a moderate seismic hazard, the classical methods developed for strong motion
prone countries to estimate the seismic behaviour and subsequent vulnerability of existing build-ings are often inadequate and not financially realistic. The main goals of this paper are to show
how the modal analysis can contribute to the understanding of the seismic building response and
the good relevancy of a modal model based on ambient vibrations for estimating the structuraldeformation under moderate earthquakes. We describe the application of an enhanced modalanalysis technique (Frequency Domain Decomposition) to process ambient vibration recordings
taken at the Grenoble City Hall building (France). The frequencies of ambient vibrations arecompared with those of weak earthquakes recorded by the French permanent accelerometric net-
work (RAP) that was installed to monitor the building. The frequency variations of the buildingunder moderate earthquakes are shown to be slight (~2%) and therefore ambient vibration fre-
quencies are relevant over the elastic domain of the building. The modal parameters extractedfrom ambient vibrations are then used to determine the 1D lumped-mass model in order to repro-
duce the inter-storey drift under weak earthquakes and to fix a 3D numerical model that could beused for strong earthquakes. The correlation coefficients between data and synthetic motion are
close to 80% and 90% in horizontal directions, for the 1D and 3D modelling, respectively.
Keywords: Modal analysis, seismic behaviour, moderate motion, modelling, City-Hall Grenoble

8/14/2019 Full scale dynamic Response Analysis of RC Building under weak seismic motions
http://slidepdf.com/reader/full/full-scale-dynamic-response-analysis-of-rc-building-under-weak-seismic-motions 3/20
3/20
1. Introduction
Since Omori [1], certainly the first having recorded ambient vibrations in Japanese build-
ings for earthquake engineering applications, an abundant scientific literature has been publishedshowing the interest, advantages but also limitations in performing such weak motion recordings
in buildings (e.g., [2]; [3]; [4]; [5]). Most of the studies were focused on the determination of the
resonance frequencies for earthquake and mechanical engineering. Crawford and Ward [4] andTrifunac [5] showed that ambient vibration-based techniques were as accurate as active methodsfor determining vibration modes and much easier to implement for a large set of buildings. More
recently, Hans et al. [6] showed that the vibration modes extracted from ambient vibrations andactive methods were quite similar in the 10
-5 to 10
-2g range of loading.
Nevertheless, it is well known that under strong seismic loading, the resonance frequency
of existing buildings decreases, thus modifying the seismic demand that depends on the period ofthe building. Celebi [7] and Irie et al. [8] observed this permanent decrease of the resonance fre-
quency computed using strong seismic motion recorded in Californian buildings compared to theambient vibrations. For strongest motions, a recent scientific literature describes the permanent
decrease of the structural frequency of buildings due to structural damage (e.g. [9]; [10]; [11]) aswell as the transient drop of the frequency due to the closing-opening process under shaking of
pre-existing cracks [12].
In the last 20 years, modal analysis techniques in civil engineering applications have beenconsiderably improved thanks to technical (instrumentation, computers) and theoretical develop-
ments in the electrical and mechanical engineering fields ([13]; [14]; [15]; [16]). The frequenciesat which vibration naturally occurs, and the modal shapes which the vibrating system assumes,
are properties of the system. They can be determined analytically using Modal Analysis. Theanalysis of vibration modes is a critical component of the design, for understanding the behaviour
of complex structures and fixing their elastic properties by means of their modal parameters (fre-quency, damping and modal shape). These are also the main parameters controlling seismic
building response and vulnerability since “the natural period of vibration is the single mostinformative fact about the internal structure of a building. Two structures with the same mass dis-
tribution and the same fundamental period may experience shear forces of appreciably differentmagnitudes if the internal structures (mode shapes) are different” (after [3]). The major difficulty
in the dynamic response assessment of existing buildings is the lack of available data such asquality of the materials, structural plans, ageing and structural integrity. In such cases, the classi-
cal tools in earthquake engineering may turn out to be very expensive as for countries with amoderate seismic hazard, like France. In such areas, the cost of enhanced methods is not justified,
let alone for assessments on large sets of buildings, even though the hazard described in the seis-mic design codes would be a motive for it. Models based on the experimental modal values, from
the simplest analytical model to the most comprehensive finite-element model, can be used inevaluating the deformation that occurs in buildings during moderate earthquakes. These simula-
tions can be the linear starting point of a more extensive analysis of the non-linear response forseismic vulnerability assessment (e.g., [17]).
The main goals of this paper are to show how the experimental modal analysis can con-
tribute to the understanding of the seismic building behaviour and the good relevancy of a modalmodel based on ambient vibrations for estimating the structural deformation under moderate
earthquakes. More specifically, we study the response of the Grenoble City Hall (France), a 13-storey reinforced concrete building, using ambient vibration tests and the network of permanent
8/14/2019 Full scale dynamic Response Analysis of RC Building under weak seismic motions
http://slidepdf.com/reader/full/full-scale-dynamic-response-analysis-of-rc-building-under-weak-seismic-motions 4/20
4/20
accelerometric monitoring stations installed by the French Permanent Accelerometric Network.
After briefly describing the structural design of the building and the experimental networks used(ambient vibration survey and accelerometric network), the results of the modal analysis of the
building using weak earthquakes recorded in the structure are compared with those of the ambi-ent vibration survey. The accelerometric data observed at the top of the building are then com-
pared to those predicted using a 1D lumped-mass model adjusted using the modal analysis results
obtained from ambient vibration recordings, and a 3D numerical model based on multifiber beamelements.
2. The Grenoble City Hall building
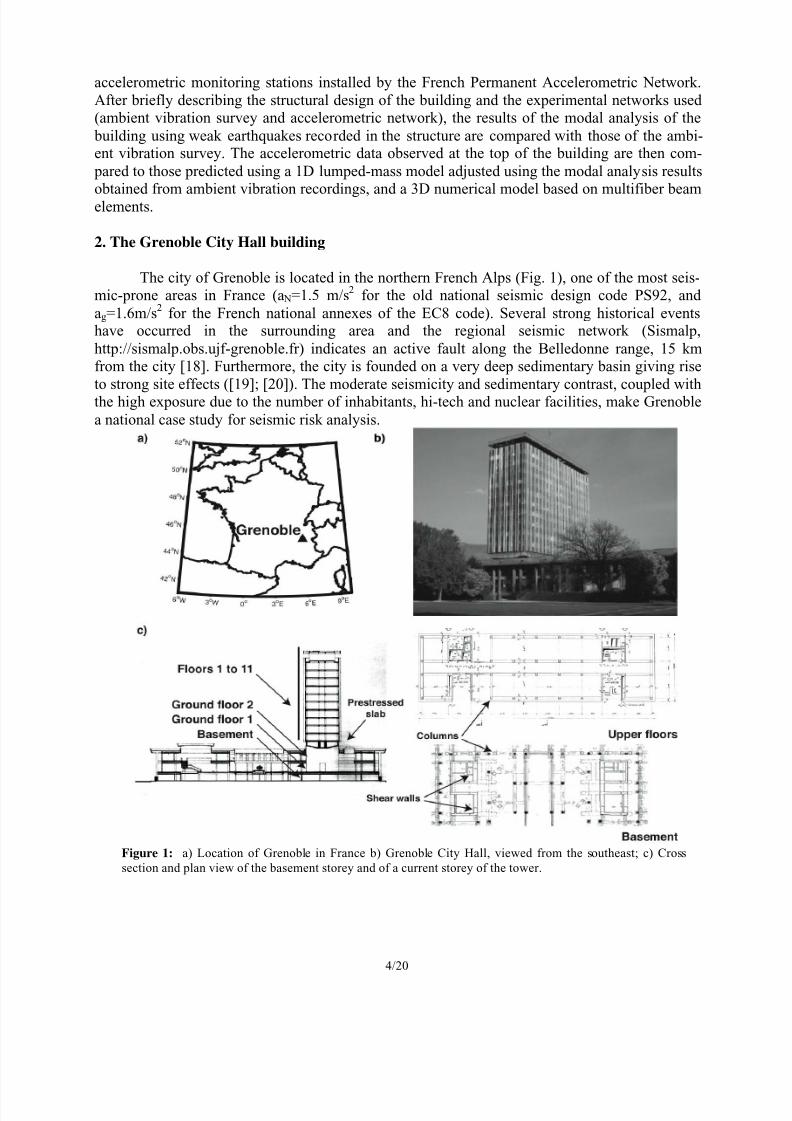
The city of Grenoble is located in the northern French Alps (Fig. 1), one of the most seis-mic-prone areas in France (a N=1.5 m/s
2 for the old national seismic design code PS92, and
ag=1.6m/s2 for the French national annexes of the EC8 code). Several strong historical events
have occurred in the surrounding area and the regional seismic network (Sismalp,
http://sismalp.obs.ujf-grenoble.fr) indicates an active fault along the Belledonne range, 15 kmfrom the city [18]. Furthermore, the city is founded on a very deep sedimentary basin giving rise
to strong site effects ([19]; [20]). The moderate seismicity and sedimentary contrast, coupled withthe high exposure due to the number of inhabitants, hi-tech and nuclear facilities, make Grenoble
a national case study for seismic risk analysis.
Figure 1: a) Location of Grenoble in France b) Grenoble City Hall, viewed from the southeast; c) Cross
section and plan view of the basement storey and of a current storey of the tower.
8/14/2019 Full scale dynamic Response Analysis of RC Building under weak seismic motions
http://slidepdf.com/reader/full/full-scale-dynamic-response-analysis-of-rc-building-under-weak-seismic-motions 5/20
5/20
The Grenoble City Hall is a reinforced concrete (RC) structure completed in 1967 (Fig.
1). It is divided into two parts: a 2-story horizontal building and an independent 13-story towerthat is the object of this study. No structural connections are observed between the main tower
and secondary small building. The tower has a 44 m by 13 m (L, T respectively) plan section andrises 52 m above the ground. The inter-storey height is regular between the 3 rd and 12th floors
(3.2 m) and higher for the 1st (4.68 m) and 2
nd storey (8 m), above which there is a prestressed
slab of 23 m span supported by two inner cores. These cores, consisting of RC shear walls, en-close the stair wells and lift shafts and are located at two opposite sides of the building. The struc-tural strength system combines these shear walls with RC frames with longitudinal beams bearing
the full RC floors. The glass frontage is fastened to a light steel framework placed on the external perimeter of the structure. The foundation system consists of deep piles, anchored in an underly-
ing stiff layer of sand and gravel. This structure did not benefit from an earthquake design and thedesign report was not available. The design of this structure did not include seismic forces and
any information on yielding story drift or yielding base shear coefficient was available.
3. Weak seismic motion and ambient vibration surveys
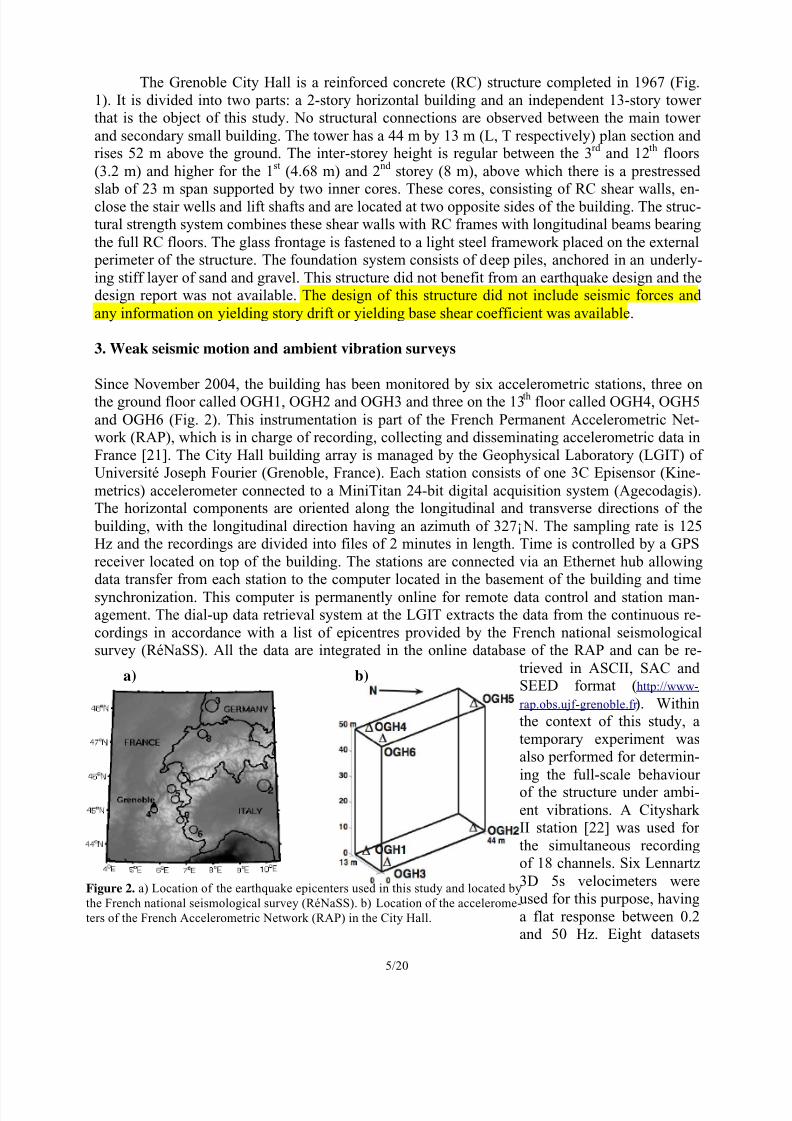
Since November 2004, the building has been monitored by six accelerometric stations, three onthe ground floor called OGH1, OGH2 and OGH3 and three on the 13th floor called OGH4, OGH5
and OGH6 (Fig. 2). This instrumentation is part of the French Permanent Accelerometric Net-work (RAP), which is in charge of recording, collecting and disseminating accelerometric data in
France [21]. The City Hall building array is managed by the Geophysical Laboratory (LGIT) ofUniversité Joseph Fourier (Grenoble, France). Each station consists of one 3C Episensor (Kine-
metrics) accelerometer connected to a MiniTitan 24-bit digital acquisition system (Agecodagis).The horizontal components are oriented along the longitudinal and transverse directions of the
building, with the longitudinal direction having an azimuth of 327°N. The sampling rate is 125Hz and the recordings are divided into files of 2 minutes in length. Time is controlled by a GPS
receiver located on top of the building. The stations are connected via an Ethernet hub allowingdata transfer from each station to the computer located in the basement of the building and time
synchronization. This computer is permanently online for remote data control and station man-agement. The dial-up data retrieval system at the LGIT extracts the data from the continuous re-
cordings in accordance with a list of epicentres provided by the French national seismologicalsurvey (RéNaSS). All the data are integrated in the online database of the RAP and can be re-
trieved in ASCII, SAC andSEED format (http://www-
rap.obs.ujf-grenoble.fr ). Withinthe context of this study, a
temporary experiment wasalso performed for determin-
ing the full-scale behaviourof the structure under ambi-
ent vibrations. A CitysharkII station [22] was used for
the simultaneous recordingof 18 channels. Six Lennartz
3D 5s velocimeters wereused for this purpose, having
a flat response between 0.2and 50 Hz. Eight datasets
Figure 2. a) Location of the earthquake epicenters used in this study and located by
the French national seismological survey (RéNaSS). b) Location of the accelerome-
ters of the French Accelerometric Network (RAP) in the City Hall.
a) b)

8/14/2019 Full scale dynamic Response Analysis of RC Building under weak seismic motions
http://slidepdf.com/reader/full/full-scale-dynamic-response-analysis-of-rc-building-under-weak-seismic-motions 6/20
6/20
were recorded, corresponding to 36 different points in the building, i.e., at least two points per
floor. One sensor was installed on top of the building to serve as reference instrument for all thedatasets. This reference point is necessary in order to normalize and combine all the components
of the modal shape [23]. The first frequency was roughly estimated to be close to 1 Hz, so a 15min recording time was selected for each set, corresponding to more than 1000 periods, at a 200
Hz sampling rate.
4. Earthquake recordings
Since 2004, more than 25 earthquakes have been recorded by the permanent building array. Nineearthquakes were selected (Fig. 2a) with a signal to noise ratio greater than 3 in the 0.6-5 Hz fre-
quency band corresponding to a PGA from 0.6 to 23 mm/s2
(Fig. 3). The French national seis-mological survey (RéNaSS) located these earthquakes in the most active zones of the western
part of the Alps, corresponding to the Northern (events #1, 4, 5, 7) and Southern (events #6, 9)
Figure 3. Examples of accelerometric time history (left)
of the nine earthquakes recorded in Grenoble City Hall
at the OGH6 roof station (lower row) and at the OGH1
(upper row) ground station in the longitudinal L direc-
tions. All waveforms are plotted in relative mode and
scaled by the maximum amplitude of each sta-
tion/component pair. Corresponding response spectra
(right).
8/14/2019 Full scale dynamic Response Analysis of RC Building under weak seismic motions
http://slidepdf.com/reader/full/full-scale-dynamic-response-analysis-of-rc-building-under-weak-seismic-motions 7/20
7/20
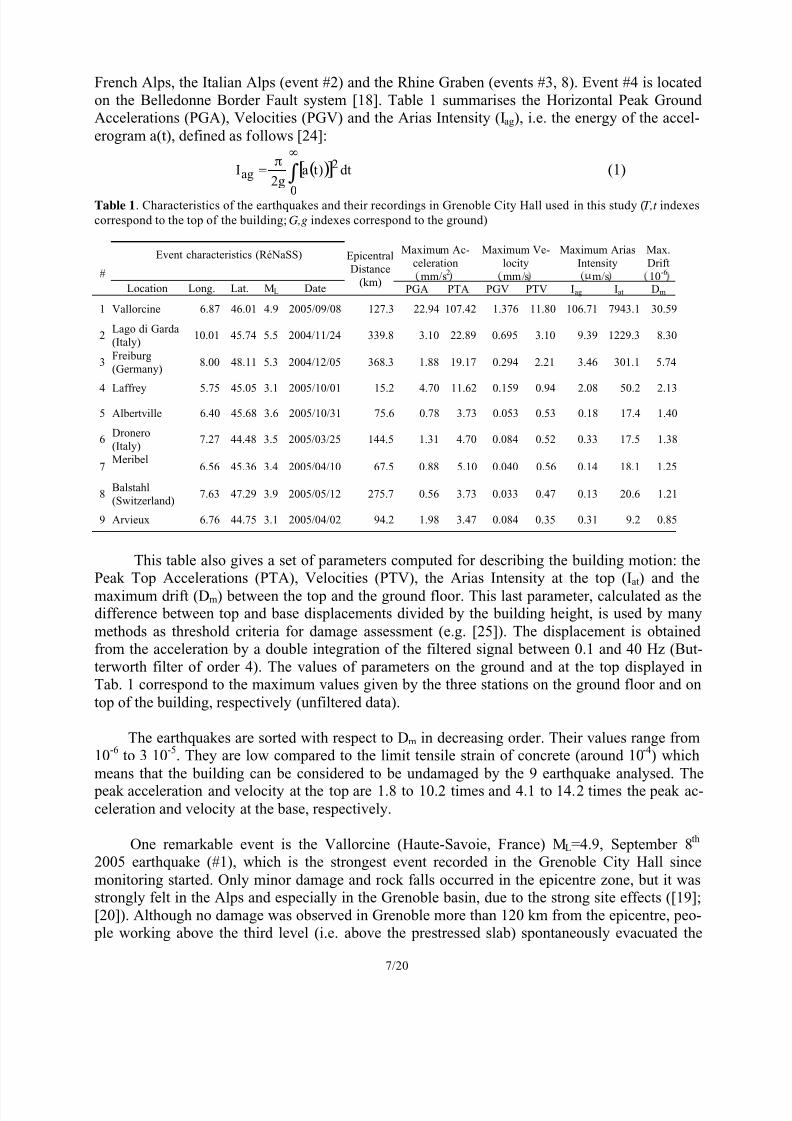
French Alps, the Italian Alps (event #2) and the Rhine Graben (events #3, 8). Event #4 is located
on the Belledonne Border Fault system [18]. Table 1 summarises the Horizontal Peak GroundAccelerations (PGA), Velocities (PGV) and the Arias Intensity (Iag), i.e. the energy of the accel-
erogram a(t), defined as follows [24]:
( )[ ] ! "
#=
0
2ag dt)ta
g2I (1)
Table 1. Characteristics of the earthquakes and their recordings in Grenoble City Hall used in this study (T,t indexes
correspond to the top of the building; G,g indexes correspond to the ground)
Event characteristics (RéNaSS) Maximum Ac-
celeration
mm/s2
Maximum Ve-
locity
mm/s
Maximum Arias
Intensity
m/s
Max.
Drift
10-6
#
Location Long. Lat. ML Date
Epicentral
Distance
(km)PGA PTA PGV PTV Iag Iat Dm
1 Vallorcine 6.87 46.01 4.9 2005/09/08 127.3 22.94 107.42 1.376 11.80 106.71 7943.1 30.59
2Lago di Garda
(Italy)10.01 45.74 5.5 2004/11/24 339.8 3.10 22.89 0.695 3.10 9.39 1229.3 8.30
3Freiburg
(Germany)8.00 48.11 5.3 2004/12/05 368.3 1.88 19.17 0.294 2.21 3.46 301.1 5.74
4 Laffrey 5.75 45.05 3.1 2005/10/01 15.2 4.70 11.62 0.159 0.94 2.08 50.2 2.13
5 Albertville 6.40 45.68 3.6 2005/10/31 75.6 0.78 3.73 0.053 0.53 0.18 17.4 1.40
6Dronero
(Italy)7.27 44.48 3.5 2005/03/25 144.5 1.31 4.70 0.084 0.52 0.33 17.5 1.38
7Meribel
6.56 45.36 3.4 2005/04/10 67.5 0.88 5.10 0.040 0.56 0.14 18.1 1.25
8Balstahl
(Switzerland)7.63 47.29 3.9 2005/05/12 275.7 0.56 3.73 0.033 0.47 0.13 20.6 1.21
9 Arvieux 6.76 44.75 3.1 2005/04/02 94.2 1.98 3.47 0.084 0.35 0.31 9.2 0.85
This table also gives a set of parameters computed for describing the building motion: thePeak Top Accelerations (PTA), Velocities (PTV), the Arias Intensity at the top (I at) and the
maximum drift (Dm) between the top and the ground floor. This last parameter, calculated as thedifference between top and base displacements divided by the building height, is used by many
methods as threshold criteria for damage assessment (e.g. [25]). The displacement is obtainedfrom the acceleration by a double integration of the filtered signal between 0.1 and 40 Hz (But-
terworth filter of order 4). The values of parameters on the ground and at the top displayed inTab. 1 correspond to the maximum values given by the three stations on the ground floor and on
top of the building, respectively (unfiltered data).
The earthquakes are sorted with respect to Dm in decreasing order. Their values range from10
-6 to 3 10
-5. They are low compared to the limit tensile strain of concrete (around 10
-4) which
means that the building can be considered to be undamaged by the 9 earthquake analysed. The
peak acceleration and velocity at the top are 1.8 to 10.2 times and 4.1 to 14.2 times the peak ac-celeration and velocity at the base, respectively.
One remarkable event is the Vallorcine (Haute-Savoie, France) ML=4.9, September 8th 2005 earthquake (#1), which is the strongest event recorded in the Grenoble City Hall since
monitoring started. Only minor damage and rock falls occurred in the epicentre zone, but it wasstrongly felt in the Alps and especially in the Grenoble basin, due to the strong site effects ([19];
[20]). Although no damage was observed in Grenoble more than 120 km from the epicentre, peo- ple working above the third level (i.e. above the prestressed slab) spontaneously evacuated the

8/14/2019 Full scale dynamic Response Analysis of RC Building under weak seismic motions
http://slidepdf.com/reader/full/full-scale-dynamic-response-analysis-of-rc-building-under-weak-seismic-motions 8/20
8/20
City Hall. However, the drift observed for this event (Tab. 1) is 3 10-5
, i.e. three times lower than
the concrete limit tensile strain. Guéguen and Bard [26] distinguish four independent structuralmodes of deformation: structural drift, torsion, base rocking and relative motion of the
foundation. The contribution of each has been analysed in the time domain for both horizontaldirections, except the relative motion of the foundation due to the lack of free field sensors. In
this paper, we display hereafter only the analysis in the L-direction for the Vallorcine (Event #1)
earthquake (Fig. 4).
Torsion at the top and at the
base are derived from the difference between L-components recorded at
each corner and normalized by thedistance L between two corners (i.e.
(OGH6L-OGH5
L)/L and (OGH3
L-
OGH2L)/L, respectively). Torsion at
the basement (Fig. 4) is veryinsignificant relative to the
horizontal and rocking acceleration(about 100 times less in the L-
direction), as previously observed byMeli et al. [27] and Guéguen and
Bard [26] in full-scale buildings.Torsion at the top for this building is
also low compared to horizontal driftand rocking. As mentioned in Bard
[28] and Guéguen and Bard [26],assuming a rigid behaviour of the
foundation rocking acceleration R L iscomputed as follows:
L
2OGH3OGHHR
ZZL !
=
(2)
This rocking corresponds to the totalrocking of the basement, includingthe rocking of the soil, which is in
general considered negligible. Themaximum value of rocking (Fig. 4)
corresponds to about 10 mm/s2,namely around 20% of the peak top
acceleration of the structure (Tab. 1).
As reported in various papers (e.g.[28]; [27]), buildings founded on soft
soils usually exhibit significant rocking owning to soil-structure interactions (SSI). This is true
even for structures founded on deep foundations.The structural drift DL, which corresponds to the fixed-base structure behaviour, is computed by
subtracting the total acceleration of the foundation (i.e. rocking plus horizontal acceleration in-cluding the input acceleration) from the building top acceleration (i.e. D1
L=OGH6
L- OGH3
L- R
L
and D2L=OGH5L - OGH2L - R L). The maximum of the structural drift (Fig. 4) represents about
Figure 4. a) Time histories of horizontal displacement at roof level
station (OGH4, OGH6 and OGH5) in the L-direction and
comparison with the components of the main structural deformation
recorded during the Vallorcine (Haute-Savoie, France) ML=4.9,
September 8th
2005 earthquake (see text for comprehension); b)
Coherence Crd between rocking and structural drift computed in the
L-directions for the Vallorcine earthquake using the two sets of
station used to compute the structural drift (thin line: structural drift
1; thick line: structural drift 2).
a)
b)

8/14/2019 Full scale dynamic Response Analysis of RC Building under weak seismic motions
http://slidepdf.com/reader/full/full-scale-dynamic-response-analysis-of-rc-building-under-weak-seismic-motions 9/20
9/20
100% of the peak acceleration recorded at the top of the structure. Note that, whichever set of sta-
tions considered in the same direction, the time history of the structural drift is quite similar.
The coherence Crd between rocking R L and structural drift D
L is plotted in Fig. 4b. It is computed
as follows:
yyxx
2xy
rd SS
S
C = (3)
where Sxx and Syy are the power spectral density (PSD) of the signals x and y respectively, and
Sxy is the cross-PSD of x and y. In our case, x corresponds to the rocking motion and y to thestructural drift. For the Vallorcine earthquake, high coherence is observed at the frequencies of
the structure, which will be detailed in the following, between rocking and structural drift (morethan 95%) in L-directions, which attests SSI effects [28].
Finally, this analysis showed that the building motion was mainly following its horizontal
drift vibration modes but with a non-negligible effect of SSI (rocking), which reaches 20% of thetop acceleration in the case of Vallorcine earthquake. SSI effects were also found using the low-
est earthquake data. This SSI is associated to the presence of a very soft soil in the 20 first metersdepth, made of very soft clay characterized by S-wave velocity close to 200 m/s [20].
5. Ambient vibration recordings processing using Frequency Domain Decomposition
The experimental behaviour of buildings can be formalized in a complete and detailed
model using modal analysis of ambient vibrations (called Operational Modal Analysis, OMA).OMA is now widely used in civil engineering applications (e.g. [14]; [16]) to understand the lin-
ear behaviour of structures in terms of vibration modes. In order to extract the modal parametersof the structure from ambient vibration recordings, the Frequency Domain Decomposition (FDD)
method [29] was used in this paper. This method is able to decompose modes, even if they are
very close. The first step of this method is to calculate the PSD matrices for each dataset. TheWelch method [30] was used for this purpose, for which Fourier Transforms of the correlationmatrices on overlapping Hamming windows are averaged over the recordings. The length of the
time windows has been increasingly tested until a value of 215
samples giving a frequency preci-sion of 200/215=0.006 Hz. Given that 18 channels are recorded simultaneously, the size of these
matrices is 18x18 for each frequency. Only a limited number of modes (frequencies !k , mode
shape vectors {!k }) have energy at one particular angular frequency " noted Sub("). It can be
shown [29] that the PSD matrices of the sensors [Y](") using the pole/residue decomposition
take the following form:
[ ]( )
{ }{ } { }{ }
k
Tk k k
)(Subk k
Tk k k
j
d
j
d
Y !"#
$$
+!"#
$$
=# % #& (4)
with d k a constant and j2 = -1. Moreover, a singular value decomposition of the estimated PSD
matrices at each frequency can be performed:
[ ]( ) [ ][ ][ ]Tiii USUY =! (5)

8/14/2019 Full scale dynamic Response Analysis of RC Building under weak seismic motions
http://slidepdf.com/reader/full/full-scale-dynamic-response-analysis-of-rc-building-under-weak-seismic-motions 10/20
10/20
Identification of Eq. 4 and 5 shows that the modulus of the first singular value gives a peak
for an " value corresponding to a resonance frequency "k linked to the continuous-time eigen-
values "k =-#
k $
k ±j$
k %(1-#
k
2)
(Fig. 5a). Furthermore, if
Sub(") has only one or two
geometrically orthogonalelements, the first two singular
vectors are proportional to themodal shapes.
In practice, buildings areoften equally stiff in both
longitudinal and transversedirections so that the first
modes in each direction arevery close each other. The FDD
method is capable ofdecomposing these modes
contrary to the traditional“Peak Picking” method.
Moreover, this method can beenhanced [31] to select the
complete mode “bell”, andconsequently its damping ratio, by comparing the mode shape at the peak to the mode shapes of
the surrounding frequency values. The Modal Assurance Criterion (MAC) (Allemang and Brown,
1982) [32] is used for this purpose. This compares two modal shapes #1 and #2 through the fol-
lowing expression:
( )2
H21
H1
22
H1
21,MAC
!!!!
!!
=!! (6)
whereH denotes the complex conjugate and transpose.
A MAC value greater than 80% indicates that the point still belongs to the mode “bell”, even on
the second singular value. The bell then represents the Transfer Function of the SDOF character-ized by the peak frequency of the mode bell so that an inverse Fourier Transform leads to the Im-
pulse Response Function (IRF) of the mode. The logarithmic decrement of the IRF gives thedamping ratio and a linear regression of the zero-crossing times gives the enhanced frequency. A
decision as to whether or not a peak is a structural mode can be taken by considering the extent ofthe mode “bell”, the damping ratio and the shape. The proposed evaluation of the uncertainties on
the peak position in the spectrum does not include epistemic errors, but only the uncertainties dueto the windowing process in the spectral estimation as aforementioned.
Only 3 modes have been accurately determined (Fig. 5): the first longitudinal mode at
1.157±0.006 Hz, with a damping of about 0.9%, the first transverse mode at 1.217±0.006 Hz
with a damping of about 1.1% and the first torsion mode at 1.45±0.01 Hz with a damping of
about 0.9%. The first longitudinal mode is not pure but has a slight torsion component that is not
Figure 5. a) Spectrum (mean value of the 8 datasets of the first 6
singular values of the PSD matrices) of the structure under ambi-
ent vibrations computed using Frequency Domain Decomposi-
tion (FDD) (Brincker et al., 2001a). b) first 3 structural modes of
the structure obtained using FDD (from left to right: longitudinal
bending, transverse bending and torsion).

8/14/2019 Full scale dynamic Response Analysis of RC Building under weak seismic motions
http://slidepdf.com/reader/full/full-scale-dynamic-response-analysis-of-rc-building-under-weak-seismic-motions 11/20
11/20
present in the first transverse mode. Following the
aforementioned decision process using MAC, thesecond longitudinal mode may be distinguished at
4.5±0.2 Hz and a mode that looks like the second
torsion mode may be found at 5.7±0.2 Hz. In addi-
tion, the first vertical mode can be determined at
9.3±
0.2 Hz. Nevertheless, because of the very poorestimate of these higher modes, only the two longi-tudinal modes will be considered in the following.
The values of the first bending frequencies in
each direction are very close to each other, meaningthat the structural system has roughly the same
stiffness in both directions. In reality, despite thegeometric aspect ratio between longitudinal and
transverse directions, Fig. 1 shows that two regularinner cores provide lateral load resistance, having
roughly the same stiffness in both horizontal direc-tions. Moreover, from Fig. 5b, it can be seen that
the storeys under the prestressed slab seem to bevery stiff as shown on the low deflection shape of
the modes under this level.
6. Frequencies under earthquake recordings
To demonstrate the relevancy of the modes determined under ambient vibrations, these
modes were compared to the resonance frequencies using earthquake recordings listed in Tab. 1.For this purpose, Auto-Regressive (AR) modelling of the structure was used [11]. Numerous
methods could be used based on discrete time filters such as the ARX technique [33] but we de-cided to employ this frequency technique because its easy implementation and relevant accuracy.
Each couple of base/top sensors (OGH1-OGH4, OGH2-OGH5 and OGH3-OGH6) is modelled by an AR filter obtained using the Linear Prediction method. The top motion is first deconvolved
by the base motion with a water-level method [34] and the resulting spectrum is approximated bythe best AR filter. A stabilisation diagram with several numbers of poles in the AR filter is used
to estimate the confidence in the frequency and damping obtained for the first resonance fre-quency in each direction. The results are approximately the same for the three couples of sensors
so that only the median value is kept for each earthquake (Fig. 6). A slight decrease (less than2%) in the frequencies is observed with increasing drift up to 10
-5. This trend seems to be linear
that would mean that the frequency decreases logarithmically with respect to the drift amplitude.This elastic decrease may be due to the co-seismic aperture of micro-cracks in the concrete that
temporarily decreases the stiffness of the structure and therefore the frequencies, as already ob-served by [10] and [11] using Californian strong-motion data collected in buildings. On the con-
trary, they did not observe a clear relation between damping coefficient and magnitude of the mo-tion. Damping will not be discussed further in this paper.
The frequency during the Vallorcine earthquake is approximately 2% smaller than the fre-
quency during the weakest ground motion, generated by the Meribel earthquake (#7, Tab. 1, Tab.2), having the same order of acceleration as ambient vibrations. Moreover, the values obtained
Figure 6. Fundamental frequencies of the build-
ing in longitudinal and transverse directions for
the nine earthquakes using AR modelling and
plotted as a function of the structure drift Dm. The
solid line represents the frequency value in L- and
T-direction obtained by Frequency Domain De-composition (FDD) using ambient vibrations (+/-
uncertainties shown by dashed lines)

8/14/2019 Full scale dynamic Response Analysis of RC Building under weak seismic motions
http://slidepdf.com/reader/full/full-scale-dynamic-response-analysis-of-rc-building-under-weak-seismic-motions 12/20
12/20
for this weakest motion are higher (2 to 3%) than the values obtained by the FDD method using
ambient vibrations. This slight difference may be due to the system considered by FDD and ARmethods: in the first case, the flexible-base building is considered including the linear soil-
structure interaction that was previously observed using earthquake recordings (Fig. 4b), while inthe second case, the system considered is the fixed-base building.
Although the basic assumption of white noise is required for the FDD method, it was alsoused to determine the structure modes during Vallorcine earthquake. The FDD is robust enoughto allow this process [35]. Here again, slightly lower values of first frequencies from 1.5% to 4%
are found compared to ambient vibrations (Tab. 2). In conclusion, a slight decrease (2-4%) in thefirst frequencies is found during the Vallorcine earthquake compared to the weakest motions
(Tab. 2). This decrease has already been mentioned with reference to other buildings ([7]; [36];[37]; [38]; [11]) but in this paper two different methods are used to quantify this decrease for
weak ground motions. Care should be taken when extrapolating these results to higher drifts butthis logarithmic decrease with increasing drift may be valid in the elastic domain. This means that
the frequency values obtained under ambient vibrations are relevant in a building model for mod-erate earthquakes and that no dramatic decrease occurs between ambient vibrations and moderate
earthquakes.
Table 2. Comparison between resonance frequencies of the structure under weak motion (ambient vibrations and
Meribel earthquake) and Vallorcine earthquake using the FDD method and AR modelling.
FDD method AR modelling
Resonance frequencies Ambient
vibrations
Vallorcine earth-
quake
Decrease Meribel earth-
quake
Vallorcine earth-
quake
Decrease
1st longitudinal (Hz) 1.16 1.13 2.6% 1.180 1.152 2.4%
1st transverse (Hz) 1.22 1.17 4.1% 1.242 1.220 1.8%
1st torsion (Hz) 1.44 1.42 1.4% 1.442 1.414 2.0%
7. Lumped-mass models
The modal parameters obtained under ambient vibrations are unscaled [39], i.e. it is not
possible to deduce the amplitude of the building motion with only modal parameters. A physicalmodel integrating the modal parameters is therefore required. As the masses are mostly concen-
trated in the floors of a building, a 1D lumped-mass model was assumed for the structure. In thiscase, the Duhamel integral [40] gives the elastic motion {U(t)} of each floor of the structure as-
suming a constant mass along the storeys [M], knowing the vibration modes ([#] the modal
shapes, {"} the frequencies and { $} the damping ratios) and the ground motion Us(t):
( ){ } [ ] ( ){ } ( )tUtytU s+!= (7)
with [ ] ( ) ( ) ( )
( )( ) ! !"# !#
"=$% &
!"#'"d tsineU
pty, N,1 j '
t
0
t j j''s'
j
j j , (8)

8/14/2019 Full scale dynamic Response Analysis of RC Building under weak seismic motions
http://slidepdf.com/reader/full/full-scale-dynamic-response-analysis-of-rc-building-under-weak-seismic-motions 13/20
13/20
2 j
2 j
2' j
1 !"#=# and{ } [ ]{}
{ } [ ]{ }!
!
=
=
"
"
=""
"=
N
1 j
2ij
N
1 j
ij
jT
j
T j
jM
1M p the participation factor of mode j.
Only the first bending modes are considered here, the torsion mode being neglected for the
sake of simplicity. This linear 1D model is then assumed so that the experimental modal shapesare averaged at each floor. The corresponding seismic motion can be computed for any determi-
nistic (weak) earthquake scenario, considering the two horizontal motions uncoupled.
Considering the recording at the base floor asinput (stations OGH1, OGH2 and OGH3, Fig. 2b),
the synthetic motion is compared with the motionrecorded at the top (Fig. 7a), considering each cou-
ple of base/top sensors, in the two horizontal direc-tions. We observe a good fit between synthetic and
data, considering the time duration, the main phasesand also the amplitude of the building motion. The
correlation coefficients between data and synthetic
motion are 65% and 86% for OGH1-OGH4, 59%and 82% for OGH2-OGH5, and 81% and 85% forOGH3-OGH6, in the L- and T-directions, respec-
tively. The Vallorcine recordings show significantanisotropy in the building motion: the amplitude in
the transverse direction is twice the amplitude of thelongitudinal direction at the top, despite a greater
PGA in the longitudinal direction (Tab. 2). The dif-ference of motion between L- and T-directions is
Figure 7a. Comparison between data (black line) and 1D lumped-mass model (gray line) of the Vallorcine (Haute-
Savoie, France) ML=4.9, September 8th
2005 earthquake at the roof of the structure in the longitudinal (left) and trans-
verse (right) directions for each couple top/base of stations.
Figure 7b. Comparison of the Fourier spectrum
between data (black line) and 1D lumped-mass
model (gray line) of the Vallorcine (Haute-Savoie,
France) ML=4.9, September 8th
2005 earthquake at
the roof of the structure in the longitudinal (left)
and transverse (right) directions for the OGH6 sta-
tion.

8/14/2019 Full scale dynamic Response Analysis of RC Building under weak seismic motions
http://slidepdf.com/reader/full/full-scale-dynamic-response-analysis-of-rc-building-under-weak-seismic-motions 14/20
14/20
not induced by complex behaviour of the building (the model fits the data well), but by the
ground motion itself. The slight errors in the computed response are due to the 3D behaviour ofthe building, especially torsion and the neglect of higher modes, not included in the 1D model, as
suggested on Figure 7b. This figure shows that frequency shift and approximate damping valuedo not influence much the response here.
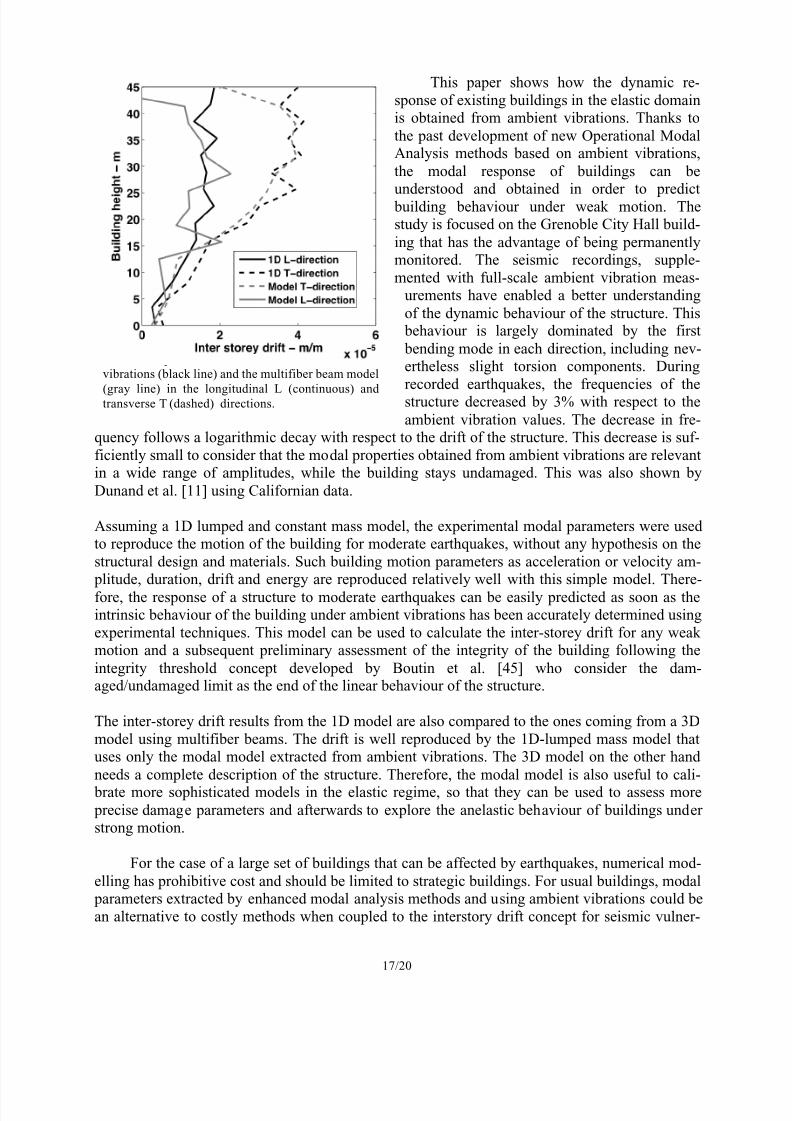
Thanks to the lumped-mass model, it isalso shown that the maximum inter-storeydrift (Fig. 8) is greater in the transverse
than in the longitudinal direction abovethe prestressed slab. Whatever the build-
ing corner, this maximum drift is ap- proximately the same in the longitudinal
direction from the 3rd
to the 12th
floor (210-5). In the transverse direction, it is also
constant from the 5th
to the 12th
floor at 410
-5, i.e. twice the longitudinal value.
This maximum drift along the storeys issignificantly smaller than the minimum
strain able to initiate damage in the build-ing (10
-4 for the limit tensile strain of
concrete). This was confirmed by the factthat no apparent damage was observed in
the Grenoble City Hall after the Vallor-cine earthquake.
Slight differences between synthetic and data may also be due to the fact the 1D building
model neglects SSI and torsion mode. In order to evaluate the effects of these assumptions onsynthetics, the four previously mentioned parameters describing the building motion (PTA, PTV,
Iat, Dm) are considered, together with the duration of the building motion and compared betweenrecordings and synthetics (Fig. 9). The nine events selected in the RAP database are used for
comparison (Tab. 1). The duration is defined here as the time between 5% and 95% of the Arias
Figure 8. Modelling of maximum drift along the storeys ofthe structure during the Vallorcine (Haute-Savoie, France)
ML=4.9, September 8th 2005 earthquake using the base mo-
tion as input and the 1D lumped-mass model extracted from
ambient vibrations, in the L- and T-directions.

8/14/2019 Full scale dynamic Response Analysis of RC Building under weak seismic motions
http://slidepdf.com/reader/full/full-scale-dynamic-response-analysis-of-rc-building-under-weak-seismic-motions 15/20
15/20
Intensity [41]. The accelerations often tend to be underestimated, especially for the weakestearthquakes, since torsion is not taken into account in the model (Fig 9). Conversely, the duration
is sometimes overestimated in the model possibly as a result of the damping ratio that may behigher and therefore may decrease the resonance duration. Most of the errors on PTV, Dm and
duration are less than 20%. The Arias Intensity at the top of the building is well reproduced ex-cept for the smallest earthquakes. The overall results are nevertheless satisfactory and they vali-
date the simple 1D lumped-mass model obtained from ambient vibrations.
8. Multifiber beam model
A detailed finite element model is presented hereafter able to reproduce numerically themodal and the non linear behaviour of the Grenoble City Hall. Spatial discretisation is done using
multifiber Timoshenko beam elements [42] and constitutive laws based on damage mechanics[43] for concrete and plasticity for steel [44]. Perfect bond is considered. The slabs are modelled
with Kirchhoff plate elements assuming a linear elastic behaviour. More specifically:
• The total number of the elements in the finite element mesh is 18928.
• The finite element code used is Cast3M.
• Concrete parameters: Young’s modulus 32GPa, Poisson’s coefficient 0.2, traction
limit f t = 3MPa, compression limit f c28 = 30 MPa, mass density 2400 Kg/m3.
• Steel: Young’s modulus 200GPa, Poisson’s coefficient 0.3, yield stress 400MPa,
yield strain 0.03, ultimate stress 460 MPa, ultimate yield strain 0.09, mass density 7800Kg/m
3.
• Total mass of the structure: 9540 103 Kg.
Figure 9. Comparison of the parameters
(PTA, PTV, maximum drift, Arias inten-
sity and duration) computed at the build-
ing top using the lumped-mass model
and the nine accelerometric recordings of
the City Hall.
8/14/2019 Full scale dynamic Response Analysis of RC Building under weak seismic motions
http://slidepdf.com/reader/full/full-scale-dynamic-response-analysis-of-rc-building-under-weak-seismic-motions 16/20
16/20
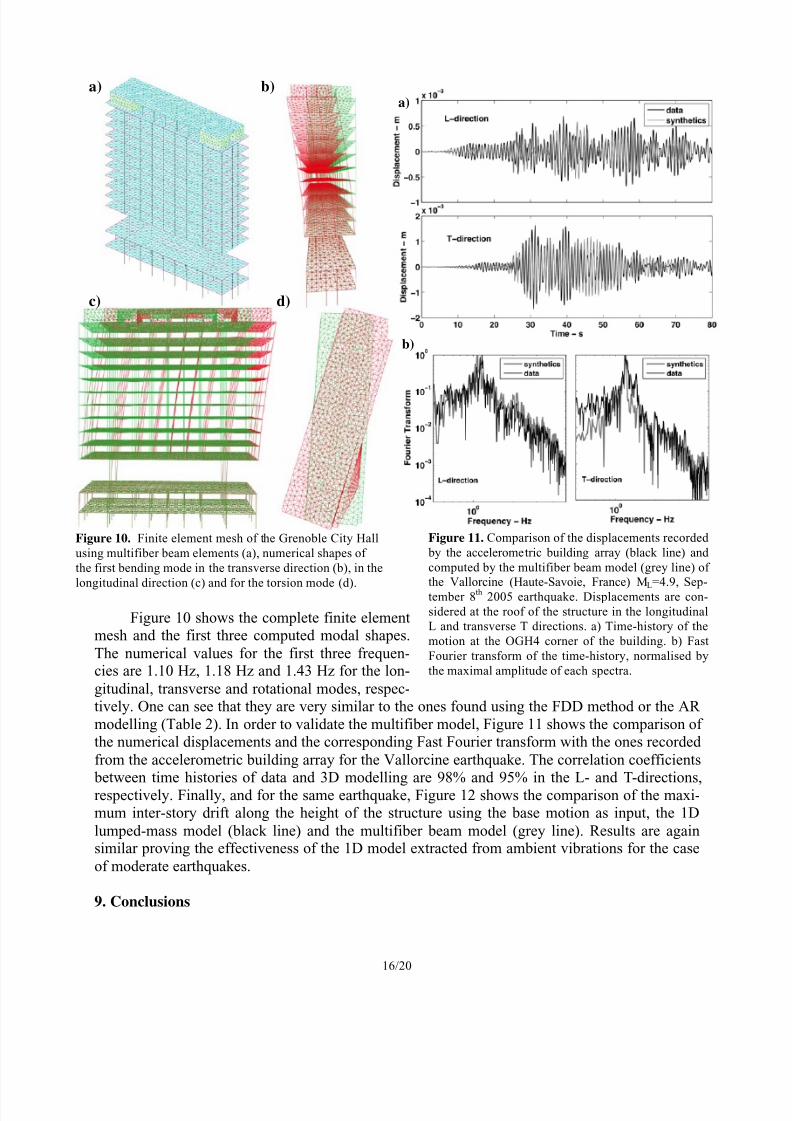
Figure 10 shows the complete finite elementmesh and the first three computed modal shapes.
The numerical values for the first three frequen-cies are 1.10 Hz, 1.18 Hz and 1.43 Hz for the lon-
gitudinal, transverse and rotational modes, respec-tively. One can see that they are very similar to the ones found using the FDD method or the AR
modelling (Table 2). In order to validate the multifiber model, Figure 11 shows the comparison ofthe numerical displacements and the corresponding Fast Fourier transform with the ones recorded
from the accelerometric building array for the Vallorcine earthquake. The correlation coefficients between time histories of data and 3D modelling are 98% and 95% in the L- and T-directions,
respectively. Finally, and for the same earthquake, Figure 12 shows the comparison of the maxi-mum inter-story drift along the height of the structure using the base motion as input, the 1D
lumped-mass model (black line) and the multifiber beam model (grey line). Results are againsimilar proving the effectiveness of the 1D model extracted from ambient vibrations for the case
of moderate earthquakes.
9. Conclusions
a) b)
c) d)
Figure 10. Finite element mesh of the Grenoble City Hall
using multifiber beam elements (a), numerical shapes of
the first bending mode in the transverse direction (b), in the
longitudinal direction (c) and for the torsion mode (d).
Figure 11. Comparison of the displacements recorded
by the accelerometric building array (black line) and
computed by the multifiber beam model (grey line) of
the Vallorcine (Haute-Savoie, France) ML=4.9, Sep-
tember 8th 2005 earthquake. Displacements are con-
sidered at the roof of the structure in the longitudinal
L and transverse T directions. a) Time-history of the
motion at the OGH4 corner of the building. b) Fast
Fourier transform of the time-history, normalised by
the maximal amplitude of each spectra.
b)
a)
8/14/2019 Full scale dynamic Response Analysis of RC Building under weak seismic motions
http://slidepdf.com/reader/full/full-scale-dynamic-response-analysis-of-rc-building-under-weak-seismic-motions 17/20
17/20
This paper shows how the dynamic re-
sponse of existing buildings in the elastic domainis obtained from ambient vibrations. Thanks to
the past development of new Operational ModalAnalysis methods based on ambient vibrations,
the modal response of buildings can be
understood and obtained in order to predict building behaviour under weak motion. Thestudy is focused on the Grenoble City Hall build-
ing that has the advantage of being permanentlymonitored. The seismic recordings, supple-
mented with full-scale ambient vibration meas-urements have enabled a better understanding
of the dynamic behaviour of the structure. This behaviour is largely dominated by the first
bending mode in each direction, including nev-ertheless slight torsion components. During
recorded earthquakes, the frequencies of thestructure decreased by 3% with respect to the
ambient vibration values. The decrease in fre-quency follows a logarithmic decay with respect to the drift of the structure. This decrease is suf-
ficiently small to consider that the modal properties obtained from ambient vibrations are relevantin a wide range of amplitudes, while the building stays undamaged. This was also shown by
Dunand et al. [11] using Californian data.
Assuming a 1D lumped and constant mass model, the experimental modal parameters were usedto reproduce the motion of the building for moderate earthquakes, without any hypothesis on the
structural design and materials. Such building motion parameters as acceleration or velocity am- plitude, duration, drift and energy are reproduced relatively well with this simple model. There-
fore, the response of a structure to moderate earthquakes can be easily predicted as soon as theintrinsic behaviour of the building under ambient vibrations has been accurately determined using
experimental techniques. This model can be used to calculate the inter-storey drift for any weakmotion and a subsequent preliminary assessment of the integrity of the building following the
integrity threshold concept developed by Boutin et al. [45] who consider the dam-aged/undamaged limit as the end of the linear behaviour of the structure.
The inter-storey drift results from the 1D model are also compared to the ones coming from a 3D
model using multifiber beams. The drift is well reproduced by the 1D-lumped mass model thatuses only the modal model extracted from ambient vibrations. The 3D model on the other hand
needs a complete description of the structure. Therefore, the modal model is also useful to cali- brate more sophisticated models in the elastic regime, so that they can be used to assess more
precise damage parameters and afterwards to explore the anelastic behaviour of buildings understrong motion.
For the case of a large set of buildings that can be affected by earthquakes, numerical mod-
elling has prohibitive cost and should be limited to strategic buildings. For usual buildings, modal parameters extracted by enhanced modal analysis methods and using ambient vibrations could be
an alternative to costly methods when coupled to the interstory drift concept for seismic vulner-
Figure 12. Comparison of the maximum inter-story
drift along the height of the structure during the Val-
lorcine (Haute-Savoie, France) ML=4.9, September
8th 2005 earthquake using the base motion as input,
the 1D lumped-mass model extracted from ambient
vibrations (black line) and the multifiber beam model
(gray line) in the longitudinal L (continuous) andtransverse T (dashed) directions.
8/14/2019 Full scale dynamic Response Analysis of RC Building under weak seismic motions
http://slidepdf.com/reader/full/full-scale-dynamic-response-analysis-of-rc-building-under-weak-seismic-motions 18/20
18/20
ability assessment. This is particularly the case for moderate seismic regions where the seismic
retrofitting investment is rather limited with however past damaging earthquakes.
Acknowledgements
This work is supported by the Rhone-Alps regional authorities through the Thématiques Pri-
oritaires program (project VULNERALP) and by the French Research National Agency (ANR)
through the RGCU program (project ARIVSE ANR-06-PRGCU-007-01, http://arvise.grenoble-inp.fr/index.jsp). The Grenoble strong-motion network is operated by the Laboratoire de Géo-
physique Interne et Tectonophysique (LGIT) for the French Accelerometric Network (RAP). The
authors are very grateful to E. Chaljub, M. Langlais and S. Hatton for operating the stations andC. Péquegnat for managing the data centre and providing the data, without which this study
would not have been possible.
References
1. Davison C. Fusakichi Omori and his work on earthquakes. Bulletin of the Seismological
Society of America 1924; 14 (4): 240–255.
2. Carder D. S. Observed vibration of buildings. Bulletin of the Seismological Society of
America 1936; 26: 245–277.
3. Housner G.W., Brady A. G. Natural periods of vibration of buildings. Journal of the
Engineering Mechanics Division 1963; 89: 31–65.
4. Crawford R., Ward H.S. Determination of the natural periods of buildings. Bulletin of
the Seismological Society of America 1964; 54 (6): 1743–1756.
5. Trifunac M.D. Comparison between ambient and forced vibration experiments. Earth-
quake Engineering and Structural Dynamics 1972; 1: 133–150.
6. Hans S., Boutin C., Ibraim E., Roussillon P. In Situ experiments and seismic analysis ofexisting buildings - Part I: Experimental investigations. Earthquake Engineering and
Structural Dynamics 2005; 34 (12): 1513–1529.
7. Celebi M. Comparison of damping in buildings under low amplitude and strong mo-tions. Journal of Wind Engineering and Industrial Aerodynamics 1996; 59: 309–323.
8. Irie Y., Nakamura K. Dynamic characteristics of a RC-building of five stories based onmicrotremor measurements and earthquake observations. In 12th World Conference of
Earthquake Engineering, Auckland, New-Zealand, 2000.
9. Mucciarelli M., Masi A., Gallipoli M. R., Harabaglia P., Vona M., Ponzo F., Dolce M.Analysis of RC building dynamic response and soil-building resonance based on datarecorded during a damaging earthquake (Molise, Italy, 2002). Bulletin of seismological
Societey of America 2004; 94 (5): 1943–1953.
10. Clinton J. F., Bradford S. C., Heaton T. H., Favela J. The observed wander of the naturalfrequencies in a structure. Bulletin of the Seismological Society of America 2006; 96 (1):
237–257.11. Dunand F., Guéguen P., Bard P.Y., Rodgers J., Celebi M. Comparison of the dynamic
parameters extracted from weak, moderate and strong building motion. In 1st European
Conference of Earthquake Engineering and Seismology, Geneva, September 2006;
1021.12. Michel C., Guéguen P. Tme-frequency analysis of small frequency variations in civil
engineering structures under weak and strong motion using reassignment method,submitted in Structural Health Monitoring 2009.
8/14/2019 Full scale dynamic Response Analysis of RC Building under weak seismic motions
http://slidepdf.com/reader/full/full-scale-dynamic-response-analysis-of-rc-building-under-weak-seismic-motions 19/20
19/20
13. West W. M. Illustration of the use of modal assurance criterion to detect structuralchanges in an orbiter test specimen. In: Air Force Conference on Aircraft Structural In-
tegrity 1984; 1–6.
14. He J., Fu Z.-F. Modal analysis. Butterworth-Heinemann Editor, 2001; 304 pages, ISBN-
13:978-0750650793.
15. Peeters B., De Roeck G. Stochastic system identification for operational modal analysis:
a review. Journal of Dynamic Systems, Measurement and Control 2001; 123: 659–667.16. Cunha A., Caetano E. From Input-Output to Output-Only Modal Identification of CivilEngineering Structures. In Proc. 1st International Operational Modal Analysis Confer-
ence, Copenhagen, 2005
17. Volant P., Orbovic N., Dunand F. Seismic evaluation of existing nuclear facility using
ambient vibration test to characterize dynamic behavior of the structure and microtremormeasurements to characterize the soil: a case study. Soil Dynamics and Earthquake En-
gineering 2003; 22: 1159-1167.
18. Thouvenot F., Fréchet J., Jenatton L., Gamond J.-F. The Belledonne Border Fault: iden-tification of an active seismic strike-slip fault in the Western Alps. Geophysical Journal
International 2003; 155: 174-192.
19. Lebrun B., Hatzfeld D., Bard P.-Y. A site effect study in urban area: experimental re-sults in Grenoble (France). Pure and Applied Geophysics 2001; 158: 2543-2557.
20. Guéguen P., Cornou C., Garambois S., Banton J. On the limitation of the H/V spectralratio using seismic noise as an exploration tool: application to the Grenoble valley(France), a small apex ratio basin. Pure and Applied Geophysics 2007; 164 (1): 115-134.
21. Péquegnat C., Guéguen P., Hatzfeld D., Langlais M. The French Accelerometric Network (RAP) and National Data Centre (RAP-NDC). Seismological Research Letters
2008; 79 (1): 79-89.
22. Chatelain J.-L., Guéguen P., Guillier B., Fréchet J., Bondoux F., Sarrault J., Sulpice P.and Neuville J.M. Cityshark: A user-friendly instrument dedicated to ambient noise (mi-crotremor) recording for site and building response studies. Seismological Research Let-
ters 2000; 71 (6): 698–703.
23. Michel C., Guéguen P., Bard P.-Y. Dynamic parameters of structures extracted fromambient vibration measurements: An aid for the seismic vulnerability assessment ofexisting buildings in moderate seismic hazard regions. Soil Dynamics Earthquake
Engineering 2008; 28(8): 593–604.
24. Arias. A measure of earthquake intensity,. In Seismic Design of Nuclear Power Plants,
Hansen R.J. editor, The MIT Press: Cambridge, MA, 1970.25. HAZUS. Earthquake loss estimation methodology. Federal Emergency Management
Agency, Washington, D.C., 1999.
26. Guéguen P., Bard P.-Y. Soil-structure and soil-structure-soil interaction: experimentalevidence at the Volvi test site. Journal of Earthquake Engineering 2005; 9 (5): 657-693.
27. Meli R., Faccioli E., Murià-Vila D., Quaas R., Paolucci R. A study of site effects andseismic response of an instrumented building in Mexico City. Journal of Earthquake
Engineering 1998; 2 (1): 89-111.
28. Bard P.-Y. The importance of rocking in building motion: an experimental evidence. In
Proc. of the Ninth World Conference on Earthquake Engineering, Tokyo-Kyoto, August
2-9, 1988; VIII: 333-338.
29. Brincker R., Zhang L., Andersen P. Modal identification of output only systems usingfrequency domain decomposition. Smart Materials and Structures 2001; 10: 441–445.

8/14/2019 Full scale dynamic Response Analysis of RC Building under weak seismic motions
http://slidepdf.com/reader/full/full-scale-dynamic-response-analysis-of-rc-building-under-weak-seismic-motions 20/20
30. Welch P.D. The use of Fast Fourier Transform for the estimation of power spectra: amethod based on time averaging over short, modified periodograms. IEEE Trans. Audio
Electroacoust , 1967; AU-15: 70-73.
31. Brincker R., Ventura C., Andersen P. Damping estimation by Frequency Domain De-composition. In 19th International Modal Analysis Conference, Kissimmee, Florida,
2001; 698–703.
32. Allemang R.-J., Brown D.-L. A correlation coefficient for modal vector analysis. In 1st International Modal Analysis conference (IMAC), 1982, Orlando, Florida.33. Safak E. Identification of linear structures using discrete time filters. Journal of Struc-
tural Engineering ASCE 1991; 117: 3064-3085.
34. Clayton R. W., Wiggins R. Source shape estimation and deconvolution of teleseismic body waves. Geophysical Journal of the Royal Astronomical Society 1976; 47: 151-177.
35. Ventura C., Laverick B., Brincker R., Andersen P. Comparison of dynamic characteris-tics of two instrumented tall buildings. In Proceedings of the 21st International Modal
Analysis Conference (IMAC), Kissimmee, Florida, 2003.
36. Celebi M. Dynamic characteristics of five tall buildings during strong and low-amplitude motions. The Structural Design of Tall Buildings 1993; 2: 1–15.
37. Celebi M. Before and after retrofit - Response of a building during ambient and strongmotion. Journal of Wind Engineering and Industrial Aerodynamics 1998; 77: 259–268.
38. Ventura C., Liam Finn W.-D., Lord J.F., Fujita N. Dynamic characteristics of a base iso-lated building from ambient vibration measurement and low level earthquake shaking.Soil Dynamics and Earthquake Engineering 2003; 23: 313–322.
39. Brincker R., Ventura C., Andersen P. Why output-only modal testing is a desirable toolfor a wide range of practical applications. In 21st International Modal Analysis Confer-
ence (IMAC), Kissimmee, Florida, 2003.
40. Clough R.W., Penzien J. Dynamics of Structures, Mc Graw-Hill, 1993.
41. Trifunac M.D., Brady A.G. A study of the duration of strong earthquake ground motion. Bulletin of seismological Societey of America 1975; 65: 581-626.
42. Guedes J., Pégon P., Pinto A. A fibre Timoshenko beam element in CASTEM 2000.Special publication nr. i.94.31. Technical report, J.R.C., I-21020, Ispra, Italy, 1994.
43. Laborderie C. Phénomènes unilatéraux dans un matériau endommageable: modélisation
et application à l’analyse des structures en béton. PhD Thesis, Université Paris 6,
France, 1991.
44. Menegoto M., Pinto P. Method of analysis of cyclically loaded reinforced concrete plane frames including changes in geometry and non-elastic behaviour of elementsunder combined normal force and bending. In IABSE Symposium on resistance and
ultimate deformability of structures acted on by well-defined repeated loads, final
report, Lisbon, 1973; page 328.45. Boutin C., Hans S., Ibraim E., Roussillon P. In Situ experiments and seismic analysis of
existing buildings - Part II: Seismic integrity threshold. Earthquake Engineering and
Structural Dynamics 2005; 34 (12): 1531–1546.


![Weak Signals RC Club RC Expo 2016 - Toledo Show€¦ · Hitec RCD USA, Inc. / 12115 Paine St. Poway, CA 92064 / [858] 748-6948 / 1. Superior servo innovation that is engineered, designed](https://static.fdocuments.us/doc/165x107/5eb5c67e4ac89e1e9f78d192/weak-signals-rc-club-rc-expo-2016-toledo-show-hitec-rcd-usa-inc-12115-paine.jpg)