Full Report—English
216
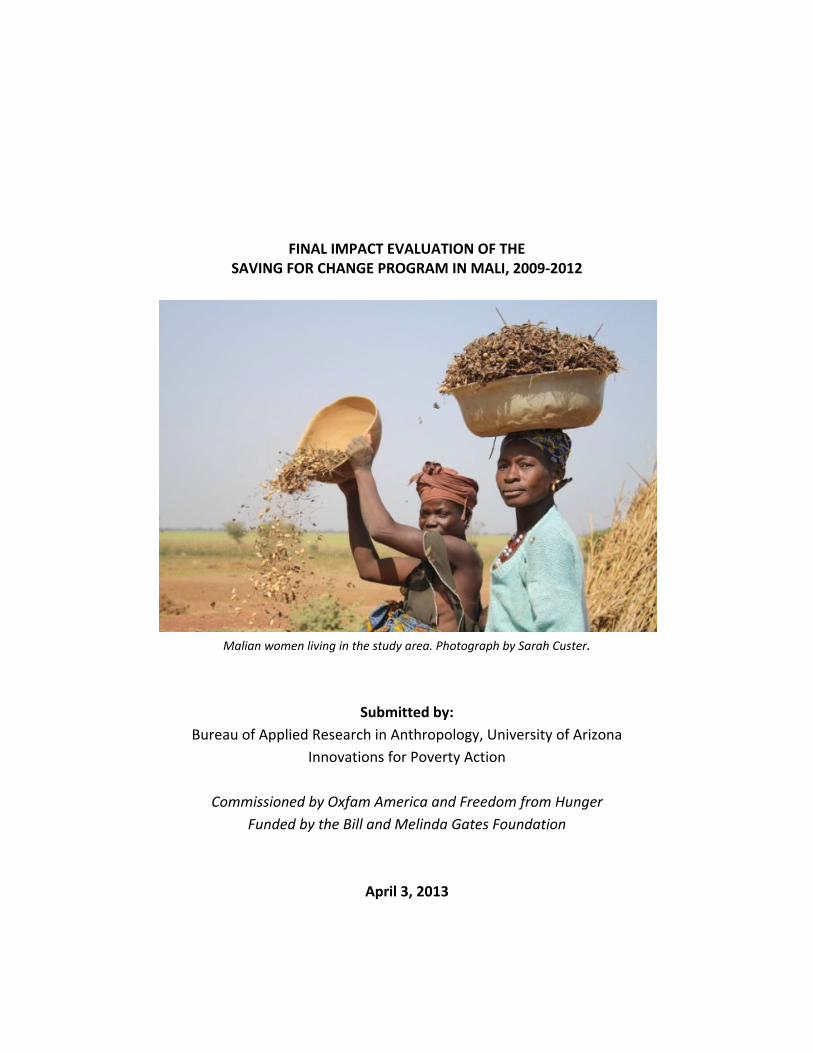
FINAL IMPACT EVALUATION OF THE SAVING FOR CHANGE PROGRAM IN MALI, 2009‐2012 Malian women living in the study area. Photograph by Sarah Custer. Submitted by: Bureau of Applied Research in Anthropology, University of Arizona Innovations for Poverty Action Commissioned by Oxfam America and Freedom from Hunger Funded by the Bill and Melinda Gates Foundation April 3, 2013
Transcript of Full Report—English
FINAL IMPACT EVALUATION OF THE SAVING FOR CHANGE PROGRAM IN MALI, 2009‐2012
Malian women living in the study area. Photograph by Sarah Custer.
Submitted by:
Bureau of Applied Research in Anthropology, University of Arizona
Innovations for Poverty Action
Commissioned by Oxfam America and Freedom from Hunger
Funded by the Bill and Melinda Gates Foundation
April 3, 2013

1
TABLE OF CONTENTS
LIST OF TABLES ................................................................................................................................................... 5
LIST OF FIGURES ................................................................................................................................................. 7
LIST OF ACRONYMS ............................................................................................................................................ 8
EXECUTIVE SUMMARY ...................................................................................................................................... 10
1. Program Background .......................................................................................................................................... 10
2. Research Objectives and Methodology .............................................................................................................. 11 Quantitative methodology (IPA) ........................................................................................................................ 12 Qualitative Methodology (BARA) ....................................................................................................................... 12
3. Summary of Overall Findings .............................................................................................................................. 13
4. Recommendations .............................................................................................................................................. 15 Structured replication ........................................................................................................................................ 15 Expanding on the SfC platform .......................................................................................................................... 16 Revisions to program monitoring and evaluation .............................................................................................. 16
5. Report Structure ................................................................................................................................................. 17
I. INTRODUCTION .............................................................................................................................................. 18
1. Background on the Saving for Change program ................................................................................................. 18
2. Research methodology overview ....................................................................................................................... 22
II. SUMMARY OF QUANTITATIVE FINDINGS (INNOVATIONS for POVERTY ACTION) ............................................ 27
1. Introduction ........................................................................................................................................................ 27 Research questions ............................................................................................................................................ 27
Participation .................................................................................................................................................. 27 Impact ........................................................................................................................................................... 27 Replication ..................................................................................................................................................... 28
Design and sample information ......................................................................................................................... 28 Background research ..................................................................................................................................... 29 Quantitative evaluation methodology .......................................................................................................... 29
Data Collection ................................................................................................................................................... 32
2. Baseline descriptive statistics and balance check ............................................................................................... 35 Balance check ..................................................................................................................................................... 35 Descriptive Statistics .......................................................................................................................................... 36
3. Adoption ............................................................................................................................................................. 38 Adoption rates ................................................................................................................................................... 38 Characteristics of adopters ................................................................................................................................ 40
Adopters vs non‐adopters ............................................................................................................................. 40 Early vs. late adopters ................................................................................................................................... 43

2
4. Use of SfC ............................................................................................................................................................ 44 Share‐outs .......................................................................................................................................................... 45 Loans .................................................................................................................................................................. 45
5. Impacts of SfC ..................................................................................................................................................... 47 Empirical strategy .............................................................................................................................................. 47 Financial Management ....................................................................................................................................... 48 Health, shocks and food security ....................................................................................................................... 50
Health expenses............................................................................................................................................. 50 Shocks ............................................................................................................................................................ 50 Food security ................................................................................................................................................. 51
Malaria ............................................................................................................................................................... 52 Investment and economic activities .................................................................................................................. 53
Education ....................................................................................................................................................... 53 Businesses ...................................................................................................................................................... 54 Agriculture ..................................................................................................................................................... 55 Livestock ........................................................................................................................................................ 55 Housing .......................................................................................................................................................... 57 Paid Labor ...................................................................................................................................................... 57
Social capital ...................................................................................................................................................... 58 Female Decision‐making Power ......................................................................................................................... 58 Consumption and poverty ................................................................................................................................. 59 Heterogeneity .................................................................................................................................................... 60
Household Type ............................................................................................................................................. 60 Household Wealth ......................................................................................................................................... 61 Household Ethnicity ....................................................................................................................................... 61 Structured vs. organic SfC replication ............................................................................................................ 61
6. Cost‐Benefit Analysis .......................................................................................................................................... 62 Overall SfC Program ........................................................................................................................................... 62 Structured vs. organic replication ...................................................................................................................... 63
7. Conclusions ......................................................................................................................................................... 63
III. SUMMARY OF QUALITATIVE FINDINGS (BUREAU OF APPLIED RESEARCH IN ANTHROPOLOGY AT THE
UNIVERSITY OF ARIZONA) ................................................................................................................................. 66
1. Research objectives and methodology ............................................................................................................... 66 Introduction ....................................................................................................................................................... 66 Research Areas ................................................................................................................................................... 66 Methodology ...................................................................................................................................................... 68
Sampling ........................................................................................................................................................ 69 Team Training ............................................................................................................................................... 70 Fieldwork ....................................................................................................................................................... 71
Limitations and constraints ................................................................................................................................ 72 Comparability with prior research ..................................................................................................................... 73
2. Context ................................................................................................................................................................ 75 Overview of sample villages ............................................................................................................................... 75

3
Village size ..................................................................................................................................................... 76 Accessibility ................................................................................................................................................... 76
Ethnicity, caste, religion, and socioeconomic stratification ............................................................................... 78 Leadership and political structure...................................................................................................................... 79 Household characteristics .................................................................................................................................. 79 Livelihood Strategies .......................................................................................................................................... 80 Economic strategies and relative wealth ........................................................................................................... 81 Gender relationships .......................................................................................................................................... 82 Large‐scale economic transitions ....................................................................................................................... 83
Land tenure ................................................................................................................................................... 83 Economic insecurities .................................................................................................................................... 84 Seasonal migration ........................................................................................................................................ 84 Resilience to Shocks ....................................................................................................................................... 84
Coping strategies ................................................................................................................................................ 85
3. Findings: impacts of SfC ...................................................................................................................................... 86 Systems of Savings and Credit ............................................................................................................................ 86
Household credit and informal loan activity ................................................................................................. 86 Effects of credit at the household level ......................................................................................................... 88 Strategies for consumption smoothing and loans ......................................................................................... 90 Credit and risk management ......................................................................................................................... 90 Uses and impacts of SfC loans and profit ...................................................................................................... 92
Households and Livelihood Strategies ............................................................................................................... 95 Migration and remittances ............................................................................................................................ 95 Coping strategies ........................................................................................................................................... 96
Women’s Participation ....................................................................................................................................... 96 Shifts in women’s livelihood activities ........................................................................................................... 96 Women’s empowerment and social capital .................................................................................................. 97
Operational findings ......................................................................................................................................... 100 Variations on SfC structure and replication ................................................................................................. 102 Institutional weaknesses with Malian NGO partners .................................................................................. 103 Factors contributing to SfC success ............................................................................................................. 104 SfC in context: a comparison over time ....................................................................................................... 104 Previous experience with savings, credit and collective work as predictor of SfC success .......................... 105 Women's agency as predictor of SfC success .............................................................................................. 106 Strength of social and family networks as predictor of SfC success ............................................................ 107 Three years later: SfC effects in conducive and hostile environments ......................................................... 107
3. Conclusions ....................................................................................................................................................... 109
IV. JOINT FINDINGS AND RECOMMENDATIONS ............................................................................................... 112
1. Overview of joint findings ................................................................................................................................. 112
2. Characteristics of group members and spread of SfC ....................................................................................... 113 Program adoption: control spillover ................................................................................................................ 114 Structured replication is more effective than organic replication ................................................................... 115 Use of loans and share‐outs ............................................................................................................................. 115

4
Significant economic effects of SfC .................................................................................................................. 116
3. Household Level Impacts .................................................................................................................................. 117 Positive effects on decreasing food insecurity ................................................................................................. 117 Interpreting social capital ................................................................................................................................ 118 Intra‐household decision‐making .................................................................................................................... 120 Interpreting significance of livestock ............................................................................................................... 121 Interpreting the effects on migration .............................................................................................................. 122
4. Potential effects of political and economic crises on the program .................................................................. 122
APPENDIX A: IPA QUANTITATIVE DATA TABLES ............................................................................................... 125
APPENDIX B: HIGH FREQUENCY VILLAGE CASE STUDIES (IPA and BARA) .......................................................... 170
APPENDIX C: VILLAGE PROFILES (NEW BARA RESEARCH SITES IN 2012) ............................................................ 204
APPENDIX D: CONTACT INFORMATION FOR RESEARCH TEAMS ........................................................................ 214
5
LIST OF TABLES
Table 1: Summary Statistics of Saving for Change in Mali (MIS data as of April 2013) ................ 22
Table 2. Summary of Study Phases, 2008‐2012 ............................................................................ 24
Table 3: Project Timeline .............................................................................................................. 33
Table 4: BARA Study Sites in 2012 ................................................................................................ 70
Table A1.1a: Number of villages in sample……………………………………..……………………….….…………129
Table A1.1b: Number of observations and sample attrition…………………………………….….…………129
Table A2.1: Balance check using baseline survey data………………………………….…………..……………130
Table A3.1a: Take‐up ………………………………………………………………………………………………..……………132
Table A3.1b: Uptake of SfC over time………….………………………….………………….………….………………133
Table A3.1c: Take‐up by per capita food consumption tercile………………………………………..………134
Table A3.2a Comparison of baseline characteristics of SfC members vs. non‐members in
treatment villages……………………………………………………………………………………………………………..…..135
Table A3.2b: Comparison of baseline characteristics of SfC members vs. non‐members in
social network treatment villages…………………………………………………………………………………………. 136
Table A3.3 Comparison of baseline characteristics of Early vs. Late adopters in treatment
villages………………………………………………………………………………………………………………………………….. 137
Table A3.4a Take‐up in control villages as a function of number of nearby treatment
villages………………………………………………………………………………………………………………………………….. 138
Table A3.4b Take‐up in control villages as a function of distance to closest treatment
village…………………………………………………………………………………………………………..………………………..138
Table A4.1a: Characteristics and uses of SfC.………………………….………………………………………………139
Table A4.1b: Characteristics and uses of SfC.………………………….………………………………………..……139
Table A4.1c: Characteristics and uses of SfC.…………………………..…………………..…………………..……140
Table A4.1d: Distribution of SfC share‐outs by month.…………………………………………………..………141

6
Table A4.2a: Share‐outs use by wealth tercile.……………….…………………………………………………..…141
Table A4.2b: Loans use by wealth tercile.……………….……………………………………………..………………142
Table A5.1. Impact estimates ‐ Financial management.………………….….……..…………..………………143
Table A5.2. Impact estimates ‐ Health, shocks and food security………………………………………..…145
Table A5.3. Impact estimates ‐ Malaria…...………………….………….……….………….……….....……………147
Table A5.4. Impact estimates ‐ Investment.………………….……………………………………………..…..……148
Table A5.5. Impact estimates ‐ Empowerment and social capital.………………..…..…………..………152
Table A5.6. Impact estimates ‐ Consumption and Poverty.……………………………………………………154
Table A5.7 Sample information (high‐frequency sample).………………..……………………………………155
Table A5.8 Health (high‐frequency sample)…………………….……………………………..……..………………155
Table A5.9a Food consumption in lean season (high‐frequency sample)………….….………..………156
Table A5.9b Food consumption variability (high‐frequency sample)………….……….……………….…156
Table A5.10 Business (high‐frequency sample)………….….…………………………………………………….…157
Table A5.11: Heterogeneity of treatment effects according to Type of household …………………158
Table A5.12: Heterogeneity of treatment effects according to Food consumption …..….…….…161
Table A5.13: Heterogeneity of treatment effects according to Ethnicity..………………..………….…164
Table A5.14: Heterogeneity of treatment effects according to Type of replication ..…..……….…167
Table A6.1: Cost‐benefit ratios under different scenarios………………………………………..………….…169

7
LIST OF FIGURES
Figure 1: Map of Research Areas .................................................................................................. 25
Figure 2: Take‐up Overall .............................................................................................................. 38
Figure 3: Take‐up over time .......................................................................................................... 39
Figure 4: Member Characteristics ................................................................................................. 40
Figure 5: Characteristics and Uses of SfC, Share‐outs .................................................................. 45
Figure 6: Characteristics and Uses of SfC, Loans .......................................................................... 46
Figure 7: Impact on participation in SfC group ............................................................................. 48
Figure 8: Impact on savings .......................................................................................................... 49
Figure 9: Impact on loans .............................................................................................................. 49
Figure 10: Impact on reaction against shocks and food insecurity .............................................. 51
Figure 11: Impact on malaria knowledge ..................................................................................... 53
Figure 12: Impact on livestock ...................................................................................................... 56
Figure 13: Impact on poverty ........................................................................................................ 59
Figure 14: Density of distance to closest treatment village ....................................................... 127
Figure 15: Theory of change ....................................................................................................... 128

8
LIST OF ACRONYMS
BARA Bureau of Applied Research in Anthropology
BMGF Bill and Melinda Gates Foundation
BNDA Banque Nationale de Développement Agricole
CAEB Conseils et Appui pour Education à la Base (Advice and Support for Basic
Education)
CED Centre d’Éducation pour le Développement (Education Center for
Development)
CFA West African Franc
CMDT Compagnie Malienne du Développement des Textiles (Malian Textile
Development Company)
CSCOM Centre de Santé Communautaire (Community Health Center)
FFH Freedom from Hunger
GRAFE Groupe de Recherche pour la Femme et l’Enfance (Research Group for Women and Children)
G‐FORCE Groupe de Formation Consultation et d’Etude (Training, Consultation and
Study Group)
HHLS Household Livelihood Security
IFAD International Fund for Agricultural Development
IGA Income‐Generating Activity
IPA Innovations for Poverty Action
NGO Non‐governmental Organization
OA Oxfam America
PGRN Programme de Gestion des Ressources Naturelles (Natural Resources
Management Program)
ROSCA Rotating Savings and Credit Association
9
SfC Saving for Change
TU Technical Unit (for Saving for Change program, based in Bamako, Mali)
UA The University of Arizona
10
EXECUTIVE SUMMARY
Saving for Change (SfC) is a community savings group program designed and implemented by
Oxfam America, Freedom from Hunger, and the Strømme Foundation. SfC operates in 13
countries in West Africa, Latin America and Asia with the largest programs in Mali, Burkina
Faso, Niger, followed by Senegal, Benin, Cambodia, El Salvador, Honduras, Mexico, Colombia,
Uruguay, Brazil, Peru, and Guatemala. This final impact evaluation of the SfC program in Mali is
the result of a unique, collaborative research effort led by development economists based at
Innovations for Poverty Action (IPA) and applied anthropologists at the Bureau of Applied
Research in Anthropology (BARA) at the University of Arizona. The study was commissioned by
Oxfam America and Freedom from Hunger and funded by the Bill and Melinda Gates
Foundation. The innovative, mixed methods approach adopted in the study design is the first of
its kind to combine in‐depth qualitative and quantitative approaches to evaluate a community
microfinance program over a span of three years (2009‐2012). This report provides a joint
summary of the overall findings that combines results and analysis from both teams, as well as
individual quantitative and qualitative reports from each research group.
1. Program Background
The SfC program, which began in Mali in 2005, enables women to organize simple self‐managed
savings and credit groups. The program is meant to provide a locally appropriate tool for
villagers to manage their finances and to reach populations rarely served by formalized
institutional lenders. SfC’s fundamental approach starts with savings. Approximately 15 to 25
women voluntarily form a group that democratically elects officers and sets by‐laws. At weekly
meetings, each woman contributes a mutually agreed upon savings amount to a communal
fund, which grows in aggregate size each time the group meets. When a woman needs a loan,
she proposes the desired amount and intended purpose to the group. The group collectively
discusses whether there are enough funds and how to divide funds and prioritize requests.
Loans must be repaid with interest, at a rate set by the members. The interest collected on the
loans continually increases the size of the fund and the amount of money available to the
women. The commitment of regularly saving in a group mobilizes greater savings than each
woman could feasibly save individually. Each group manages its own funds that are mobilized
entirely from the internally generated savings with no matching or external loans provided.
At a predetermined annual date, the group divides the entire fund among members in a
process termed the ‘share‐out.’ Each member receives all her savings plus a share of the
income from interest on loans made to members over the year, fines for missing payments and
meetings, and the income generating activities carried out by the group proportionate to the

11
amount she saved over the year. The annual return on savings is 30% to 40% or more. The
timing of the payout often coincides with times of high cash flow requirements such as festivals
or the planting season. The group then decides whether to start a new cycle, and under what
conditions. At this time, groups sometimes opt to increase their weekly contributions, accept
new members or change elected positions. Among the principal advantages of the SfC program
is that since the group is lending its own money to its members, collateral is not required. The
fact that all money originates from the women themselves, as opposed to outside loans or
savings‐matching programs, increases transparency and incentives to manage this money well.
It also insures that money that may have been spent on tiny purchases is accumulated over the
year into a useful amount that can yield greater benefits for members and their households.
Oxfam America and Freedom from Hunger's SfC program began in Mali in 2005 with support
from the Strømme Foundation and in partnership with two original Malian NGOs, Tonus and
CAEB. In October 2005, a system of oral accounting was created that enabled the largely
illiterate members of the groups to keep accurate records, and in 2006, a pictorial training
manual was developed and used to successfully train new groups by volunteers (replicating
agents) that was accessible to women without any formal training in literacy. By July 2008, SfC
had 95,000 total members with a growth rate of 2,600 new members per month.
The Bill and Melinda Gates Foundation provided funding for a further expansion starting in
September 2008. New Malian NGO partners were recruited with the goal of completely
saturating all or most of four out of the five non‐desert regions in Mali (Kayes, Koulikoro, Segou,
and Sikasso). As of April 2013, the program serves a total of 423,654 members organized into
18,804 groups in Mali.1 This study focuses primarily on villages participating in SfC in the Ségou
region since 2009 (IPA and BARA) with some discussion of villages in other regions that have
been part of the program since 2005 (BARA).
2. Research Objectives and Methodology
The overall research objectives were: (1) to understand the role of SfC within the context of
larger household livelihood strategies and existing forms of savings and credit in Mali, (2)
better understand who participates in the program and why, (3) provide rigorous evidence on
the socioeconomic impacts of the SfC program on the lives of the people in the study region,
and (4) discern the relative merits of two different program replication strategies (structured
and organic) to see if the cost of providing additional training and support to the volunteer
replicating agents through structured replication yielded higher levels of outreach and program
1 These figures are from the most recent MIS data from Oxfam America (April 2013).

12
success as compared to providing replicating agents with informal one‐on‐one training through
organic replication.
The methodology was designed to provide complementary quantitative and qualitative data
sets to allow for statistical and case study analyses of SfC program participants and non‐
participants in treatment and control villages. By adopting a rigorous mixed methods approach,
the overall study developed a robust data set through which project impacts could be
triangulated from a variety of perspectives. The RCT provided the statistical power of a large
sample size. Qualitative research with a small, targeted sample of 19 villages selected
purposively to represent variation across SfC sites helped to interpret and contextualize
statistical findings and anomalous data.
Quantitative methodology (IPA)
The quantitative study was based on a randomized controlled trial (RCT) that measured the
socioeconomic impacts of the program in 500 villages (6000 households) over a three‐year
period with detailed socioeconomic surveys administered at the household level in 2009
(baseline) and again in 2012 (endline). In addition, a subset of 600 households from both
treatment and control villages was also selected to participate in additional high‐frequency
surveys between June 2010 and January 2012 on topics including health, financial transactions,
assets, income‐generating activities and consumption. This dataset provides a dynamic picture
of the households studied over time as a complement to the baseline and endline evaluation
data.
Qualitative Methodology (BARA)
The BARA study included a purposive sample of 19 total villages, 15 of which were selected
from among the IPA sites in Segou and four of which were located outside the RCT zone and
had participated in SfC since 2005. The study sites were chosen to maximize diversity in terms
of geographic location and accessibility, ethnic composition of villages, major livelihood
strategies, and representation of Malian NGO partners involved in the program. Qualitative
data were collected with community interviews, focus group discussions, key informant
interviews (with technical and replicating agents, NGO coordinators, female members and non‐
members and their husbands and other key opinion leaders in villages) during a period of 2‐3
days spent in each village in 2009 and 2012.
Villages with a longer history of participation since 2005 provided additional data on functional
aspects of the SfC program over time. Research in these villages was oriented toward gaining a
qualitative understanding of how savings and credit systems function in relation to local

13
livelihood strategies and the ways in which community members are modifying the SfC model
to meet local conditions and needs.
3. Summary of Overall Findings
Who joins SfC?
IPA found that the women who became members of SfC in treatment villages were on average
slightly older, more socially connected and wealthier than non‐members, a finding consistent
with the impressions of technical agents in the BARA interviews. This does not indicate that SfC
is not reaching the poorest of the poor given that all villages in the sample are very poor (with a
majority of households living under 1 USD per day) and many are very remote. Moreover,
participation rates are fairly similar across the entire wealth distribution. IPA data also shows
that as the program matures, SfC members are more representative of all women in the village.
Women who waited at least six months after SfC began in their village before joining the
program tended to be slightly younger and less socially integrated than the first adopters of the
program. It should also be noted that the SfC program was adopted in some of the control
villages (take‐up of 12%), and therefore some impacts may be underestimated.
Impacts
The RCT provided evidence that in villages where SfC was introduced, the program led to
positive and statistically significant economic effects, compared to control villages where SfC
was not introduced. However, many of these effects were small overall. Even though only 30%
of the women sampled had joined SfC groups between the baseline and the endline, the SfC
intervention led to overall increases in savings (an increase of 31%), amounts of money
borrowed from savings groups by women in SfC villages (12% more women in treatment
villages reported borrowing from savings groups), and households’ livestock holdings (which
increased in value by 13% in treatment villages). Perhaps the most promising finding was a
significant improvement in Freedom from Hunger’s food security index, which dropped by four
percentage points in treatment villages, a finding corroborated by evidence from the high‐
frequency component of the study that suggests that SfC is helping households to smooth
consumption over seasonal periods of greater food insecurity.
Malaria education is part of the SfC program and IPA’s data demonstrated that small statistical
improvements were made in terms of malaria knowledge in treatment sites. Control group
women were three percentage points less likely to correctly identify at least two ways to
prevent malaria (66% compared to 69%). More specifically, women in treatment villages were
14
4% more likely to mention mosquitoes as a cause of malaria. Knowledge on the preventive
properties of bednets was also more common in treatment villages (63%) compared to control
villages (58%).
However, there were also many areas in which IPA did not find significant differences between
treatment and control villages. There was no measurable impact of SfC on how households deal
with health expenses, and small or no significant impacts on school enrollment, business
development or expansion, agricultural inputs, or household and agricultural assets. Some of
these effects were not anticipated to occur this early in the life of the program by Oxfam
America's theory of change model, and may yet develop.
Generally, IPA impact estimates are compatible with BARA's analysis, which finds that SfC
provides meaningful benefits to communities in mitigating the adverse consequences of shock,
but cannot in itself reverse poverty or transform household economies.
One area in which BARA and IPA data diverge is in their measure of SfC's impact on social
capital. IPA did not see changes in the outcomes measured related to social capital or female
empowerment as a result of SfC. In contrast, BARA's findings consistently indicate a perceived
increase in social capital in SfC villages in terms of village‐level solidarity and contact with other
women. Women in SfC villages identify this perceived increase in social solidarity among
women as the program’s most important benefit to women at the village level. This perception
is consistent with feedback received by Oxfam America's technical unit that for most women,
social cohesion is the most important aspect of the program, even more so than the access to
credit or entrepreneurial development that are the nominal purpose of the groups.
Replication Strategies
Villages where replicating agents received more structured and formal training had significantly
more SfC members, on average, than those with replicating agents who shadowed the role of
the technical agent in their own groups and received less formal training in the organic
replication model. Structured replication, in which replicators participate in a three‐day NGO‐
sponsored training, are given a pictorial manual, and receive a certificate upon completion, also
led to larger impacts for outcomes such as savings, food security, livestock holdings and
poverty.2 BARA also found strong signs that organic replication has significant drawbacks
compared with structured replication, including a pervasive sense that for risk‐averse women,
2 Poverty here is defined according to the Progress out of Poverty (PPI) index detailed in IPA’s section of the report.

15
the perception of a lesser degree of knowledge and authority on the part of village agents
without formal training undermines their ability to support the group as effectively as an agent
with formal training might. Group members are more likely to adopt changes and variations in
SfC structure when formally trained replicating agents suggest modifications.
4. Recommendations
Both BARA and IPA would emphasize that SfC is an effective program providing real
socioeconomic benefits to its intended populations. Research from 2009‐2012 consistently
indicates that some of the major strengths of the SfC program include its inherent accessibility
and appeal to poor and illiterate women, especially those who live in remote areas and do not
have access to formal financial services, ease of replication, and potential for long‐term
sustainability. IPA observed that 12% of respondents in control villages had joined a group
similar to SfC through replication (i.e. without a technical agent forming groups). This
demonstrates that women in Mali perceive real benefits to participating in SfC and have found
ways to participate without formal training or NGO involvement.
Although the quantifiable impacts of the program are modest, these modest changes can be
highly meaningful in the context of poverty. Improved food security and an ability to smooth
consumption and cope with risk is crucial in an environment like Mali’s with severe poverty and
few if any formal safety net systems. In particular, recent political strains introduced by the
coup against the Malian presidency, the Tuareg rebellion and attempted secession and growing
influence of Islamic extremist groups in northern Mali have all contributed to increases in
socioeconomic instability, household food shortages, rising numbers of internally displaced
persons, and cessation of external support from development agencies, such as the US Peace
Corps, that have suspended operations during the present period of unrest. The three‐year
time frame of the evaluation necessarily leaves questions about the real and long‐term
economic impacts unanswered, as well as the interactional effects over time of factors that
were found to be significant, such as asset‐building impacts for livestock, signs of improved
consumption smoothing, or increases in perceived and real resilience to shocks. The flexibility,
transparency and reliability of SfC in comparison to other available systems of savings and
credit suggest that the program is not merely providing marginal benefits by replacing slightly
less optimal alternatives, but is uniquely well adapted to the needs of Malian women over time.
Structured replication
First, based on results on structured versus organic replication of the program, it is clear that
structured replication, in which village replicating agents receive a formalized training
sponsored by the local Malian NGO partner and a pictographic manual, yields better long‐term
16
results for SfC participation and sustainability at small additional costs to the sponsors,
estimated at an additional 40 cents per household. IPA results show that 40% of women joined
groups in villages with structured replication while 32% joined groups in villages relying on
organic replication. The formal training of replicating agents provides a good return on
investment. We thus recommend that structured replication be formally incorporated into the
program structure in all new expansion areas.
Expanding on the SfC platform
IPA data showed that women in treatment villages had more knowledge about the causes of
malaria than women in control villages, as a result of Freedom from Hunger’s malaria training
module. This demonstrates that SfC groups can serve as a platform for training. In fact, from
BARA’s interviews, women who participate in SfC desire more opportunities for additional
education and training within their group structure, both in the area of microenterprise
development (such as marketing, basic accounting, and product development skills that would
allow women to take better advantage of their access to SfC loans), and more generally.
Providing a menu of such options that could be facilitated by Malian NGOs and other partners
would allow participants to build on their social networks and effectively use SfC as a platform
from which to build capacities in new areas and to address the most critical factors that limit
group members’ economic potential. Some areas of interest expressed by participants included
improved water access (harvesting techniques, maintenance for borehole wells and pumps, and
the development of water cisterns), livestock vaccinations, health awareness and disease
prevention, and basic literacy and numeracy programs.
Revisions to program monitoring and evaluation
Monitoring program success should seek to go beyond the current focus among Malian NGO
partners on process outcomes, in order to better reflect more of the nuanced dynamics that
serve as true indicators of the program’s sustainability. Women in SfC negotiate between
competing demands: the desire to generate revenue; and the real and daily demands of
consumption. The core, unique strength of SfC lies in women’s ability to independently and
flexibly adjust its parameters according to their own needs. If monitoring and evaluation by
Malian NGO partners continues to overly emphasize factors such as the total number of groups
formed, interest rate, and number and size of loans, the system potentially places women
under pressure, implicitly or explicitly, to adopt group regulations that do not conform to their
lived socioeconomic reality.

17
5. Report Structure
This report is comprised of four main sections: the first part outlines the background and
structure of the SfC program and research methodology of both teams. The second section is a
summary of the quantitative results from the RCT led by IPA in 500 villages in Segou from 2009‐
2012, and the third section summarizes qualitative analysis by BARA based on research in 19
total villages. In the fourth and final section, IPA and BARA jointly discuss the findings of their
research, highlighting the commonalities and discrepancies, and providing recommendations to
strengthen the existing model for future expansion. Two appendices contain detailed case
study profiles on households that took part in IPA’s high frequency financial diary research and
general village level profiles of new sites in BARA’s qualitative sample that were not included in
the 2010 baseline report village profile appendix.
18
I. INTRODUCTION
This joint report presents the results of a large‐scale, mixed methodology study funded by the
Bill and Melinda Gates Foundation on the impacts of the Saving for Change program in Mali.
Since 2005, the program has been sponsored by Oxfam America, Freedom from Hunger and the
Stromme Foundation in Mali. It has spread rapidly in the interim and benefits 424,290 women
in Mali in a total of 18,785 savings groups as of 2013. Longitudinal research was conducted
from 2008‐2012 by two complementary research teams: Innovations for Poverty Action (IPA)
led a quantitative randomized controlled trial (RCT) in 500 villages and the Bureau of Applied
Research in Anthropology (BARA) at the University of Arizona led a qualitative study of 19
purposively selected villages within that larger sample. This joint report provides an overview of
the findings of both teams and discusses key areas of convergence and difference in examining
the impacts of SfC at the household and community levels.
The main findings presented here indicate that while SfC’s impact is moderate overall, it is
nevertheless significant in helping the poorest of the poor, and we believe that SfC holds the
promise for greater impacts over a longer period of time. Two of the most encouraging findings
in terms of program impact are that SfC has had a significant positive effect on the
accumulation of assets – both financial assets and livestock – and on households’ ability to
smooth consumption over the year, resulting in improved household food security as measured
by the Freedom from Hunger (FFH) indices. We find weak and limited evidence for increased
entrepreneurial activity and the quantitative and qualitative evidence diverges on SfC’s impact
on social capital and intra‐household decision‐making.
1. Background on the Saving for Change program
During the last several decades, microfinance institutions have provided millions of low‐income
individuals, particularly women, with access to credit. Despite much success, microfinance
institutions are not a panacea. Although they provide opportunities to many vulnerable
individuals in rural areas, microfinance institutions also have drawbacks. For example, they can
be slow to develop, may require considerable support, and tend to work better in densely
populated areas with larger numbers of low‐income individuals. Rural areas are disadvantaged
in terms of coverage; the costs of delivery are high and the demand is low for loans large

19
enough to turn a profit. Consequently, the majority of the world’s rural poor lack access to
basic financial services.3
Recent randomized evaluations show that microcredit provision can spur business investment
and help firms reduce risk. However, the available evidence has not found that microcredit
programs lead to an overall reduction in poverty amongst beneficiaries and their broader
communities, nor do they significantly affect education outcomes, health care usage, or female
empowerment.4 These findings support the observation that although credit can be an
important resource for the poor, other tools, particularly savings and insurance, are also likely
important for improving the financial management capacity and welfare of the poor.
Revolving Savings and Credit Associations (ROSCAs) and Accumulating Savings and Credit
Associations (ASCAs) are a partial solution, operating at the village‐level in many African, Asian,
and Latin American villages. In ROSCAs, women form groups that meet at regular intervals
during which each member contributes a pre‐determined amount. The sum of the
contributions is given to a different woman to take home each meeting. However, ROSCAs tend
to be poorly organized, often lack transparency, and are subject to misuse. ROSCAs also are
limited in the flexibility they can offer members: Members cannot take out loans or vary the
amount contributed. ASCAs build on the ROSCA model by incorporating lending: Women form
similar groups, but instead of disbursing funds at each meeting the contributions are saved and
lent out with interest to group members. After all loans are repaid, the final sum plus any
interest earned is divided among the group members. While traditional ASCAs do help alleviate
some of the shortfalls of the ROSCA model, they often continue to have challenges in terms of
group management. There is scope for developing a modernized version of these groups;
specifically, if ROSCAS and ASCAs could be transformed into effective group‐managed
structures for saving and borrowing, they may overcome the limitations faced by microfinance
institutions.
In response to the vast need for more transparent, better managed and more profitable village
level savings tools, Oxfam America, the Stromme Foundation, and Freedom from Hunger
developed an innovative savings‐led financial mechanism that gives people more financial
control over their future by greatly improving on traditional models.5 This program, called
3 Banerjee et al. (2007). “The Economic Lives of the Poor” J Econ Perspect.; 21(1): 141–167. 4 Bauchet et al. (2011), “Latest Findings from Randomized Evaluations of Microfinance”, CGAP, FAI, IPA and J‐PAL. 5 Baseline data from this evaluation confirmed that there is indeed a strong need for improved access to
finance in this region. For example, 40% of households reported not having enough food some times of

20
Saving for Change (SfC), is a community‐based savings group program and is a radical break
from microcredit. SfC has been launched in Mali, Senegal, Niger, Burkina Faso, Benin,
Cambodia, El Salvador, Honduras, Mexico, Colombia, Uruguay, Brazil, Peru, and Guatemala. The
SfC program builds on the ASCA model, enables women to organize themselves into simple
savings and credit groups, and is meant to improve savings and credit opportunities, especially
for those who are not reached by institutional lenders and ROSCAs. SfC’s fundamental
approach starts with savings. Twenty or so women voluntarily form a group that democratically
elects officers, sets by‐laws, meets weekly, and collects savings from each member. At
meetings, each woman contributes a savings amount (previously established by the members)
to a communal pool, which grows in aggregate size each time the group meets. When a woman
needs a loan, she proposes the desired amount to the group. Once all demand has been voiced,
the group collectively discusses whether there are enough funds and how to divide funds, and
prioritizes requests if there is more demand than funds. Loans must be repaid with interest, at a
rate set by the members. Each group manages its own funds which are entirely internally
generated (with no matching or external loans provided), and all transactions occur in front of
the group for full transparency. In Mali, an oral accounting system is used to keep track of
savings amounts and outstanding loans, and likely facilitates more flexibility in terms of savings
and loans than could otherwise be accomplished in traditional ASCAs, since most women in
rural areas in Mali are illiterate.
At a predetermined date, the group divides the entire fund among members, which is referred
to as a share‐out. The timing can coincide with times of high cash flow requirements such as
festivals, the planting season, or the “hungry” season. The interest from the loans gives each
member a positive interest rate. The group then decides whether to start a new cycle, and
under what conditions. At this time, groups sometimes opt to increase their weekly
contributions, accept new members, or change leadership positions. Among the principal
advantages of the SfC program is that, because the group is lending its own money to its
members, collateral is not required. The fact that all money originates from the women
themselves, as opposed to outside loans or savings‐matching programs, also increases the
incentives to manage this money well. SfC also improves upon the traditional ASCA model by
the year, and the same number of households reported that they experienced a large shock within the
last year. Household shocks are often caused by unexpected problems related to agricultural production
or health of household members. When households do not have savings in place to help cope with such
shocks, they often resort to costly coping strategies such as selling livestock or cereal, removing children
from school, reducing household consumption, or migrating outside their village. Additional descriptive
statistics are presented in Section 2 of chapter II below.

21
using an oral accounting system, which allows for greater transparency in the group and
reduces barriers faced by women who are illiterate.
The program is spread through technical agents (also known as animators). The model is
designed under the premise that in the first year, an employee of a local, SfC‐promoting NGO
works with the first group(s) in a village. Through that process, the technical agent trains a
replicating agent, who is a woman local to that village. The goal of the program is that the
replicating agents then independently train new groups. In practice, however, technical agents
often assist replicating agents with training new groups.
Oxfam America/Freedom from Hunger are exploring two different methods for technical agents
to train replicating agents. This impact evaluation is designed to further investigate the ways in
which training methodology affects program impacts. The methods can be defined as follows:
Structured replication – replicators in this group participated in a formal three day
training. As part of the training, replicators received a pictorial guide and a certificate
stating they are certified to form SfC groups. Technical agents provide support to
replicators as they start their first groups. This training method is more organized and
intensive.
Organic replication – Replicators in this group are not provided with the formal training
and material resources that are provided in the structured replication method.
However, technical agents provide informal support to replicators by answering
questions and giving advice on an ad hoc basis. This training method is more informal.
While many of the original goals of SfC focus on finance and empowerment, SfC also has the
potential to be used as a platform for disseminating information on other important topics
related to household wellbeing. Information that needs to be disbursed over an extended time
period is ideally suited for the SfC model, where members are meeting regularly. Women also
have access to funds which may facilitate behavior changes based on such information. To
further investigate the complementarities that may exist between SfC and such a program, the
SfC program in this evaluation included an educational component developed by FFH and
designed to improve malaria knowledge and preventive behaviors. SfC was introduced in Mali
in October 2005. The program continued to expand, and by July 2008, SfC had 95,000 total

22
members with a growth rate of 2,600 new members per month. As of March 2013, SfC
membership is 423,654 women in a total of 18,804 savings groups.6
In September 2008, new Malian NGO partners were recruited with the goal of completely
saturating most of four out of the five non‐desert regions in Mali (Kayes, Koulikoro, Segou, and
Sikasso). The expansion of SfC in the Segou region provided an opportunity to evaluate the
program using a randomized controlled trial. Innovations for Poverty Action (IPA) and the
Bureau of Applied Research in Anthropology (BARA) at the University of Arizona partnered with
Oxfam America and Freedom from Hunger to implement the evaluation, the results of which
are presented in this report.
The following table provides summary statistics for the current program operations in Mali:
Table 1: Summary Statistics of Saving for Change in Mali (MIS data as of April 2013)
Number of SfC groups 18,804
Number of members 423,654
Group funds $6,865,207
Group funds per member $16
# of loans outstanding 266,131
Value of loans outstanding $5,802,108
Average loan size $22
% of funds allocated to loans 85.3%
% of members with loans 62.8%
Annual return on savings 33.6%
Cumulative savings $5,279,672
Savings per member $12
Average funds/ group $365
Average members/ group 22.5
2. Research methodology overview
The research methodology was designed to provide complementary quantitative and
qualitative data sets to allow for statistical and case study analyses of SfC program participants
6 These numbers are from the most recent MIS data as reported by the Technical Unit in Bamako to Oxfam America as of March 2013. These figures do not include additional spontaneous groups that formed without the involvement of an NGO technical agent.

23
and non‐participants in treatment and control villages. The IPA study comprised a randomized
controlled trial (RCT) of 500 villages and high frequency studies of a subset of 600 women in
treatment and control villages based on financial diaries collected at two‐week and three‐
month increments. The BARA study included 19 total villages, 5 of which were selected from
among the IPA sample villages (treatment and control), 10 of which participated in IPA’s high
frequency surveys (treatment and control), and four of which were located outside the RCT
expansion zone and had participated in the SfC program for a longer period of time. Detailed
explanations of the methodologies adopted by each team are provided in individual findings
sections of this report.
This is the first study of this scope on community microfinance that has undertaken
simultaneous, in‐depth mixed methods research over a four‐year period. By adopting a rigorous
mixed methods approach, the overall study developed a robust data set through which project
impacts could be triangulated from a variety of perspectives. The RCT provided the statistical
power of a large sample size of almost 6000 women and household interviews in 500 villages.
Qualitative research with a small, targeted sample of 19 villages selected purposively to
represent variation across SfC sites was particularly useful in determining the type of questions
to ask regarding program effectiveness and impacts, studying reported impacts, and
interpreting and contextualizing broader statistical findings and anomalous data. Upon the
completion of individual reports by both teams, findings were systematically compared to
determine points of similarity and discrepancy and to shape discussion on possible reasons for
differences.
The following table outlines all phases of the study, including BARA’s 2008 preliminary
operational study and the three‐year RCT and qualitative study by IPA and BARA, respectively
from 2009‐2012.

24
Table 2. Summary of Study Phases, 2008‐2012
Study Phase Dates of field
research
Type of
research
Research
agency
Number
villages
studied
Report Title
Operational
Evaluation in 4
Existing SfC Sites
July 2008 Qualitative BARA 4 Operational Evaluation of Saving for Change in Mali (2008)
Baseline Part 1:
Expansion Zone
Feb‐Apr 2009 Quantitative IPA 500 Baseline Study of
Saving for Change
in Mali (2010),
Section II
May 2009 Qualitative BARA 8
Baseline Part 2:
Existing SfC Sites
May 2009 Qualitative BARA 5 Baseline Study of Saving for Change in Mali (2010), Section III
Impact Study Part
1: Expansion Zone
Spring/Summer
2012
Quantitative IPA 500 Final Impact Evaluation of the Saving for Change Program in Mali, 2009‐2012 (2013)
Qualitative BARA 15
Impact Study Part
2: Existing SfC
Sites
Qualitative BARA 4
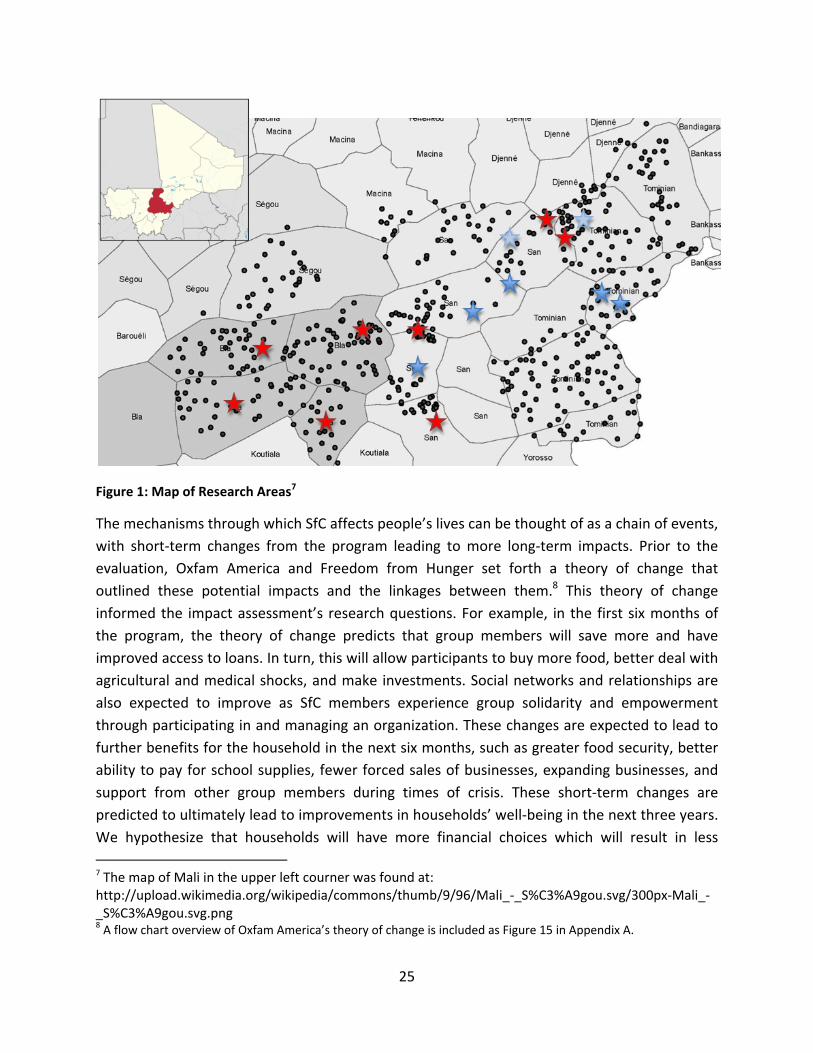
The map below shows the location of villages included in the 2009‐2012 impact study. The grey
points on the map indicate the villages in the RCT – both treatment and control villages. Stars
indicate villages included in the BARA study; among the treatment villages (blue stars), light
blue stars represent the organic replication strategy and dark blue for structured replication.
Red stars represent BARA control villages.
25
Figure 1: Map of Research Areas7
The mechanisms through which SfC affects people’s lives can be thought of as a chain of events,
with short‐term changes from the program leading to more long‐term impacts. Prior to the
evaluation, Oxfam America and Freedom from Hunger set forth a theory of change that
outlined these potential impacts and the linkages between them.8 This theory of change
informed the impact assessment’s research questions. For example, in the first six months of
the program, the theory of change predicts that group members will save more and have
improved access to loans. In turn, this will allow participants to buy more food, better deal with
agricultural and medical shocks, and make investments. Social networks and relationships are
also expected to improve as SfC members experience group solidarity and empowerment
through participating in and managing an organization. These changes are expected to lead to
further benefits for the household in the next six months, such as greater food security, better
ability to pay for school supplies, fewer forced sales of businesses, expanding businesses, and
support from other group members during times of crisis. These short‐term changes are
predicted to ultimately lead to improvements in households’ well‐being in the next three years.
We hypothesize that households will have more financial choices which will result in less
7 The map of Mali in the upper left courner was found at: http://upload.wikimedia.org/wikipedia/commons/thumb/9/96/Mali_‐_S%C3%A9gou.svg/300px‐Mali_‐_S%C3%A9gou.svg.png 8 A flow chart overview of Oxfam America’s theory of change is included as Figure 15 in Appendix A.
26
worrying about future crises. Additionally, we expect new businesses will increase women’s
income and livestock and assets owned by the household. In the far future (five or more years
later), the theory of change predicts that there will be improved well‐being at the household
and village level.
Overall, the anthropological data from BARA and socio‐economic data from IPA present a
complementary and consistent description of SfC and its effects. Both approaches find that
although SfC has led to relatively moderate economic impacts at the household and community
level, those small effects are nonetheless an important contribution toward helping poor
Malian women. In particular the effects constitute a deeply appreciated buffer against shocks
to the household. The areas in which the BARA and IPA data are not entirely consistent are on
topics that are complex and multi‐faceted, such as effects of SfC on social capital, development
of civic identity, and women's empowerment within the villages. Women's perceptions of
effects in these areas may be significant even if they are not yet reflected in tangible,
quantifiable forms that IPA could capture.

27
II. SUMMARY OF QUANTITATIVE FINDINGS (INNOVATIONS FOR POVERTY ACTION)
1. Introduction
Research questions
This research is designed to (1) better understand which types of women participate in SfC, (2)
provide rigorous evidence on the impact of the SfC program on the lives of the people in the
study regions, and (3) provide Oxfam America and Freedom from Hunger with valuable
information on the relative merits of two different replication strategies described above.
Participation
Saving for Change was designed to be accessible to the poorest of the poor. Accordingly, we
will seek to understand who participates in the program, who does not participate, and how
those who join groups early compare to those who join late.
Impact
The Saving for Change program might have impacts on a broad range of social and economic
outcomes. The evaluation examined the changes in the lives of the people in the study area and
looked at the mechanisms underlying these changes. Specifically, the evaluation sought to
answer the following question: How do the lives of individuals and communities introduced to
SfC change compared to changes that would have occurred if the program had not existed?
The following questions provide greater detail on the key themes/relationships examined by
the quantitative evaluation.9
A. Saving and borrowing
Does the Saving for Change program lead people to save more? Does it provide a safer vehicle
for people to borrow, thus providing access to credit to those who previously did not have
satisfactory access? And how does this intervention change participation in pre‐existing
informal (e.g., ROSCAs (tontines in French), friends/relatives, animals, jewelry, money lender,
seed loans, etc.) and formal savings and credit institutions (e.g., credit unions, MFI, etc.)? Does
it crowd‐out pre‐existing services?
9 Note that this section reflects the relationships that were expected at the outset of the study. During the time in which the quantitative evaluation was underway, the impacts expected by Oxfam America/FFH evolved based on field experience as well as other short‐term research on SFC.

28
B. Vulnerability, risk‐coping and food security
Does the program improve people’s capacity to protect consumption against income
fluctuations? Does the program increase the capacity of individual women and/or their
household to offset emergency expenses such as health care and recovery from unanticipated
shocks?
C. Investment, income and assets
Does SfC open up economic investment opportunities that otherwise would have been beyond
reach? How are household income, business and agricultural production, profitability and the
accumulation of assets within a household affected?
D. Health and education
Do the hypothesized changes in vulnerability and income lead a household to invest more in
the health and education of the children?
E. Empowerment and social capital
How do women’s networks change as a result of Saving for Change, and what advantages and
disadvantages do these changes bring in terms of both economic and social support structures
at the community level? Are women more likely to voice their needs, to take responsibility and
to participate in decision‐making within the household and in the village? Are women’s mobility
and access to resources improved?
Replication
One of the salient features of Saving for Change is that it is specifically designed to spread itself
beyond the borders of the village in which it was originally introduced at minimal cost. The
quantitative impact evaluation is designed to explore how this replication process works and
how it can be optimized. Specifically,
‐ How does Saving for Change spread within a village, to other villages, and what are
the channels determining this dispersion?
‐ How do various replication strategies (e.g. structured training of village trainers vs.
organic training) affect the expansion within and across villages, the quality of the
SfC groups, and their survival?
Design and sample information
This portion of the impact evaluation used quantitative methods which were supplemented by
extensive background research, focus groups, and key informant interviews. The research
spanned three years (2009 – 2012) and involved distinct methods including a phase for

29
background research, baseline and follow‐up household surveys, financial journaling, and in‐
depth case study analysis.
Background research
The initial phase of research included document review, key informant interviews and field
visits to provide background on the historical, political, economic, social and environmental
context within which Saving for Change is operating in Mali. Previous household surveys and
findings from the target region were researched and collected to provide a greater
understanding of household structure, livelihoods and economies in the Segou region. Key
informant interviews within the region also provided important context on local access to
credit, markets, and other business opportunities available to women. Qualitative interviews
with program beneficiaries and community leaders informed the design of the quantitative
survey instruments, and the rate of expansion across villages informed statistical power
calculations for the sampling strategy of the quantitative study.
Quantitative evaluation methodology
In order to rigorously evaluate the impacts of the SfC program, a randomized controlled trial
(RCT) design was used. Specifically, the RCT seeks to answer a key question: How do the lives of
individuals and communities introduced to SfC change compared to how their lives would have
changed had the program not existed? In an RCT, units (e.g., a village) in the study population
are randomly assigned to either receive the program or to serve as the control group. The RCT
methodology thus creates a statistically valid counterfactual (i.e. a population that is not
exposed to SfC, but which is nearly identical along geographic, demographic, cultural, agro‐
economic and socio‐economic dimensions). The causal effects of the intervention are then
estimated by comparing outcomes (e.g. savings) in the treatment and control groups. In this
study, randomization occurred at the village rather than the individual level, with entire villages
randomly selected to either receive the program or to be a control village. Given the communal
nature of the SfC program, randomizing at the individual level would not be representative of
the program. More specifically, randomizing at the individual level would mean that only
certain households in a village are invited to participate. The design of SfC entails women in
each village forming their own groups; evaluating a program in which only a part of the village is
allowed to participate would not accurately capture the impacts of SfC. Therefore, everyone in
a “treatment” village was eligible to participate in the program.
To address the stated research objectives, the sample population was randomly divided into
two treatment groups and a comparison group. The treatment and control groups were as
follows:

30
Treatment group 1: SfC program in which replicators receive structured, intensive
training
Treatment group 2: SfC program in which replicators receive brief, informal, organic
training
Control group: No intervention
This design will allow the RCT to provide practical input into the operational question of how
best to train replicating agents. Results from this evaluation will help determine the minimal
amount of input that is needed to cover a region without putting group quality at risk, thereby
boosting cost effectiveness. By comparing the impacts across the two treatment groups, we can
isolate the impact of facilitator training and consider operational aspects of the program. To
assess the overall impact of the SfC program in its various forms, comparing outcomes from
Treatment Group 1 to the control group gives the impact of introducing the SfC program with
intensively trained replicators. Similarly, comparing Treatment Group 2 to the control group
measures the impact of the SfC program with minimally trained (organic) replicators.
Note that when originally designing the research, we had planned to further divide the control
group villages by using natural variation in the geographic proximity of control villages to
treatment villages to study the process of replication. Replicating agents have limited or no
means of transportation. Therefore, SfC was hypothesized to spread primarily within a
relatively close geographic distance, when the replicating agent can regularly visit the village,
and an analysis was envisioned that would divide the set of control villages into two subgroups:
(1) villages in the immediate geographic vicinity of treatment villages which have a high
probability of contamination and (2) villages located further away from treatment villages and,
thus, at low probability of contamination. However, we did not find support in the data that
distance to treatment villages predicts the presence of SfC in control villages, precluding us
from conducting such an analysis.10 In other words, because factors other than distance
appeared to determine which control villages ended up with SfC groups, it was not possible to
use the proposed design to determine which control villages were more or less likely to have
10 Regression results are shown in the appendix. Table A3.4a shows results from a regression of SfC participation among women in control villages on the number of treatment villages within 0‐5km and 5‐10km zones, controlling for the total number of villages in these zones. This specification is similar to a regression specification used in Miguel and Kremer, Worms: Identifying Impacts on Education and Health in the presence of Treatment Externalities, Econometrica, Jan 2004. In an alternative specification, we regressed SfC participation on distance to the closest treatment village (Table A3.4b). Neither of these specifications lend support to the hypothesis that take‐up in control villages is a function of proximity to treatment villages. For descriptive purposes, Appendix Figure 14 in the appendix shows how distance to the closest treatment village is distributed.

31
spillovers from treatment villages. If this approach would have been successful, not only would
we have been able to measure spillovers, but it would have allowed us to construct a more
accurate picture of the full impacts of the program, stripping out some of the potential
diminution of effects caused by these spillovers.
The study sample was comprised of 500 villages in the following circles: Segou, Bla, San and
Tominian.11 The study villages were randomly selected out of a complete list of villages in most
of the communes in these circles.12 In the study villages, a census was conducted of all adult
women in the village and 12 women per village were then sampled from the census list and
asked to participate in the study. The total number of villages in the study sample by circle can
be seen in Table A1.1a. The highest number of villages is in Tominian (204), followed by Bla
(152), San (120), and Segou (24). Study villages were divided into 209 treatment villages and
291 control villages. More control than treatment villages were selected to allow for
spontaneous replication across villages and to accurately measure spillovers. Treatment villages
are evenly divided between the structured and the organic replication scheme. Villages where
an NGO was known to have supported village saving and loan groups were excluded from the
sample.
Treatment villages were randomly selected by IPA, and then divided into catchment areas of at
least 15 villages each by Oxfam America and local NGOs Groupe de Formation Consultation et
Etude (G‐FORCE) and Groupe de Recherche pour l'Aide à la Femme et à l'Enfant (GRAFE). IPA
then randomized treatment villages in each catchment area to receive either structured or
organic replication. SfC was introduced into treatment villages by NGO technical agents who
were randomly assigned an equal number of structured and organic villages and were
instructed to visit an equal number of each within the first year. Each technical agent was
assigned a catchment area with approximately 15 villages, 10 of which were to be targeted
during the first year. In the second year, technical agents continued to support villages targeted
the first year and also introduced SfC in the remaining villages in their zone. During the third
year, the number of technical agents decreased and the territories expanded somewhat.
Technical agents continued to support existing replicating agents, added extra groups in
11 In this report, “region”, “circle” and “commune” are literal translations of the Malian administrative units région, cercle and commune. Following upon the French system, the commune is the smallest territorial division for administrative purposes, while a circle is composed of multiple communes and a region of several circles. Their closest analogues in the American system might be states (régions), counties (cercles), and districts (communes). All of the research described in this report took place in the Segou region. 12 A number of communes were removed from the sample frame because other NGOs had been supporting savings groups there, particularly in the circle of San. Also, only communes east of the city of Segou in the circle of Segou were included in the sample frame.

32
neighborhoods of big villages/towns, and implemented follow‐up to strengthen groups that
were one year old.
Data Collection
We used quantitative survey data to measure program impacts. Data collection for the full
sample occurred in two waves: a baseline survey in 2009 and an endline survey three years
later (see Table 3 for the project timeline). The baseline and endline surveys targeted the same
individuals; however, if the primary baseline survey respondent could not be re‐interviewed for
the endline after repeated visits, she was replaced by another randomly selected female13 from
the same household. Between the baseline and endline surveys, a social network census and
several waves of short, high‐frequency surveys were administered to a subsample of
respondents. There were two groups of respondents who received the high frequency surveys:
one group was surveyed every two weeks (median of 20 waves) and another group was
surveyed every three months (median of four waves).
Baseline and Endline Surveys
The baseline sample was comprised of 5,954 households from 500 villages. Multiple field
strategies were used to track down as many of these households as possible for the endline
survey, leading to a very successful re‐interview rate. Of the households in the baseline sample,
5,602 (94.1%) were resurveyed for the endline. The percentage of primary respondents that
were surveyed for both the baseline and endline survey was slightly lower 85.9%. Overall,
attrition between control and treatment households was similar at 5.91% and 6.56%,
respectively. Attrition of primary respondents was comparable for control households (14.06%)
and treatment households (14.11%) as well. A statistical test presented in Table A1.1b in the
Appendix confirms there was no significant difference in attrition patterns between the
households in the treatment group when compared to households in the control group,
allowing us to conclude that attrition does not pose a threat to the validity of the analysis.
13 The women who were interviewed as replacements for the initially sampled women in the baseline are included in the analysis.

33
Table 3: Project Timeline
Month & Year Activity
January 2009 – May 2009 Baseline data collection & social network survey
June 2010 – January 2012 High frequency data collection
February 2012 – June 2012 Endline data collection & social network survey14
The baseline and endline surveys included a household questionnaire (with individual modules)
and a village questionnaire. The household questionnaire modules were as follows:
Ménage Elargi (superunit or “big household”) – Households in Mali can be very large,
comprising multiple married men, each with one or more wives. Often the men are
related sons and/or brothers. The entire household or Ménage Elargi is defined as the
group of people with whom the ménage restreint (defined below) shares meals,
conducts economic activities, or shares a grain storage facility.
Ménage Restreint (subunit or “small household”) – This module was administered to the
smaller unit within the ménage elargi, that often has partly separate cooking and eating
arrangements. The ménage restreint is made up of the primary woman respondent, the
person she defers to (her authority figure, often her husband), and this figure’s
immediate dependents. This would include other wives if the respondent’s husband (ie.
her authority figure) is polygamous, for example.
Adult ‐ This questionnaire was administered individually to the sampled women and
their husbands.
Data collected in the ménage restreint and adult modules include: household food composition
and expenditures; savings and borrowing; household food security and risk‐coping; economic
opportunity; investments; income and asset accumulation; health and education; social capital;
and women’s empowerment. The ménage élargi module asked about élargi household
composition, but without a detailed household roster, agricultural production and food
consumption at the level of the entire household, using questions similar to those found in the
corresponding ménage restreint sections. Only these two topics were covered, as the
questionnaire was intended to fill in the gaps from the restreint questionnaire for households
that are embedded in a larger family structure15.
14 Note that Mali experienced a political coup during the time of the endline survey. As a result, data collection was paused for a short period; however the teams were ultimately able to complete the endline data collection activities even given difficult political conditions. 15 For example, some households only farm and eat food at the elargi level: for these households, the agricultural and food consumption sections in the restreint questionnaire would be blank.
34
Social Network Census
In addition to the surveys mentioned above, 40 villages were randomly chosen in which
households received a social network survey. In those villages, concurrently with the baseline
and endline surveys, a census of all the adult men and women living in the village was
conducted. The census questionnaire included questions on basic household characteristics,
including: household composition; educational levels; leadership positions held in the village;
key assets; and measures of well‐being including house materials. Following the census, a social
network questionnaire was administered which used census data to record the social links
between adults in the village, with a particular focus on the existing informal insurance and
support networks. The social network questionnaire was again administered at the time of the
endline survey. Data from these two surveys will allow us to examine whether SfC changes
social networks by strengthening existing relationships or creating new relationships, both of
which may improve women’s empowerment. The data is used to look at how SfC program take‐
up is correlated with network characteristics, including measures which capture how central or
important individual women are within the entire social network in the village, and when
analyzing Sfc impacts on social capital.
High‐Frequency Surveys
Between the baseline and endline surveys, short questionnaires were used to collect data on a
regular basis from a sub‐sample of approximately 600 randomly selected women (from both
the treatment and control groups). These short, high‐frequency surveys serve a different
purpose than the baseline and endline surveys. Specifically, the full‐sample surveys give precise
estimates of the changes that accumulate over the three‐year study period whereas the small
high‐frequency surveys give insight into the process of how these changes occur, for example,
how funds flow in and out of the household. The high‐frequency questionnaires were
comprised of fixed modules asked during each visit, on financial transactions, transfers, health,
non‐agricultural income, expenditures and asset transactions and a variable component that,
on a rotating basis, asked about agricultural production, crop stocks, food consumption, food
security, and education. Questionnaires also included open‐ended questions aimed at
understanding the context and circumstances of an individual respondent’s financial behavior.
The resulting panel data set (i.e., data from the same individuals questioned repeatedly over
time) provides detailed information that can be used to more closely investigate risk‐coping
and vulnerability, and the timing of the impacts. Table A5.7 describes the sample. Sampled
households in 48 villages were surveyed every two weeks, and this was evenly balanced across
treatment (24 villages) and control (24 villages). There were over 5,000 interviews completed
for this sample. In addition, there were 71 three‐month villages, with 35 from treatment

35
villages and 36 from control. 989 interviews were completed for this sample. There is
approximately the same number of households in both the two‐week and three‐month villages,
split evenly between treatment and control groups.
2. Baseline descriptive statistics and balance check
Balance check
A comparison of the treatment and control groups at baseline was conducted to verify that
there were no important differences in observable characteristics. This is a standard RCT
practice, to make sure that the control group can serve as a true counterfactual for the
treatment groups. Results from this analysis can be found in Table A2.1. Overall, households in
the treatment and control villages were similar prior to the introduction of SfC along these key
dimensions, with differences significant at 10%16 observed only in average household health
expenditures for the last 30 days and the intra‐household decision making power index scores.
This is due to chance, and we expect a few variables to be significantly different between
treatment and control in any randomized evaluation. Given available data, the authors are
satisfied the two sets of villages are analogous, and therefore that the randomization will
accurately allow us to determine the impacts of SfC.
In addition to serving as a technical check as to whether the RCT study will be valid, this
comparison of treatment and control villages at baseline can also illuminate the context in
which SfC operates in this zone of Mali, an aspect which was carefully described in the full
baseline report.17 In the following section we highlight some important and interesting aspects
of the baseline data.
16 This parameter for denoting statistical significance is a standard one used in research studies. This can be interpreted as meaning that there is only a 10% chance that these findings are happening due to chance. Results with a 5% or 1% significance level denote more robust findings. 17 “Baseline Study Of Saving For Change In Mali: Results From The Segou Expansion Zone And Existing Sfc Sites” by the Bureau of Applied Research in Anthropology (BARA) at the University of Arizona and Innovations for Poverty Action, March 25, 2010.
36
Descriptive Statistics
Savings and borrowing
Prior to the intervention, approximately 22% of women were members of a tontine. Total
savings (both from tontine participation and elsewhere) amounted to $7.78 on average.18 Net
savings, which is savings plus net debt, were slightly greater ($9.02). Approximately 35% of
primary respondents had received a loan in the last 12 months while 29% had given a loan. Of
all female adults in the household aged 20 to 65, 22% received at least one transfer (either cash
or in‐kind) from another household in the last 12 months while 17% had given a transfer19.
Over 40% of households experienced a household shock in the last 12 months that had a large
impact, and 18% of households had to use a costly strategy to cope with a household shock. We
define a costly strategy as selling livestock or cereal, removing children from school, reducing
household consumption, or migrating. Household shocks are often linked to health
expenditures; therefore, we also collected data on household health expenses in the last 30
days. Prior to the program, on average, households in the control group spent $5.36 on health
in the last month, whereas households in treatment villages spent somewhat less ($4.77).
While expenditures in the treatment and control group differed, it should be noted that in both
groups these health expenditures amounted to over half of the average household’s reported
savings.
Vulnerability, risk‐coping, and food security
Another measure for assessing household wellbeing is food security, which we measured using
the food insecurity index developed by Freedom from Hunger (FFH). The full food security
survey is comprised of 17 questions, 9 of which are core yes/no questions that ask whether a
person has experienced a certain food insecurity phenomenon (e.g., “In the last 12 months, did
you worry that your food would run out before you had money to buy more food?”). Eight
additional questions ask how often this phenomenon occurred: ‘never or rarely,’ ‘sometimes,’
or ‘often.’ Responses are totaled to categorize a household as being food‐secure or food‐
insecure. On average, before SfC was introduced to this area, 40% of households were
categorized as being food‐insecure.
18 Throughout, amounts are expressed in values. We use the exchange rate as of March 2012 (the time of the endline survey): $1 = 492 FCFA. 19We anticipate that these data may be underestimates since taking loans is considered a shameful activity in Malian culture. Therefore, respondents may be less likely to report loans and transfers.

37
Investment, income, and assets
Likewise, no significant differences were observed between control and treatment villages in
the level of investment or consumption. In both treatment and control groups, approximately
forty percent of primary respondents had a business and a small portion (5%) engaged in paid
labor. Over the past year, households invested the most in agriculture ($27.13) and education
($2.14). Livestock holdings amount to $761.71. Just over half of the primary school aged boys
(54%) are enrolled in school, while slightly under half of the girls are (45%).
Health and education
No significant differences were observed between the treatment and control villages prior to
the intervention in terms of knowledge or health practices related to malaria. At baseline,
approximately 44% of respondents reported that mosquitoes were the sole cause of malaria.
Half of the households in our sample used bednets for children under the age of five, and the
majority of women report having taking drugs against malaria during pregnancy (75%)20.
Empowerment and social capital
Three indices were used to measure empowerment and social capital: the index of intra‐
household decision‐making power, the index of community action, and the social integration
index. The specific questions which are used to construct each of the indices are listed in Table
A5.5. The intra‐household decision making index includes, as an example, a question on
whether women are free to make decisions about educational expenses. Whether women
spoke with the village chief or participated in a village meeting in the last year are examples of
questions in the community action index. Finally, one of the questions in the social integration
index asked respondents about how many other women they would ask for money in a time of
need. At baseline, control and treatment households scored the same, on average, on both the
index of community action and the social integration index. The average household in the
treatment villages scored significantly higher on the index of intra‐household decision making
power, however we believe this finding is likely due to chance and do not believe it will have a
noticeable effect on the impact analysis.
20 This is most often self‐diagnosed malaria, so whether the drugs were taken in response to actual malaria infection is unknown.

38
Village characteristics
Village characteristics too were similar between treatment and control villages. On average, a
study village has about 1,000 inhabitants, is 23 kilometers from the nearest tarmac road and 8
kilometers from the nearest market. About 70% of villages have a primary school in the village,
with far fewer villages having a health center in the village (20%).
3. Adoption
Adoption rates
Participation in SfC was
determined using two
definitions of an SfC group:
loose and strict. Loosely
defined SfC groups are
accumulating savings groups
that women report as being
“applause groups”.21 The
stricter definition applies
additional criteria: The group must hold regular meetings and have received training from
someone outside the group. Using the loose definition, take‐up of the SfC program in treatment
villages (36.53%, see Figure 2) was triple the take‐up rate found in control villages (12.04%)22.
When the stricter definition is applied, take‐up is still higher in treatment villages, but slightly
lower overall: 29.65% in treatment villages and 6.27% in control villages (Table A3.1a). Under
both definitions take‐up was higher in structured replication treatment villages (40.47% using
the loose definition) compared to organic replication treatment villages (32.48% using the loose
definition). Given that the SfC program was adopted in some of the control villages, it should be
noted that some impacts may be underestimated.
21 Because of a characteristic clap performed at the end of each meeting by most groups, SfC groups are known as “tegereniton” or “applause groups” in Mali. 22 Unfortunately IPA does not have data on whether the groups in the control villages were started by replicating agents or the result of “spontaneous” replication.
12.0%
40.5%
32.5%
36.5%
6.3%
33.6%
25.7%
29.6%
0%
5%
10%
15%
20%
25%
30%
35%
40%
45%
Control Treatment -Structured
Treatment -Organic
Treatment -Overall
Member of SfC Member of SfC - more strictly defined
Figure 2: Take‐up Overall

39
Figure 3: Take‐up over time
Adoption rates over time by circle are shown in Figure 3 (see also Table A3.1b). Take‐up
numbers shown in this figure use the loose definition of SfC and are based on women’s recall of
how long ago they joined a SfC group. Take‐up was significantly lower in Tominian compared to
the other three circles. This may, in part, be due to language barriers between the respondents
and the technical agents. The Tominian region has a larger percentage of Bobo women
compared to other regions. If a predominantly Bobo village had a non‐Bobo technical agent, it
is possible that language issues affected take up. We do not, however, have data on the
language of the technical agent, so this is speculation which the practitioners may want to
investigate with their partner NGOs. Further information on SfC adoption can be assessed by
examining weekly contributions and share‐outs. Overall, 92.25% of women who joined SfC from
May to October of 2009 had at least one share‐out at the time of the endline in 2012. The
median weekly contribution for these women was $0.41 at the time of the endline. Time trends
for these two outcomes show that newer members of SfC have a lower rate of experiencing a
share‐out, which is to be expected given that newer groups may not have yet completed the
saving cycle. At the time of the endline, newer groups also had lower weekly contributions, on
average, than older groups across all four regions. While we cannot definitively conclude why
this is so based on the available data, two possible explanations are likely. First, there could be
0%
5%
10%
15%
20%
25%
30%
35%
40%
May‐Oct 09
Nov 09‐Apr 10
May‐Oct 10
Nov 10‐Apr 11
May‐Oct 11
Nov 11‐June 12
All
Treatment
Control
0%
5%
10%
15%
20%
25%
30%
35%
40%
45%
May‐Oct 09
Nov 09‐Apr 10
May‐Oct 10
Nov 10‐Apr 11
May‐Oct 11
Nov 11‐June 12
Bla / Segou
Treatment
Control
0%
5%
10%
15%
20%
25%
30%
35%
40%
45%
May‐Oct 09
Nov 09‐Apr 10
May‐Oct 10
Nov 10‐Apr 11
May‐Oct 11
Nov 11‐June 12
San
Treatment
Control
0%
5%
10%
15%
20%
25%
30%
35%
May‐Oct 09
Nov 09‐Apr 10
May‐Oct 10
Nov 10‐Apr 11
May‐Oct 11
Nov 11‐June 12
Tominian
Treatment
Control

40
a selection bias such that poorer women join later and their contribution is lower. Second, the
level of savings may increase over time. However, based on the available data we do not know
whether older groups started off at the same lower level as the newer groups. Further
comparisons of early and late adopters can be found in Table A3.3.23
Characteristics of adopters
Adopters vs non‐adopters
There are several significant
differences between women who ever
became SfC members – using the
loose definition – once the program
came to their village (adopters), when
compared to women who chose to
never join SfC (non‐adopters). It is
important to note that these
differences are not impacts of SfC;
rather they are pre‐existing
differences in the types of women
who adopt versus do not adopt SfC.
Table A3.2a and Figure 4 offer a
comparison of these adopters and non‐adopters on several key variables, as measured at
baseline, before the start of SfC in their village. Overall, those who eventually became SfC
adopters were older, were more likely to engage in decisions at both the village and household
level, and were also more financially active in terms of savings and borrowing.
In terms of household demographics, adopters had larger households on average (7.55 people
compared to 6.79 people). Additionally, adopters came from wealthier households, as
measured by food consumption per capita ($2.92 versus $2.68). Adopters who reside in an
extended household were marginally less likely to join SfC. No differences in participation rates
were observed based on the gender of the household head or household ethnicity24.
23 For further discussion see an extensive analysis of MIS data in “The Evolution of Savings Groups: An Analysis of Data from Oxfam’s ‘Savings for Change’ Program in Mali” by J. Matuszeski & L. Cojocaru, 2011. 24 Above, we noted that participation rates were lower in Tominian than in the other circles. We hypothesized that this could be due to a language barrier among the Bobo. The test in Table A3.2a compares households who adopted and those who did not within treatment villages within the same
15%
44%50%
20%
31%
21.9%
56.4%51.4%
28.9%39.6%
19.8%
0%5%
10%15%20%25%30%35%40%45%50%55%60%65%
Leader in the village
Had a business
Owned livestock
Involved in a tontine
Took a loan Social integration
index
Non members Members
Figure 4: Member Characteristics

41
Interestingly, literacy rates and marriage rates also did not differ between adopters and non‐
adopters.
On average, SfC adopters were three years older than non‐adopters, and were more likely to be
a leader in the village (22% compared to 15%). Leadership roles included, but were not limited
to, positions in savings groups, youth organizations, agricultural associations, religious groups,
and work groups. Adopters were also more likely to own a business or own livestock. Adopters
and non‐adopters did not differ in whether or not they had savings, however, more adopters
were involved in tontines (29%) compared to non‐adopters (20%). Additionally, 40% of SfC
adopters had taken a loan at the time of the baseline survey, compared to only 31% of non‐
adopters.
Women who adopted SfC were, on average, more socially connected than those who did not.
More specifically, at the time of baseline, adopters scored higher on the social integration
index, the community action index, and the intra‐household decision making power index25.
Given the communal nature of SfC groups, it is not surprising that women who opted to
participate in the program had stronger or more frequent social ties prior to joining the group.
This finding is further corroborated by an analysis of the detailed social network data that were
collected in a subsample of 40 villages. In these villages, we asked all adult women about their
ties to others in the village to obtain a full social network map of the village. Using these data,
we calculated various measures of network centrality (degree, closeness, betweenness and
eigenvector centrality). These measures all indicate in slightly different ways how central or
connected a woman is within the village network. In table A3.2b, we compare baseline
centrality values of women who became members to women who did not for the 24 treatment
villages for which these data are available. In line with the findings reported above, we find that
prior to the implementation of the program adopters occupied more central positions in the
village network. This is true according to all measures we calculated. The differences in
centrality between adopters and non‐adopters are highly statistically significant and large in
magnitude: average centrality values are about 30‐40% higher for adopters than for non‐
adopters. Centrality in the village network is thus a strong predictor of becoming a member of
an SfC group. When splitting the sample into quintiles by degree centrality, a woman in the
commune (that is, the test includes commune controls). Without commune controls, participation among the Bobo is significantly lower than in the other ethnic groups. 25 The components that make up these indices are enumerated in Table A5.5. The index is constructed – as in Katz, Kling and Liebman (2001) – by first normalizing (subtracting the mean and dividing by the standard deviation of the control group) each individual variable, and then adding all the normalized variables together. This summed variable is then normalized. The result is that the index has a mean of 0 and a standard deviation of 1 for the control group.

42
lowest quintile has a 17% likelihood of adopting SfC and a woman in the highest quintile a 47%
likelihood.
SfC adopters were also more likely to report in the baseline survey that they had had to resort
to a costly strategy to cope with a shock within the last year (16% versus 20%). This could mean
that these households, on average, faced more serious shocks, that these households had
fewer coping mechanisms to deal with shocks, or that these households were more open to
trying new coping strategies. There were no noticeable differences in levels of food‐insecurity
or in PPI poverty scores between adopters and non‐adopters.
Scores of financial patience and “time inconsistency” were also similar. Patience can be defined
as the respondent’s willingness to wait for a benefit to be received at a future date. For
example a person in the U.S. who prefers $110 in a week to $100 now is more patient than
someone who prefers the $100 today over the $110 in a week. (This scale is relative, not
absolute and the dollar amounts that matter to respondents differ a lot by the country and
context.) The measure of time inconsistency aims to assess the consistency of a respondent’s
behavior over time with regard to whether they are patient or not; while a respondent may
plan to take a specific action at some future date (such as setting aside a certain amount for
savings), she may take an action different than the one she planned when the time actually
comes. An example from the U.S. context would be someone who always planned to start
saving for retirement or who always planned to start going to the gym but who did not start
those behaviors when the planned time came around. This is also a relative, not an absolute
quality and the context affects the specific trade‐offs that respondents weigh but not the
general idea. The ways in which these behaviors of patience and time inconsistency affect
savings have been studied elsewhere in more detail (Ashraf, Karlan, and Yin, 2006). In that
study, based in the Philippines, the authors found bank clients who exhibited time inconsistent
tendencies were more likely to open up a savings account that had a commitment component –
in particular that the savings could not be removed until a goal or a date specified unless a true
emergency (that could be documented) occurred. It is therefore interesting that we do not find
any evidence that women with time inconsistent tendencies are more likely to join SfC.
However, we do not want to over‐interpret this null finding since there was a lot of variability in
the measure of time inconsistency both across people but particularly over time, suggesting
that perhaps the standard questions used in economic surveys to measure these preferences
do not work very well in this particular context.
Though adopters are more likely to come from wealthier households than non‐adopters, this
does not mean that the program is only reaching the better off. First, these villages are on
average very poor. Second, the size of the difference in participation between those better off
and those worse off is not large. Table A3.1c shows how participation varies at different points
43
in the wealth distribution of households. Here we used per capita food consumption to capture
those who are better off (upper 33% of the village), those who are in the middle (between 33
and 66% of the distribution) and the worst off (bottom 33%). Per capita food consumption is a
standard way of capturing poverty, as food consumption in many developing country contexts
consistutes 80% or more of poor households’ total budget share. Participation is highest among
the top tercile: 42% of women in the top tercile in the treatment group participate in SfC, This
contrasts with a 33% likelihood of participating in SfC among women in the bottom tercile.
While this 9 percentage point gap is considerable, it does not suggest that the poorest women
are excluded from SfC since a significant percentage of them do join.
In summary, at the time the program started, several key differences were identified between
adopters and non‐adopters. Adopters tended to be older women from larger, wealthier
households. Additionally, adopters had higher initial social capital and more likely to participate
in decision‐making at the village and household level. Reasons why women with higher initial
social capital are more likely to join SfC are discussed in the joint chapter with BARA. Adopters
were also more financially active in terms of savings and borrowing. Therefore, our baseline
data indicates that prior to any changes caused by the SfC program, adopters were ‐ on average
‐ more empowered than non‐adopters along several dimensions. Though members do tend to
be slightly better off than non‐members, we do not intend to say that SfC does not reach the
poorest of the poor. The differences in participation rates across the wealth distribution are not
large (despite being statistically significant), a finding which highlights a strength of the SfC
program.
Early vs. late adopters
It is of interest to compare how early and late adopters of the SfC program differ (Table A3.3).
We define late adopters as women who became SfC adopters more than six months after the
first group formed in their village. While early and late adopters were similar overall, a few
differences are worth noting. First, late adopters tended to come from smaller households
(households of 7.26 people versus households of 7.78 people). Second, late adopters were over
1.5 years younger than early adopters. Third, late adopters had significantly lower scores on the
social integration and community action indices compared to early adopters. No differences
were seen in scores for the intra‐household decision making power index.
However, in other dimensions where differences were observed between adopters and non‐
adopters, we see no differences between early and late adopters. For example, no differences
were observed in the participant’s likelihood of being a village leader or in household
consumption. Early and late adopters were also similar across several financial indicators.
Women were equally likely to have savings, be involved in a tontine, have taken a loan, have

44
had a business, or to own livestock. Differences between early and late adopters are discussed
in more detail in the joint chapter with BARA.
Taken together, the comparison between early and late adopters shows that early adopters
appear to be a bit older and more socially integrated. However, it is striking that we do not see
large differences in other characteristics – such as wealth, or previously owning a business –
which we would expect to affect who joins first. This highlights that there are surely many
factors which are difficult to observe which affect women’s decisions to join or not, and when
to join.26
4. Use of SfC
Next, we describe how SfC members make use of the program. The majority of women were
involved in only one SfC group; on average, only 4% of SfC members reported participating in
multiple groups. At the time of the endline survey, twelve percent of SfC members reported
involvement in another ASCA27, while 16% reported membership in a tontine. The average self‐
reported length of membership in the endline survey for all adopters was 23.7 months. SfC
groups consisted of 24 women, on average, and the average contribution was $0.48 per week
(Table A4.1a).
As previously described, there are two distinct ways in which SfC members can receive funds:
share‐outs and loans. Tables A4.1b and A4.1c provide detailed information on the
characteristics and reported uses of both share‐outs and loans. Note that respondents could list
more than one use for a share‐out or a loan.
26 The R2 of a multivariate regression of adoption on the set of variables listed in table A3.2a is only .10. 27 We defined an ASCA broadly as any savings group managed by the group members where members make regular or occasional savings contributions and where savings accumulate over a certain time period to be distributed at the end of the cycle. Note that working groups – groups of women who perform agricultural labor together and save the money they earn in a common fund – would fall under this definition. Such working groups are very common in Mali. A stricter definition of an ASCA that excludes most of these working groups is an ASCA where contributions are made regularly (weekly, every two weeks or every month). We defined a ROSCA as a savings group managed by members where at every meeting one member receives all savings contributions and savings do not accumulate over time. Traditional tontines would fall under this definition.
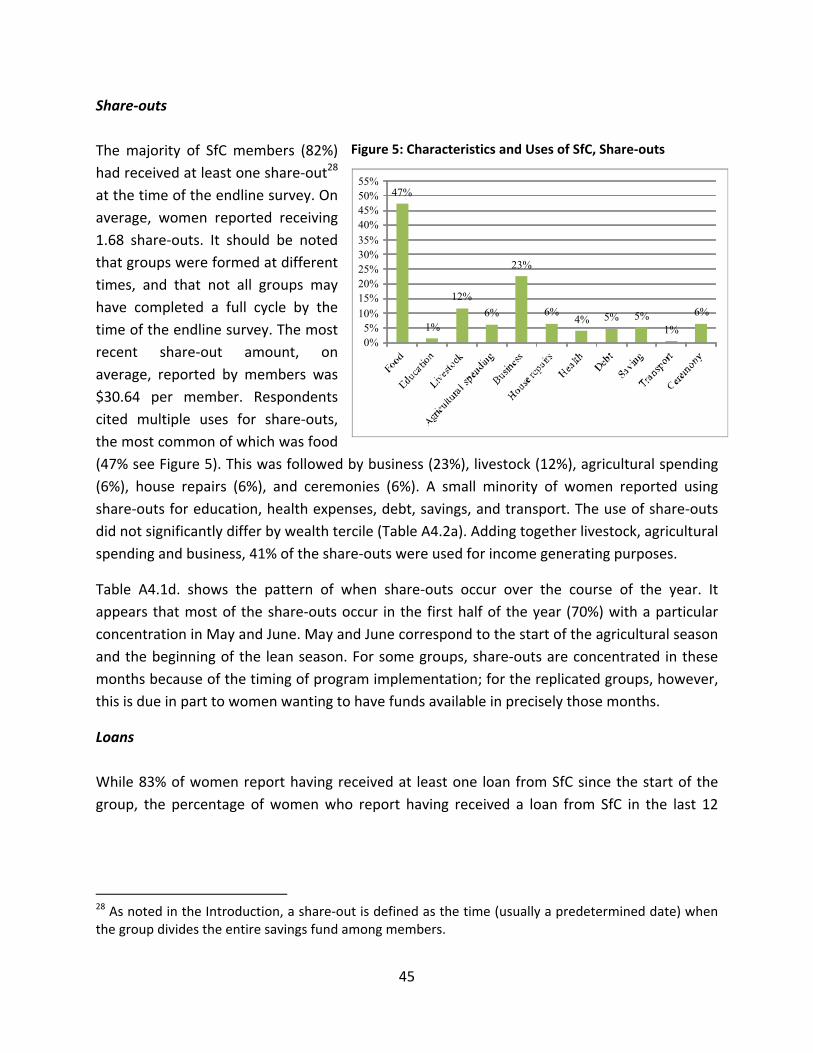
45
Share‐outs
The majority of SfC members (82%)
had received at least one share‐out28
at the time of the endline survey. On
average, women reported receiving
1.68 share‐outs. It should be noted
that groups were formed at different
times, and that not all groups may
have completed a full cycle by the
time of the endline survey. The most
recent share‐out amount, on
average, reported by members was
$30.64 per member. Respondents
cited multiple uses for share‐outs,
the most common of which was food
(47% see Figure 5). This was followed by business (23%), livestock (12%), agricultural spending
(6%), house repairs (6%), and ceremonies (6%). A small minority of women reported using
share‐outs for education, health expenses, debt, savings, and transport. The use of share‐outs
did not significantly differ by wealth tercile (Table A4.2a). Adding together livestock, agricultural
spending and business, 41% of the share‐outs were used for income generating purposes.
Table A4.1d. shows the pattern of when share‐outs occur over the course of the year. It
appears that most of the share‐outs occur in the first half of the year (70%) with a particular
concentration in May and June. May and June correspond to the start of the agricultural season
and the beginning of the lean season. For some groups, share‐outs are concentrated in these
months because of the timing of program implementation; for the replicated groups, however,
this is due in part to women wanting to have funds available in precisely those months.
Loans
While 83% of women report having received at least one loan from SfC since the start of the
group, the percentage of women who report having received a loan from SfC in the last 12
28 As noted in the Introduction, a share‐out is defined as the time (usually a predetermined date) when the group divides the entire savings fund among members.
47%
1%
12%
6%
23%
6%4% 5% 5%
1%
6%
0%5%
10%
15%20%25%30%35%40%45%50%55%
Figure 5: Characteristics and Uses of SfC, Share‐outs

46
months is 43%.29 On average, women received 0.6 loans from their SfC group within the past
year. The average amount of these loans was $20.39 with an average interest payment of
$2.82.
Compared to share‐outs, women were more likely to use loans for business activities (42%, see
Figure 6). Food expenses were the second most common use of loan money (38%), followed by
ceremonies (6%) and health expenses (6%). A small fraction of loans were used for education,
livestock, agricultural spending, house repairs, debt, savings, transport, and clothes. Similar to
what we find for share‐out uses, the ways in which women used loans did not significantly
differ by wealth tercile (Table
A4.2a).
While a primary goal of the SfC
program is to facilitate small
business, it should be noted
that funds within the
household are fungible.
Therefore, while many women
reported using share‐outs and
loans to buy food rather than
for business expenses, it should
be noted that this in and of
itself may benefit business
activity for the household. For
example, in the absence of SfC, a woman may have purchased food by selling livestock or
capital from her business. If this woman is able to buy food with funds from participating in the
SfC program, then her business is benefiting from the SfC program. She would say that she used
the share‐out or loan for food. But we would see an improvement in her business in the impact
estimates, rather than or in addition to an improvement in food consumption. We therefore do
not want to put too much emphasis on stated uses of SfC loans and share‐outs. Ultimately, the
impact estimates discussed in section 5 will provide insights into the ultimate ways in which SfC
affects women’s ability to smooth consumption, start and maintain businesses, and invest in
livestock.
29 This percentage is lower than anticipated and may reflect underreporting. As mentioned above, taking loans is often considered shameful in Malian culture and survey respondents may have been reluctant to mention their loans to the interviewer.
38%
2%5%
2%
42%
5% 6%2% 4%
1%
6%
1%
0%
5%
10%
15%
20%
25%
30%
35%
40%
45%
50%
55%
Figure 6: Characteristics and Uses of SfC, Loans

47
Second, being able to smoothen consumption over time is valuable in and of itself. For
example, a woman may reduce consumption during a lean season because her household lacks
the savings or capital to maintain their previous level of consumption. If participation in SfC
allows the woman to increase her savings or have access to loans, she will be better able to
maintain the same level of consumption throughout the year. She may also be able to avoid
very costly strategies, such as selling off productive assets, in order to purchase food should a
shortage occur. The joint chapter with BARA also discusses how important consumption
smoothing is to the wellbeing of households, especially in such poor communities as those in
the study area.
5. Impacts of SfC
Empirical strategy
In this section we present our findings of the impacts of the SfC program on the households in
our sample. Results are presented as Intent to Treat (ITT) estimates. More specifically, our
analysis compares outcomes in the treatment villages with outcomes in the control villages,
rather than comparing outcomes between SFC members and non‐members. It is necessary to
use ITT estimates and compare whole villages to whole villages because if we were to only
compare for example SfC members with non‐members (in either the treatment villages or the
control villages) we would be comparing groups of women who are fundamentally different
and were different before SfC came into the picture. On average, women who choose to join
SfC are not the same as women who choose not to join. This was demonstrated in the data
from this study in the earlier section on adopters versus non‐adopters. Furthermore, it is very
likely that adopters and non‐adopters also differ on characteristics that are not‐observable,
such as “motivation.” Because members and non‐members are likely to be fundamentally
different types of people on average even before the introduction of SfC, comparing the two
groups would reintroduce selection bias which is what the RCT approach is designed to avoid.
By contrast, the villages were randomly selected to receive or not receive the program so
villages in the treatment group are analogous to villages in the control group. By comparing
villages to villages, the RCT design avoids selection bias. That is, any differences between
treatment and control villages are true impacts. ITT analysis allows us to answer the following
question: On average, how is the wellbeing of the entire village affected by the introduction of
the SfC program?
Because of the ITT design, the rate of program take‐up unfortunately does affect the magnitude
of our estimates of the program impact: The lower the take‐up rate, the lower the average size
of the impact at the village level since lower take‐up means that the program impacts are more

48
6%
31%
0.00
0.05
0.10
0.15
0.20
0.25
0.30
0.35
0.40
Member of SfC –strictly defined
(0/1)
Control
Treatment
diluted. Thus, a program must have high participation to result in large ITT estimates. This is an
unavoidable challenge with this approach, which is balanced against being able to avoid
selection bias.30 However, given our large sample size, WHICH impacts are determined to be
statistically significant should not be as severely affected by using ITT methods. So the method
should still pick up on which areas of life are affected by SfC. As a final note, comparing villages
to villages instead of members to non‐members also has the advantage in that program design
staff, donors, governments and policy makers may often be interested in how a program affects
the entire population rather than how the program affects a smaller group of individuals.
Financial Management
Based on the theory of change, an immediate hypothesized
impact of the SfC program is increased access to loans and
savings assistance within the first three months of the
program. Results support that the SfC program does result
in benefits related to financial management (Table A5.1,
Figure 7 and 8). Respondents from the treatment villages
are more likely to be members of any type of savings group
(81% compared to 76%)31. Overall, savings in treatment
villages increased, on average, by $3.65 (from an average
baseline level of $11.96) over the course of the study period.
This is driven by the increase in savings in ASCAs, including
SfC groups (an increase of 138%). There is a small, but
statistically significant decrease, in savings in formal
institutions, which are held by very few women (1% in the
30 The impact on those who actually joined SfC can be inferred from the ITT estimates by multiplying by about 4 (i.e. divide the ITT estimate by the take‐up differential between treatment and control groups). This provides what is known as the Treatment on the Treated (or TOT) estimate. However, statistical precision is not affected, so outcomes that were not statistically significant in the ITT will not be significant in a TOT estimation either. The TOT also requires the strong assumption that participation in SfC does not affect non‐members in the village (i.e. there are no spillovers). This assumption is very likely to be violated for SfC since non‐members may benefit indirectly if some of their friends now have better access to savings and credit. Or, in the other direction, non‐members may be negatively affected by being shut out of the new social networks that the groups represent. For outcomes such as intra‐household decision‐making in particular, if SfC does change the perception of women in the community more broadly, this would violate the assumption needed to correctly interpret TOT estimates as equivalent to the direct benefits to members. Therefore, we do not include the TOT estimates in this report. 31 This includes all ROSCAs and ASCAs – as defined above.
Figure 7: Impact on participation in SfC group
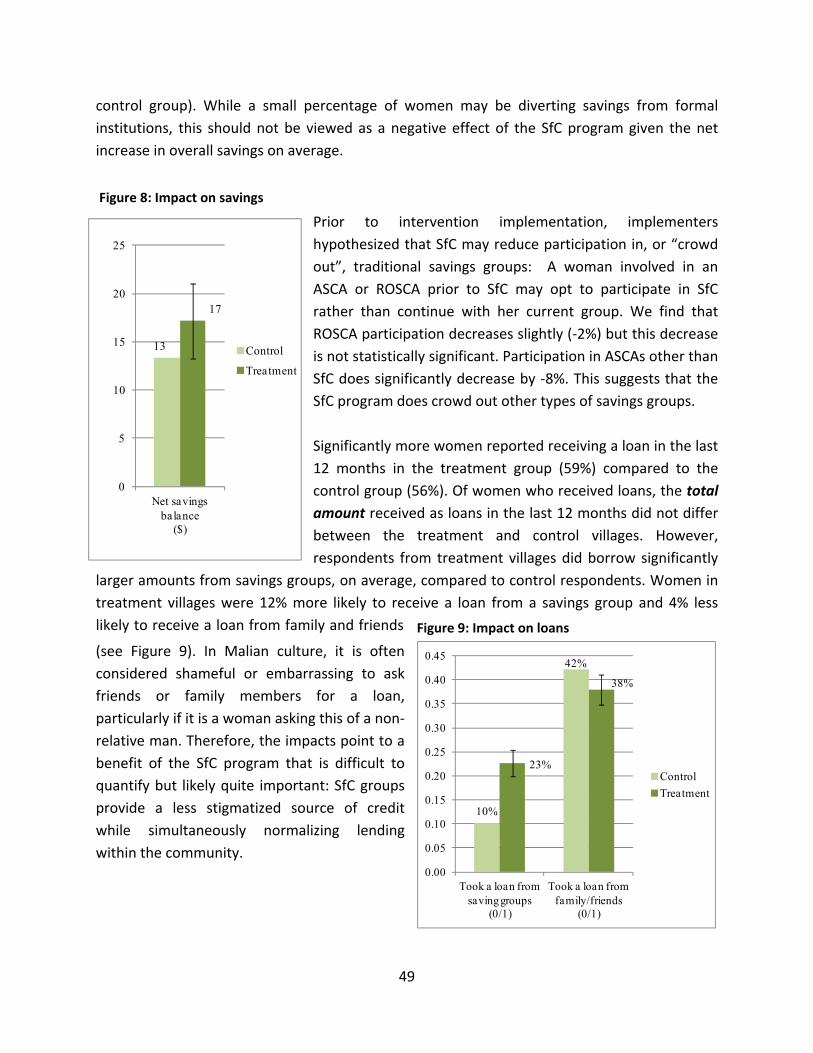
49
13
17
0
5
10
15
20
25
Net savings balance
($)
Control
Treatment
10%
42%
23%
38%
0.00
0.05
0.10
0.15
0.20
0.25
0.30
0.35
0.40
0.45
Took a loan from saving groups
(0/1)
Took a loan from family/friends
(0/1)
Control
Treatment
control group). While a small percentage of women may be diverting savings from formal
institutions, this should not be viewed as a negative effect of the SfC program given the net
increase in overall savings on average.
Prior to intervention implementation, implementers
hypothesized that SfC may reduce participation in, or “crowd
out”, traditional savings groups: A woman involved in an
ASCA or ROSCA prior to SfC may opt to participate in SfC
rather than continue with her current group. We find that
ROSCA participation decreases slightly (‐2%) but this decrease
is not statistically significant. Participation in ASCAs other than
SfC does significantly decrease by ‐8%. This suggests that the
SfC program does crowd out other types of savings groups.
Significantly more women reported receiving a loan in the last
12 months in the treatment group (59%) compared to the
control group (56%). Of women who received loans, the total
amount received as loans in the last 12 months did not differ
between the treatment and control villages. However,
respondents from treatment villages did borrow significantly
larger amounts from savings groups, on average, compared to control respondents. Women in
treatment villages were 12% more likely to receive a loan from a savings group and 4% less
likely to receive a loan from family and friends
(see Figure 9). In Malian culture, it is often
considered shameful or embarrassing to ask
friends or family members for a loan,
particularly if it is a woman asking this of a non‐
relative man. Therefore, the impacts point to a
benefit of the SfC program that is difficult to
quantify but likely quite important: SfC groups
provide a less stigmatized source of credit
while simultaneously normalizing lending
within the community.
Figure 8: Impact on savings
Figure 9: Impact on loans

50
Health, shocks and food security
Health expenses Oxfam America’s theory of change hypothesized that within three to six months of introducing
SfC in a village, households would be better able to deal with both health and agricultural
shocks. This study, however, did not find that the SfC intervention significantly changed the way
in which households dealt with health expenses. Treatment and control households reported
similar amounts of health expenditures from the last month and were equally likely to sell
households assets or take a loan from a savings group or other source in order to pay for a
health expense. Similarly, no differences were found in the rate of serious illness. It should be
noted that the theory of change predicted it would take three to five years for such changes to
occur, therefore the study period of 3 years may not have been long enough to capture changes
in health status. Alternatively, as highlighted by the qualitative work done by BARA, the fact
that 2012 was such a difficult year in terms of both poor harvests and the political instability
caused by the coup may have lead households to focus on food security.
The analysis of the high frequency survey data supports these findings: No significant changes
are observed in household health expenditures nor in the incidence of illness or fever in
treatment villages (Table A5.8).
Shocks The intervention did generate changes in the way in which households reported dealing with
shocks (see Figure 10). This somewhat supports the predictions made in the theory of change,
in which we expected households to be better able to cope with health and agricultural shocks
within three to six months of starting SfC. First, treatment households are more likely to report
taking a loan from a savings group32 to deal with a shock. Although the difference is statistically
significant, the difference is very small in economic terms – 1% in treatment villages compared
to 0% in control villages. Second, while the overall number of households that resorted to a
costly strategy to cope with shock did not change, the strategies employed differed between
the treatment and control group. Specifically, households in treatment villages were 2% less
likely to migrate as a result of a household shock. This may not be surprising, as women must
stay in the village to participate in an SfC group. It could be argued that if participation in SfC
forces households to forego a risk‐coping strategy, this is not an entirely positive result. This
effect on migration is discussed further in the joint chapter with BARA.
32 This includes both SfC and other savings groups.

51
0%
8%
51%
1%
6%
48%
0.00
0.05
0.10
0.15
0.20
0.25
0.30
0.35
0.40
0.45
0.50
0.55
Took loan from savings group
(0/1)
Migration(0/1)
FFH foodinsecurity index
(0/1)
Control
Treatment
Figure 10: Impact on reaction against shocks and food insecurity
Food security
Oxfam America’s theory of change
hypothesized that food security
would to increase six to twelve
months after introduction of SfC. A
key impact of SfC is that food
insecurity in treatment villages
was significantly lower compared
to control villages. Treated
respondents were 3% less likely to
report they did not have enough
to eat (37% compared to 40%).
The Oxfam America theory of
change predicts that SfC increases
access to loans and improves
savings by helping women to save
regularly. A portion of these funds
are used to purchase food,
resulting in greater food security. The theory of change predicts that these results will appear 6
to 12 months after introduction of the SfC program, which is supported by the impact
assessments discussed here. Additionally, the FFH food insecurity index dropped by four
percentage points in treatment areas, falling from 51% to 47% (see Figure 10). The FFH
measure which assesses the percentage of households that are chronically food insecure also
showed a decline of four percentage points, from 43% to 39%; this can also be viewed as a
relative decline of 10% in the fraction of households who report feeling chronically food
insecure.
While very detailed and complete, the FFH food insecurity measure may reflect respondents’
perceptions of how food secure they are, which is important but different from actually
experiencing fewer food shortages. To cross check this finding, we verified whether households
in fact are better able to cope with seasonal fluctuations and maintain their food consumption
at approximately the same level throughout the year, without having to resort to skipping
meals or eating less. Maintaining consumption levels in this way is known as consumption
smoothing. The high frequency surveys are an incredible resource for this, as we observe
respondents’ food consumption in multiple seasons throughout the year. Results from the high
frequency are reported in Tables A5.9. As expected, we find that consumption falls in the lean
season for all households: many households are food insecure as suggested by the FFH
52
measure. However, we find evidence that households in treatment villages experience a
smaller decline in consumption in the lean period33. This effect is statistically significant for the
small household, but not the big household. If SfC is helping households to smooth
consumption over the lean season, it is not surprising to find that the effect is driven by
increased consumption of the small household. If the program makes more resources available
to women in the lean season, women are likely to use those resources primarily for themselves,
their children and immediate dependents. While in statistical terms we cannot exclude that SfC
is merely causing food consumption to shift from the big to the small household in the lean
season, we interpret our findings as evidence that households are better able to cope through
the hungry season in villages offered SfC than in the control villages – consistent with the food
security finding.
We do not see a reduction in FFH’s food insecurity index in the high frequency survey data.
There are two measurement issues to note with the food security index in the high frequency
data. First, the questions in the HFS used to construct the index used a 3 month recall instead of
the standard 12 month recall used by FFH. Second, because there is variation in when
respondents were asked these questions, the 3 month recall period would often include only
part of the lean season – making it more difficult to observe changes in food insecurity precisely
in the lean season. We also use the high frequency surveys to see if the overall variation in food
consumption across seasons is reduced in treatment villages – ostensibly due to the improved
ability of women in SfCs to borrow and save. We use two measures of variability: the standard
deviation and the coefficient of variation of food consumption over time.34 Both are established
metrics that capture how much food consumption varies over time, where a larger value means
more variability. Results are shown in Table A5.9b: We do not find evidence that the variability
over time of food consumption decreases.
Malaria
We examine several variables to measure the impact of FFH’s malaria knowledge and
prevention campaign that was included as part of the SfC training package in the RCT study
33 The term Treatment*lean season in the regression indicates how consumption in the lean season changed for treatment households compared to control households. A positive coefficient would indicate that households in treatment villages experience smaller drops in consumption than control households. While the coefficient is positive for total food consumption (first column), it is not statistically significant. The second and the third column look separately at food consumed at the level of the small and the big household. 34 The coefficient of variation is equal to the standard deviation divided by the mean.
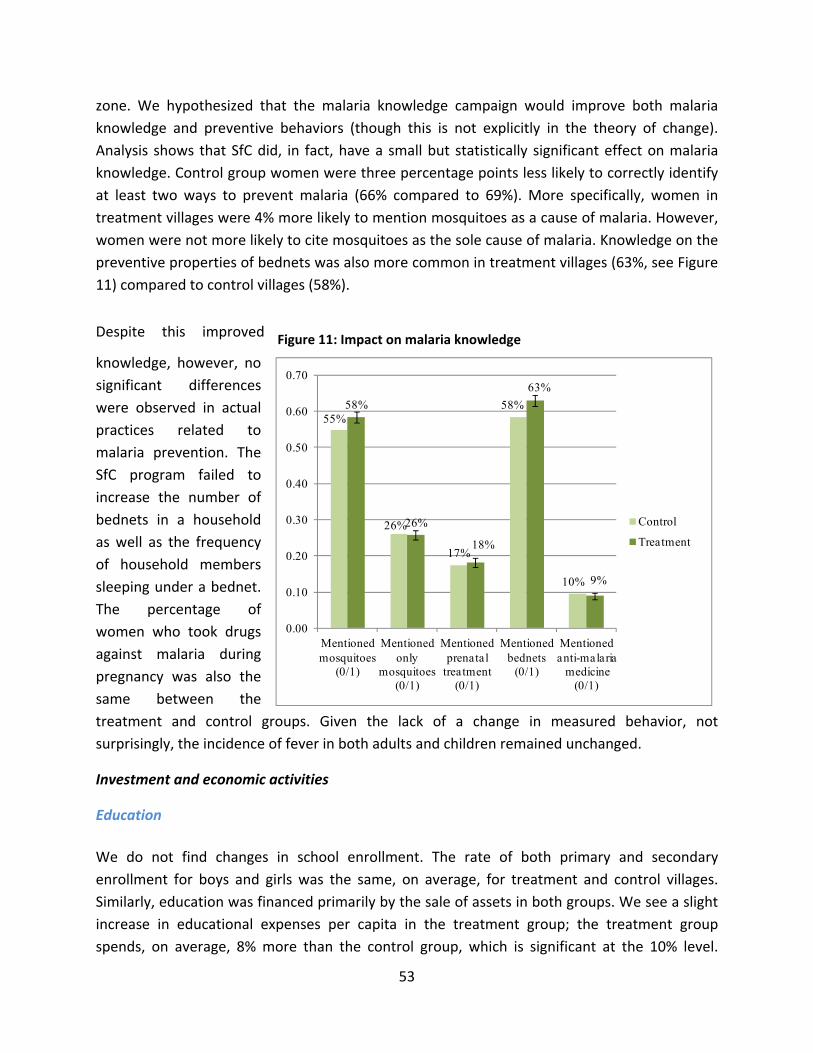
53
55%
26%
17%
58%
10%
58%
26%
18%
63%
9%
0.00
0.10
0.20
0.30
0.40
0.50
0.60
0.70
Mentioned mosquitoes
(0/1)
Mentioned only
mosquitoes(0/1)
Mentionedprenatal
treatment(0/1)
Mentioned bednets
(0/1)
Mentionedanti-malaria
medicine(0/1)
Control
Treatment
zone. We hypothesized that the malaria knowledge campaign would improve both malaria
knowledge and preventive behaviors (though this is not explicitly in the theory of change).
Analysis shows that SfC did, in fact, have a small but statistically significant effect on malaria
knowledge. Control group women were three percentage points less likely to correctly identify
at least two ways to prevent malaria (66% compared to 69%). More specifically, women in
treatment villages were 4% more likely to mention mosquitoes as a cause of malaria. However,
women were not more likely to cite mosquitoes as the sole cause of malaria. Knowledge on the
preventive properties of bednets was also more common in treatment villages (63%, see Figure
11) compared to control villages (58%).
Despite this improved
knowledge, however, no
significant differences
were observed in actual
practices related to
malaria prevention. The
SfC program failed to
increase the number of
bednets in a household
as well as the frequency
of household members
sleeping under a bednet.
The percentage of
women who took drugs
against malaria during
pregnancy was also the
same between the
treatment and control groups. Given the lack of a change in measured behavior, not
surprisingly, the incidence of fever in both adults and children remained unchanged.
Investment and economic activities
Education
We do not find changes in school enrollment. The rate of both primary and secondary
enrollment for boys and girls was the same, on average, for treatment and control villages.
Similarly, education was financed primarily by the sale of assets in both groups. We see a slight
increase in educational expenses per capita in the treatment group; the treatment group
spends, on average, 8% more than the control group, which is significant at the 10% level.
Figure 11: Impact on malaria knowledge

54
However, as no change is observed in the other educational outcomes and the statistical
precision is fairly low, this relatively small change may be due to chance rather than the SfC
intervention. These findings are not as expected from the theory of change. Specifically, it was
predicted that within the first year households would be significantly better able to pay for
school supplies and fees, which would lead to improved education three to five years following
the program.
Businesses
We also find no statistically significant changes in most outcomes related to business
development or expansion such as whether or not a woman had a business, months of business
activity over the year, and type of business. A similar number of women in control and
treatment groups had a business (43% and 44%, respectively). Businesses, on average, were
active for slightly longer than three months – but this did not differ between villages offered SfC
and those not offered SfC. On average, women in control villages reported business profits of
$41 per year, which was similar to those of women in the treatment area ($46 per year). In
addition to asking women directly about their business profits, we also asked detailed
questions about sales and expenses and constructed an alternative profits measure as the
difference between sales and expenses. This measure of profits however does not include the
value of the woman’s own labor, though this cost should, in principle, be included in the
previous measure of profits. Using this profits measure, there are no differences between
control and treatment villages either (calculated profits were approximately $37 per year, with
a difference of only 33 cents between control and treatment groups).35 The majority of women
engaged in petty trading (26% of women interviewed36), while a small number engaged in crop
transformation, meal sales, and crafts.
While we see no change in profits, we do find suggestive evidence of increases in both
expenses and sales for businesses in treatment villages compared to businesses in control
villages: On average treatment businesses spent 27% more ($131 per year compared to $167)
and sold 22% more ($176 per year compared to $215). These differences are significant at the
10% level but not at the 5% level.
35 Woodruff, McKenzie, & de Mel (2007) examine different methods of measuring micro‐enterprise profits and conclude that simply asking profits provides a more accurate measure of firm profits than detailed questions on revenues and expenses. In our data, the correlation between self‐reported and calculated profits is high (.78). 36 Since 43% of women report having a business and 26% report having a petty trading business, it follows that about 60% (=.26/.43) of businesses are petty trading businesses.
55
Taken together, there is only weak and limited evidence of improvements in business
outcomes. We do not find that women engage more in business activities nor do we find
increases in profits. The theory of change posited an increase in existing businesses in 6‐12
months, and an increase in new businesses and an increase in women’s income in 1‐3 years.
The endline was conducted before most groups had existed for 3 years, so it is possible that
incomes could rise as predicted by the theory of change. The evaluation timeframe may have
just been too short to provide statistical evidence on business income growth. The region also
experienced a drought in 2011, which may have lessened the benefits that would have
otherwise been gained by businesses as a result of SfC.
Data from the high frequency surveys provide more detailed information on business practices
during the study period (Table A5.10). Overall, we see no significant changes in the treatment
group across business profits, sales, or expenses.
Agriculture
Impacts on agriculture were examined both at the level of the primary respondent and the level
of the (small) household (Table A5.4). Overall, we see no significant changes in agricultural
inputs as a result of the intervention. A similar number of women in both treatment and control
groups reported cultivating land (39% compared to 41%). Inputs such as chemical fertilizer,
manure, other chemicals and paid labor did not significantly differ between the two groups.
Total expenses on inputs are also similar: $4 in treatment villages and $4.1 in the control.
Respondents in treatment villages did report a significant increase in the values of both output
($31.81 compared to $25.88) and sales ($8.92 compared to $6.95). Given that agricultural
inputs (which are generally better measured than outputs) did not change, this is a somewhat
puzzling finding and may be due to chance rather than a true impact of the program. The
qualitative analysis finds little reported change in agricultural output, which is consistent with
the explanation that differences detected in this report are due to chance.
These patterns are mirrored in the agricultural practices of the small household as well.
Seventy‐one percent of households in the control group cultivated land, which is statistically
similar to the treatment group. Expenses on agricultural inputs too were similar between the
two groups (for example, fertilizer, insecticide, and seeds). However, the value of output and
sales did not change at the household level, as they did at the women’s level.
Livestock
For primary respondents (who are all women), there were no differences between treatment
and control villages in the number or type of livestock that these women owned. These findings

56
are somewhat contradictory to the theory of change, which predicted that increased income
and fewer forced sales of assets would lead to more livestock ownership by women within one
to three years after women began participating in the SfC program. However, it should be
noted that when this outcome is assessed separately for Bobo women, we find suggestive
evidence that Bobo women on average in SfC villages have a higher value of livestock than
Bobo women in the control group. Moreover, we observe large changes in livestock holdings
owned by the household which is not in the theory of change, which we discuss next.
The value of and the expenditures related to livestock for the household as a whole (rather
than for just the primary respondent) did significantly increase in treatment villages, as
depicted in the Figure 12 below. Specifically, households in treatment villages spent, on
average, $6.22 per year more than control households, which spent $43.05. Livestock in
treatment areas was valued at $120, or 13%, more than in control villages ($896). This is a large
increase in the value of livestock. Section 4 of chapter IV, joint findings section, discusses how
to interpret these results: does this represent male capture of SfC benefits or cooperative
household decision‐making?
Figure 12: Impact on livestock
23
96 104
373
896
24
108 116
423
1 016
0
200
400
600
800
1 000
1 200
Poultry($)
Sheep($)
Goat($)
Male cows($)
Total($)
Control
Treatment

57
Assets
No significant differences were observed between the two groups in terms of household or
agricultural assets. Both household and agricultural assets were scored on indices that
measured assets per capita. Treatment and control households had similar scores at the small
household level as well as the extended household level. For example, respondents reported
owning a similar number of radios and televisions. While the agricultural assets per capita as
measured by the indices did not differ, households in treatment villages owned more ploughs,
on average, than households in control villages (an increase of 9% in number of ploughs
owned).
Housing
Housing quality in treatment villages slightly improved compared to control villages. Treatment
households have slightly better housing quality (specifically, treatment households score 0.06
standard deviations higher on the housing index37) compared to households in the control
villages. This is a relatively small effect (11%), even if statistically significant. The effect is
primarily driven by the percentage of households with hard roofs, with households in
treatment villages two percentage points more likely to have a hard roof38 than in control
villages (20% compared to 18%). The number of households with hard walls and hard floors did
not significantly differ between the two groups.39 Similarly, treatment and control households
reported the same access to water, electric lighting, a toilet or latrine, and gas/electricity for
meal preparations.
Paid Labor
We see a small but significant decrease (at the 10% level) in the percentage of primary
respondents who engaged in paid labor (8% in the control group versus 7% in the treatment
group). Relatedly, there was a small but significant decrease (at the 10% level) in the number of
women who migrated for work: 5% in the treatment group compared to 4% in the control
group. This finding echoes what was found when respondents were asked to report the ways in
which they dealt with shocks: Respondents in treatment villages were 2% less likely to migrate
in response to a shock compared to respondents in control villages (Section 5.3). As previously
37 This index incorporates several variables including information on roof, wall, and floor material, fuel use for lighting and cooking, and access to running water. 38 Hard roofs are made with wood, metal, cement, or concrete. 39 Hard walls are defined as walls made of cement or concrete. Hard floors are defined as floors made of cement, concrete, or tiles.

58
stated, the finding that SfC participants are less likely to migrate for work could indicate a
potential negative effect of the program: Participation in the program results in fewer options
for finding work.
Social capital
A hypothesized benefit of the SfC program is increased social capital as a result of solidarity
from group members and the experience of speaking in or running a group. However, we see
no significant differences between treatment and control respondents along various measures
of social capital. Furthermore, the impact coefficients are small standard errors, suggesting that
it is not simply that the data is very noisy and therefore difficult to detect an impact. Our
measures of social capital include a battery of questions on engagement in community, such as
speaking to the village chief or councilor, participating in village meetings, or voting, as well as
questions on social networks, such as asking others for help, being willing to help others, going
to the market with other women, etc. This suggests that there really were no changes in social
capital along the dimensions we measured, and not just that there is a lot of noise in the data.40
Analysis of the data from the subsample of 40 villages where detailed social network data were
collected further confirms this finding. We see no effects of the program on women’s degree
centrality (i.e. how many ties a woman has to other women in the village) nor on closeness
centrality (how close a woman is on average to other women in the village). Nor do we see an
effect on the overall connectedness of the village network. For further discussion on the
changes in social capital, please refer to section 3.2 in chapter IV, which summarizes and
provides additional interpretation for the qualitative and quantitative findings on social capital.
Female Decision‐making Power
Similar to the social capital measures, the theory of change also posits improvements in
women’s power within the household. However, we do not find support for this, and the null
results are again precisely estimated. We asked a battery of questions, including e.g., whether
the woman is free to decide on her own about food expenses (41% in treatment and 42% in
control), about education expenses (23% in control and 24% in treatment), about health
expenses (34% in treatment and 35% in control), about business decisions (43% in control and
44% in treatment). In no individual measure, nor in the index of all questions, do we find a
significant change. Note that the balance check done prior to the SfC program (Section 3)
indicated that the average household in the treatment villages scored somewhat higher on the
40 The exact dimensions we measured can be found in Table A5.5 in the appendix under the Social Networks subsection.

59
index of intra‐household decision making power. If this were to bias the impact assessments in
any way, we would most likely expect to find an erroneously large effect of the SfC program on
decision making. The fact that we find no such results confirms that this imbalance prior to the
SfC program launch did not unduly influence the impact estimates. For further discussion of the
potential explanations for why no significant changes were found, please refer to section 3.2 of
chapter IV which discusses the quantitative and qualitative findings jointly.
Consumption and poverty
Poverty was measured using an index called
the Progress out of Poverty Index (PPI),
constructed for several countries ‐ Mali
among them ‐ by Mark Schreiner41. The
index uses answers to 10 questions about a
household’s characteristics and asset
ownership to construct a simple measure
that is correlated with how likely a
household is to be below the poverty line.
We found modest increases in PPI scores
for treatment villages compared to control
villages significant at the 10% level.
Specifically, the average PPI score in control
villages was 21 compared to the average score in treatment villages of 21.5.42 This increase in
the PPI score translates into a 1 percentage point decrease in the PPI percentage of households
living below $1.25 per day (Figure 13). While the SfC program is designed to alleviate poverty,
these modest improvements are not entirely surprising given the length of the evaluation
period. If, as implementers claim, SfC needs to be active in a village for at least three years
before noticeable changes in consumption and poverty occur, our evaluation may be too early
to detect such changes. Similarly, overall monthly household expenditures on non‐food items
did not differ in treatment and control villages. A small increase was seen in treatment villages
on tobacco expenses ($0.15 per month compared to $0.19), but once other expenses were
taken into account, no change was seen in overall non‐food expenses. We do find suggestive
evidence of a small increase in total food consumption per adult in treatment villages. Per
capita food consumption in the past week increased by about $0.13, or about a 3% increase.
41 Schreiner, M. (2010). A Simple Poverty Scorecard for Mali. 42 The PPI score can range from 0 to 100, with households that score 0 being the poorest.
Figure 13: Impact on poverty
81.8%
98.5%
81.3%
98.3%
0.0
0.2
0.4
0.6
0.8
1.0
1.2
Under 1.25$/day Under 2.50$/day
Control
Treatment

60
This is a modest effect, and only significant at the 10% level. However, it further reinforces the
earlier finding in Section 5.3 that SfC may play an important role in improving food security.
The fact that no large differences were seen in food consumption may seem contradictory to
findings that food security increased in treatment households (Section 5.3). However, it should
be noted that the time period for these two outcomes are not the same: food consumption is
measured for the past seven days, whereas food security is measured for the past 12 months.
Endline data collection occurred during a season of relative plenty, when we would expect to
find smaller effects of SfC on food consumption. As we have seen above, the high frequency
data provide evidence that SfC did have positive effects on food consumption levels in the lean
season.
Heterogeneity
Next, we analyze whether impacts vary within the study population based on respondent or
household characteristics.
Household Type
As discussed briefly in section 1, Malian household structure is quite complicated and varied.
The likelihood that a woman participates in SfC, and the benefits she can accrue through the
program may vary in important ways with her household structure. We hypothesize that
women who are the wives of younger men in large extended households, for example, to be
more vulnerable than women married to men who are the heads of extended families. They
may also have different levels of decision‐making power at baseline. Their needs and their
ability to use SfC may therefore vary. We thus examined whether impacts are different for
women in different types of households. The results are shown in Table A5.11. We condensed
the considerable variation that exists in household structure into three main types: (1) small
households with no extended household, (2) small households where the head is also the head
of the extended household, and (3) small households where the head is not the head of the
extended household. Most strikingly, the impact of SfC on food insecurity differed significantly
by household type, with the largest impact found among households of type 3. We found a
similar pattern for food consumption per capita, with the average for type 3 households in the
treatment group being $0.27 per week above the average for equivalent type 3 households in
the control group. This is consistent with the hypothesis that women in subunits headed by
younger or less powerful men within the extended household – who are likely more vulnerable
– gain more from SfC’s consumption smoothing tools
61
Household Wealth
We assessed whether the impacts of SfC varied with wealth using per capita food consumption
as a measure of wealth. Specifically, the sample was divided into terciles43 of the per capita
food consumption distribution to analyze the ways in which impacts varied for the wealthier
households compared to the poorest of the poor. As discussed in section 3, while women in the
upper tercile were significantly more likely to adopt SfC, we see many women in the bottom
tercile participate as well. There is no further evidence of heterogeneity in the effects of SfC
between wealth groups (Table A5.12).
Household Ethnicity
We also analyzed whether SfC impacts varied by household ethnicity. Bobo women were
significantly less likely to adopt SfC compared to non‐Bobo women. As mentioned earlier in the
report, this may be due to language barriers faced by the replicating agents in some villages.
The results in Table A5.13 show that impacts are different for Bobo and non‐Bobo households
for some outcomes, with some impacts being larger for non‐Bobo households and others for
Bobo households. However, no clear pattern emerges so these different impacts are difficult to
interpret.
Structured vs. organic SfC replication
Lastly, we examine whether impacts differ between villages with structured versus organic
replication. Since in structured replication villages village agents receive more training, we
hypothesize that impacts will be larger in structured replication villages. The analysis indeed
reveals heterogeneity in the hypothesized sense. First, villages where replication was structured
had significantly more SfC members, on average, than organic villages. We also observe that
structured replication is significantly more effective at raising women’s livestock ownership
than organic replication (though we do not see differences in livestock ownership by the
household overall). Furthermore, households in villages with structured replication scored
lower on the FFH food insecurity index and higher on the PPI and the housing index. While
these households also scored higher on the social integration index (meaning they are more
socially integrated), no differences were seen in community action or intra‐household decision‐
making. Additionally, no significant differences were found in coping strategies, business
ownership or household consumption and expenditures (Table A5.14). Overall, these results
43 The first tercile includes households with per capita up to $1.91 and the cutoff between the second and third tercile is $2.99.
62
suggest that structured replication is more effective at improving a household’s socio‐economic
conditions than organic replication.
6. Cost‐Benefit Analysis
In this section, we report cost‐benefit calculations using different assumptions and outcomes to
assess costs and benefits. We first look at the cost‐benefit ratio for the program in general and
then consider structured vs. organic replication.
Overall SfC Program
On the cost side, a first cost component is the program’s implementation costs. Using financial
and administrative data from Oxfam America/FFH and our data on take‐up, we estimate the
implementation cost per household to be $16.72. This takes into account only costs incurred by
the NGOs that were subcontracted by Oxfam America/FFH and not the costs for supervision
and management by Oxfam America/FFH staff. As our impact estimates are ITT estimates, the
implementation costs too are averaged over the number of (small) households in the treatment
villages – independent of whether a member of the household participates in SfC or not. Saving
more money also entails a cost for the household in the form of reduced consumption. As a
proxy for this second cost component, we calculated the total cumulative contributions to SfC
groups since the start of the program. This amounts to $17.50 per household.
We use different measures to assess program benefits. A first measure is the total assets of the
(small) household. Total assets include livestock, household and agricultural assets, and
financial assets. The increase in total assets is $149.38 (se=60.1). Usually assets are not used
directly in a cost‐benefit calculation since we would rather use a measure which captures
household’s flow benefits from assets. Consumption is often viewed a good proxy for
household wellbeing. Therefore, as a second measure, we use the yearly consumption of the
(small) household – i.e. the sum of food consumption and non‐food expenditures over 12
months – complemented by an assumed 5% return on livestock. We include a return on
livestock to consumption because we are assuming that at the time of our endline survey the
newly accumulated livestock has not yet increased income (and accordingly consumption)
streams. This is consistent with the report’s overall emphasis on the short‐term nature of this
evaluation, and how we are getting an incomplete picture of the program’s long‐term impacts.
Since we do not have a reliable estimate of the returns to livestock, as a sensitivity check, we
constructed a third outcome measure, similar to the second, but assuming a 10% return on
livestock. Our ITT estimates of the treatment effect on the second and third outcome measures
are $34.57 (se=25.9) and $40.62 (se=26.7) respectively. Note that these impact estimates

63
correspond to program benefits over a 1 year period. If the program benefits are sustained over
several years, these benefit estimates are very conservative (i.e. they are lower bounds).
Putting the cost and benefit sides together yields the return on investment (ROI) rates
presented in Table A6.1. When using the assets measure to assess program benefits, the point
estimate of the ROI is very high (794%). Although statistically different from zero, the precision
of the estimate is rather low. Including the savings contributions as a cost factor lowers the
estimate of the ROI to 243%. The estimate is still high though and statistically significant at the
10% level. The high ROI rates are primarily driven by the large increase in livestock holdings
described above. When using the consumption‐based measures to capture the economic
benefits of the program, the point estimates of the ROI are 107 and 143%, depending on
whether we assume the rate of return on livestock holdings to be 5 or 10%. When taking into
account the SfC contributions as a cost factor, the estimates of the ROI are basically zero. None
of the consumption‐based ROI estimates are statistically different from zero.
In conclusion, the quantitative impact evaluation has shown that SfC brought modest impacts
on household’s wellbeing. The program led to a large increase in livestock holdings in particular,
but small impacts on food consumption – an outcome often used to capture household’s
wellbeing. We have not yet observed how those large increases in assets will translate to
consumption down the road. Given that consumption is most often used in a cost‐benefit
analysis, and not assets, this presents a methodological challenge in determining statistically
whether SfC’s benefits outweigh the costs. What this cost‐benefit analysis highlights clearly is
that the modest impacts stemming from SfC were achieved through a very inexpensive
program.
Structured vs. organic replication
In per household terms, the cost difference between structured and organic replication is very
small. Using administrative data from Oxfam America/FFH, we estimate the additional cost per
household of structured replication to be around $.40. Given this almost negligible cost
difference, evidence of even slightly higher benefits in structured replication villages would
suffice to justify a structured replication strategy. As discussed above, we find that the program
impacts on take‐up, livestock holdings and food security are significantly and uniformly higher
in structured replication villages. In cost‐benefit terms, this presents a clear and unambiguous
case in favor of structured replication.
7. Conclusions
The SfC program has clearly succeeded at outreach, particularly to hard‐to‐reach groups. The
evaluation was done in villages which were rarely visited by microfinance organizations:

64
villagers were on average 22km from a paved road and 8km from a market on average.
Nevertheless, the majority of villages that were offered SfC chose to participate in the program,
leading to an average participation rate of 36% in treatment villages. In a sign of the program’s
popularity, we found many villagers in control villages participating in groups which look like
SfC: approximately 12% of survey respondents in control villages reported being members of a
savings group similar to SfC (using the “loose” definition of SfC).
Who are SfC members? The data suggests that SfC members are slightly older, more socially
connected and wealthier than non‐members. However, participation rates are nevertheless
fairly similar across the entire wealth distribution. Also, over time the women who join SfC later
are more similar to the average woman villager in Mali.
Based on the analysis shown in this report, it can be concluded that the SfC program generated
positive, although modest, impacts. Specifically, we find that participation in savings groups
leads to an overall savings increase in treatment villages. This is an important first stage of the
evaluation, to demonstrate that random assignment to treatment did lead those in treatment
villages to be more likely to participate in an SfC group and to save more. As argued by Collins
et al (2010), reliable financial services to the poor are valued in their own right.
Although we do not see clear increases in enterprise activity as is often hypothesized, we do
observe significant increases in livestock ownership at the household level. We also observe
important improvements in the food security index. Moreover, the high frequency surveys
provide corroborating evidence of improved smoothing of food consumption: we observe that
households are able to better weather the lean season, by not reducing their food consumption
as much, thanks to SfC.
The SfC program also had a non‐financial malaria education component, and we found that
indeed the program improved health knowledge related to malaria. However we did not find
any impact on behavior change, nor on health outcomes. This indicates that the SfC program
has potential not only for providing a financial service, but for being a conduit through which to
provide add‐on services such as health education, but more work remains to be done to
determine how and whether health education can lead to behavior change.
No significant impacts of the SfC program were found along several expected dimensions as
outlined in the theory of change. For example, we did not see changes in health outcomes or
expenses nor in outcomes related to social capital or female empowerment. Non‐food
expenditures and poverty measures were the same between treatment and control villages. As
noted in section 5, some of these changes may occur over a longer period of time, and
65
therefore would not be captured in this analysis. Additionally, null results for these impacts do
not lessen the positive changes detected as a result of SfC (such as increased savings and
reduced food insecurity).
We find that SfC participation does vary somewhat by wealth as determined by food
consumption per capita in the household. Specifically, we find that women in the top tercile are
more likely to adopt SfC. While this finding is statistically significant, it does not suggest that the
poorest women are excluded from SfC since a significant percentage of them join as well. More
importantly, the other impacts of the SfC program assessed in this report did not differ
significantly based on wealth.
From a programmatic perspective, we find that the structured replication process, compared to
the organic ‐ less expensive ‐ replication process, leads to higher participation rates, larger
improvements in food security and in a household’s asset base. Given the small additional cost
on a per household basis of the structured replication scheme, we conclude that structured
replication outperforms organic replication in cost‐benefit terms.
Naturally with any evaluation of short or medium length, important questions remain
unanswered regarding longer term impacts. For example, the asset building impact (specifically,
more livestock) could lead to higher long term income, and thus make other investments more
likely as well, such as in the enterprise. Furthermore, with stronger resilience, households have
more incentive to invest, although such an impact may take time to realize. We discuss in
further detail the take‐away messages from the evaluation along with specific policy
recommendations in the joint chapter with BARA.
66
III. SUMMARY OF QUALITATIVE FINDINGS (BUREAU OF APPLIED RESEARCH IN ANTHROPOLOGY AT THE UNIVERSITY OF ARIZONA)
1. Research objectives and methodology
Introduction
The Bureau of Applied Research in Anthropology at the University of Arizona led the final phase
of the qualitative component of the impact study in August 2012. The main objective of this
portion of the research was to conduct follow‐up qualitative research in 19 total villages. 15 of
these villages were part of IPA’s quantitative sample of 500 villages in the RCT zone. BARA had
visited five in a previous research phase in 2009; the remaining ten villages in the sample were
pre‐selected by IPA from among the villages participating in their 2009 high frequency study. In
addition to the 15 villages within the RCT zone, BARA also returned to four villages outside the
zone in order to determine the impacts and evolution of the SfC program over the three‐year
period of the impact study.
Information was collected at the village, household, and individual levels and covered a broad
range of topics including health, education, livelihood systems, coping strategies and resilience,
investment and asset management, availability and access to resources, and social networks. In
addition, this study also focused on gaining a better understanding of the value that households
attribute to the SfC program in contrast to a range of other available financial tools, including
tontines and other sources of savings and credit that exist at the village level in the
communities studied.
Research Areas
The following key research areas and sub‐topics were examined during this study:
1. Household and Community Systems of Credit and Savings
Informal loan activity and access to credit
Households that did not report the use of informal loans during the 2009 research phase were
probed further to find out why they do not use loans and what their strategies are without
loans. The role of tontines and other savings groups was also evaluated by identifying
households that are participating in these kinds of ROSCAs and their rationale for choosing this
form of credit as opposed to SfC.

67
Strategies for consumption smoothing and loans
This was a cross‐cutting topic for all households to better understand the role of animal
husbandry and other strategies employed to smooth consumption. Women were particularly
encouraged to explain how they use SfC loans, especially loans for meeting the consumption
needs of the households and as a risk mitigating strategy. Particular attention was given in
selecting households that intend to take loans for investment, but end up either taking
consumption loans or expending all profits in consumption rather than through re‐investment.
2. Household Livelihood Strategies
Household characteristics and livelihood strategies
The types of household organization, family structure and livelihood strategies were studied to
understand their effects on SfC participation.
Household’s relative wealth
Trends in the differences in household spending and saving behavior were a major factor in
selecting households for this study. Three types of households were selected for each village: a
wealthy household, an average‐income household, and a poor household. This was done in
order to detect differences in how more vulnerable households spend money, as opposed to
less vulnerable households that may tend to engage in spending on non‐necessities and
additional business investment.
Coping strategies
A key component of this final evaluation is to understand the rationale behind the choices that
households make about their economic coping strategies when facing shocks at the household
and community level, including medical emergencies, insufficient harvests, drought, income
volatility, etc.
Migration and remittances
Migration was previously identified as a major resilience strategy used by many households. In
this study, women were asked about the role of migration in their households and whether
they had to choose between being a member of SfC or staying mobile.
3. Women’s Participation, Empowerment and Social Capital
Women’s participation
Detailed analysis of women’s participation in SfC and profit investment strategies at the
household level both from loans invested in income‐generating activities (IGA) and the annual
68
SfC payout were conducted in order to obtain a rough estimate on how much women put back
into IGAs and how much they used to either start new IGAs or invest in non‐IGA activities.
Women’s empowerment and social capital
One of the key issues of the final evaluation of the SfC program is to assess whether or not the
program has had a positive impact on the role and position of women—within their households
and wider communities, and in the development of social capital.
4. Operational Findings
This section provides findings related to variations on the SfC model, structure and replication,
institutional weaknesses with Malian partners, and factors contributing to SfC success.
Methodology
The methodology adopted by BARA for this final evaluation followed the same format used in
the two previous studies. In collaboration with partners at Oxfam America, FFH, IPA and Malian
researchers, data collection instruments were designed to capture a maximum level of
qualitative information in a short time frame. In addition, a household questionnaire was used
to obtain more detailed profiles on 3‐4 households per village in order to develop a better
understanding of the capacity of households to choose coping strategies that increase their
resilience to shocks.
Instruments were designed in response to feedback from the initial phase of research. The
study methodology is based on the Household Livelihood Systems Approach (HHLS), which
analyzes local household dynamics in a holistic socioeconomic framework within the broader
community and region. Throughout the research process, an emphasis was placed on
community participation in identifying and analyzing household dynamics.
In each research site, one community interview, and two focus group interviews (one for
women and one for men) were conducted. Key informants from the community were also
identified and interviewed; these were respected, knowledgeable and articulate individuals
whose perspectives added considerable depth to the analysis. In addition, 3‐4 households were
selected according to their relative wealth to capture a broad range of economic strategies and
coping mechanisms. Other factors were also taken into consideration when selecting
households, including: ethnicity, principal livelihood strategies, household size, simple vs.
complex household, net household income, female‐headed households, and households with
significant contributions from migrant members. The research instruments consisted of a set of
general open‐ended interview questions about the rationale for household economic

69
strategies, and a set of targeted questions about specific economic activities, history and use of
loans, and household coping strategies.
Sampling The sample for this study consisted of 19 total villages. Five of these were repeated from the
original eight44 that were visited by BARA in 2009 in the RCT expansion zone. Three of the five
villages were treatment sites and two were control (see Table 1). In addition, four villages
outside the RCT zone that have had the SfC program for a longer period of time were also
visited to understand the evolution of the program over a longer time span. The original choice
of these RCT and long‐term SfC villages comprised a purposive sample designed to reflect the
maximum diversity in terms of ethnic composition, livelihood strategies, accessibility to major
roads and markets, and availability of other savings and credit systems. The remaining ten
villages in the sample were pre‐selected by IPA from among the villages participating in their
2009 high frequency study (see Table 1). These included both treatment and control. At the
request of Oxfam America and FFH, SfC village selection also sought to include ‘structured’
groups that were trained by technical or replicating agents who had received formal training
(structured), ‘organic’ groups that were formed by replicating agents who had not received
formal training, and rare cases of ‘spontaneous’ groups that formed without direct oversight
from any technical or replicating agents affiliated with Malian NGO partners (see Tables 1 and
2).
44 As discussed below, BARA made every effort to return to all of the original eight villages visited in 2009. Unfortunately, logistical constraints during the rainy season made this impossible.
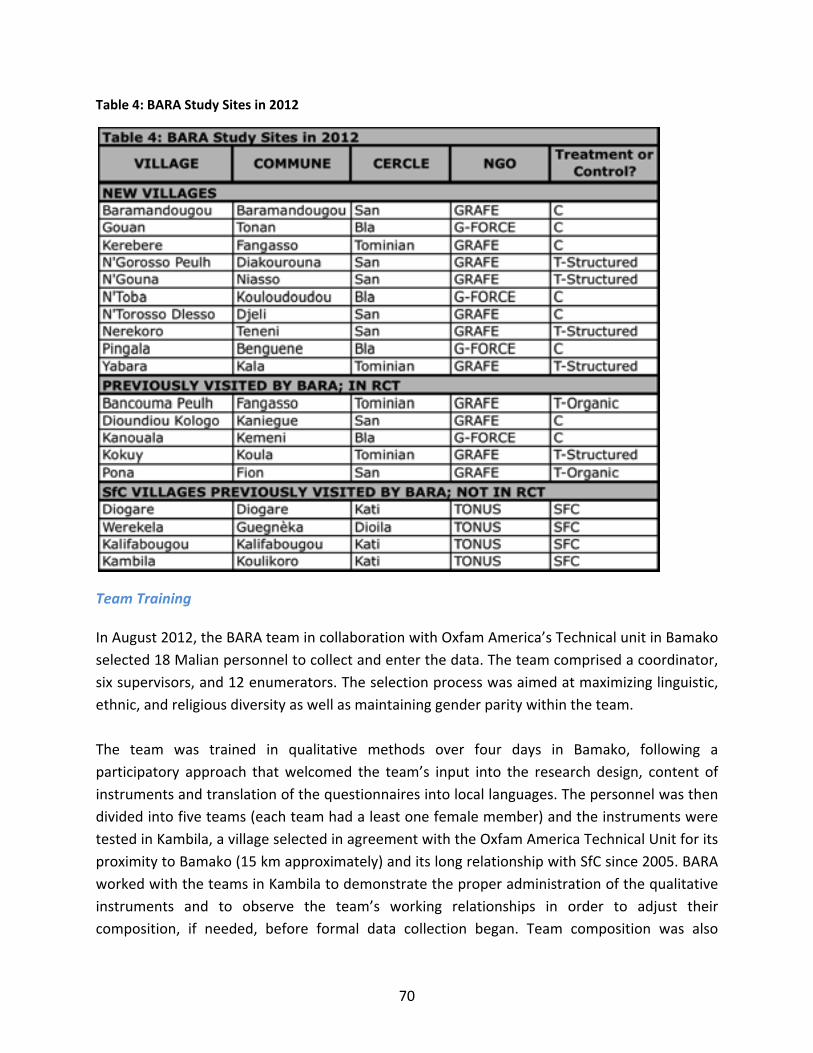
70
Table 4: BARA Study Sites in 2012
Team Training In August 2012, the BARA team in collaboration with Oxfam America’s Technical unit in Bamako
selected 18 Malian personnel to collect and enter the data. The team comprised a coordinator,
six supervisors, and 12 enumerators. The selection process was aimed at maximizing linguistic,
ethnic, and religious diversity as well as maintaining gender parity within the team.
The team was trained in qualitative methods over four days in Bamako, following a
participatory approach that welcomed the team’s input into the research design, content of
instruments and translation of the questionnaires into local languages. The personnel was then
divided into five teams (each team had a least one female member) and the instruments were
tested in Kambila, a village selected in agreement with the Oxfam America Technical Unit for its
proximity to Bamako (15 km approximately) and its long relationship with SfC since 2005. BARA
worked with the teams in Kambila to demonstrate the proper administration of the qualitative
instruments and to observe the team’s working relationships in order to adjust their
composition, if needed, before formal data collection began. Team composition was also

71
refined to ensure that at least one native speaker of Minianka, Fulfulde or Bobo was included in
the teams traveling to villages where these languages were spoken.
Fieldwork Research in 15 villages was completed over the course of 12 days. The research teams spent
between 1‐2 days in each village. Upon arrival at each village, the team met with the local chief
to announce the purpose of the visit (each chief had also been contacted ahead of time by the
Technical Unit) and to obtain permission to stay in the village and conduct the study. The host
communities were very welcoming and receptive to the teams, particularly SfC villages, where
association with such a well‐received program undoubtedly facilitated data collection.
In each selected village, the research team conducted community interviews with the village
chief, elders, and other community members; two focus group discussions (one with men and
one with women); two to three key informant interviews with technical and replicating agents
and local resources people, and four household interviews stratified by locally identified wealth
criteria. During community interviews, study objectives were presented and community
members were assured of the independence of the research team from any political, religious,
or economic affiliations to ensure the full participation of the host community.
Community meetings lasted approximately two hours and captured general information of the
village, including its history, current population, ethnic and linguistic variation, basic
infrastructure, dominant livelihood systems, and the presence of savings and credit structures
in the village. In villages that were previously visited either by the BARA team or the IPA team,
villagers were specifically asked to emphasize any changes that occurred in the village in the
interim period since the last study.
Following the community interview, male members of the team conducted a focus group
discussion with 6‐10 men of the village, and the female members of the team conducted a
focus group discussion with 6‐10 women. In SfC villages, focus group interviews included
women who were members of various SfC groups, as well as women who had not yet joined
SfC, or women who were members of other groups. Each focus group discussion lasted about
two hours and included community members randomly chosen from among those present at
the initial community interview who indicated willingness to participate. Discussion topics
included the history of the SfC group, its objectives, criteria for membership, relationship
among members, group activities, and the impact of SfC on the lives of women, its impact on
women’s status, women’s role in the household and in the community, and, finally, its
contribution to the resiliency of the entire household.

72
In SfC villages, key informants were identified during the course of village observation and
casual discussions with villagers. These key informants included advisors to the chief, health
agents, school directors, teachers, and other individuals who were familiar with key issues in
the village. Interviews with these individuals served to provide clarification on complex or
delicate issues in the villages.
Four household interviews in each village were also conducted in order to obtain a more
detailed socioeconomic profile of individuals within the larger household and village livelihood
systems. Households were selected with poor, average, and wealthy categories of
wealth/vulnerability, developed according to specific, local criteria. In most cases, household
interviews were conducted separately with the male head of household and with at least one
female member active in SfC or other savings or credit activities. This local input is essential to
the process since indicators of wealth can differ significantly from village to village.
The BARA method of collecting data emphasizes community participation in identifying and
analyzing household dynamics. Throughout the research, the methodology was designed to
maximize the range of opinions captured from local populations by using open‐ended focus
group discussions and semi‐structured interviews that allowed people to raise issues through
natural conversation within a pre‐determined range of relevant topics. In progressing from
general to specific information, the sequence of instruments in the two‐day research cycle also
allowed research teams to increase their knowledge of the community and to become aware of
the issues facing this particular community and to orient questions in the next set of
instruments.
A BARA research supervisor visited each team during the fieldwork and contact was maintained
daily between teams to discuss issues, adjust logistics, and ensure safety and quality of research
for each team. In addition to formal data collection, each research team toured their villages
with a local guide and collected observations to provide a complement to data from the formal
interviews. Each team was equipped with a Global Positioning System (GPS) unit and village
coordinates were systematically recorded, along with key infrastructures, roads leading to the
village, and interviewed households. These points provide a valuable record for longitudinal
studies of households over time and may later serve as a basis for a geo‐referenced monitoring
and evaluation database. The GPS data was then downloaded onto Geographic Information
System (GIS) software to be geo‐referenced and analyzed.
Limitations and constraints
Several constraints placed limitations on the scope of the study. The first was the timing of the
research, which was delayed until August due to the volatility of Mali’s political situation during

73
the previously scheduled start date in May 2012. Because fieldwork started in August in the
middle of heavy rainy season, all the teams faced major delays and logistical constraints. The
vast majority of the dirt roads going to remote villages were virtually inaccessible and all five
vehicles got stranded in the mud at some point. All vehicles required either the help of
numerous men from villages to be pulled out or, in some instances, tractors from the local
agricultural cooperative had to be rented to extricate vehicles. One vehicle, along with five
team members, was stranded for an entire night in an area that flooded very rapidly during a
rainstorm. The Malian fire department came the next day to rescue the team members and to
pull the vehicle out of the flooded area. Traveling time between villages also took considerably
more time than originally planned.
Conditions from the rains limited the number of villages that could be reached, and even more
significantly to the data collection, it was often difficult to secure time for in‐depth interviews
with farmers in the midst of their heavy work season. In villages where we had collected
information in 2009, we were often unable to return to the same households for direct
comparison. The three sites from 2009 that were not revisited in 2012 were Diora, Bougan, and
Zangouna due to inaccessibility and other reasons.45 In addition, the technical agents and
coordinators for the implementing agencies were not available for interviews in this phase
since the month of August is their annual vacation leave. These interviews represented a key
component of the research in previous years, both in gaining entrée into new communities and
in triangulating between village and external perceptions of SfC. In the absence of these face‐
to‐face interviews, the BARA team was able to speak on the phone with some of the agents
when specific questions about SfC groups arose.
Comparability with prior research
The second major limitation of this research involves the problematic nature of ending a
longitudinal research plan in a highly anomalous year, given current political and economic
instabilities. Although we often think of Malian villages as operating in relative isolation from
their central government, largely abandoned and without significant ties of infrastructure and
service, the coup d’état and the civil war in the north of the country have clearly had profound
impacts on even the most local economies. This is in part because migration, which may once
have been merely a means of supplementing household production and inserting an
agriculture‐based household into the cash economy, has now become a major part of economic
45 Precise reasons for this exclusion varied by village. Data in Diora (control) were compromised by a similar savings program sponsored by Catholic Relief Services in the village. The location of Bougan (treatment) in the Ségou commune was outside the major RCT zone in San and Bla communes, and Zangouna (treatment) was inaccessible due to road conditions in the height of the rainy season.

74
life in every village visited in the study, involving adult men who leave during the year in search
of wage labor jobs elsewhere in Mali or in bordering countries. Although the political unrest in
the country has been relatively distant from the expansion zone, uncertainty (increased
checkpoints and police harassment of vehicular traffic, rumors of impending ECOWAS
intervention, etc.) has placed significant restrictions on market activity and seasonal migration
patterns for all communities. Placing remittances and seasonal cash contributions in jeopardy
forces a recalculation of household economics that is unlikely to lead to the adoption of new or
potentially risky strategies.
Across the RCT expansion zone, poor environmental conditions and the poor harvest from 2011
have had serious and, in some villages, devastating impacts on food security and household
vulnerability. Most of the villages have experienced flooding, drought, or both since SfC was
introduced in 2009. The vast majority of the villages visited for this final evaluation have
suffered from periodic drought, most recently in 2011—droughts that have devastated their
agricultural production and made many households food insecure. Many villages also are
periodically flooded (Dioundiou Kologo, a control village that never received SfC), with
catastrophic consequences including loss of lives due to houses collapsing and loss of crops and
cattle.
In this phase of research, we visited communities in which last year’s drought caused very real
starvation and death among the elderly and infants. Households that raise animals also
reported high rates of livestock disease outbreak across the region. The majority of interviewed
households experienced at least one shock in the last year that had adverse economic
consequences for the household. The most onerous shocks that households experienced
related to reduction in harvest (due to natural disaster) or to illness of either animals or nuclear
family members, all of which could have exerted a major effect on measuring the impacts of SfC
in 2012 as compared to 2009.
Malian households are accustomed to periodic shocks, but the past few years have clearly been
anomalous in political and economic terms, and it is difficult to imagine a program that could
effectively mitigate the effects on all capital, social and other, produced by that degree of
suffering. This may provide some insights into the limited increases in social capital that have
been quantitatively measured in the IPA study. Very difficult years and a high degree of
economic uncertainty have made for a climate of general mistrust; for much of this year people
were afraid to go out on the roads or connect with their extended families, particularly those in
the contested northern regions of Mali.
75
Given this situation, our ability to demonstrate the possibilities of economic growth appears to
have been largely undercut, since most villages have had such bad years that much of SfC’s
capacity for income generation has been lost to emergency consumption. Most women
approach SfC from a highly risk‐averse perspective and may require years of demonstrated
returns before they are willing to modify the system toward greater potential for income
generation by putting variations into place, such as using a system of multiple shares in savings
contributions. This means that the very perception of risk can powerfully influence SfC’s
economic impact, and the political tumult and poor harvests have significantly influenced those
perceptions. Indeed, we see a consistent constriction of the program in its final year, with
groups either reducing the weekly contribution, shifting loan use toward consumption, or
abandoning the program altogether, as was the case with one group observed in N’Gouna that
was not functioning well and opted to terminate the program at the end of an annual cycle.
In view of the difficulties Malians have recently faced, any longitudinal inferences about the
development of SfC over time must take into account the anomalies encountered during the
endpoint year of the study. However, despite the issues presented by Mali’s situation in 2012,
these difficult recent years do offer us the possibility to demonstrate the ways in which SfC can
smooth income to soften the effects of current shocks, as our most recent findings indicate
strongly.
2. Context
This section of the report presents the general background and context of villages visited during
this phase of the study. These results build upon information collected by BARA during prior
studies in 2008 and 2009 and yield insight into the general patterns of resource access,
economic behavior and coping strategies that serve as the backdrop to the village and
household level impacts of the SfC program. Qualitative data collected in 2012 from the 19
villages where BARA conducted focused case studies provide context to complement
quantitative data collected by the IPA team. The combined data from these studies occurring at
two points in time clearly show that populations involved in SfC are living in situations of
chronic vulnerability to shock, with limited access to basic infrastructure for drinking water,
health services, education and transportation.
Overview of sample villages
This section reviews the main characteristics of the SfC villages selected and provides context
for understanding the savings strategies these communities adopt according to their particular
circumstances.

76
Village size The average population for all the villages visited is roughly 1000 inhabitants, with a general
range between 500 and 2000 inhabitants. All the communities interviewed noticed that the
population in their village is increasing rapidly and most view it as having a negative impact on
already scarce natural resources, particularly water and land. One possible reason for this
change is the effect of the recent 2012 political coup d’état and subsequent instability in
northern Mali, both of which have caused internal population displacements and resulted in
families receiving relatives and friends in their households throughout Mali.
Accessibility Five of the villages are located at least 10 km from the paved road and are virtually inaccessible
during the rainy season. These villages suffer from isolation and lack of access to markets and
health centers (Pona, Nérékoro, Pingala, N’Gorosso Peulh, and N’Toba). In contrast to these
remote, isolated villages, some villages are located in close proximity to a major paved road, or
are literally bisected by a paved road, such as the village of Kanouala.
Water
The villages that are the most isolated tend to suffer the most from a lack of investment in
infrastructure. Access to water, health, and education are critically lacking in all villages, but
particularly in inaccessible communities. Lack of water is cited by the majority of villagers as the
greatest limiting factor in the improvement of the quality of life in their villages, in the areas of
health, sanitation, and agricultural production. Some villages have at least one deep‐water well
that provides potable water year‐round (Dioundiou Kologo, Gouan, N’Torosso,
Baramandougou), but some only have unprotected traditional wells that are not sufficient to
provide water for the entire population (e.g. N’Gouna). In 2011 the insufficient rains
contributed to the drying up of many traditional wells, leaving populations at the mercy of
erratic rainfall for both agricultural needs and daily village consumption needs.
Water is also a major limiting factor for the expansion of agricultural activities and animal
husbandry. Off‐season gardening (generally from January – March) is rendered almost
impossible due to the lack of water for villages that do not have deep wells. Women are
therefore deprived of a major source of revenue during that season.

77
Other infrastructure: mills, health and sanitation, education
Another common infrastructural problem in most villages in the sample is a lack of mechanized
mills to ease the excessive workload of rural women who are responsible for pounding millet
and other staple grains by hand on a daily basis.
There is an evident association between the remoteness and the isolation of a village and the
lack of general infrastructure and health services in general. Most remote villages do not have
access to health services apart from periodic visits from health agents for vaccination
campaigns. Women, therefore, have very limited access to pre‐natal care and delivery facilities.
General sanitation, including the number of latrines, is correlated as well to the remoteness of
villages. Villages that have a school building usually have latrines in proximity to the school,
although the village of Pingala has a school building but no latrines. The school director, with
the support of the village council, has asked the local government many times to build latrines
for the school, but there has been no response. In many of these isolated communities,
government neglect has been mitigated by the assistance of NGOs in providing water,
sanitation, and education. Without NGO support and activities, these communities would be in
much worse shape than they currently are.
The vast majority of the villages visited had a primary school, with the exception of N’Gouna,
Bancouma Peulh, and N’Torosso Dlesso, however, there are not enough qualified teachers and
many of them receive salaries that are funded solely by parents’ associations in the absence of
government support. During difficult years, such as 2011, many women cannot pay for the
school fees and are forced to withdraw their children from schools, and girls in particular. In the
village of Dioundiou Kologo, a men’s agricultural group saved enough money to contribute to
the construction of a school. The men in the group work in the fields collectively and get paid
for their work. With the money, they buy cotton just after the harvest when prices are the
lowest, then they resale the cotton later one when prices are higher to make a profit. All the
money is invested in community works. As an example, the group contributed 2,200,000 FCFA
(4400 USD) for the construction of the village school (in collaboration with World Vision)
including 1,200,000 FCFA (2400 USD) for the first three classrooms in 2008 and 1,000,200 FCFA
(2000 USD) for three additional classrooms in 2010. In May 2012, the same group contacted
World Vision again for the construction of a community grain reserve. The group already gave
World Vision 500,000 FCFA (1000 USD) for this project. This is the only community in the county
that contributed money to build such community structures.

78
Ethnicity, caste, religion, and socioeconomic stratification
Bambara is the predominant ethnic group in all the villages visited for this study (generally
representing over 40 percent of the total population), with the exception of Dioundiou Kologo,
which is entirely Minianka, and Yabara and Baramandougou, which are almost entirely Bobo.
Other ethnicities represented include Fulani (Bancouma Peulh, N’Gorosso Peulh) and a small
number of Sarakole (Bancouma Peulh). Islam dominates in all the villages, although Christianity
and animism are also present in many villages, particulary in Bobo villages. In Dioundiou
Kologo, all three practices are represented and intermarriages are allowed.
Most of the villages visited do not have distinct caste practices, with the exception of the village
of Bancouma Peulh (SfC village), where three castes exist, including the Flajon, who are not
allowed to participate in several activities, including village‐level decision‐making. In other
villages where castes exist, the lowest castes are not excluded. The lower castes usually include
blacksmiths and praise‐singers (griots) (found in N’Gorosso Peulh).
In terms of socioeconomic stratification, generally peri‐urban villages that have access to banks,
credit unions, and NGO activities, such as Kambila or Werekela, are relatively more prosperous
than isolated villages. On the other hand, villages like Dioundiou Kologo, Gouan, or even
N’Gorosso Peulh, that are relatively isolated and neglected by the government, are wealthy by
many measures. Absolute wealth may be less important as an indicator of the long�term
potential of SfC in a village than the degree of stratification of wealth within the community.
Communities that experience ethnic and religious homogeneity as well as cohesive and strong
leadership tend to see a reduced gap in wealth between the richest and poorest families. These
communities, like N’Gorosso Peulh, are also the villages that have thriving SfC groups where
women rely the most on each other for emergencies and highly developed forms of social
capital are most evident in the strength of women’s ties to one another. In contrast, Werekela
and Kambila, which are larger and much more heterogeneous in terms of wealth categories and
ethnic affiliation, do not show evidence of the same degree of social solidarity in times of need.
Extremely poor households in these larger villages reported having little social or economic
capital to draw upon in times of vulnerability despite a greater overall presence of wealth in the
village. These differences are revisited later in the report in analyzing findings related to social
capital.
Overall, wealthier households are significantly more food secure than poor households,
particularly during the soudure period, when grain reserves are at their lowest. Wealthier
households tend to have more land and can grow a greater diversity of crops that they can not
79
only consume, but also sell on the market. Even if enough land is available, which is not very
common, poor households tend to have difficulty finding the necessary labor to expand into
more intensive agricultural activities such as irrigated agriculture or crop diversification. They
either do not have sufficient labor resources within the household or lack the social capital to
participate in community agricultural labor groups. In the large majority of villages, community
groups or associations provide labor to those in need during critical periods, but their price
often excludes the poorest households from their services.
Leadership and political structure
As noted in the BARA baseline study, Bambara villages, the dominant type of villages in the
sample, function through a male gerontocracy in internal as well as inter‐village administration.
Usually village chiefs are elderly, but are surrounded by younger counsels that have great
decision‐making power. Households are generally represented in the village council by their
heads (a male, the vast majority of the time), and important decisions require the support of all
the village’s household heads. Disputes are resolved by a council of elders and advisors to the
chief, and act as an intermediary between the bureaucracy and the villagers.
Household characteristics
Households are generally very large in this region of Mali, and a complex dynamic defines the
typical household organization within predominantly agricultural and agropastoralist
communities. Households are often multi‐generational; men who share a male patrilineal
ancestor with the head of the household (the group’s eldest male, or gwatigi) live and work
under his authority. As noted in BARA’s earlier reports, this large “complex” household (gwa) is
composed of semi‐autonomous “sub‐units,” or nuclear households (du) comprised of a man
and his wife (or wives) and children, and generally share eating, food storage, and economic
activities together. Members of the greater household (gwa) generally cultivate together, and
their goods are managed collectively by the gwatigi. The gwatigi makes decisions about the
management of resources held in common by the household as well as those concerning
marriage, baptism, funerals, etc., and his word in such matters is final. In a large household,
each du may prepare its own meals, or petit plat; each du also has some degree of
independence, so within the household the economic well being of the du may vary widely. In
some parts of Mali the Bambara terms for du and gwa are reversed in relation to the larger
household and subunit.
Because households in Mali are usually large and complex, the distribution of wealth and assets
within a household is not homogeneous. Members of different sub‐units may not have access
to the same social and material capital, thus a relatively wealthy household may include food

80
insecure members who typically are second wives of poorer men, young couples, widows, etc.
In the village of N’Gorosso Peulh, the president of an SfC group is a widow who belongs to a
fairly well‐off household, but because she refused to marry the brother of her deceased
husband she struggles to meet her needs and the needs of her young children. The main
implications for SfC of this nested household structure are that women’s participation is more
likely to benefit her direct sub‐unit, or nuclear family (du) rather than being part of her
collectively managed assets at the larger household (gwa) level.
In the visited villages, households are patrilocal (a pattern of marital residence in which wives
move into the husband’s extended family post‐marriage), polygynous (with up to four wives per
husband according to Islamic custom) and constitute “complex” households that contain
multiple sub‐units. In contrast, among villages like Yabara and Baramandougou in which Bobo is
the dominant ethnicity and most people are Christian, adults are predominantly monogamous
and households tend to be smaller.
Livelihood Strategies
Agriculture, and particularly the production of staple grains such as millet and sorghum,
dominates household livelihood strategies in the villages that were visited. Maize, fonio and
beans are crops of secondary importance. Many villages visited also practice the culture of rice
and cotton, but these two cultures are sensitive because they require a lot of water and very
few households have access to irrigation in their fields. As noted in BARA’s previous evaluation
reports, continuing increases in the cost of inputs, coupled with decreased market prices and
late payments from CMDT38 for harvest, have led to a mass transition away from cotton to
other staples.
All communities strive to supplement production during the rainy season with off�season
gardening for sale, but the viability of this strategy is highly contingent upon the availability of
water and the accessibility of markets. Because the early rainy season, or “soudure,” is the
most difficult time of the year when grain reserves are at their lowest, most of the vegetable
production is sold for cash at this time of year. Firewood collection and charcoal production
also provide an important complementary source of revenue for households.
Animal husbandry is also a major strategy in most villages, and wealthy households also
practice animal fattening (l’embouche) for resale. Although most cattle belong to men, women
raise poultry‐‐ chickens, guinea fowl, pigeons, and also may own sheep, goats, pigs and some
may even own cattle. Nonetheless, there are significant variations between villages with
38 Companie Malienne du Développement des Textiles (Malian Textile Development Company)

81
respect to women's ownership of animals. In Minianka villages, for example, we found that
smaller animals (sheep, goats and chickens) are women's exclusive property, while agricultural
implements and cattle belong exclusively to men. In Zangouna even though a woman may own
goats, small animals, and other small things, she is not free to sell them without her husband’s
permission.
By contrast, as the elders in multiple villages affirmed, a woman's possessions typically derive
either from her wedding or inheritance, but can also include things she has purchased with
profits from her own economic activities. Although women may own animals‐‐even cattle‐‐
ownership does not always mean full control. Male household heads frequently claim titular
oversight of women's goods and may require women to seek their permission before selling or
otherwise disposing of animals. This does not mean that husbands have the right to sell the
goods of women in their households without their consent, especially not for the purpose of
taking another wife.
Economic strategies and relative wealth
The most striking difference between wealthy and poor households is their capacity to engage
in animal husbandry. Where animal husbandry is a significant livelihood strategy, the sale of
animals is the preferred method of coping with shock. Success in implementing this optimal
strategy over others appears to correlate with the relative wealth of the household, most likely
due to the ability of wealthier households to sell available animals in times of need, whereas
poorer households may not have a buffer of livestock to sell. This mechanism corresponds well
to the near�total absence of formal banking found in rural Mali. For the vast majority of
households, the ability to raise animals is considered the optimal saving strategy‐‐well before
savings and credit systems. This is also true for villages that participate more intensively in the
cash economy. Previous research in the region has shown that food security is greatest in the
cattle investing profile for lineage households with strong social networks (Becker 2000).
Animals are viewed as savings banks, since the livestock represent significant capital that can be
easily and quickly converted into money or food in times of need, and in case of sudden
expenditures for illness, weddings, deaths, and other ceremonies. Even very poor households
try to keep a few animals to guard against food shortages. For such households, the loss of even
a few animals has catastrophic consequences and usually pushes the family into food
insecurity. Animal husbandry is a risky enterprise, especially for households that cannot afford,
or do not have access to, veterinary care and vaccinations, or that do not have access to
enough pasture to feed their animals. Epidemics that ravage livestock are common and many
families lose significant numbers of animals—poultry in particular.

82
Understanding the economic strategies employed by poor households is critical in assessing the
transformative capacity of SfC over the long term. The most vulnerable households are usually
made up of female‐headed households, households with marginal occupations, or households
of artisan such as blacksmiths, potters, and carpenters. Poor households generally lack their
own agricultural implements, have limited access to land, and are unable to diversify their
livelihood strategies. Poorer households have fewer coping strategies at their disposal than
wealthier households, and are most likely to sell their animals at disadvantageous prices (during
the soudure period when everyone wants to sell their animals and prices are low) and to sell
their productive assets. Both strategies can leave the household further impoverished and even
more vulnerable.
Gender relationships
Economic activities are highly segregated by gender throughout Mali, although women help
men of the household during the periods of peak labor demand—for example, clearing,
planting and harvesting. Malians consider each gender to have its dominance; men are
structurally dominant, whereas women have control over the domestic spheres of food
preparation, marriage and birth (Turritin 1987). The lives of women in visited villages are
dominated by domestic responsibilities, but younger women also spend a tremendous amount
of time working in their fields and in those of their households. Within households, male
relationships are dominated by father‐son relationships, whereas female relationships have
both intergenerational and cross‐generational importance. If a woman does not have someone
with whom she can share domestic tasks (mogo were t'e fe, "they have no other people"), the
bulk of domestic work devolves upon her (Turritin 1987). This generally occurs when a woman
from outside of a hamlet marries into a household. There is therefore a tremendous degree of
variation within households in women's vulnerability and agency, depending on an individual's
age, kinship ties, number of children, etc.
As observed in 2009, women have been transitioning into the cash economy at an increasingly
rapid pace. The majority of the women interviewed are engaged in petty commerce or animal
fattening for resale. Throughout West Africa, there is considerable evidence that women’s
participation in the cash economy and in income‐generating activities has increased rather than
decreased their workload (Becker 2000; Mackintosh 1989; Wooten 2003). The acquisition of
mills for grinding grains is therefore essential to relieve women of the time‐consuming task of
pounding grain in mortars. Mills are identified as the major reason for the decrease in women’s
work. Women frequently cited the lack of mechanized mills as a major constraint to developing
other economic activities.
83
In traditional Bambara society, children are the property of their father, and in case of divorce
the husband decides the fate of his children. Generally the consequences of divorce are severe
for women, particularly if they are the ones who seek to leave, and women may even lose the
goods they have inherited or acquired during the course of the marriage. Because of these
practices, divorce rates are very low in all the SfC villages studied during this phase. The
inheritance system also provides little security for women. Widows in these villages are
regularly obliged to marry another brother of the family through the levirate system, and the
goods of the household pass to her sons upon her husband's death.
In most of Malian society, men commonly spend time away from the household, whereas
women spend almost all of their time inside the household, leaving only for some specific,
work‐related task. Any deviation is exceptional and in some areas may require their husband or
dutigi's permission. In practice, however, women circumvent this injunction against taa yaala
yaala (taking a walk) by combining visits with errands. Such negotiations are of practical value,
as a woman's mobility is directly linked to her ability to develop social and commercial contacts
(Turritin 1987).
Given this delicate social position, SfC may constrain female mobility in certain contexts and
enable it in others. As socially sanctioned and publicly mediated events, SfC meetings provide a
valuable platform for other forms of social interaction; this is in itself a significant factor in the
popularity of the program. There are some instances, however, in which women feel bound to
remain in villages in order to attend weekly meetings, and are therefore unwilling to leave their
household during economically or difficult periods and return to their parents' home. The
flexibility developed into the program by Fulani and Arab pastoralists may therefore provide a
valuable mechanism for Malian women generally who do not wish to remain in the village, but
do not wish to abandon SfC either.
Large‐scale economic transitions
The three major economic transitions that were observed in 2009 by BARA researchers have
been confirmed in this final evaluation. These economic shifts include changes in land tenure,
the effects of international price fluctuations and the financial crisis, more generally, and the
increasing rate of seasonal migration.
Land tenure The most common system of land tenure in traditional Bambara society is one in which the land
is allocated by the village chief and cannot be bought or sold. This system is in equilibrium when
land is plentiful relative to demand. Because of Mali’s rapid population growth, land resources,
however, are no longer sufficient to satisfy the needs of the population. Population pressure

84
and the dwindling availability of land were identified as major constraints during interviews
conducted during this phase of the project. Villagers are very aware that they have to produce
more to feed their ever‐growing population, and that in doing so soils are being depleted and
are becoming less fertile. And the high price of inputs prevents many farmers from using sorely
needed fertilizers. This rapid decrease in land availability creates a situation in which poor
households and women have less and less access to land, rendering them increasingly
vulnerable. Understanding land tenure security is critical in determining the kind of economic
risks women are likely to find acceptable.
Economic insecurities There exists a clear trend in significant price increase, as noted in 2009 and confirmed during
this phase of research. In all the villages visited, villagers reiterated that it is becoming
increasingly difficult to buy agricultural inputs. Prices of staple commodities have risen steadily
as well; farmers who can produce a surplus to sell at markets are benefiting from these high
prices, but high prices negatively impact poorer farmers who cannot produce enough grain to
last through the soudure each year. These households are forced to sell their animals, their
productive assets, or borrow money to buy grain at extremely high prices until the next harvest.
Seasonal migration The migration of young men and women has become an increasingly significant livelihood
strategy for many households in Mali. For the majority of households visited during this study,
migration adds an essential contribution to household economies. Migration simultaneously
reduces the number of mouths to feed and provides cash inputs to buffer against increasing
agricultural uncertainty. In general, it is the poorest households that depend the most on
migration because agriculture remains so uncertain, and because the households have limited
access to agricultural land. Household members who migrate, both male and female, generally
come back during the rainy season to help labor in the fields.
Resilience to Shocks In general, households and communities are more capable of dealing with shocks and stresses
when they have more than one way of earning a living (i.e., engage in a diversity of livelihood
strategies), access to sufficient livelihood assets (e.g., financial markets, good education, social
networks, roads, water and natural resources) and access to formal and informal governance
structures that promote resource management and policies, laws, and social/cultural norms
that enable households and communities to manifest adaptive capacity (e.g., delivery of basic
services, security, access to social safety nets). Adaptive capacity can be understood as the
nature and extent of access to and use of resources in order to deal not only with disturbance

85
(e.g., shocks or hazards) but also with stresses and longer‐term trends (i.e., changing
conditions). It results not only in the ability to ‘bounce back’ from shocks but to successfully
adapt to long‐term trends or changing conditions in the future.
Disturbance may come in the form of rapid or slow onset shocks (i.e., natural or man‐made
hazards) floods, drought, human disease epidemics, plant pest outbreaks, and conflict, or
longer‐term stresses (e.g., environmental degradation, political instability, conflict, price
inflation). By itself, a shock is not a disaster; it can, however, trigger a disaster because of
underlying physical, social, economic or environmental vulnerabilities. A disaster occurs when
households, communities, institutions or governments are unable to cope with a shock or
stress. In assessing resilience it is important to acknowledge that some disturbances are
idiosyncratic (i.e., affecting only certain individuals or households) whereas others are covariate
(i.e., affecting an entire population or geographic area).
The BARA interview data from 2012 indicate extreme vulnerability to natural disaster for much
of the population. Since 2009, the majority of the villages visited have experienced varying
degrees of flooding and drought. There is considerable overlap in these categories, since it is a
common occurrence in Mali for the same village to suffer from flooding and from drought in
different years. Households that raise animals also reported remarkably high rates of livestock
disease outbreak across the region. The majority of interviewed households experienced at
least one shock in the last year that had adverse economic consequences for the household.
The most onerous shocks that households experienced related to reduction in harvest (due to
natural disaster) or to illness of either animals or nuclear family members.
Coping strategies
There are generally two types of reactions to disturbances. First, adaptive strategies, which
households choose or change livelihood strategies, either in response to perceived long‐term
changes in exposure to shocks, such as being forced to reduce area farmed or grow less
productive crops, or proactive changes, such as switching to more drought‐tolerant crops or
increasing irrigation, in response to protracted exposure to disturbances, such as growing
exposure to drought.
The second type of reactions included are coping strategies, which are short‐term adjustments
such as temporary reductions in food consumption patterns, seasonal migration, or sales of
household assets in response to exposure to a specific shock.
In all villages in the BARA study, both types of strategies were noted. When households had the
capacity they use proactive strategies to adapt to changing circumstances. As an example, some
households use irrigation to grow rice and corn but also to grow vegetables in their gardens
86
during the dry season. Seasonal migration was also cited as a long‐term strategy to cope with
long‐term shocks. Another widely used strategy cited by the participants is going to see friends,
neighbors, or other family members for short‐term visits to borrow money or food to cope with
shocks.
3. Findings: impacts of SfC
This section of the report presents BARA’s key findings of the final qualitative evaluation of 19
villages in Mali, including 11 villages that participate in the Saving for Change program. The
main objective is to understand the range of impacts that the SfC program has had at the
household and village level in the context of local livelihood strategies. The findings are
organized according to the four major research categories defined earlier in the report: (1)
systems of savings and credit, (2) gouseholds and livelihood strategies, (3) women’s
participation, empowerment and social capital and (4) operational findings.
Systems of Savings and Credit
Household credit and informal loan activity The poverty found in rural Mali may easily lead one to expect that rural villages lack access to
capital, much less credit and savings. Capital however is not just coins stuck under a mattress,
capital is also the accumulation of houses, crops and animals, and access to labor that
households process and can mobilize. While investments in animals, or putting cash away in the
household, are certainly among the traditional means of savings, they hardly begin to scratch
the surface of traditional sources of credit and saving found within villages in rural Mali.
Moreover, in this landscape with its uncertain rains, periodic drought, where local markets and
prices at the mercy of world markets, and changing political policies, unless villagers have
sundry ways of saving and access to a plethora of sources for credit, it is hard to imagine how
they could confront many of the challenges of daily existence. The fact is that villages are rich in
such resources—many of them traditional—and it is their existence that helps households to
cope with the sundry shocks and crises to which they are constantly subject.
The most basic of these resources are their kinsmen and neighbors. People regularly lend and
borrow, money and grain, from one another particularly during the hardest parts of the year,
before harvest, when food becomes scarce. Beyond friends and neighbors, there are a variety
of community institutions that offer credit and assistance. Many villages have a community
chest (caisse villageoise). Where cotton is a commercial crop, the chest is generally funded by a
tax on cotton production. In many other villages the community chest is supported by collective
labor in people’s fields. In Bougoula, for example, which was studied in our first phase in 2008,

87
farmers can hire a group of laborers to do labor‐intensive tasks such as preparing the ground
for planting, weeding or planting seeds by paying 250 CFA (50 cents) to the caisse villageoise
(BARA 2008). Bankassikoto (also from the 2008 study) also had a men's group that organizes
group field labor for a fixed price. While these funds are used to pay for public works projects,
occasionally to increase these funds, informal loans are made to villagers. In addition to the
community chest, many villages have cereal banks that stock surplus grains after the harvest to
resell at a profit during soudure. We found cereal banks in Pona, Kanouala, and Bancouma Peul;
Bankassikoto used to have had one, but due to a string of bad years it ceased to function.
Charity is also has its place within villages. Muslims practice zakat—giving part of their annual
production to the Imam to help the poor (similarly to the Christian practice of the tithe). While
such institutions look like charity, because today’s donors may be tomorrow’s recipients, these
practices really function to provide a village level kind of social insurance and safety net for the
poor.
Less formal sources of traditional credit also exist within villages studied. Chief among these are
tontines (rotating credit associations). Typically nine to twelve people come together to form a
tontine. Members set a weekly quota (usually in cash, but can be in‐kind), and then take turns
receiving benefit of the weekly amount. Both men and women join and use tontines a variety of
purposes. For example, men use them to organize work parties that cultivate member’s fields in
rotation. Women use them, for instance, to buy cooking pots and clothing needed for
marriages, deaths, etc. In Bougan, we found a women’s tontine that did agricultural work for
pay, and deposited their earnings in a common chest, and lent their funds out at interest to
grow their funds to any villager whose loan the group approved. Beyond these sources of credit
and assistance, local moneylenders and merchants also may provide loans.
Households increasingly are making use of sources of credit that lie outside of the village,
particularly for certain commercial cash crops like cotton. Until recently, the parastatal
company, Compagnie Malienne de Developpement des Textiles (CMDT), provided credit to
cotton farmers. Beginning in 2008, CMDT was to be divided into four private companies in
which shareholders will hold 61 percent of the company, the Malian government 17 percent,
cotton producers 20 percent and workers 2 percent. During the process of privatization, we
found that credit provided and prices paid for cotton were such that many farmers ceased to
grow cotton, and switched to other crops. However, as they used this credit to buy fertilizers,
pesticides, and other inputs—used as well for other crops such as corn—some farmers
continued to grow enough cotton to obtain the credit required. These kinds of loans involve
substantial sums, and are the domain of men.

88
In recent years, credit unions, savings banks (caisse d’epargne), and other microfinance groups
have come to play an increasing role in providing credit to rural areas. However, evidence from
this evaluation suggests that usage of banks, MFIs, and credit unions is very modest. Because
most of these institutions either require collateral or a guarantor, most of their efforts have
focused on men, on cash crop producers, particularly cotton growers. Because of these
requisites only 25 to 30 percent of the population, primarily men, have availed themselves of
their services. For women, the statistics are even more skewed. Unless women have collateral,
or can convince their husband or another to be a guarantor, they cannot qualify for loans from
such institutions. As SfC has spread, evidence suggests that women are even less likely to use
such institutions—not only because of their collateral requirements, or the need seek
permission from their husband or other male relatives, and persuade them to be guarantors of
their loans—but because as the women of Werekela put it, they do not feel that these
institutions allow them the control over their money that they now enjoy in SfC groups.
This raises an important point that SfC tends to attract members where other financial
institutions do not. Women consistently reported appreciating SfC loans because the
requirements to qualify for them are much less onerous than other formal credit programs,
such as Kafo Jiginew, especially since there is no need for collateral to participate in SfC. Since
SfC targets women and allows them to design the parameters of saving and lending,
participants also feel that the structure is better tailored to their actual needs rather than
feeling the pressure to conform to the pre‐defined structure of more formal institutions. The
replicating agent in Werekela explained that: “In our group, we set the rules about how much
money will be contributed, how loans are taken and what will happen if someone does not
repay. Therefore we understand how to manage the group and there is less fear that if a
woman borrows money she will not understand the terms of how to repay it and will become
indebted. This is what can happen when villagers use the caisse d’épargne. There are many
rules and a woman who cannot read may also be afraid of participating when the rules are set
by people she does not know.”
While SfC groups are now widely found in Malian villages, other NGOs notably–Catholic Relief
Services, World Vision, CARE—provide similar programs, and in some cases compete within
villages for participants, which was a situation noted in the village of Diora that was part of the
2009 sample and had savings groups sponsored by Oxfam America/Freedom from Hunger and
Catholic Relief Services.
Effects of credit at the household level Given the size and complexity of Malian households, among the questions that might one might
ask is how can a small program where women's savings quota is only the US equivalent of $1.25

89
a week even begin to meet the needs of households or of even their sub‐units? The answer to
this has two parts.
First, it is important to understand that households make use multiple sources of credit and
have various means of savings. It is the multiplicity of sources that allows them to survive in the
harsh Sahelian environment—and cope with changing economic and political winds. To provide
a couple simple examples, we found that some SfC members also participated in tontines and
used them as a means of paying off SfC debts. Similarly, we observed another woman in a SfC
group in Nerekoro take out a loan, so that another member could pay back her loan, effectively
paying only the interest to roll over the loan. In addition, there were examples cited in four
villages in the sample where SfC members reported using SfC loans (or part of loans) to pay off
external non‐SfC debts for money borrowed informally from friends and relatives and from
local moneylenders at the village level. Borrowing from Peter to pay back Paul is not just a
common occurrence, but it is only possible when there are multiple sources of credit. This
behavior can also be understood in terms of the importance maintaining social, interpersonal
relations established through extension of credit and loans at the village level.
Secondly, a rather simple point: although the small sums that SfC provides cannot begin to
meet the needs of the household in themselves, the real value is that they encourage and help
stabilize women’s economic activities. Even if these activities are only intermittently successful,
the additional revenues they bring can be a visible contribution.
To understand how such small amounts of money may have large effects, an appreciation of
the social organization and economic dynamics of households in Mali is essential. Although the
household as a whole is a corporate enterprise (averaging 22 members with nested subunits of
7 persons on average), members contribution to its provisioning differ. While men are
responsible to provide the basics, married women must provide supplements for her children.
This division of responsibilities among men and women is talked about in Mali using a
metaphor of big and small plates: men provide the “big plate” staples, like a bowl of rice, and
women provide the “small‐plate,” the condiments that give the rice flavor. Thus as long as the
grain stored in their silos lasts, men provide the big plate. During the soudure, from the start of
the rainy season to the harvest, as stores of grains run out, responsibilities for children shifts’
increasing to mother’s small plate. Having access to funds, particularly at this time of year, not
only may help stabilize her economic activities, it can provide that little extra to her subunit to
keep her children healthy. This strategy ties in with IPA’s finding in the high frequency surveys
that SfC villages had smaller dips in consumption during the lean season than control villages at
the subunit level (impacts at the extended family level were not significant).

90
As mentioned previously in the context section, animals are an economically important part of
people's livelihoods most Malian villages. How important animals are to livelihood strategies
varies a good deal from one village to the next, and seems to depend upon a number of factors
including rainfall and the frequencies of droughts, epidemics, and thefts. They are, of course, a
source of food‐‐particularly protein, but they are also used to plow fields, and move goods to
market. They also constitute a form of wealth, and an important mechanism of savings.
Strategies for consumption smoothing and loans IPA has noted a significant increase in livestock ownership among SfC members, and in the
value of livestock ownership over the three years for households with SfC members. This is
consistent with a general pattern and stated preference (for wealthy and poor villagers alike)
that qualitative data demonstrated for keeping wealth in the form of animals. Although there is
tremendous variation from region to region and from ethnic group to ethnic group, the general
pattern is for men to keep wealth in the form of cattle, and for women to keep small ruminants
and poultry (where the loss of any individual animal is less devastating) and to buy young
animals to raise and fatten for resale.
Credit and risk management One of our more puzzling findings is that despite all risks involved, rural households generally
prefer to invest their savings in animals or commerce rather than in banking systems. This was
true of rich and poor households alike, although on vastly different scales. The question is how
to explain this. Among the obvious explanations is that the formal savings institutions are not in
the village; not well understood; not necessarily trusted‐‐ all of which are probably true to some
degree. But these explanations of ‘why not’ do not tell us much about the logic of the
alternative and why people may continue to prefer it.
The alternative is premised on risk management‐‐ it starts with the local wisdom of not putting
all one's eggs in one basket. Diversification is a fundamental way of spreading risks. Households
not only spread their risks by growing a variety of crops, but by having multiple fields. If they
have animals, similar principles apply. Animals, particularly cattle, represent significant capital
and a form of savings that can be used in emergencies. Each economic activity entails
numerous risks. Although some activities are riskier than others, households almost universally
follow a strategy of diversification to cope with risk, so that should a crop fail, animals die, or
market prices fall, they have other options.
As a general rule, households, if they can, try to secure their subsistence base first. Women’s
economic activities are an important part of this strategy. Because of the domestic constraints
on their labor—such activities tend be more risk averse than those of men. Typically women’s

91
crops tend to take little preparation other than planting, and require few if any inputs. In Mali
such crops include rice and peanuts, vegetables, okra, eggplants, hot peppers, tomatoes, beans,
and watermelons. Similarly, women's investments tend to be much more modest and risk
averse than men. Where a man might own cattle, the loss of which would be a big blow,
women own chickens, goats, and sheep, and thus put less at risk. Hence it makes sense that
women want to use SfC funds to invest in small animals to diversify their overall household’s
risk, and increase their ability to effectively cope with shocks.
Another way of looking at this problem is what resources do households have that they can
draw upon in the case of need. Here the problem is one of amounts and liquidity. This requires
that there is a market for an item, and when sold it can realize a significant sum. Cattle
represent significant wealth on the hoof, and so are ideal‐‐ and this is true to lesser degrees for
other domestic animals. Moreover, in ordinary times, unlike other forms of wealth (eg, jewelry,
tools, or landholdings), animals reproduce; and thus selling an animal may have less of an
impact than selling other stores of wealth.
In fact, because animals age, good management dictates that one should sell them at particular
times before they start to lose value. Animals can be risky investments, especially in the
drought and disease prone conditions of the Sahel. Since cattle can be physically moved, one
strategy to mitigate risk is transhumance, or seasonal movement with herds‐‐which also may
involve splitting up larger herds (and lending cattle temporarily to farmers as a means of
fertilizing fields with cow manure‐‐ something we saw in some villages). But in the case of a
drought when cattle begin to die, coping strategies such as selling off the cattle for low prices
come into play.
The village of Zangouna may be used as an illustration of diversification of strategies to mitigate
economic risk. In normal years, agricultural production is sufficient to meet the needs of most
of its households, but the village has had its share of calamities. There was an attack of crickets
in 1930, an epidemic in 2006, a flood in 2007, and a drought in 2008. The rains stopped early,
so the harvest was poor, and the drought and diseases killed many animals. During the rainy
season, before the crops ripen, money is scarce, and food stores may be low. It is during such
times that households may sell off animals. However, as they have diversified strategies, as
they begin to recover‐‐ they again buy animals.
We see a similar strategy in Bancouma Peul among inhabitants who are predominantly
agropastoralists. During the rainy season, men work in agriculture, growing millet, sorghum,
beans and peanuts. Women are increasingly involved in petty commerce, and grow onions and
tomatoes. Here, too, animal husbandry is the principal buffer against food insecurity, and it is
by selling off animals in difficult years that they assure adequate food resources for their

92
households.
While natural forces influence household coping strategies, not all calls of their resources are of
this kind. Capital is required to meet all manner of social needs‐‐money for illness, or weddings,
funerals, and other rituals may arise suddenly. While selling large animals continues to be the
favored way of meeting such social demands on household resources‐‐ the real problem for
most people is how to say "no" to more everyday sorts of demands, requests for money, or
loans whether from friends or members of one's family. One of the major disadvantages of cash
is that it may be too liquid. Cash stashed proverbially under the bed not only is unproductive,
but the risks being stolen. It is also easily squandered, and subject to social pressures. It is very
hard for wives to say no to their husband’s demands for cash if they have any. And it is here
that traditional forms of storing wealth may have an advantage. For women in particular,
because except for a few personal items (cooking pots, jewelry, clothes, and small animals)
nearly everything within the household belongs to men, their best long‐term saving strategy is
to buy these items. Tying cash up in a tontine, as with an SfC group, also makes it less subject to
immediate pressures.
These trends were exemplified during focus group discussions at the village level. As a woman
in Kokuy explained, “It is better for me to put my money into buying a lamb because when I
keep it in the house there will always be something I need to spend it on. Now that we have an
SfC group here, I can put my money into the fund and decide when it is good to ask for it back
to buy a lamb. That way it does not only depend on my own situation or my family but if I am in
the group I can ask at different times of the year.” A Fulani woman in Bancouma Peul also
noted that, “In our society, it is important for women to buy silver jewelry and coins [often used
as necklaces or hair decoration] because that is what we will keep if our husband leaves and we
have to return to our own parents with nothing else.” These statements reveal the ways in
which rural women make calculations about ways to protect their limited assets from
liquidation by storing them in non‐monetary forms of saving.
Although investing in animals entailing risks, animals unlike money literally reproduce, and if
properly managed truly grow. More importantly, the wealth animals’ represent is “lumpy.”
Although selling an animal provides a lump sum, it is an all or nothing proposition. This lack of
liquidity and lumpiness makes it a little easier to turn down social demands from their husband,
kinsmen or friends for small cash loans (BARA/IPA 2010). One can simply say, “I don't have any
cash.”
Uses and impacts of SfC loans and profit
As in our previous research, we see women torn between the desire to develop economically

93
and the constant demands of consumption that are their daily reality; economic behavior
provides a chronicle of the tension between these competing impulses. Groups continue to
aspire to objectives of income generation that they are seldom able to meet, but these
commitment strategies are understood as beneficial in themselves (described by women in
terms of the value of social cohesion) and not as creating undesirable social pressures on
women to act beyond their actual capacity. We see a general pattern (that can be verified in
IPA’s data set) of women either using their loans for consumption needs, or of women
decapitalizing their profits into consumption at the division of funds; this is particularly true
since the annual division in the expansion zone coincides with the period of greatest need for
the household economy.
To evaluate the real impacts of the SfC program, we need to look at the real issues in micro‐
finance: namely the various constraints on women, on their microenterprises, and on their
access to capital. Like many similar programs, Oxfam America and Freedom from Hunger target
women because they argue women are more likely to use their money to feed, educate, and
protect their children than men. SfC groups are vehicles both for saving, and for small loans. In
theory these funds are best used to help women to start microenterprises, because the
productive use in income‐generating activities provides the means of repayment. Likewise
standard theory frowns on consumption loans fearing borrowers may lack the means to repay
them.
The reality is quite different. Few microenterprises are very successful for a variety of reasons.
One of the major constraints on them is that women already have a full‐work load: childcare,
cooking, cleaning, garden work, fetching water, and tending animals. Because they have only a
finite amount of time to devote to a microentreprise, it must fit into their schedule. Usually this
means that such activities are limited to enterprises that are extension of work and skills that
women do as part of their everyday activities. For example, pasta making is an extension of
cooking.
Another characteristic of such enterprises is that the barriers to entry are low: that is to say,
they require little capital to get started. So we find that women engage in activities such as
cooking, cutting women's hair, processing peanuts or shea nuts, or invest in sheep, goats, and
poultry as these require little attention and care. Likewise petty commerce and gardening are
popular activities. If the start‐up monies come from an SfC group, or similar organization,
another limiting factor is that most groups require that repayments (with some exceptions for
agriculture) begin almost immediately. This means that this activity must produce sufficient
revenues from the start to make these weekly payments.
Low barriers to entry, and the limited range of activities that women are attracted to engage in,
mean that when they come to market, competition is high, and rewards typically low.

94
Moreover, a great many villages are far from the nearest market, and transportation costs to
them a prohibitive‐‐ unless the scale of return is extraordinary: limiting women's economic
prospects to within the village where the rewards are likely even less.
While some women may dream of owning a cow, or of having a millet mill, the reality is that
environmental and economic conditions are against them. Constant shocks and crises make
them vulnerable, and can erode way their capital. In Mali, for example, malaria is endemic and
widespread, so even a sick child can quickly deplete savings. If microenterprises were really run
like business firms, capital invested in the microenterprise would be administered separately
from household expenses. But, the reality is that microenterprise and household funds are
intermingled. In good‐times household funds may subsidize microentreprises; in bad times
microenterprises may be decapitalized to meet household needs. Given this intermingling of
funds, to talk about production or consumption loans is not effective. Such distinctions have no
meaning, and are of no analytical help in understanding how women use SfC savings and loans.
To underline this point, if alternative to taking out a loan to buy medicine for a sick child is to
take money from her “earnings” if available, and risk decapitalizing her “business”—then such a
loan just as easily can be viewed as for production as for consumption.
To understand how women use SfC savings and loans, narratives of women’s success in
business are less informative than are the more common stories of "failures." A woman from
Dioundiou Kologo tells a more typical story: she got a loan to start a poultry business‐‐raising
chicks to sell in the market. At first, the business went well. She sold her chickens and made a
profit, but then her daughter came down with malaria, and she ended up spending all her
earnings. While from the outside point of view of running an enterprise this business venture
may seem a failure, from the vantage point within the household, this enterprise is no different
than a poor harvest: it provided some money that could be put to good use at the time. The
point is that households are not in business to make a profit per se. Their goal is simply to
survive. And, any activity that contributes toward this is a definitional success. In as much as SfC
groups help to capitalize, and often recapitalize such activities, even if loans are used for
“consumption” and even if the money is the handed over to her husband, so long as these
funds are used for the benefit or well‐being of the household that is what counts.
Our argument is simply that given the many shocks and crises that impinge on households
abilities to make ends meet or pose threats to their survival—what SfC does well is to help
smooth these crises, and so provide a more stable platform on which livelihoods may be built.
Thus, timely small loans are often enough to advert a problem like a sick child from becoming a
crises that requires liquidation of assets. Similarly should an investment go sour‐‐ such as
having animals being raised for market die‐‐ a small loan to restart can turn such tragedies into
minor setbacks by serving as a means of consumption smoothing.

95
Households and Livelihood Strategies
Migration and remittances Migration, as noted above, has become a central part of a diversified economy, and for many
households is the most significant mechanism for maintaining a position in the cash economy
alongside a local economy largely based on subsistence and exchange of grain and goods. In all
the villages we visited in this phase, migration has become an important part of economic life
for nearly every household, with most sending their young adults away until their labor is
needed for the agricultural work in the rainy season. We see some evidence of a stratification
of migration strategies, in which wealthier households are able to secure stronger and even
international positions for seasonal labor, while most of the poorer households depend upon
day labor in Malian urban centers. Typical middle‐aged, married Malian women with children
are not the most common participants in seasonal migration, which limits the negative effects
of migration on SfC in many villages, with the exception of areas in which middle‐aged and
older women migrate to gold mining sites. However, young, unmarried women are increasingly
participating in migration to cities such as Bamako and in other countries in the region to serve
as housemaids, and this trend is a factor that can prevent young women from joining SfC.
Increasing trends toward seasonal labor migration have important implications for the
development of SfC groups. In SfC villages visited during this study, discussion with women who
migrate indicates that these women are well informed about SfC activities and see the benefits
of membership, but they say that the money they bring home through migration is essential for
their households. We did not see examples of women who migrated for short‐term periods and
continued their SfC participation while absent. However, such cases were observed in a
separate study with pastoralist members conducted in June 2011.46
46 In this study on SfC participation among highly mobile groups (Fulani and Arab pastoralists in the
region near the Mauritanian border), several cases were documented in which women migrated outside
their home villages for several months of the year and continued to participate in SfC groups in the
village by proxy, either by leaving money with a relative to pay in the members’ absence or having
another member pay in her place and reimbursing the proxy upon return. For villages of pastoralists
who moved to similar locations during the rainy season with animals herds, secondary meeting locations
were also established and women communicated meeting activities to the village replicating agent via
mobile phone calls approximately once a month.
Deubel, Tara F. 2012. Women’s Participation and Exclusion in Women’s Saving for Change Groups in Northwestern Mali.

96
Interestingly, discussions with men indicate that one of the benefits they see in women
becoming members of SfC groups is that it prevents women from leaving home to migrate out
of fear of not being able to pay their SfC contribution. Men say that this has led to greater
cohesion and cooperation within the household. However, it may also decrease women’s
bargaining power within the household, since it is harder for women to use the threat of
moving back in to their parents’ household, which commonly occurs in cases of temporary
domestic problems or divorce. The potential loss of household income from women’s migration
was not cited by men in any of the villages as a downside to their wives’ participation. This may
also be due to the fact that married women’s migration in Mali tends to be much less frequent
than men’s in general.
Coping strategies Villages with SfC groups cited loans from their SfC groups as a reliable strategy to cope with
shocks, particularly during food insecure months. All households who are beneficiaries of SfC
loans said that access to these loans during difficult times helped their households become
more resilient. When asked how members deal with the difficulty of repaying loans during
insecure months of the year, women in focus groups cited a number of strategies that included
taking fewer loans or lower amounts of loans (sometimes reducing the normal amount by half),
extending loan repayment periods to up to six months (rather than 1‐3 months).
Overall, the households interviewed in this study exhibit very limited adaptive capacities in the
face of shocks. Most households have very limited amounts of productive assets, including rain‐
fed and irrigated land, livestock, and non‐productive household assets. The number of income‐
generating activities undertaken by households was also very low. Households in the higher
economic categories were engaged in more IGAs than the lower categories, with men engaged
in animal fattening for resale and women engaged in some kind of petty commerce.
Women’s Participation
Shifts in women’s livelihood activities Women's activities are rapidly shifting toward petty commerce more generally, but particularly
in SfC villages. This is a trend that was already noticed in the 2009 BARA study and became
more apparent in 2012. We would argue that this trend has increased, especially in SfC villages,
because women have now access to cash and can invest more in their petty commerce. It also
provides a way for women to pay their weekly group fees. Women are becoming increasingly
involved in shea butter production (from wild shea nuts collected by women), and peanut by‐
products. In villages that benefited from the activities of NGOs that helped established gardens,
women cultivate their gardens and sell the produce to markets.

97
In the majority of villages studied in 2012, a large percentage of women have their own fields
for production, or at least some rights to use land belonging to the household, particularly in
Bambara households. Variation between circles exist, however, for example in Bla and Segou,
circles of married women usually conduct their own agricultural activities, while married
women in Tominian have less access to fields and do not have their own land parcels to
cultivate. Okra and peanuts are typical women’s crops found throughout the zone, and
constitute the most important agricultural products of women’s independent activities,
followed by shea nut collection for shea butter production.
Lack of access to land, coupled with the lack of land ownership, may be partially responsible for
driving women toward petty commerce as opposed to agriculture, particularly in villages where
SfC provides women with opportunities for economic growth.
Women’s empowerment and social capital Data from the 2009 and 2012 study phases indicates that women participants in SfC continue to
mention a perceived increase in social solidarity among women as the program’s most
important benefit to women on the village level. Secondly, the 2012 phase has confirmed that
men remain largely supportive of SfC and do not view the program as a threat. The added
income from loan and share‐out funds that women are able to inject into the household
economy through their participation relieves men of part of their economic burden, an
outcome that boosts men’s support of SfC in all villages studied.
Evidence from the expansion zone points to some interesting observations regarding village‐
level perceptions of the SfC program between 2009‐2012. In terms of social capital, women
observed a strengthening of pre‐existing social ties through participation in SfC and viewed this
as a positive benefit. For example, a woman in Bancouma Peulh stated that: “the weekly
meetings provide more opportunities to meet with friends and neighbors, catch up on news,
and be able to support one another morally and financially in times of trouble, whereas before
SfC we would rarely see many women since we are all so busy with out household duties and
sometimes would only meet each other several times a year at events like weddings or
funerals.” Participants in all treatment villages visited echoed this sentiment by pointing out
advantages of reinforcing social ties among women involved in SfC.
An increase in a sense of women’s decision‐making influence within and beyond the household
is another important aspect of the program that has been cited by village participants and
technical agents. Women in focus groups reported that they have seen their funds grow and
have noticed an improvement in sanitation and health at both the household level and in the
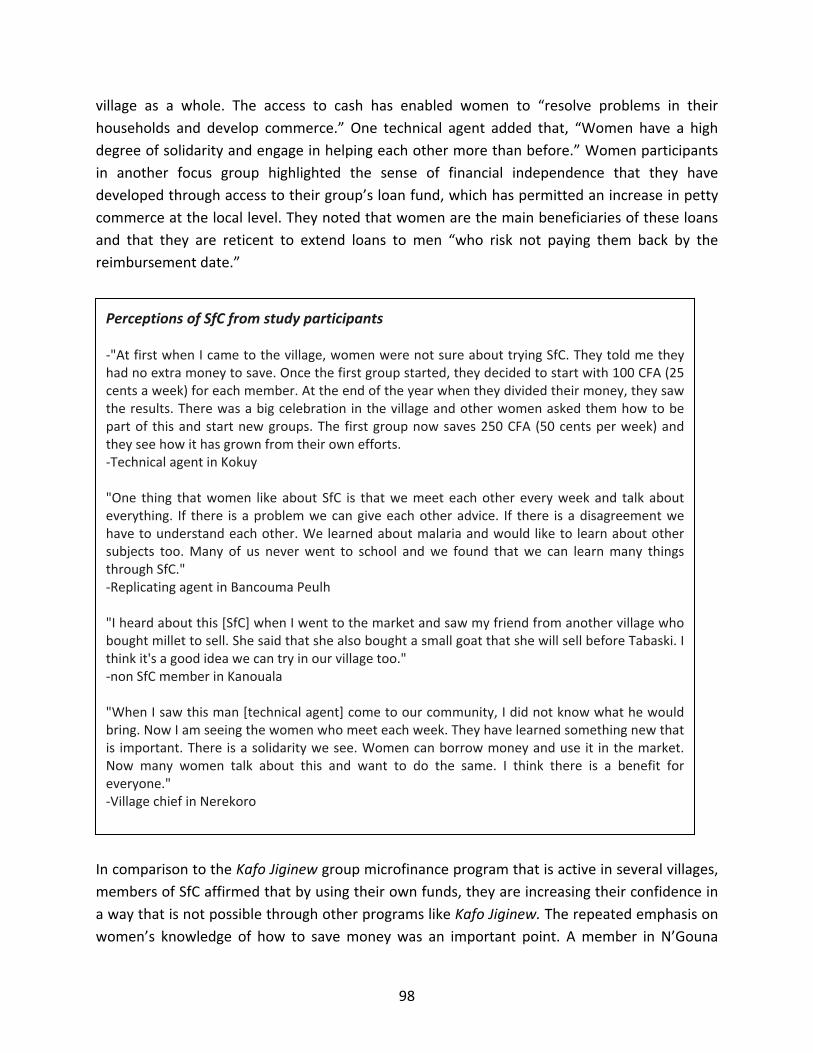
98
village as a whole. The access to cash has enabled women to “resolve problems in their
households and develop commerce.” One technical agent added that, “Women have a high
degree of solidarity and engage in helping each other more than before.” Women participants
in another focus group highlighted the sense of financial independence that they have
developed through access to their group’s loan fund, which has permitted an increase in petty
commerce at the local level. They noted that women are the main beneficiaries of these loans
and that they are reticent to extend loans to men “who risk not paying them back by the
reimbursement date.”
In comparison to the Kafo Jiginew group microfinance program that is active in several villages,
members of SfC affirmed that by using their own funds, they are increasing their confidence in
a way that is not possible through other programs like Kafo Jiginew. The repeated emphasis on
women’s knowledge of how to save money was an important point. A member in N’Gouna
Perceptions of SfC from study participants ‐"At first when I came to the village, women were not sure about trying SfC. They told me they had no extra money to save. Once the first group started, they decided to start with 100 CFA (25 cents a week) for each member. At the end of the year when they divided their money, they saw the results. There was a big celebration in the village and other women asked them how to be part of this and start new groups. The first group now saves 250 CFA (50 cents per week) and they see how it has grown from their own efforts. ‐Technical agent in Kokuy "One thing that women like about SfC is that we meet each other every week and talk about everything. If there is a problem we can give each other advice. If there is a disagreement we have to understand each other. We learned about malaria and would like to learn about other subjects too. Many of us never went to school and we found that we can learn many things through SfC." ‐Replicating agent in Bancouma Peulh "I heard about this [SfC] when I went to the market and saw my friend from another village who bought millet to sell. She said that she also bought a small goat that she will sell before Tabaski. I think it's a good idea we can try in our village too." ‐non SfC member in Kanouala "When I saw this man [technical agent] come to our community, I did not know what he would bring. Now I am seeing the women who meet each week. They have learned something new that is important. There is a solidarity we see. Women can borrow money and use it in the market. Now many women talk about this and want to do the same. I think there is a benefit for everyone." ‐Village chief in Nerekoro
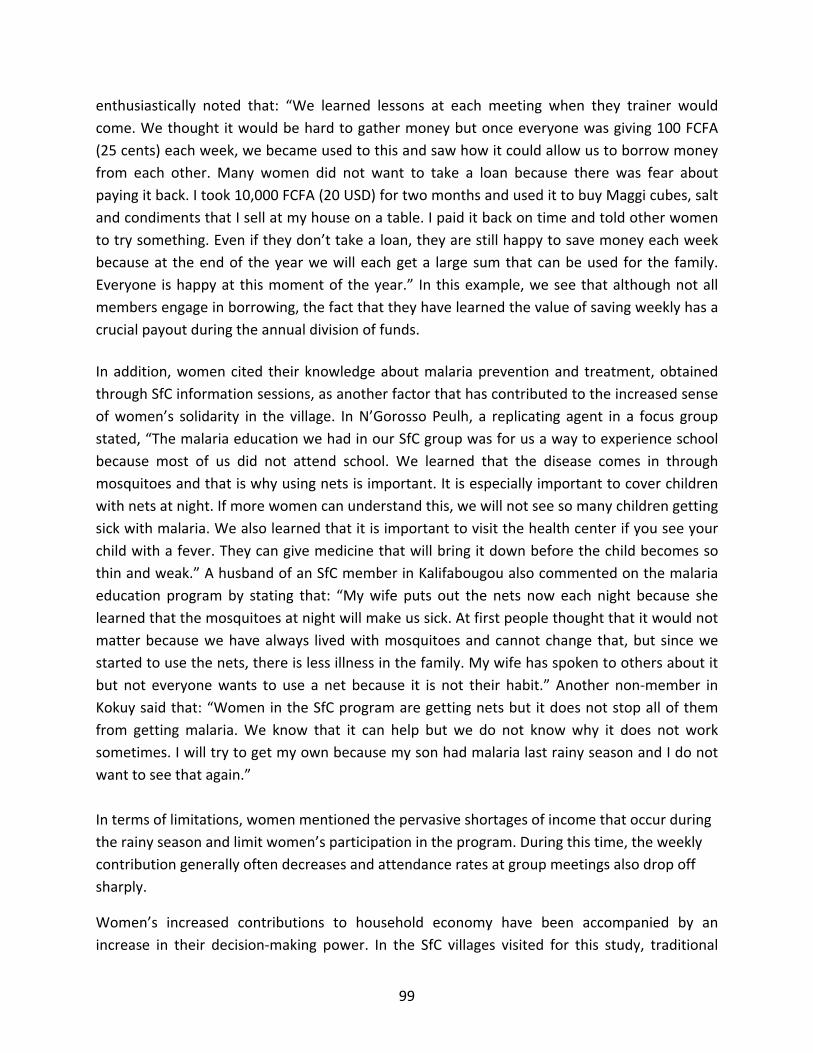
99
enthusiastically noted that: “We learned lessons at each meeting when they trainer would
come. We thought it would be hard to gather money but once everyone was giving 100 FCFA
(25 cents) each week, we became used to this and saw how it could allow us to borrow money
from each other. Many women did not want to take a loan because there was fear about
paying it back. I took 10,000 FCFA (20 USD) for two months and used it to buy Maggi cubes, salt
and condiments that I sell at my house on a table. I paid it back on time and told other women
to try something. Even if they don’t take a loan, they are still happy to save money each week
because at the end of the year we will each get a large sum that can be used for the family.
Everyone is happy at this moment of the year.” In this example, we see that although not all
members engage in borrowing, the fact that they have learned the value of saving weekly has a
crucial payout during the annual division of funds.
In addition, women cited their knowledge about malaria prevention and treatment, obtained
through SfC information sessions, as another factor that has contributed to the increased sense
of women’s solidarity in the village. In N’Gorosso Peulh, a replicating agent in a focus group
stated, “The malaria education we had in our SfC group was for us a way to experience school
because most of us did not attend school. We learned that the disease comes in through
mosquitoes and that is why using nets is important. It is especially important to cover children
with nets at night. If more women can understand this, we will not see so many children getting
sick with malaria. We also learned that it is important to visit the health center if you see your
child with a fever. They can give medicine that will bring it down before the child becomes so
thin and weak.” A husband of an SfC member in Kalifabougou also commented on the malaria
education program by stating that: “My wife puts out the nets now each night because she
learned that the mosquitoes at night will make us sick. At first people thought that it would not
matter because we have always lived with mosquitoes and cannot change that, but since we
started to use the nets, there is less illness in the family. My wife has spoken to others about it
but not everyone wants to use a net because it is not their habit.” Another non‐member in
Kokuy said that: “Women in the SfC program are getting nets but it does not stop all of them
from getting malaria. We know that it can help but we do not know why it does not work
sometimes. I will try to get my own because my son had malaria last rainy season and I do not
want to see that again.”
In terms of limitations, women mentioned the pervasive shortages of income that occur during
the rainy season and limit women’s participation in the program. During this time, the weekly
contribution generally often decreases and attendance rates at group meetings also drop off
sharply.
Women’s increased contributions to household economy have been accompanied by an
increase in their decision‐making power. In the SfC villages visited for this study, traditional

100
gender relations in terms of property, inheritance, and divorce have not significantly changed.
Both men and women in all villages studied, however, mentioned in focus group discussions
that with the presence of SfC, husbands and wives get along better and that men see their
wives more as partners now. As the husband of a partipicant in Diogare stated, "When my wife
borrowed money from SfC, we decided together to buy a donkey so that we can lend it to other
people for farming and charge 1500 CFA (3 USD) per day. This has brought good things to our
family. The children have clothes and books for school. Before this my wife sold condiments at
home. This was good but many women do it. Now we have something new to help our family."
There seems to have been no change between 2009 and 2012 in terms of what women own in
the household. Women’s possessions, which they acquire as wedding gifts or purchase with
their earnings, are not exactly their own. But even though heads of households claim ownership
of women’s goods, women usually have some control over the use, purchase, and sale of their
possessions. In many villages women own goats, sheep, and poultry. It is plausible that this
degree of control has shifted over time and has been influenced by SfC participation, however,
it is difficult to determine the extent of this shift since it is hard to measure.
Results from interviews with poor households show that women from these households are
enthusiastic members of SfC groups, even when finding funds for the weekly contributions may
prove difficult to procure. One main reason for this is the high social pressure to become part of
an SfC group and share the experience with other women in their family and wider social
networks. Despite such personal difficulties faced by the poorest women (particularly widows
or women whose husbands have migrated and created a deficit of household labor), BARA
research did not identify any formal and informal exclusionary mechanisms that prevent poor
women from joining SfC, which points to the program’s accessibility to the most vulnerable
groups in a village.
Operational findings
We do not generally see differences in the quality of training or mastery of SfC’s essential
concepts between groups trained by technical agents or replicating agents. As we found in
2009, replicating agents do not think that they are less capable than technical agents by and
large, but they often have problems in being seen as authorities when forming new groups, or
in proposing ideas for how the groups might run effectively.
For both of the above points, the confounding issue of early adopters is relevant. Differences in
groups may be attributable to the fact that the first groups in a village, and the groups more
likely to have more structured support from technical agents, also tend to be the least risk‐
averse: older and first wives. These early adopters often are well connected socially and have

101
economic interests and capacities to engage in income‐generating activity that may be quite
different from those of the women who choose to wait until the first groups divide their funds
at the end of the cycle before their demonstrable success entices them to join despite initial
misgivings. The finding from IPA that women who joined SfC are statistically better off than the
general population is not so surprising given this trend of early adoption.
As in 2009, we do see the system of multiple shares (bras multiples) functioning well to permit
groups to form along more democratic lines, since it allows women of different financial
capacities to maintain groups based on social cohesiveness without finding themselves
economically constrained or unduly pressured. We do not see a clear division in the use of
loans between (possibly wealthier) early adopters and groups that form later, but this may be
because the particular hardships of recent years drew all women toward consumption and
economic conservatism.
By contrast, the system of SfC associations was not functioning well in 2012 and most
treatment villages did not participate in any associations. Associations were originally intended
as higher level SfC networks in which members of several groups in a given area could meet
monthly and pursue larger collective projects. As in 2009, the purpose and potential of the
system of associations remains unclear to most women and this is an area that would require
further investment on the part of NGO sponsors to develop as a programmatic area.
Among the villages visited in this phase of research, there are some extraordinary success
stories, as well as some indication of groups that have struggled to maintain internal cohesion
over time in Touminian. Surprisingly, even in our small data set, we have a few cases where
ostensibly control villages had SfC introduced spontaneously (notably in Gouan where this
occurred in the sample) and to all appearances very successfully. If this is represented within
the larger sample, it is an extraordinarily positive sign for the sustainability of the program.
Previous BARA research, and indeed much of this phase of research, suggests that while non‐
SfC villages are often introduced to the program through extended social networks and easily
recognize its value, they are generally unable to replicate its success (and particularly its system
of interest‐based loans) without some training or external support. This is not generally
because the system is hard to master independently, but because risk aversion in the face of a
new and uncertain venture is not held in check by the reassurance of an outsider with some
authority encouraging the group to persevere.
Nonetheless, in this phase of research, we found not only villages that had successfully brought
in SfC, but others that had replicating agents that were in the process of developing successful
SfC groups in non‐treatment villages nearby. There are clearly certain sine qua non that must
be met for a village to successfully incorporate SfC spontaneously, and they are the same
criteria, unsurprisingly, that seem to predict SfC success generally: strong leadership (either in
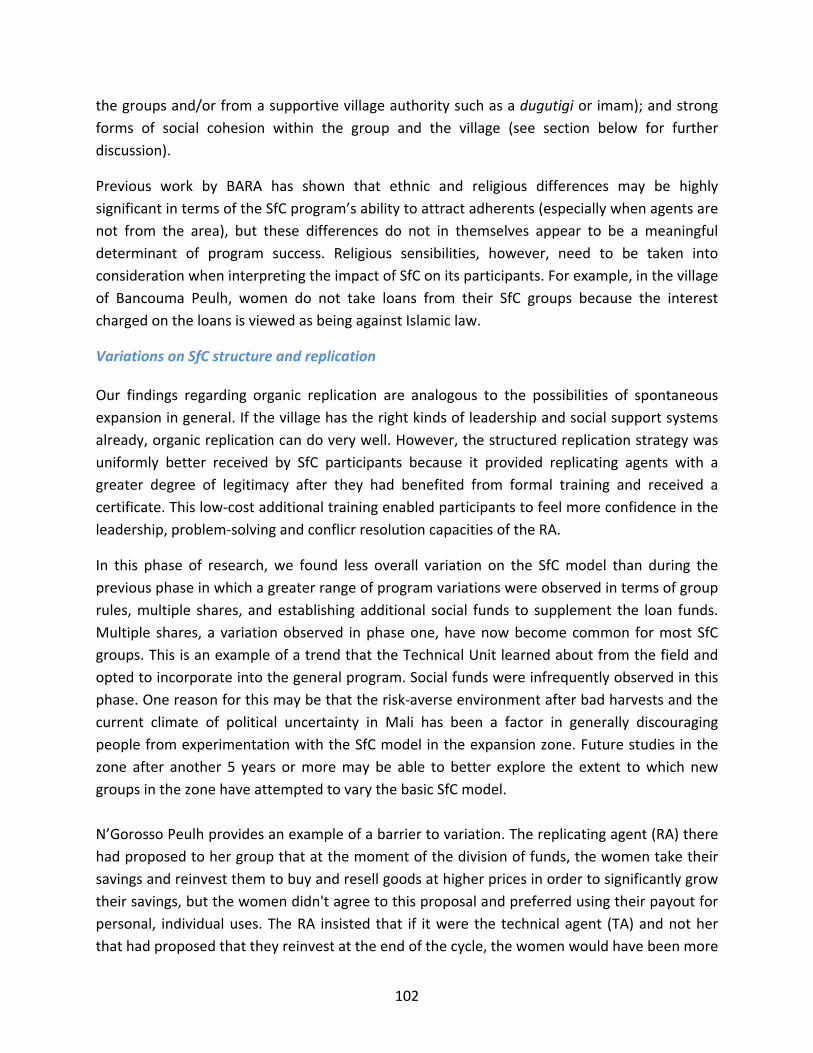
102
the groups and/or from a supportive village authority such as a dugutigi or imam); and strong
forms of social cohesion within the group and the village (see section below for further
discussion).
Previous work by BARA has shown that ethnic and religious differences may be highly
significant in terms of the SfC program’s ability to attract adherents (especially when agents are
not from the area), but these differences do not in themselves appear to be a meaningful
determinant of program success. Religious sensibilities, however, need to be taken into
consideration when interpreting the impact of SfC on its participants. For example, in the village
of Bancouma Peulh, women do not take loans from their SfC groups because the interest
charged on the loans is viewed as being against Islamic law.
Variations on SfC structure and replication Our findings regarding organic replication are analogous to the possibilities of spontaneous
expansion in general. If the village has the right kinds of leadership and social support systems
already, organic replication can do very well. However, the structured replication strategy was
uniformly better received by SfC participants because it provided replicating agents with a
greater degree of legitimacy after they had benefited from formal training and received a
certificate. This low‐cost additional training enabled participants to feel more confidence in the
leadership, problem‐solving and conflicr resolution capacities of the RA.
In this phase of research, we found less overall variation on the SfC model than during the
previous phase in which a greater range of program variations were observed in terms of group
rules, multiple shares, and establishing additional social funds to supplement the loan funds.
Multiple shares, a variation observed in phase one, have now become common for most SfC
groups. This is an example of a trend that the Technical Unit learned about from the field and
opted to incorporate into the general program. Social funds were infrequently observed in this
phase. One reason for this may be that the risk‐averse environment after bad harvests and the
current climate of political uncertainty in Mali has been a factor in generally discouraging
people from experimentation with the SfC model in the expansion zone. Future studies in the
zone after another 5 years or more may be able to better explore the extent to which new
groups in the zone have attempted to vary the basic SfC model.
N’Gorosso Peulh provides an example of a barrier to variation. The replicating agent (RA) there
had proposed to her group that at the moment of the division of funds, the women take their
savings and reinvest them to buy and resell goods at higher prices in order to significantly grow
their savings, but the women didn't agree to this proposal and preferred using their payout for
personal, individual uses. The RA insisted that if it were the technical agent (TA) and not her
that had proposed that they reinvest at the end of the cycle, the women would have been more

103
likely to accept. Her story points to a pattern in which group members are more likely to adopt
changes and variations when they come ‘from above’ with the authority of a TA rather than
from the RA or other women in the group. This finding relates to a pervasive view throughout
villages studied that the approval of an outside ‘expert’ is needed before attempting to change
the received model.
This issue of RA confidence among members also relates to the question of the relative
advantages and disadvantages of organic or structured replication of the program. For example,
also in N’Gorosso Peul, the RA has successfully formed one group but has run into problems
starting other groups in new villages since she did not receive a formal training that could help
increase her status in the perception of women in the community. She stated that she needs
the TA to accompany her so that people believe and trust in her. “Everything depends on the
TA,” she explained. “Women listen to the TA because he comes from outside the village and has
more knowledge and has been to school. The women respect me but they do not always have
confidence that my solutions to problems are the right ones. When an outsider speaks to them,
they listen more.” While she feels fully capable of doing the work, she cited the TA’s higher
level of education and training as the major difference between them since community
members tend to respect the authority of the ‘educated outsider’ more than a local woman.
This is a notable structural barrier facing RAs once the TA’s involvement with the community
drops off after the first year of the program. It was consistently mentioned by RAs in all seven
villages in the study that have organic replication. Nevertheless, it is important to recall that
about 60% of the outreach of SfC in Mali is accomplished through the work of replicating
agents. This attests to the fact that RAs are able work effectively despite such limitations;
however, structured replication was much appreciated by the RAs engaged in this new system
and clearly made a difference in their perceived legitimacy among women in the community.
An RA in Nerekoro who had benefited from the structured replication training commented that,
“now that I can show women that I left the village and had a training, they understand that I am
better able to answer their questions when the TA is not here.”
Institutional weaknesses with Malian NGO partners In terms of problem areas, this study also found structured villages in Touminian, all under the
leadership of GRAFE, that seem to have been abandoned by their technical agent and are no
longer functioning according to community members interviewed. In one village, they seem to
fundamentally not understand the system and are not taking out loans. In another, they are not
taking out loans for religious reasons; strong interpretations of Islam have effectively reduced
the program to a tontine and created gender pressures we have not seen anywhere else, given
that men are universally and overwhelmingly supportive of the program and its capacity to

104
reduce household food insecurity, in this phase and in all previous ones. In a third, one group
has been established, but they are waiting around for the agent who never came back before
any of the other women are willing to start anything. This data may well be anomalous;
however, the issue of institutional shortcomings in 3 out of the 8 treatment villages that were
studied in this phase points to a need for increased monitoring in those villages and potentially
others.
Factors contributing to SfC success The following section provides case study examples of factors that contribute to the success of
SfC in two villages, Pona and Bancouma Peul, and analyzes the influence of different village
characteristics on community adoption of the program.
SfC in context: a comparison over time Although Pona is in San and Bancouma Peulh in Touminian, the two villages lie only twenty
miles from each other as the crow flies, and both are treatment villages with organic replication
in the RCT zone. They are relatively isolated communities, and both illustrate well the ways that
the structure of SfC has been challenged by difficult years in 2011 and 2012. Yet the two
diverge tremendously in their success; while SfC has struggled to convince women to
participate at all in Bancouma Peulh, Pona has many thriving SfC groups that have been able to
focus on economic growth as well as fostering social cohesion. An examination of the factors
contributing to these diverging outcomes provides insights at several levels that speak to trends
in the larger sample. Firstly, the cases of Pona and Bancouma Peulh reveal the complex
interaction of cultural and infrastructural factors in creating environments conducive or hostile
to the program's success. Secondly, the study of the two villages over time suggests many of
the same predictive factors of SfC success that BARA finds generally salient.
Pona is a rural community of about 2,000 Muslim Sarakole near the Bani River, and is
dominated by its enormous mosque, which is located at the center of the village and at the
intersection of its three neighborhoods. Agriculture and fishing are the most important
livelihood strategies in the village. Even in good years, the village faces serious challenges: soils
are sandy and poor, and the population has been rapidly rising beyond what the land can
support. Physical isolation on a poorly maintained road compounds the problem, limiting
market access and raising the price of basic commodities; this constituted a serious hardship
even in 2009, and weak rains lowered river levels in 2012 and drove the price of goods even
higher.
Bancouma Peulh also struggles with isolation, but it is to some degree self‐imposed. Although

105
the village of 800 lies just off a major highway and only 4 kilometers from the principal village of
the commune, it has been remarkably unsuccessful in attracting significant levels of support
from NGOs or the local government. This is due in no small part to the current dugutigi, a
strongly independent‐minded individual who tends toward isolationism and distrust of local
support systems. As the name suggests, Bancouma Peulh is culturally dominated by the Muslim
Fulani in a largely Dogon and Christian region, a further cause for entrenchment.
The difficulties shared by Pona and Bancouma Peulh before SfC's introduction highlight a key
finding in the BARA data: factors such as economic and geographic isolation, village‐level
vulnerabilities to shock, and limitations to land tenure do create significant setbacks for SfC, but
are not in themselves strong determinants of program success over the long term. Rather,
across all villages in the BARA sample, the strongest predictor of SfC's success was the support,
motivation and leadership skill of the dugutigi or other relevant village officials. In the
discussion that follows, we demonstrate the importance of three other key factors in predicting
program success: degree of prior experience with savings and credit; women's agency and
decision‐making power; and strength of social networks prior to SfC's arrival. These four
characteristics are also those most consistently identified by technical agents as the most
critical factors that allow SfC to flourish in a given community.
Previous experience with savings, credit and collective work as predictor of SfC success Pona's limited agricultural resources have led to the development of many collective labor
groups, who work within and outside the village for payment. In 2009, before the arrival of SfC,
these institutions for collective labor were highly developed, with eleven groups in the village:
five for women, three for young men, and three for older men. All but one of these
organizations was segregated by neighborhood. Groups for men were divided by age‐stages,
with an expanding set of civic responsibilities in progressively older groups. Both men and
women's groups did collective labor for money in other people's fields, then pooled their
earnings. Some groups allowed emergency consumption loans to be taken from the pooled
money, without interest. Women's groups often used the pooled money for collective annual
festivals, weddings, baptisms and circumcision ceremonies. In addition to these organizations,
there were groups for overseeing the maintenance of the pump and the mosque. The village
had a popular cereal bank that gives loans of grain confidentially, and kafo jiginew operated in
the village as well.
In Bancouma Peulh, on the other hand, the savings and credits systems before SfC were
remarkably unstructured. Credit systems did not have interest on loans, and for both men and
women although membership rates were high, savings systems were primarily focused on

106
simultaneously providing labor when it was crucially needed and on mitigating against
unforeseen shocks through consumption loans in cash or in kind. Groups are segregated by
ethnic group by design for the Fulani and Sarakole, and de facto by the groups of former slave
families and noble families (in the traditional Malian caste system), since wealthier members of
other ethnic groups would not be interested in joining them. Women's groups had so little
structure that they seemed unsustainable: one group had no cap on loan size, no interest on
loans, no time limit on repayment, and its meetings were little more than open and
unorganized discussion. Before SfC's arrival, women were extremely anxious about
incorporating interest into their tontines out of fear of failure (no mention was made of
religious prohibitions). Because women's groups did not grow their funds with interest, and
instead redistributed wealth annually in emergency loans and expenses for celebrations,
several groups continued virtually unchanged over several generations, even as their members
lamented their inability to achieve long‐term goals (e.g. acquiring a mill for grinding millet).
Women's agency as predictor of SfC success One of the more distinctive features of Pona is its household structure. The gwa, or the
ensemble of people in an enlarged household that do agricultural and other work together and
eat food prepared in the same place, is overseen by a single authority, the gwatigi, who has
direct and sole authority over the women of the larger household. In Pona, the gwatigi has the
right to collect and redistribute all of the resources accumulated by the household through
migration or village labor, and has a more or less direct relationship with the women of the
household that limits the power of other men in the household. For example, after harvest, the
gwatigi will give the share of grain directly to the women who cook for each household sub‐
unit, and these women may later help out the larger household during the soudure by
contributing their sub‐unit resources to the communal stocks. Women in Pona are also allotted
their parcels of land for cultivation directly by the gwatigi. Women therefore have a greater
degree of autonomy than is found in many parts of the country, and are not obliged to consult
with their husbands before selling their goods.
Bancouma Peulh, by contrast, is an extremely patriarchal and even gerontocratic society, in
which all political power is held by the imam and men from a few key Fulani households. Most
women have little to no decision‐making power within nuclear or extended households, and
their gendered economies are extremely small compared to most men, who are often strongly
inserted into the cash economy through cattle sale (Fulani) and commerce (Sarakole). Land
tenure issues are particularly difficult for women, because women's land is apportioned to
them by their husbands. This effectively prohibits women from diversifying or expanding their
economic activities, particularly their ability to fully develop off‐season gardening. A lack of
107
integration of the gendered economies has also kept women from access to formal credit, since
they lack capital for collateral and their husbands will not serve as guarantors.
Strength of social and family networks as predictor of SfC success Although Pona does have casted groups, they are well integrated into social life, and the
community is fairly unified in its ethnic and religious composition and its sense of collective and
civic identity. Bancouma Peulh faces a far more splintered population, divided into roughly
equal ethnic neighborhoods of Fulani, their slaves, and Sarakole. These three groups have a
curiously complementary relationship, in which the Fulani control land tenure for both village
compounds and fields, Sarakole have the greatest financial wealth, and the slave group has
available labor for hire. Interethnic marriages are very rare, and the three groups compete
agriculturally even as they cooperate in the distribution of land, labor and wealth, so that
alliances are often uneasy. Casted people, including slaves, are effectively excluded from village
decision‐making.
In 2009, both communities faced serious pressures toward outmigration of young men.
However, one of the consequences of having Pona's gwatigiw manage all expenses of the
larger household is that young men are not responsible for covering the costs of bride‐price and
wedding ceremony, which is elsewhere a major impediment to marriage. This reduces the
considerable pressure on young men to either migrate in search of cash or to marry
exogamously. In Bancouma Peulh, inheritance and political structures are having the opposite
effect, pressing youth into seasonal migration at increasing rates. Fulani control (through the
dugutigi) of all land resources has become increasingly significant, since Bancouma Peulh has
nearly exhausted its available fields. Because all land has been distributed, any increase in
population leads to fragmentation of existing family plots. As more youth are forced into
seasonal migration, the village has an increasing number of nuclear households that act
independently of enlarged households, a phenomenon that was all but unheard of 20 years ago
and is widely seen to index an erosion of social networks.
Three years later: SfC effects in conducive and hostile environments SfC began in both Pona and Bancouma Peulh in 2009. In 2012, Bancouma Peulh had only two
small groups, comprising only 10% of eligible women in the village. The main impediment to the
program has been resistance from the imam, dugutigi, and others, who maintain that loan
interest violates Islamic law; households that do not participate unanimously refer to either the
perceived violation of Islamic law or the fear of social censure as the prime motivation for their
non‐participation. As a result, the first group, trained by the technical agent, no longer applies

108
interest to its loans. Although the second group has kept the system of interest intact (for
income‐generating activities but not consumption loans), pressure from the community has left
the replicating agent who created the group feeling beleaguered and frustrated by the time‐
consuming work. Both groups aspire toward the purchase of a mill, and have managed to
increase their weekly contributions somewhat despite the economic setbacks of the past few
years, but growth of the groups has been slow.
In spite of the disappointingly small number of women participating in SfC in Bancouma Peulh,
households that do have women in the program are unambiguous in their appreciation of its
effects. 70% of loans are devoted to income‐generating activities, although during the rainy
season entrepreneurial activity is necessarily supplanted by agricultural duties and all loans are
for consumption. Individual households reference SfC's timely assistance with consumption
loans to weather the effects of flooding, poor harvests, and the increased price of goods.
Without access to formal credit and with limited social influence, women find that even small,
non‐interest‐bearing loans open up new opportunities for entrepreneurship not previously
available.
Meanwhile, the SfC program is flourishing in Pona. After two groups were formally trained,
replicating agents from the village established four additional groups, and two others were
created by a replicating agent from a neighboring village. In addition, two groups began
spontaneously in imitation of the successful groups after the first shareout. With increasing
grain prices after poor rains, savings in SfC have declined in 2012 in proportion to the rise in
cost of basic goods. SfC adaptations to hardship include the temporary suspension of multiple
shares, reduction of interest rates from 10 to 5 percent, and adjusting the weekly contribution,
which is currently at 250 CFA but was 500 CFA in good years and has dropped as low as 150 CFA
during the soudure. Credit access has had direct and tangible effects on women's enterprises,
and participating households speak of increases in social solidarity, women's financial
autonomy, and preparedness for household shocks. In focus groups and individual interviews,
women in Pona are strikingly focused on reinvestment of profits, and emphasize economic
growth as much as social solidarity in their evaluation of the program's potential.
While SfC has been able to adapt to meet the changing needs of the population, other systems
have been largely abandoned. The women's tontines in Bancouma Peulh and in Pona have
morphed into the various SfC groups, and most of the considerable array of savings and credit
options in Pona have not survived the difficult years. Kafo jiginew and other formal loan
systems, such as Muslim organizations in Pona that provide loans, have fallen into disuse
because their rate of reimbursement was no longer tolerable in leaner years.

109
It is both highly significant and strongly representative of BARA's larger sample that even
marginal benefits to women experienced in a community like Bancouma Peulh are
tremendously appreciated. Understanding the significance of the near‐universal appreciation
for SfC, even in areas where its impacts may be so small as to be statistically insignificant, can
be difficult. On the one hand, it indicates that for those living on the threshold of vulnerability,
even slight improvements are highly meaningful; it is therefore important not to lose sight of
the lived experience of Malian women in interpreting the somewhat muted impacts of SfC
found in this study. But a larger and related question persists: if SfC replaces previous economic
systems, to what degree is the program adding value and addressing real need, rather than
being simply a slightly more competitive choice in a context that is already providing good
options for Oxfam America's target population? The perception of women in Pona is instructive
in this regard: for them, SfC is seen as the only workable system that is flexible enough to
sustain them in times of economic crisis, when most options become untenable, and still allow
them to maximize gains in times of relative plenty.
3. Conclusions
While the ability of SfC to radically transform women’s economic situation is not borne out in
the evidence in the IPA or BARA study, the program has numerous other benefits that have
contributed to its popularity and rapid spread throughout Mali over the past eight years of its
existence. SfC is a program that has clearly improved women’s livelihoods by providing funds
that enable households to cope with the daily crises such as a sick child, a food shortage, or an
adverse turn in economic policies or markets‐‐whose impacts without SfC would be much more
severe. The real strength of SfC is that of a program‐‐that by mobilizing the scant resources
these women themselves have‐‐has helped hundreds of thousands of households in Mali to
become more stable and resilient. It is a program that has meant women are more capable of
feeding and educating their children, and providing them medical care.
We saw far fewer modifications to the structure of SfC in the groups in this phase compared to
the previous one. Again, this may be partially attributable to risk aversion in a difficult political
and economic climate, although it may also be that the degree of modification in our 2009
sample was anomalously high, or that women have learned what works best and have settled
into a more efficient pattern over time. We continue to see women’s freedom to flexibly
modify the program to meet their current economic and social demands as one of SfC’s
greatest strengths rather than a weakness, as some of the Malian implementing partners have
suggested given their tendency to overemphasize the need for program uniformity on the part
of technical agents and SfC group operations. While program uniformity provides more
efficiency in implementing the model, SfC’s built‐in flexibility is one of the features that draws

110
women to participate, allows the program to easily adapt to different situations in Mali and
eslewhere and ensures long‐term sustainability of SfC.
As stated in the 2010 report, we find that SfC is universally appreciated and is occupying a badly
neglected economic niche in nearly every community we have visited: the vast space between
the basic social networks and tontines of the village and the large‐scale, often remote systems
of formal microfinance which are de facto inaccessible to most of Mali’s women and the poor
generally. Although the basic structural deficits (in terms of basic amenities, education, health,
market access and above all water) would have to be met before SfC could be truly
transformative of local economies, it is of tremendous value to those living on the threshold of
vulnerability in smoothing income and insulating them from the worst effects of shocks. If the
sponsors withdrew support in the near future, we would still expect to see significant impacts
from SfC ten years from now, which makes this program truly stand out among development
projects in sub‐Saharan Africa in terms of its potential for long‐term sustainability and self‐
replication.
Finally, it is important to highlight the ways in which women and their communities perceive
the value of the program, which is primarily in terms of women’s social cohesion and the
general civic identity of the village, and only secondarily in terms of financial capacity. We see
no evidence that men resent or feel threatened by women’s economic development, and
although this may be because SfC seldom achieves results that seriously threaten the economic
differences of scale across genders, there is overwhelmingly a sense of cooperation within the
household rather than antagonism. These findings point to a real strength of SfC in terms of the
near‐universal support it has garnered from participants and fellow family and community
members.
111
References
Bureau of Applied Research in Anthropology (2008). Operational Evaluation of Saving for
Change in Mali. Tucson: University of Arizona.
Bureau of Applied Research in Anthropology and Innovations for Poverty Action (2010).
Baseline Study of Saving for Change in the Expansion Zone.
Becker, L. C. (2000). "Garden Money Buys Grain: Food Procurement Patterns in a Malian
Village." Human Ecology 28(2): 219‐250.
Deubel, Tara F. (2012). Women’s Participation and Exclusion in Women’s Saving for Change
Groups in Northwestern Mali.
Mackintosh, M. (1989). Gender, Class and Rural Transition: Agribusiness and the Food Crisis in
Senegal. London, Zed Books.
Turrittin, J. S. (1987). Mali Musow: The Women's Sub‐Culture in a Bambara Village. Toronto,
University of Toronto. Ph. D.: 406.
Ward, C., B. Balliff‐Spanvill, et al. (2004). "Weeding Out Failed Practices: A Case Study of
Community Gardens in Rural Mali." Human Ecology 32(4): 509‐521.
Wooten, S. (2003). "Women, Men, and Market Gardens: Gender Relations and Income
Generation in Rural Mali." Human Organization 62(2): 166‐177.

112
IV. JOINT FINDINGS AND RECOMMENDATIONS
1. Overview of joint findings
Following the presentation of the individual research teams’ results, this joint section provides
an overview of key areas of convergence and minor areas of difference in the findings of the
quantitative RCT (IPA) and qualitative (BARA) segments of the research. By using a mixed‐
methods approach, the research benefited from applying different lenses to similar topics and
comparing results across the two studies in order to best interpret and contextualize the
findings.
The data suggest that effects in key anticipated areas were smaller than Oxfam America/FFH's
model had predicted. In the theory of change that was proposed for the program, for example,
businesses were anticipated to expand within twelve months of intervention. Although the
effects are small, IPA data indicate some marginally significant effects of SfC on women's
enterprise expenses and sales at endline. This may indicate that the timeframe for these
economic effects to materialize will extend beyond the study timeframe, or that anomalously
difficult years curtailed the emergence of anticipated benefits. In fact, both research teams find
it likely that the study's timeframe is too short to capture some of the larger or indirect effects
that SfC may still produce in the zone; there are no or very small significant differences
between treatment and control villages for the Progress out of Poverty Index (PPI), school
enrollment rates, or other indicators of larger structural or community‐level transformation.
However, it is worth emphasizing that economic growth is not the only significant potential
contribution of SfC. Standard microenterprise theory frowns on consumption loans, fearing that
borrowers may lack the means to repay them. However, the capacity of women to move
beyond consumption and risk aversion to income‐generating strategies is severely limited by a
host of structural considerations. Access to SfC may provide access to loans (or savings) that can
be used to expand or create new enterprises; however, it should be noted that many women
have a strong aversion to risk and limited innovation in economic entrepreneurship. SfC loans
also have short repayment terms with interest. Therefore, it is likely that the kinds of enterprise
undertaken by many women in SfC groups do not tend to produce high economic rewards, at
least initially.
Yet the data do not suggest that levels of consumption are strongly affected by SfC either. The
IPA data do not indicate that the intervention has significantly changed the way that
households deal with health expenses, and treatment and control households were equally
likely to sell off household assets or take loans to pay for health expenditures. The rate of

113
serious illness is not different between treatment and control groups. Similarly, treatment
households almost never reported using SfC loans in response to shock. However, there is
convincing evidence that SfC increases households’ ability to smooth consumption and
improves food security. Though increasing household income is certainly an important step in
reducing poverty, improving households’ ability to smooth consumption throughout the year
and improving food security should not be under‐valued. When households face food
shortages, they are often forced to undertake very costly actions to feed the family. Helping
households avoid those crisis periods within the year is valuable for the wellbeing of the entire
household, even if hard to include in a cost‐benefit analysis. These results are further discussed
below.
2. Characteristics of group members and spread of SfC
This section summarizes information on the characteristics of group members and the spread
of the SfC program. One of SfC's principal concerns has always been whether the program
serves the poorest of the poor. IPA comparisons of the members and non‐members in
treatment villages find significant differences between the two populations. Women who
joined SfC were, on average, slightly older than non‐members, and came from households that
were slightly larger and wealthier (as measured by per capita household consumption) than
those of non‐members. These data should be carefully considered, as they do not in themselves
indicate that the program is not reaching the poorest populations. First, these villages are on
average very poor; the women who are taking advantage of SfC are overwhelmingly poor and
generally without real access to other forms of credit, precisely the population Oxfam America
hoped to target with the program. Secondly, the differences in wealth between members and
non‐members are not large in magnitude, although they are statistically significant. Thirdly,
other potential indicators of wealth are not significantly different between those who joined
SfC and those who did not: Members and non‐members did not differ in whether or not they
had savings, in scores on the food‐security indices, or in PPI poverty scores.
Other significant differences IPA identified between members and non‐members in treatment
villages indicate that women who voluntarily adopt SfC are, on average, more likely to be a
leader in the village, more likely to own a business or own livestock, and have a higher average
baseline score on the social integration index, the community action index, and the intra‐
household decision‐making power index. Women who chose to join SfC also were more likely to
have taken out a loan, and members were more involved in tontines (29%) than non‐members
(20%) at baseline. These findings corroborate the strong impressions of technical and
replicating agents found in the BARA data that women who have strong social networks, loan
experience, or tontine experience are best able to see the value of SfC initially and capitalize
upon the program. Qualitative perceptions that non‐members and members are equally

114
unlikely to be educated or literate are also supported in the IPA data.
The differences IPA identifies between adopters and non‐adopters are not necessarily the same
as the differences between early and late adopters (where late adopters are defined as waiting
more than six months from the time of SfC's inception in the village before becoming
members). In the BARA data, early adopters are generally women who are best positioned to
undertake risk and try out new entrepreneurial activity: typically these are slightly older
women, and often first wives from larger households. BARA finds that early adopters often
have economic interests, and capacities to engage in income‐generating activity. These women
may be quite different from late adopters, whose initial misgivings may not be overcome until
the first groups demonstrate success and divide their funds at the end of the savings cycle.
This finding is only weakly supported by the IPA data: late adopters do tend to come from
smaller households and are slightly younger than early adopters, but these differences ‐
although statistically significant ‐ are small. More compelling is the difference between early
and late adopters' scores on the social integration index. Unlike the differences between
members and non‐members, early adopters and late adopters were found to be equally likely
to have savings, to participate in a tontine, to have taken a loan, to have had a business, or to
own livestock. This is a surprising departure from the distinct portraits of early and late
adopters that emerge from BARA focus groups and interviews.
Program adoption: control spillover
Even in BARA's small sample, a few villages that had been designated as control villages had
successfully adopted SfC. This trend is also represented in the larger IPA data set; IPA found
that take‐up of SfC is non‐negligible in the control villages, and may be as high as 12% by the
loose definition of groups that may be considered SfC. This is an extremely encouraging sign for
the program's long‐term sustainability, but we would insert a few caveats in the interpretation.
It is likely that most spillover does not occur spontaneously, but is instead the result of
dedicated and effective village replicating agents. Previous BARA research led us to believe that
when SfC is informally introduced (through extended social networks or market contacts, for
example), the introduction is often insufficient to successfully implant the model in the village
unless the community receives external support from a trained advisor. Control villages that
acquired SfC in the BARA data did so through a similar pathway, first through initial exposure to
the ideas of the program and perhaps failed efforts to incorporate its concepts independently
before integrating the program with formal help. This is not generally because the system is
difficult to master, but because risk aversion in the face of a new and uncertain venture is not
held in check by the reassurance of an outsider with some authority encouraging the groups to
persevere.
115
Structured replication is more effective than organic replication
One highly interesting finding from the IPA data was a significant difference in SfC participation
based on replication type. Villages where replication was structured had significantly more SfC
members, on average, than those with organic replication. Structured replication also led to
larger impacts for outcomes such as savings, food security, livestock holdings and poverty as
captured by the PPI index. The identified difference in uptake between structured and organic
villages is considerable: 40.47% uptake in structured treatment villages as compared to 32.48%
in organic treatment villages. Given the relatively small cost increase in maintaining a program
of structured replication, and the evidence from the qualitative data that organic replication
may produce groups that are perceived as less effective by technical and replicating agents and
group members, we jointly recommend that structured replication be maintained and
strengthened throughout the program area.
In the qualitative data, BARA also found strong signs that organic replication has significant
drawbacks compared with structured replication. Interviews with technical agents, village
replicating agents and group members indicate a pervasive sense that for risk‐averse women,
the perception of a lesser degree of knowledge and authority on the part of village agents
without formal training undermines their ability to support the group as effectively as an agent
with formal training might. Group members are more likely to adopt changes and variations in
SfC structure when formally trained replicating agents suggest modifications. Their perceived
legitimacy in the eyes of participants is greatly increased after receiving their formal training
certificate. In several instances replicating agents without a certificate struggled to establish
trust in creating new groups without the support of a technical agent. Interestingly, neither
technical nor replicating agents feel that the actual (rather than perceived) difference in their
training or capacity is a relevant factor.
Use of loans and share‐outs
From BARA interviews, women report feeling some pressure to employ SfC loans for income‐
generating activities. Therefore, it is not surprising that the IPA data show that women are
more likely to use loans than share‐out funds for micro‐enterprise, since share‐out funds are
not subject to the same pressures as loans made in the groups. It is also important to question
whether women’s reported uses of loans – as reflected in the quantitative data ‐ correspond to
actual uses of loans; BARA found, for example, that many groups tacitly allow women to claim
an income‐generating use for what turns out in practice to be a consumption loan or a loan
channeled to the participant’s husband for his separate activities. IPA attempted to keep
participants from linking data collection activities to the SfC program; the survey section asking
about the use of loans and share‐outs was about all savings groups and not just SfC, however it
116
could still be that women are used to reporting that SfC loans are used for businesses.
IPA found that the annual share‐out is generally spent on food (mostly for consumption),
livestock (as a savings and investment strategy), and some business activities. IPA highlights the
importance of considering fungibility in household resources. Most women report using share‐
outs to buy food rather than to invest in income‐generating activities (IGAs); however, the
distinction between consumption and investment uses of SfC funds is less clear than it seems.
In the absence of SfC, a participant may be forced to sell capital from her IGA or livestock to buy
food. Therefore, having access to funds from SfC to purchase food can positively affect her
business. These findings are consistent with BARA’s findings that SfC is generally being used as a
way of dealing with food security issues more than as a means of income generation. Both
teams have identified the household level benefit of smoothing consumption over time as a
highly valuable contribution of the SfC program.
Significant economic effects of SfC
The impact assessment does find significant differences between treatment and control that
suggest the real potential of the program in terms of the economic aspects. Villages with SfC
experience significant increases in savings, access to credit, and size of available loans. In the
universal support of SfC found in the BARA villages, community members are clear that the
program is providing a highly desired service that was not adequately provided by previous
financial structures. These findings are supported by IPA data, which finds that respondents
from the treatment group are more likely to be members of any type of savings group, are
more likely to have received a loan in the past 12 months, and borrowed significantly greater
amounts from savings groups than did women who took out loans in the control villages.
Women in the sample barely use formal institutions for savings (1% in the control group).
These kinds of effects are encouraging, but are in a way a minimum expectation for SfC, since
they indicate the pressing need for rural access to credit and savings, but by themselves do not
demonstrate that SfC is the best or most viable form. However, there are good reasons to think
that SfC has been particularly successful as a savings strategy. In many savings programs,
adoption simply moves savings from one vehicle to another, but IPA data shows an overall
increase in savings for women in the treatment zone.
Women in the treatment villages were 12% more likely to receive a loan from a savings group,
and 4% less likely to receive a loan from family and friends. This is a major perceived benefit of
SfC, as identified in BARA's qualitative data: the program allows family and friends to provide
financial assistance to each other through a vehicle that does not invite the strong experience
of shame or embarrassment Malians typically feel in borrowing from peers. These kinds of

117
cultural effects are difficult to quantify, but suggest reasons why SfC is particularly well‐suited
to the needs of Malian women.
3. Household Level Impacts
Positive effects on decreasing food insecurity
One of the central hypotheses of the study was that SfC participation augments household food
security, and this is one area in which both quantitative and qualitative data indicate strong
evidence of positive impact. IPA reported that households in intervention areas were 3% less
likely to report that they did not have enough to eat. Additionally, the FFH food insecurity index
dropped by four percentage points in treatment areas, from 51% to 47%. The FFH measure that
assesses the percentage of households that are chronically food insecure also showed a decline
of four percentage points, from 43% to 39%, which is roughly a 10% decline in the fraction of
households who report feeling chronically food insecure. The importance of positive food
security perceptions in their own right may exert influence on household behavior as well, by
potentially influencing the choice of coping strategies associated with food security. BARA
consistently found that households with an SfC participant generally perceived improvements
in food security status during focus group discussion and household interviews.
IPA found compelling evidence of improved consumption smoothing (the ability to cope with
seasonal fluctuations and maintain food consumption at approximately the same level
throughout the year, without having to resort to reducing or skipping meals) in SfC villages
using the high frequency surveys. This suggests that the presence of SfC in the treatment
villages helps households build resilience to cope with seasonal food shortages to a greater
degree than in control villages. This also suggests that the perceptions of improved food
security captured by the FFH food insecurity index and by BARA’s focus group discussions and
interviews may well reflect actual changes in food security.
IPA data indicates that households in treatment villages experience a smaller decline in
consumption in the soudure, or lean period of the agricultural year. Encouragingly, these
apparent impacts of SfC on food security and consumption smoothing are particularly strong
for households of relatively low status. Vulnerable sub‐units of the larger household, such as
young women married to men in lower positions of authority within the household, may be
particularly well‐served by SfC as a mechanism for consumption smoothing during the soudure,
a period when the stocked grains of the collective household have often been depleted and
sub‐units are expected to survive until harvest by drawing from their individual stores. This
promising finding both suggests that SfC is having significant impacts for the vulnerable
individuals it was designed to target, and points to the necessity of recognizing the

118
heterogeneous nature of households with regard to women’s individual status, access to
resources, and decision‐making power.
Interpreting social capital
Change in social capital resulting from SfC participation is perhaps the most striking area of
research in which findings differed between the quantitative and qualitative teams. Both teams
began with a working hypothesis that social capital increases through program participation as
a result of the solidarity of group members.
IPA’s data did not demonstrate a significant statistical impact of SfC on indicators of social
capital. IPA reported no significant differences between treatment and control respondents
along various measures of social capital, which included a series of questions on engagement in
the community, such as speaking to the village chief or councilor, participating in village
meetings, or voting, as well as a battery of questions on social networks, such as asking others
for help, being willing to help others, going to the market with other women, etc. According to
these data, there were no significant changes in social capital along the specific dimensions
measured.
In contrast to these measures, BARA’s findings consistently demonstrated that participants
perceive an increase in social capital in terms of village‐level solidarity and contact with other
women. Women often cite the effects of increased social solidarity as the most salient benefits
of program participation, such as the initiation of collective business enterprises and greater
visibility of women in the associative life of the community. BARA’s data from the 2009 and
2012 study phases indicated that women participants in SfC continue to mention the perceived
increase in social solidarity among women as the program’s most important benefit to women
at the village level. This perception is consistent with feedback received by Oxfam America's
technical unit that for most women, social cohesion is the most important aspect of the
program, even more so than the access to credit or entrepreneurial development that are the
nominal purpose of the groups.
Village‐level characteristics may also be important for SfC’s ability to reinforce and deepen
existing social relationships. BARA finds that communities that experience ethnic and religious
homogeneity, as well as cohesive and strong leadership, tend to see a smaller gap in wealth
between the richest and poorest families. These communities are also the BARA villages that
have thriving SfC groups, in which women rely the most on each other for emergencies. In
contrast, villages with larger gaps between the relatively wealthy and the relatively poor may
have extremely poor households within them (especially female‐headed households with a
small productive labor force), with far less social or economic capital to draw upon than an

119
equivalent household in a smaller and more cohesive community. In addition, BARA data
suggests that small villages with very strong interpersonal bonds seem to do extremely well in
adopting the SfC program; strong initial social bonds are a good predictor of group success,
perhaps more than indicators one might expect, such as apparent market potential. It should
be noted that this impression is not borne out well by IPA’s evidence that village size is not
generally correlated with program uptake or success of groups. The relationship between
program success and initial levels of social capital does not necessarily suggest that SfC is
merely capitalizing on previously established high levels of social cohesion, but rather that the
program's potential, including its capacity to strengthen social bonds, is best actualized in such
contexts.
The interpretation of the disparities in findings between the teams on the topic of social capital
is a lingering question in the overall research that warrants further analysis and additional
research. It is quite possible that both findings are equally valid. While changes in social capital
may not – or not yet – have led to tangible differences in socio‐economic behavior, women’s
perception of increased social capital and expanded social networks with women in the
community and in surrounding communities is an important feature of the program that
participants highlighted in all of the villages in the qualitative sample. In this context, BARA
would argue that perceptions of participants matter a great deal and can exert a positive
influence on household economic decision‐making either in the present or in the future. One
way forward is to conduct more research on what Malian women specifically mean when they
refer to ‘solidarity’. Solidarity, or benkadi, is a widespread term used in Mali (and by far the
most common name chosen by savings groups), and it is clearly a highly valued quality. Further
work on how to measure the specific elements of ‘solidarity’ and divide them into those
components that may factor into household decision‐making and those that are of value in
their own right would be useful, and might help to explain the puzzling disparity that exists
between the IPA and BARA findings.
Indicators such as the density of social networks and the role of women in the community are
especially difficult to fully capture with survey instruments. BARA finds the strongest qualitative
indications of impact not in the formation of new relationships, but in the strengthening of pre‐
existing ones. It is therefore surprising that questions in the IPA survey about individuals with
whom women would give or take loans did not yield evidence of impacts for women with pre‐
existing relationships either. For future studies, our recommendation would be that qualitative
and quantitative teams do more extensive joint research to determine the survey measures of
social capital best suited to capture some of the benefits that are difficult to measure from a
quantitative perspective.
BARA findings further emphasized that while Malian households are accustomed to periodic

120
shocks, the past few years were anomalously difficult in political and economic terms, as
discussed further below, and that this may provide some insights into the limited increases in
social capital that have been quantitatively captured by IPA at the endline.
Intra‐household decision‐making
IPA’s data did not indicate any significant statistical impact of SfC on indicators of intra‐
household decision‐making. BARA data again point to a disparity between experienced and
perceived decision‐making power within households, however, since women and their
husbands consistently indicate that their participation in SfC has led to an increased role and
voice in household decisions. Not only is this consistent with the qualitative information from
previous years, the trend has, if anything, intensified in the 2012 data.
Perceptions of decision‐making power must be understood within the complex context of
household structures. For example, in extended patriarchal household structures, the relative
power of a young daughter‐in‐law to be heard in the decisions of the larger household is
limited, whereas a post‐menopausal mother‐in‐law with many daughters‐in‐law in the
household may exert considerable influence. BARA data on perceptions of intra‐household
decision‐making largely focus on decisions made within the nuclear family, since in most
villages the relationship between a woman and her husband (and possibly other co‐wives) is
most critical to her capacity to advocate for her own interests and those of her children.
Even in contexts of relatively strong influence, the decision‐making power of Malian women is
highly constrained. Women seldom have secure rights to inheritance of household goods, and
they are generally seen as the provisional custodians of their land, assets, and even children,
which are all fundamentally the property of their husbands' families. It is therefore unsurprising
that previous studies have found that women's decision‐making influence in Malian households
does not necessarily improve with an increase in women's share of economic activity. In fact,
the transition of Malian women into the cash economy has generally increased the burden of
female labor without a concomitant increase in their political power at the village or household
level (Becker 2000; Ward et al. 2004; Wooten 2003; Mackintosh 1989). The apparent increase
in women's (perceived) decision‐making power over the past year may be more likely due to
men's migration after insufficient agricultural yields, which leaves women with a more
leadership‐oriented role in the household.
BARA's 2012 phase confirmed that men remain largely supportive of SfC and do not view the
program as a threat. Men consistently reported viewing women’s participation in SfC as a
means to relieve them of their economic burden; this in spite of evidence from IPA that
121
women's contribution to household income as a result of SfC is minimal. Men describe
household relationships in terms of the gendered economy; if women are better able to
provide the "petit plat" resources as a result of participation in SfC, men can focus on the duties
of managing the larger household economy. Despite this presentation of separate but
complementary economies, the qualitative data provides considerable evidence that many
household decisions are made collaboratively between husbands and wives in most cases. As
discussed elsewhere, for example, many SfC groups quietly allow husbands to take loans
through their wives during the soudure, but there is very little evidence of coercion or abuse in
this system. Seen in this light, IPA's intriguing finding that SfC produces significant increases in
the livestock holdings of the nuclear family of participants, but not in the holdings of the
women themselves, may be further evidence of collaborative decision‐making within the
nuclear family rather than of patriarchal abuse.
Interpreting significance of livestock
A question arose in analyzing the data as to why livestock so often appear as an optimal asset.
The IPA data point to some intriguing factors with regard to livestock. This relates to our earlier
surprise that in moments of shock, few households are turning to loans: instead, 20% of
households in the control villages are selling livestock and 30% are selling off other assets. A
most interesting point from the IPA data regarding livestock is that strong effects are seen on
the livestock holdings of the small (subunit) family, but not at the level of the individual women
‐ who are household members eligible to participate in SfC. Our impression from discussions
about intra‐household dynamics is that this is a sign of household cooperation, either in mutual
decision‐making, or in that the husband has the capacity to invest in livestock because he is
spending less of his disposable income supporting his wife. However, we must also recognize
the possibility of male capture of loan or share‐out funds as a potential abuse of the system
that necessitates further research.
The most striking difference between wealthy and poor households in BARA’s observations was
their capacity to engage in animal husbandry. For the vast majority of households, the ability to
raise animals is considered the optimal saving strategy‐‐well before financial savings and credit
systems. This is also true for villages that participate more intensively in the cash economy.
Animals are viewed as savings banks, since the livestock represent significant capital that can be
easily and quickly converted into money or food in times of need, and in case of sudden
expenditures for illness, weddings, deaths, and other ceremonies. Even very poor households
try to keep a few animals to guard against food shortages. For such households, the loss of even
a few animals has catastrophic consequences and usually pushes the family into food
insecurity. Animal husbandry is a risky enterprise, especially for households that cannot afford,
or do not have access to, veterinary care and vaccinations, or that do not have access to

122
enough pasture to feed their animals. Epidemics that ravage livestock are common and many
families lose significant numbers of animals—poultry in particular.
Interpreting the effects on migration
IPA found that migration declined as a result of introducing SfC into the treatment villages. This
was measured in two dimensions: first, households report using migration less often in
response to shocks. Second, fewer women reported migrating for work. Previous BARA work
has suggested that migration is an important mechanism by which households smooth risk; it
provides diversification into the cash economy and the non‐local economy, and often extends
social relationships into larger networks. But migration is also a complex strategy that might be
better disaggregated into multiple categories, some far less optimal than others. Wealthy
households that can place a son in Cote d'Ivoire or in a trading position in Bamako, with
dependable remittances, are not really in the same category as the bulk of households that
have family members obliged to work as day laborers for part of the year. It is worth
considering what the effects of SfC's "sedentarization" are on each kind of household rather
than considering migration as a unitary phenomenon.
SfC by its nature may reduce women’s ability to migrate if they want to participate in the
groups, as it is hard for women who regularly migrate to make their weekly contributions and
have the trust of fellow women to be allowed to be members of a SfC group. Therefore it is
possible that SfC, while introducing a new way of dealing with risk, may also limit the ability of
households to use another important risk coping strategy – migration. The results on food
insecurity and consumption smoothing indicate that the net effect of SfC seems to be positive,
and one possible interpretation of IPA’s finding is that women no longer need to migrate as
much, although at this point it is unlikely that SfC’s economic contributions are significant
enough to strongly effect the need for migration. However, this is an important factor that
Oxfam America may want to consider, as there may be creative solutions to create flexibility in
the SfC methodology that would mitigate this negative effect on migration.
4. Potential effects of political and economic crises on the program
Although both IPA and BARA data indicate that SfC does produce important benefits for poor
Malian households, there are good reasons to believe that some of the effects of SfC have been
seriously attenuated by an anomalously difficult year in Mali, both economically and politically,
as the endpoint of a longitudinal study. The Tuareg rebellion and subsequent takeover of the
north of the country by Islamist secessionists, the coup d’état and general political uncertainty
in the south, and the threat of economic sanctions or external military interventions for much
of 2012 have undoubtedly influenced household decision‐making and entrepreneurial activity

123
even in rural and relatively isolated communities. The perception of risk and uncertainty has
been reinforced by real economic hardship: rising commodity prices, natural disasters and poor
harvest yields, loss of NGO support as international organizations have withdrawn from Mali,
and reduced migration and remittance possibilities.
Across the RCT expansion zone, poor environmental conditions and the poor harvest from 2011
have had serious and, in some villages, devastating impacts on food security and household
vulnerability. Among the villages in the BARA study, most have experienced flooding, drought,
or both since SfC was introduced in 2009. Households that raise animals also reported high
rates of livestock disease outbreak across the region. In the BARA sample the majority of
interviewed households experienced at least one shock in the last year that had adverse
economic consequences for the household. IPA finds similar evidence of an exceptionally poor
year; 69% of households (in both treatment and control) experienced a significant shock in the
last year of data collection, as compared with 42% at the baseline. Both IPA and BARA found
particularly bad shocks due to reduction in harvest (due to natural disaster) or to illness of
either animals or a member of the nuclear family. Comparing baseline to endline, IPA found
that the fraction of households confronted with drought increased from 24% to 71%, and from
21% to 31% for animal losses. The high frequency surveys also show a steady downward decline
in food consumption over the study time period.
The effects of political unrest on social capital emerge most clearly from the qualitative data.
Malian households are accustomed to periodic shocks, but the past few years have clearly been
anomalously difficult in political and economic terms, and it is difficult to imagine a program
that could effectively mitigate the effects on all capital, social and other, produced by that
degree of suffering. This may provide some insights into the limited increases in social capital
that have been quantitatively measured in the IPA study. Very difficult years and a high degree
of economic uncertainty have made for a climate of general mistrust; for much of the last year
of the study, people were afraid to go out on the roads or connect with their extended families,
particularly those in the contested northern regions of Mali. Despite these limitations, it is
important to point out that BARA data reveal that women and men in SfC villages maintained a
highly positive view of the program and its contributions to solidarity over the entire project
timeframe.
BARA also finds some indication of local effects of the economic and political crises Mali has
experienced in the past two years. In the BARA sample, the ability to realize the possibilities of
economic growth has been potentially undercut, since many villages have had such bad years
that much of SfC’s capacity for income generation has been lost to emergency consumption.
BARA interview data indicate that most women approach SfC from a highly risk‐averse

124
perspective, and may require years of demonstrated returns before they are willing to modify
the system toward greater potential for income generation. This means that the very
perception of risk can powerfully influence SfC’s economic impact, and the political tumult and
poor harvests have certainly shaped those perceptions. Indeed, BARA observes a consistent
constriction of the program in its final year, with groups either reducing the weekly
contribution, shifting loan use toward consumption, or abandoning the program altogether.
SfC is not, and has never been intended as, a vehicle for reversing poverty in the absence of
governance. Microfinance is often characterized as a tool for the poor to lift themselves out of
poverty through their own initiative and effort. However, without fundamental support from
the state (i.e., basic transportation and health infrastructure, access to drinking water, and
viable markets), the capacity of any microcredit program to respond to basic need is severely
attenuated. The important but non‐transformative effects of SfC found in this study must be
interpreted in light of these fundamental constraints.
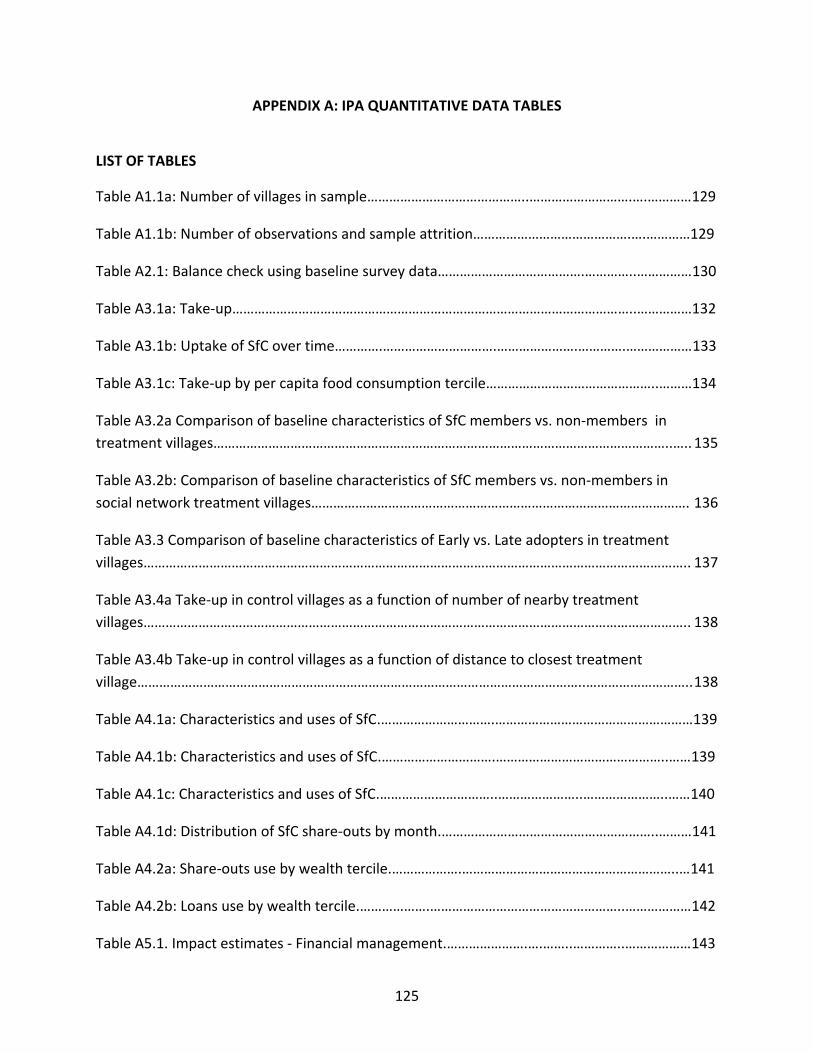
125
APPENDIX A: IPA QUANTITATIVE DATA TABLES
LIST OF TABLES
Table A1.1a: Number of villages in sample……………………………………..……………………….….…………129
Table A1.1b: Number of observations and sample attrition…………………………………….….…………129
Table A2.1: Balance check using baseline survey data………………………………….…………..……………130
Table A3.1a: Take‐up ………………………………………………………………………………………………..……………132
Table A3.1b: Uptake of SfC over time………….………………………….………………….………….………………133
Table A3.1c: Take‐up by per capita food consumption tercile………………………………………..………134
Table A3.2a Comparison of baseline characteristics of SfC members vs. non‐members in
treatment villages……………………………………………………………………………………………………………..…..135
Table A3.2b: Comparison of baseline characteristics of SfC members vs. non‐members in
social network treatment villages…………………………………………………………………………………………. 136
Table A3.3 Comparison of baseline characteristics of Early vs. Late adopters in treatment
villages………………………………………………………………………………………………………………………………….. 137
Table A3.4a Take‐up in control villages as a function of number of nearby treatment
villages………………………………………………………………………………………………………………………………….. 138
Table A3.4b Take‐up in control villages as a function of distance to closest treatment
village…………………………………………………………………………………………………………..………………………..138
Table A4.1a: Characteristics and uses of SfC.………………………….………………………………………………139
Table A4.1b: Characteristics and uses of SfC.………………………….………………………………………..……139
Table A4.1c: Characteristics and uses of SfC.…………………………..…………………..…………………..……140
Table A4.1d: Distribution of SfC share‐outs by month.…………………………………………………..………141
Table A4.2a: Share‐outs use by wealth tercile.……………….…………………………………………………..…141
Table A4.2b: Loans use by wealth tercile.……………….……………………………………………..………………142
Table A5.1. Impact estimates ‐ Financial management.………………….….……..…………..………………143

126
Table A5.2. Impact estimates ‐ Health, shocks and food security………………………………………..…145
Table A5.3. Impact estimates ‐ Malaria…...………………….………….……….………….……….....……………147
Table A5.4. Impact estimates ‐ Investment.………………….……………………………………………..…..……148
Table A5.5. Impact estimates ‐ Empowerment and social capital.………………..…..…………..………152
Table A5.6. Impact estimates ‐ Consumption and Poverty.……………………………………………………154
Table A5.7 Sample information (high‐frequency sample).………………..……………………………………155
Table A5.8 Health (high‐frequency sample)…………………….……………………………..……..………………155
Table A5.9a Food consumption in lean season (high‐frequency sample)………….….………..………156
Table A5.9b Food consumption variability (high‐frequency sample)………….……….……………….…156
Table A5.10 Business (high‐frequency sample)………….….…………………………………………………….…157
Table A5.11: Heterogeneity of treatment effects according to Type of household …………………158
Table A5.12: Heterogeneity of treatment effects according to Food consumption …..….…….…161
Table A5.13: Heterogeneity of treatment effects according to Ethnicity..………………..………….…164
Table A5.14: Heterogeneity of treatment effects according to Type of replication ..…..……….…167
Table A6.1: Cost‐benefit ratios under different scenarios………………………………………..………….…169

127
Figure 14: Density of distance to closest treatment village
0
0.05
0.1
0.15
0.2
0.25
0.0 0.3 1.2 2.0 2.9 3.8 4.6 5.5 6.3 7.2 8.1 8.9 9.8
Distance to closest treatment village (km)
Density

128
Figure 15: Theory of change
Make lump‐
sum investments
Pay for
school supplies &
fees
More financial
choices for household
Less stress in the household from worrying about
current and future crises
Help with saving
regularly
FORM SAVING FOR
CHANGE GROUPS
Experience speaking in groups and/or running an
organization
Group solidarity
Draft Theory of Change for Saving for Change
Better
education for children
Empowerment of
women within their families
Deal with
medical shocks
Access to loans
Village‐wide projects
(development, lobbying, collective
business)
Start new
women’s businesses
Deal with
agricultural shocks
Return is good
Save more
Support from fellow
group members in
crises (“insurance”)
Increased
women’s income
Better long‐
term planning by families
More control
over financial resources by women
Increased
Self‐confidence
Better
health
Fewer
forced sales of assets
Savings payout
Buy
food
Greater food
security Expand
existing women’s businesses
Empowerment of
women within their community
More livestock
& assets owned by women
LEGENDRed = first 1‐3 months in group and laterOrange = 3‐6 months and laterYellow = 6‐12 months and later
Green = 1‐3 years and laterBlue = 3‐5 years and later
Purple = 5‐10 years and later

129
Guide to read tables
1. Asterisks (*) are used to indicate the level of statistical significance in all tables. A p‐value less than .10 will
be denoted with one asterisk (*); a p‐value less than .05 will be denoted with two asterisks (**); and a p‐
value less than .01 will be denoted with three asterisks (***).
2. For all binary variables, “1” indicates that the respondent replied “yes” and “0” indicates “no”.
Table A1.1a: Number of villages in sample
Control villages
Treatment villages Total
Overall Structured Organic
Total 291 209 105 104 500
Segou 14 10 5 5 24
Bla 90 62 31 31 152
San 69 51 26 25 120
Tominian 118 86 43 43 204
Table A1.1b: Number of observations and sample attrition
Nb. of villages Nb. of households Nb. of primary women
Observations
Baseline 500 5 954 5 993
Resurveyed at endline 500 5 602 5 094
Endline 500 5 602 5 462
Attrition
Control villages 0% 5.91% 14.92%
Treatment villages 0% 6.56% 15.11%
p‐value p‐value
Attrition test
Treatment 0.07 0.92
Treatment * baseline characteristics 0.48 0.43

130
Table A2.1: Balance check using baseline survey data
Pooled
Mean Control Group
Difference Control‐Treatment
Obs.
A. Financial management
Female primary respondent
Member of a tontine (0/1)1 0.22 0.01 5 956
Total Savings Amount ($) 7.78 ‐0.30 5 952
Received a loan (12 mths, 0/1) 0.35 ‐0.01 5 938
Gave a loan (12 mths, 0/1) 0.29 0.01 5 940
Net savings ($) 9.02 ‐1.17 5 960
Female adults (20‐65)
Received a transfer (12 mths, 0/1) 0.22 0.00 21 225
Gave a transfer (12 mths, 0/1) 0.17 0.00 21 225
B. Shocks and food security
Household
Health expenditures ‐ past 30 days ($) 5.36 ‐0.59 * 5 937
Resorted to costly strategy to cope with shock (0/1) 0.18 ‐0.01 5 930
Household experienced shock with big impact (0/1) 0.42 ‐0.02 5 928
Female primary respondent
FFH food insecurity index (0/1) 0.40 ‐0.01 5 953
C. Malaria
Female primary respondent
Mentioned only mosquitoes as cause of malaria (0/1) 0.18 0.00 5 973
All members
Children slept under bednet (<= 5 years, 0/1) 0.50 0.02 9 241
Female primary respondent (pregnan in two last years)
Took drugs against malaria (0/1) 0.75 0.03 3 204
D. Investment
Female adults (20‐65)
Has business (0/1) 0.41 0.01 8 193
Engaged in paid labor (0/1) 0.05 0.00 8 193
Household
Total input expenses for agriculture ($) 27.13 ‐3.20 5 952
Value of agriculture output ($) 245.31 ‐3.57 5 951
Total value of livestock ($) 761.71 11.40 5 952
Educational expenses per capita ($) 2.14 ‐0.01 5 948
Index of assets per capita (ext. hh) 0.00 ‐0.01 5 925
Housing index 0.00 0.00 5 950

131
Pooled
Mean Control Group
Difference Control‐Treatment
Obs.
All members
Primary school enrollment (girls, 0/1) 0.45 ‐0.01 4 078
Primary school enrollment (boys, 0/1) 0.54 0.01 4 026
E. Empowerment and social capital
Female primary respondent
Index of intra‐household decision making power 0.00 0.06 * 5 972
Index of community action 0.00 0.01 5 962
Social integration index (0‐1) 0.00 0.02 5 952
E. Consumption and Poverty
Household
Consumption per adult equivalent ‐ total ($) 2.72 0.06 5 918
Female adults (20‐65)
Frequent expenses ($ per month) 2.13 ‐0.05 8 180
Household
PPI Score (0‐100) 22.38 ‐0.10 5 948
PPI: National Food poverty line 0.89 0.00 5 948
PPI: $1.25/Day Poverty Line 0.81 0.00 5 948
PPI: $2.50/Day Poverty Line 0.98 0.00 5 948
F. Village Characteristics
Village population 1 019.83 ‐8.48 483
Distance to closest tarmac road (km) 22.55 1.85 491
Distance to closest market (km) 7.87 0.27 461
Presence of a primary school (0/1) 0.71 0.00 494
Presence of a health center (0/1) 0.21 ‐0.03 498
Access to protected water source (0/1)2 0.67 ‐0.02 491
p‐value
F‐test for orthogonality of treatment assignment 0.80
1 This can be interpreted as follows: on average, 22% of the respondents in the control group and 23% of the respondents in the treatment group were members of a tontine. 2 Protected water source corresponds to tap, protected well, public forage, protected bore hole
and public water tower.

132
Table A3.1a: Take‐up
Control villages
Treatment villages
All Structured Organic
Member of SfC (0/1)1 12.04% 36.53% 40.47% 32.48%
Member of SfC ‐ more strictly defined (0/1)2 6.27% 29.65% 33.56% 25.73%
1 "Tekereni/Applause Group". 2 "Tekereni/Applause Group" that has regular meetings and received training.
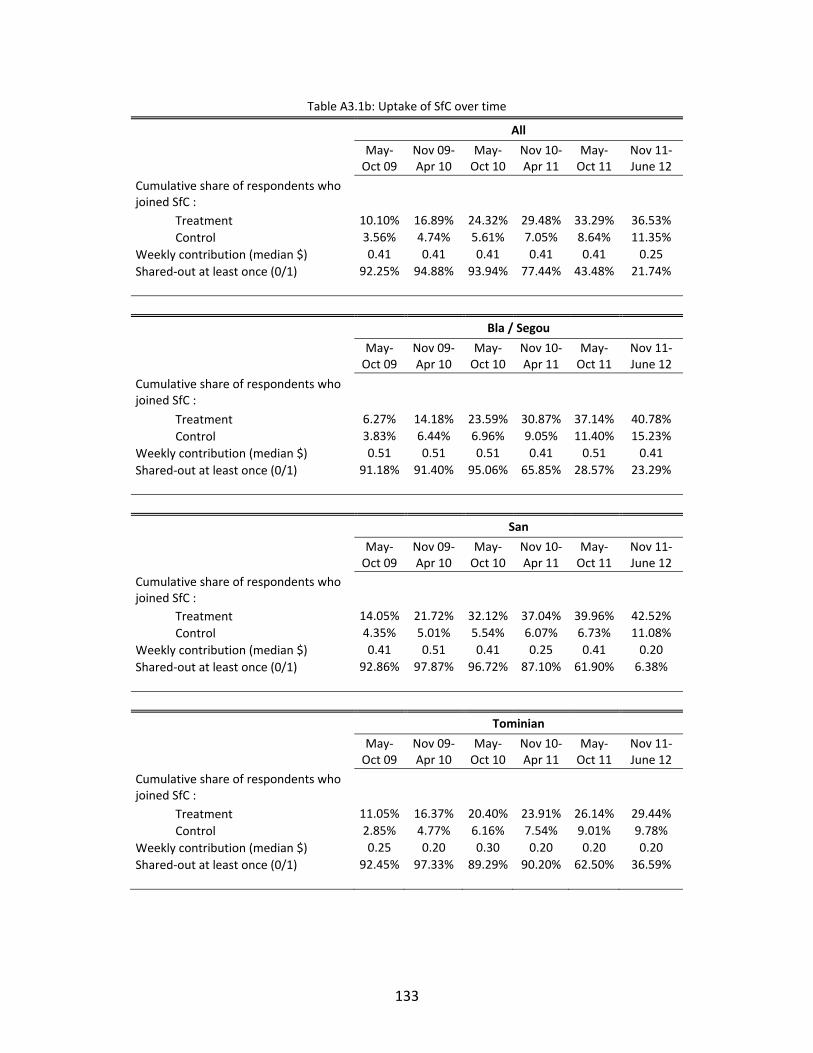
133
Table A3.1b: Uptake of SfC over time
All
May‐Oct 09
Nov 09‐Apr 10
May‐Oct 10
Nov 10‐Apr 11
May‐Oct 11
Nov 11‐June 12
Cumulative share of respondents who joined SfC :
Treatment 10.10% 16.89% 24.32% 29.48% 33.29% 36.53%
Control 3.56% 4.74% 5.61% 7.05% 8.64% 11.35%
Weekly contribution (median $) 0.41 0.41 0.41 0.41 0.41 0.25
Shared‐out at least once (0/1) 92.25% 94.88% 93.94% 77.44% 43.48% 21.74%
Bla / Segou
May‐Oct 09
Nov 09‐Apr 10
May‐Oct 10
Nov 10‐Apr 11
May‐Oct 11
Nov 11‐June 12
Cumulative share of respondents who joined SfC :
Treatment 6.27% 14.18% 23.59% 30.87% 37.14% 40.78%
Control 3.83% 6.44% 6.96% 9.05% 11.40% 15.23%
Weekly contribution (median $) 0.51 0.51 0.51 0.41 0.51 0.41
Shared‐out at least once (0/1) 91.18% 91.40% 95.06% 65.85% 28.57% 23.29%
San
May‐Oct 09
Nov 09‐Apr 10
May‐Oct 10
Nov 10‐Apr 11
May‐Oct 11
Nov 11‐June 12
Cumulative share of respondents who joined SfC :
Treatment 14.05% 21.72% 32.12% 37.04% 39.96% 42.52%
Control 4.35% 5.01% 5.54% 6.07% 6.73% 11.08%
Weekly contribution (median $) 0.41 0.51 0.41 0.25 0.41 0.20
Shared‐out at least once (0/1) 92.86% 97.87% 96.72% 87.10% 61.90% 6.38%
Tominian
May‐Oct 09
Nov 09‐Apr 10
May‐Oct 10
Nov 10‐Apr 11
May‐Oct 11
Nov 11‐June 12
Cumulative share of respondents who joined SfC :
Treatment 11.05% 16.37% 20.40% 23.91% 26.14% 29.44%
Control 2.85% 4.77% 6.16% 7.54% 9.01% 9.78%
Weekly contribution (median $) 0.25 0.20 0.30 0.20 0.20 0.20
Shared‐out at least once (0/1) 92.45% 97.33% 89.29% 90.20% 62.50% 36.59%

134
Table A3.1c: Take‐up by per capita food consumption tercile
Bottom 33%
Between 33% and 66%
Upper 66%
Member of SfC (0/1)1 32.52% 37.89% 42.42%
Member of SfC ‐ more strictly defined (0/1)2
26.39% 32.55% 34.63%
1 "Tekereni/Applause Group". 2 "Tekereni/Applause Group" that has regular meetings and received
training.
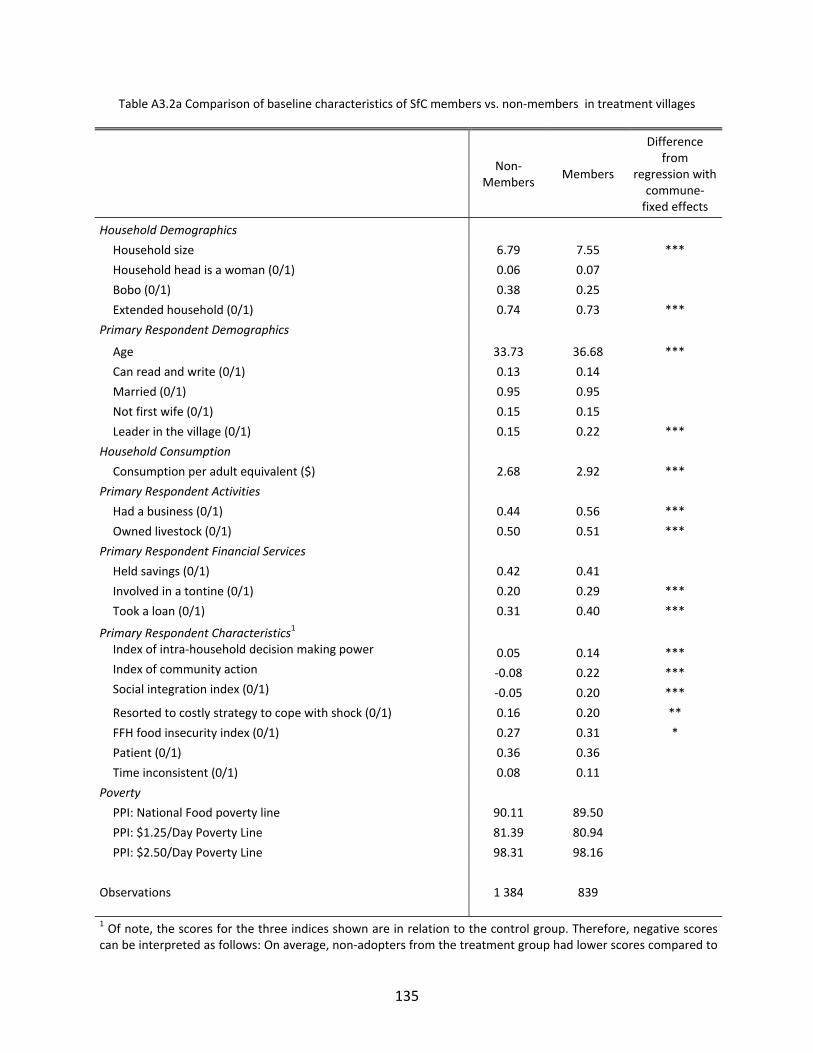
135
Table A3.2a Comparison of baseline characteristics of SfC members vs. non‐members in treatment villages
Non‐Members
Members
Difference from
regression with commune‐fixed effects
Household Demographics
Household size 6.79 7.55 ***
Household head is a woman (0/1) 0.06 0.07
Bobo (0/1) 0.38 0.25
Extended household (0/1) 0.74 0.73 ***
Primary Respondent Demographics
Age 33.73 36.68 ***
Can read and write (0/1) 0.13 0.14
Married (0/1) 0.95 0.95
Not first wife (0/1) 0.15 0.15
Leader in the village (0/1) 0.15 0.22 ***
Household Consumption
Consumption per adult equivalent ($) 2.68 2.92 ***
Primary Respondent Activities
Had a business (0/1) 0.44 0.56 ***
Owned livestock (0/1) 0.50 0.51 ***
Primary Respondent Financial Services
Held savings (0/1) 0.42 0.41
Involved in a tontine (0/1) 0.20 0.29 ***
Took a loan (0/1) 0.31 0.40 ***
Primary Respondent Characteristics1 Index of intra‐household decision making power 0.05 0.14 *** Index of community action ‐0.08 0.22 *** Social integration index (0/1) ‐0.05 0.20 ***
Resorted to costly strategy to cope with shock (0/1) 0.16 0.20 **
FFH food insecurity index (0/1) 0.27 0.31 *
Patient (0/1) 0.36 0.36
Time inconsistent (0/1) 0.08 0.11
Poverty
PPI: National Food poverty line 90.11 89.50
PPI: $1.25/Day Poverty Line 81.39 80.94
PPI: $2.50/Day Poverty Line 98.31 98.16
Observations 1 384 839 1 Of note, the scores for the three indices shown are in relation to the control group. Therefore, negative scores can be interpreted as follows: On average, non‐adopters from the treatment group had lower scores compared to
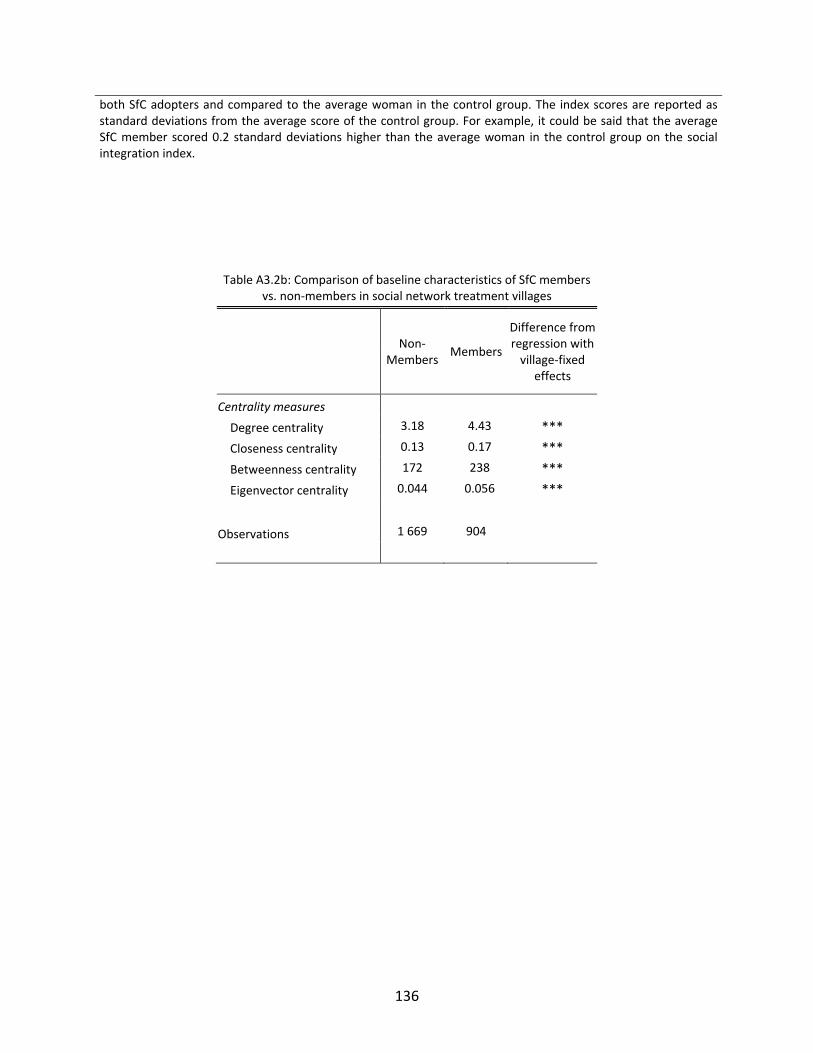
136
both SfC adopters and compared to the average woman in the control group. The index scores are reported as standard deviations from the average score of the control group. For example, it could be said that the average SfC member scored 0.2 standard deviations higher than the average woman in the control group on the social integration index.
Table A3.2b: Comparison of baseline characteristics of SfC members vs. non‐members in social network treatment villages
Non‐Members
Members
Difference from regression with village‐fixed
effects
Centrality measures
Degree centrality 3.18 4.43 ***
Closeness centrality 0.13 0.17 ***
Betweenness centrality 172 238 ***
Eigenvector centrality 0.044 0.056 ***
Observations 1 669 904

137
Table A3.3 Comparison of baseline characteristics of Early vs. Late adopters in treatment villages (Late: women which become members more than 6 months after first group formed in the village)
Early Late
Difference from
regression with
commune‐fixed effects
Household Demographics
Household size 7.78 7.26 **
Household head is a woman (0/1) 0.06 0.06
Bobo (0/1) 0.26 0.21
Extended household (0/1) 0.72 0.73
Primary Respondent Demographics
Age 37.99 36.10 *
Can read and write (0/1) 0.13 0.16
Married (0/1) 0.95 0.94
Not first wife (0/1) 0.17 0.13
Leader in the village (0/1) 0.23 0.21
Household Consumption
Consumption per adult equivalent ($) 2.91 2.96
Primary Respondent Activities
Had a business (0/1) 0.56 0.55
Owned livestock (0/1) 0.52 0.49
Primary Respondent Financial Services
Held savings (0/1) 0.43 0.42
Involved in a tontine (0/1) 0.31 0.29
Took a loan (0/1) 0.39 0.37
Primary Respondent Characteristics Index of intra‐household decision making power 0.09 0.13 Index of community action 0.29 0.11 ** Social integration index (0‐1) 0.33 0.07 * Resorted to costly strategy to cope with shock
(0/1) 0.20 0.19
FFH food insecurity index (0/1) 0.31 0.31
Patient (0/1) 0.34 0.39
Time inconsistent (0/1) 0.11 0.10
Poverty
PPI: National Food poverty line 89.82 89.16
PPI: $1.25/Day Poverty Line 81.18 80.59
PPI: $2.50/Day Poverty Line 98.20 98.03
Observations 237 448

138
Table A3.4a Take‐up in control villages as a function of number of nearby treatment villages
Take‐up
Number of treatment villages within 5 km 0.02
(0.01)
Total number of villages within 5 km (T and C) ‐0.01
(0.01)
Number of treatment villages between 5 and 10 km ‐0.01
(0.01)
Total number of villages between 5 and 10 km (T and C) 0.01
(0.00)
Constant 0.12 ***
(0.04)
Obs. 3187
Table A3.4b Take‐up in control villages as a function of distance to closest treatment village
Take‐up
Closest treatment village between 2 and 5 km (0/1) 0.00
(0.02)
Closest treatment village more than 5 km away (0/1) 0.02
(0.04)
Constant 0.12 ***
(0.02)
Obs. 3187
Note: The omitted category is that the closest treatment village is less than 5km away.

139
Table A4.1a: Characteristics and uses of SfC
Mean Obs.
Savings group participation
Respondent is member of more than one SfC group (0/1) 0.04 854
Respondent is also member in another ASCA (0/1) 0.12 850
Respondent is also member in a tontine (0/1) 0.16 854
SfC Characteristics
Number of months since respondent joined SfC group 23.68 813
Number of members in SfC group 24 815
SfC weekly contributions ($) 0.48 839
Table A4.1b: Characteristics and uses of SfC
Mean Obs.
Share‐outs
Ever received a share‐out (0/1) 0.83 844
Number of share‐outs 1.68 844
Most recent share amount ($) 30.64 685
Share‐out uses (0/1)
Food 0.47 696
Education 0.01 696
Livestock 0.12 696
Agriculture spending 0.06 696
Business 0.23 696
House repairs 0.06 696
Health 0.04 696
Debt 0.05 696
Saving 0.05 696
Transport 0.01 696
Ceremony 0.06 696

140
Table A4.1c: Characteristics and uses of SfC
Mean St. Dev. Obs.
Loans
Received at least one loan from SfC (0/1)* 0.83 0.38 844
Received at least one loan from SfC in last 12 mths (0/1) 0.43 0.50 853
Number of loans (last 12 mths) 0.59 0.83 853
Loan amount ($) 20.39 17.82 368
Interest payment ($) 2.82 7.02 361
Loan uses (0/1)
Food 0.38 0.49 356
Education 0.02 0.13 356
Livestock 0.05 0.22 356
Agriculture spending 0.02 0.15 356
Business 0.42 0.49 356
House repairs 0.05 0.22 356
Health 0.06 0.24 356
Debt 0.02 0.14 356
Saving 0.04 0.19 356
Transport 0.01 0.11 356
Ceremony 0.06 0.25 356
Clothes 0.01 0.12 356
* Since first participation in SfC.

141
Table A4.1d: Distribution of SfC share‐outs by month
% of share‐outs by month
January 8.5
February 8.2
March 8.9
April 9.7
May 18.6
June 16.3
July 5.9
August 4.0
September 3.0
October 5.0
November 3.0
December 9.0
Total 100
Table A4.2a: Share‐outs use by wealth tercile
Breakdown of sample according to food consumption (per capita)
(1)
Bottom 33%
(2)Between 33% and
66% (3)
Upper 66% p‐value
(1) = (2) = (3)
Mean Obs. Mean Obs. Mean Obs.
Share‐out uses (0/1) Food 0.48 185 0.51 242 0.44 262 0.30
Education 0.02 185 0.01 242 0.02 262 0.52
Livestock 0.09 185 0.12 242 0.14 262 0.25
Agriculture spending 0.07 185 0.04 242 0.08 262 0.24
Business 0.24 185 0.22 242 0.23 262 0.90
House repairs 0.08 185 0.07 242 0.06 262 0.74
Health 0.05 185 0.03 242 0.04 262 0.56
Debt 0.05 185 0.03 242 0.06 262 0.17
Saving 0.04 185 0.07 242 0.05 262 0.42
Transport 0.00 185 0.01 242 0.01 262 0.48
Ceremony 0.06 185 0.07 242 0.06 262 0.90

142
Table A4.2b: Loans use by wealth tercile
Breakdown of sample according to food consumption (per capita)
(1)
Bottom 33%
(2)Between 33% and
66% (3)
Upper 66% p‐value
(1) = (2) = (3)
Mean Obs. Mean Obs. Mean Obs.
Loan uses (0/1) Food 0.34 95 0.43 129 0.38 127 0.39
Education 0.03 95 0.02 129 0.01 127 0.40
Livestock 0.05 95 0.02 129 0.07 127 0.20
Agriculture spending 0.01 95 0.02 129 0.03 127 0.59
Business 0.46 95 0.39 129 0.41 127 0.52
House repairs 0.06 95 0.04 129 0.06 127 0.70
Health 0.08 95 0.06 129 0.05 127 0.53
Debt 0.02 95 0.01 129 0.03 127 0.40
Saving 0.05 95 0.03 129 0.03 127 0.64
Transport 0.01 95 0.01 129 0.02 127 0.83
Ceremony 0.03 95 0.05 129 0.09 127 0.14
Clothes 0.02 95 0.02 129 0.01 127 0.71

143
Table A5.1. Impact estimates ‐ Financial management
Treatment Effects
95% ConfidenceInterval
TreatmentEffect
Mean Control
Obs. Lower bound
Upper bound
A. Financial management
Savings environments
Female primary respondent
Member of any savings groups (0/1) 0.05 *** 0.76 5 437 0.02 0.08
(0.02)
Member of a ROSCA (0/1) ‐0.02 0.19 5 437 ‐0.04 0.01
(0.01)
Member of an ASCA (0/1) 0.06 *** 0.68 5 437 0.03 0.10
(0.02)
Member of an ASCA that meets regularly (0/1) 0.19 *** 0.34 5 437 0.15 0.23
(0.02)
Member of SfC (0/1)1 0.25 *** 0.12 5 437 0.22 0.29
(0.02)
Member of SfC ‐ more strictly defined (0/1)2 0.25 *** 0.06 5 437 0.21 0.28
(0.02)
Member of an ASCA not SfC (0/1)1 ‐0.08 *** 0.62 5 424 ‐0.12 ‐0.04
(0.02)
Holds any savings at home (0/1) 0.02 0.40 5 435 ‐0.02 0.05
(0.02)
Holds any savings in formal environment (0/1) 0.00 0.01 5 435 ‐0.01 0.00
(0.00)
Savings amounts
Female primary respondent
Total savings amount ($) 3.65 *** 11.96 5 437 1.07 6.24
(1.32)
Savings amount in ASCAs ($) 3.21 *** 2.31 5 262 1.57 4.86
(0.84)
Savings amount at home ($) 1.50 7.23 5 432 ‐0.31 3.30
(0.92)
Savings amount in formal institutions ($) ‐1.10 ** 1.23 5 435 ‐2.20 0.00
(0.56)
Savings amount in other environments ($) ‐0.22 1.26 5 435 ‐0.82 0.38
(0.31)
Loans received
Female primary respondent
Received a loan (last 12 months, 0/1) 0.03 ** 0.56 5 435 0.00 0.07
(0.02)
Total amount borrowed (last 12 months, $) 1.33 13.42 5 383 ‐1.08 3.74
(1.23)
Loan sources
Took a loan from saving groups (0/1) 0.12 *** 0.10 5 435 0.10 0.15
(0.01)

144
Treatment Effects
95% ConfidenceInterval
TreatmentEffect
Mean Control
Obs. Lower bound
Upper bound
Took a loan from family/friends (0/1) ‐0.04 *** 0.42 5 435 ‐0.08 ‐0.01
(0.02)
Took a loan from formal sources (0/1) 0.00 0.02 5 435 ‐0.01 0.01
(0.00)
Took a loan from other sources (0/1) ‐0.01 0.07 5 435 ‐0.02 0.00
(0.01)
Amount borrowed from saving groups ($) 3.83 *** 2.29 5 436 2.80 4.87
(0.53)
Loans Given
Female primary respondent
Gave a loan (last 12 months, 0/1) ‐0.02 0.42 5 433 ‐0.05 0.01
(0.02)
Total amount given (last 12 months, $) ‐0.03 4.64 5 426 ‐0.93 0.87
(0.46)
Net savings balance ($) 3.83 * 13.33 5 437 ‐0.06 7.72
(1.98)
Transfers received (last 30 days) Female adults (20‐65)
Received a transfer (0/1) 0.01 0.27 8 587 ‐0.01 0.04
(0.01)
Transfert amount ($) 0.06 2.02 8 582 ‐0.30 0.41
(0.18)
Tranfers given (last 30 days) Female adults (20‐65)
Gave a transfer (0/1) ‐0.01 0.31 8 586 ‐0.03 0.02
(0.01)
Transfert amount ($) ‐0.01 1.07 8 583 ‐0.18 0.16 (0.09)
1 "Tekereni/Applause Group". 2 "Tekereni/Applause Group" that has regular meetings and received training.

145
Table A5.2. Impact estimates ‐ Health, shocks and food security
Treatment Effects
95% ConfidenceInterval
TreatmentEffect
MeanControl
Obs. Lower bound
Upper bound
B. Health, shocks and food security
Health (past 30 days)
Household
Financing of health expenses
Sale of assets (0/1) ‐0.01 0.30 5 570 ‐0.03 0.02
(0.01)
Loan from saving groups (0/1) 0.00 0.00 5 570 0.00 0.00
(0.00)
Loan from other sources (0/1) 0.00 0.01 5 570 ‐0.01 0.00
(0.00)
Savings from savings groups (0/1) 0.0008 0.00 5 570 0.00 0.00
(0.00)
Health expenditures ‐ past 30 days ($) 0.21 6.35 5 570 ‐0.53 0.95
(0.38)
Experienced serious illness (0/1) 0.00 0.15 5 547 ‐0.02 0.02
(0.01)
Consulted health center (if sickness, 0/1) 0.00 0.45 4 824 ‐0.03 0.03
(0.02)
Shocks (past 12 months)
Household
Reaction to shocks
Took a loan from a savings group (0/1) 0.01 ** 0.00 5 563 0.00 0.01
(0.00)
Resorted to costly strategy to cope with shock (0/1) ‐0.02 0.33 5 563 ‐0.05 0.01
(0.01)
Livestock selling (0/1) 0.00 0.19 5 563 ‐0.02 0.02
(0.01)
Cereals selling (0/1) 0.00 0.08 5 563 ‐0.01 0.02
(0.01)
Remove children from school (0/1) 0.00 0.00 5 563 0.00 0.00
(0.00)
Consumption reduction (0/1) 0.00 0.03 5 563 ‐0.01 0.01
(0.01)
Migration (0/1) ‐0.02 ** 0.08 5 563 ‐0.03 0.00
(0.01)
Incidence of shocks
Household experienced shock with big impact (0/1) ‐0.03 * 0.69 5 563 ‐0.06 0.00
(0.02)
Business failure (0/1) 0.01 0.02 5 563 0.00 0.01
0.00

146
Treatment Effects
95% ConfidenceInterval
TreatmentEffect
MeanControl
Obs. Lower bound
Upper bound
Food Security (last 12 months)
Household
Not enough to eat (0/1) ‐0.03 * 0.40 5 425 ‐0.06 0.00
(0.02)
FFH food insecurity index (0/1) ‐0.04 ** 0.51 5 428 ‐0.07 ‐0.01
(0.02)
FFH chronically food insecurity index (0/1) ‐0.04 ** 0.43 5 428 ‐0.07 ‐0.01 (0.02)
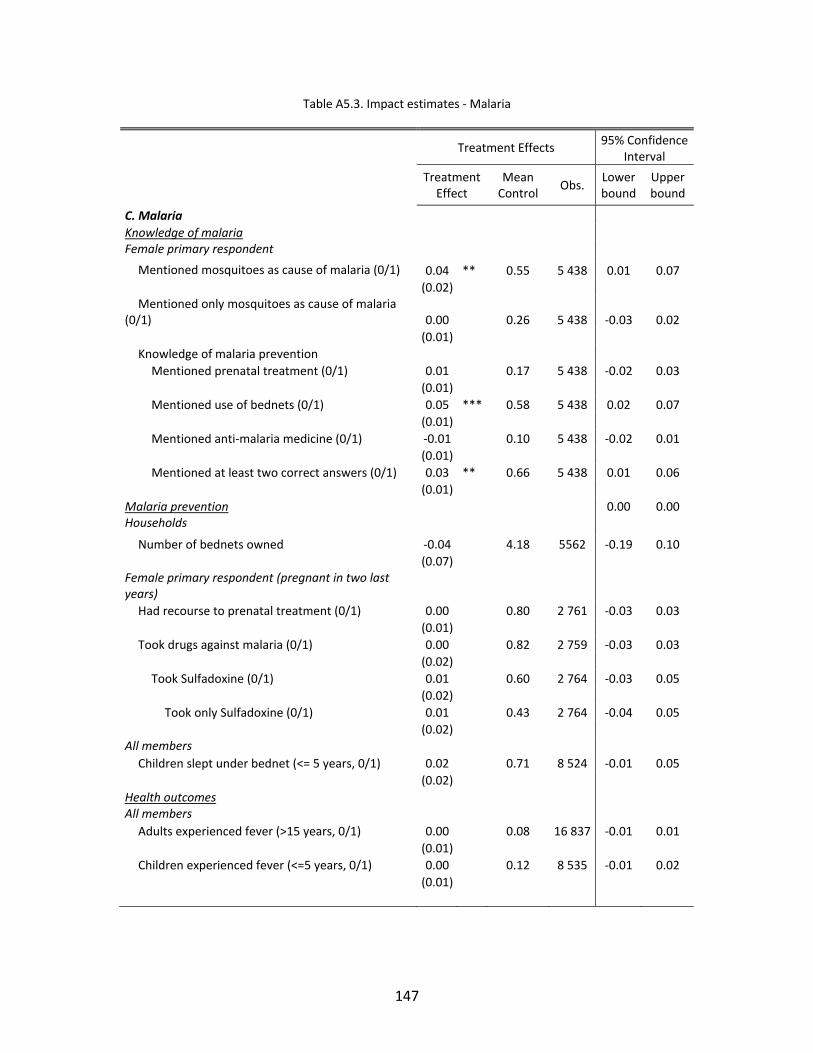
147
Table A5.3. Impact estimates ‐ Malaria
Treatment Effects
95% ConfidenceInterval
TreatmentEffect
Mean Control
Obs. Lower bound
Upper bound
C. Malaria
Knowledge of malaria Female primary respondent Mentioned mosquitoes as cause of malaria (0/1) 0.04 ** 0.55 5 438 0.01 0.07
(0.02) Mentioned only mosquitoes as cause of malaria
(0/1) 0.00 0.26 5 438 ‐0.03 0.02
(0.01)
Knowledge of malaria prevention
Mentioned prenatal treatment (0/1) 0.01 0.17 5 438 ‐0.02 0.03
(0.01)
Mentioned use of bednets (0/1) 0.05 *** 0.58 5 438 0.02 0.07
(0.01)
Mentioned anti‐malaria medicine (0/1) ‐0.01 0.10 5 438 ‐0.02 0.01
(0.01)
Mentioned at least two correct answers (0/1) 0.03 ** 0.66 5 438 0.01 0.06
(0.01)
Malaria prevention 0.00 0.00 Households
Number of bednets owned ‐0.04 4.18 5562 ‐0.19 0.10
(0.07) Female primary respondent (pregnant in two last years)
Had recourse to prenatal treatment (0/1) 0.00 0.80 2 761 ‐0.03 0.03
(0.01)
Took drugs against malaria (0/1) 0.00 0.82 2 759 ‐0.03 0.03
(0.02)
Took Sulfadoxine (0/1) 0.01 0.60 2 764 ‐0.03 0.05
(0.02)
Took only Sulfadoxine (0/1) 0.01 0.43 2 764 ‐0.04 0.05
(0.02) All members
Children slept under bednet (<= 5 years, 0/1) 0.02 0.71 8 524 ‐0.01 0.05
(0.02)
Health outcomes All members
Adults experienced fever (>15 years, 0/1) 0.00 0.08 16 837 ‐0.01 0.01
(0.01)
Children experienced fever (<=5 years, 0/1) 0.00 0.12 8 535 ‐0.01 0.02
(0.01)

148
Table A5.4. Impact estimates ‐ Investment
Treatment Effects
95% ConfidenceInterval
TreatmentEffect
Mean Control
Obs. Lower bound
Upper bound
D. Investment
Education All members School enrollement1 Primary school enrollment (girls, 0/1) 0.00 0.40 5 559 ‐0.03 0.03
(0.02) Primary school enrollment (boys, 0/1) 0.02 0.48 5 448 ‐0.02 0.05
(0.02) Secondary school enrollment (girls, 0/1) ‐0.01 0.36 3 144 ‐0.05 0.03
(0.02)
Secondary school enrollment (boys, 0/1) 0.01 0.43 3 663 ‐0.02 0.04
(0.02)
Educational expenses ($)1 0.50 * 6.06 17 639 ‐0.06 1.05
(0.28) Households
Financing of education
Sale of assets (0/1) ‐0.02 0.34 5 574 ‐0.05 0.01
(0.01)
Loan from saving groups (0/1) 0.00 0.00 5 574 0.00 0.00
(0.00)
Loan from other sources (0/1) 0.00 0.00 5 574 0.00 0.00
(0.00)
Savings from savings groups (0/1) 0.00 0.00 5 574 0.00 0.00
(0.00)
Business (past 12 months)
Female adults (20‐65) Has business (0/1) 0.02 0.43 8 595 ‐0.01 0.04
(0.01)
Profits (self‐reported) ($) 5.13 41.20 8 458 ‐2.36 12.62
(3.82)
Profits (calculated) ($) ‐0.33 36.71 8 306 ‐4.94 4.29
(2.35)
Expenses ($) 35.66 * 131.04 8 501 ‐5.05 76.37
(20.77)
Sales ($) 38.56 * 176.47 8 464 ‐6.02 83.15
(22.75)
Months active 0.18 3.18 8 571 ‐0.06 0.42
(0.12)
Type of business
Petty trading (0/1) 0.00 0.26 8 478 ‐0.02 0.02
(0.01)
Transformation of crops (0/1) 0.01 0.06 8 478 ‐0.01 0.02

149
Treatment Effects
95% ConfidenceInterval
TreatmentEffect
Mean Control
Obs. Lower bound
Upper bound
(0.01)
Sales of meals (0/1) 0.01 0.03 8 478 0.00 0.01
(0.00)
Crafts (0/1) 0.01 0.01 8 478 0.00 0.01
(0.00)
Agriculture (woman)
Female adults (20‐65) Cultivates (0/1) 0.02 0.41 8 604 ‐0.01 0.05
(0.01) Use of agricultural inputs Index of input usage 0.02 0.00 8 596 ‐0.04 0.08
(0.03)
Use of chemical fertilizer (0/1) 0.00 0.08 8 596 ‐0.02 0.01
(0.01)
Use of manure (0/1) 0.01 0.14 8 595 ‐0.01 0.04
(0.01)
Use of other chemicals (0/1) 0.00 0.01 8 596 0.00 0.01
(0.00)
Use of paid labor (0/1) 0.00 0.10 8 494 ‐0.01 0.02
(0.01)
Total input expenses ($) ‐0.10 4.00 8 598 ‐0.94 0.73
(0.43)
Value of output ($) 5.93 ** 25.88 8 379 1.29 10.58
(2.37)
Value of sales ($) 1.97 ** 6.95 8 429 0.08 3.86
(0.97)
Agriculture (small household) Household Cultivate (0/1) 0.00 0.71 5 574 ‐0.02 0.03
‐0.01 Use of agricultural inputs Index of input usage ‐0.01 0.00 5 574 ‐0.06 0.05
(0.03)
Use of chemical fertilizer (0/1) ‐0.01 0.21 5 574 ‐0.03 0.02
(0.01)
Use of manure (0/1) 0.01 0.41 5 574 ‐0.02 0.04
(0.01)
Use of other chemicals (0/1) 0.00 0.07 5 574 ‐0.02 0.01
(0.01)
Use of paid labor (0/1) 0.01 0.29 5 574 ‐0.02 0.04
(0.01)
Total input expenses ($) 4.49 41.75 5 574 ‐2.94 11.92
(3.79)
Value of output ($) 6.41 270.45 5 572 ‐22.36 35.19
(14.68)

150
Treatment Effects
95% ConfidenceInterval
TreatmentEffect
Mean Control
Obs. Lower bound
Upper bound
Value of sales ($) 0.83 67.59 5 574 ‐9.59 11.26
(5.32)
Livestock (woman)
Female adults (20‐65) Holds livestock (0/1) 0.00 0.47 8 596 ‐0.03 0.03
(0.01)
Total expenditures on animal care ($) ‐0.06 2.98 8 596 ‐0.73 0.60
(0.34)
Total value of livestock ($) 8.87 72.80 8 596 ‐2.77 20.51
(5.94) Value of male cows ($) 1.52 9.53 8 596 ‐3.26 6.31
(2.44) Value of cows ($) 0.01 4.74 8 596 ‐3.89 3.91
(1.99)
Value of goat ($) 3.02 28.70 8 596 ‐0.70 6.73
(1.90) Value of sheep ($) 1.31 14.68 8 596 ‐1.31 3.94
(1.34)
Value of poultry ($) 0.05 3.14 8 596 ‐0.43 0.53
(0.24)
Livestock (small household) Household Holds livestock (0/1) 0.01 0.88 5 572 ‐0.01 0.03
(0.01)
Total expenditures on animal care ($) 6.22 * 43.05 5 572 ‐0.41 12.85
(3.38)
Total value of livestock ($) 119.94 *** 895.78 5 572 38.94 200.95
(41.33)
Total value of livestock ($, trimmed) 87.71 *** 819.22 5 517 23.39 152.03
(32.81) Value of male cows ($) 49.73 ** 373.39 5 572 9.28 90.17
(20.64) Value of cows ($) 22.76 123.89 5 572 ‐6.99 52.50
(15.18)
Value of goat ($) 11.47 ** 104.30 5 572 2.52 20.43
(4.57) Value of sheep ($) 12.28 *** 96.17 5 572 3.07 21.49
(4.70)
Value of poultry ($) 1.23 23.16 5 572 ‐0.88 3.35
(1.08)
Assets Household Household assets Index of assets per capita (small hh) 0.03 0.00 5 569 ‐0.02 0.08
(0.03) Index of assets per capita (ext. hh) 0.02 0.00 5 553 ‐0.04 0.09
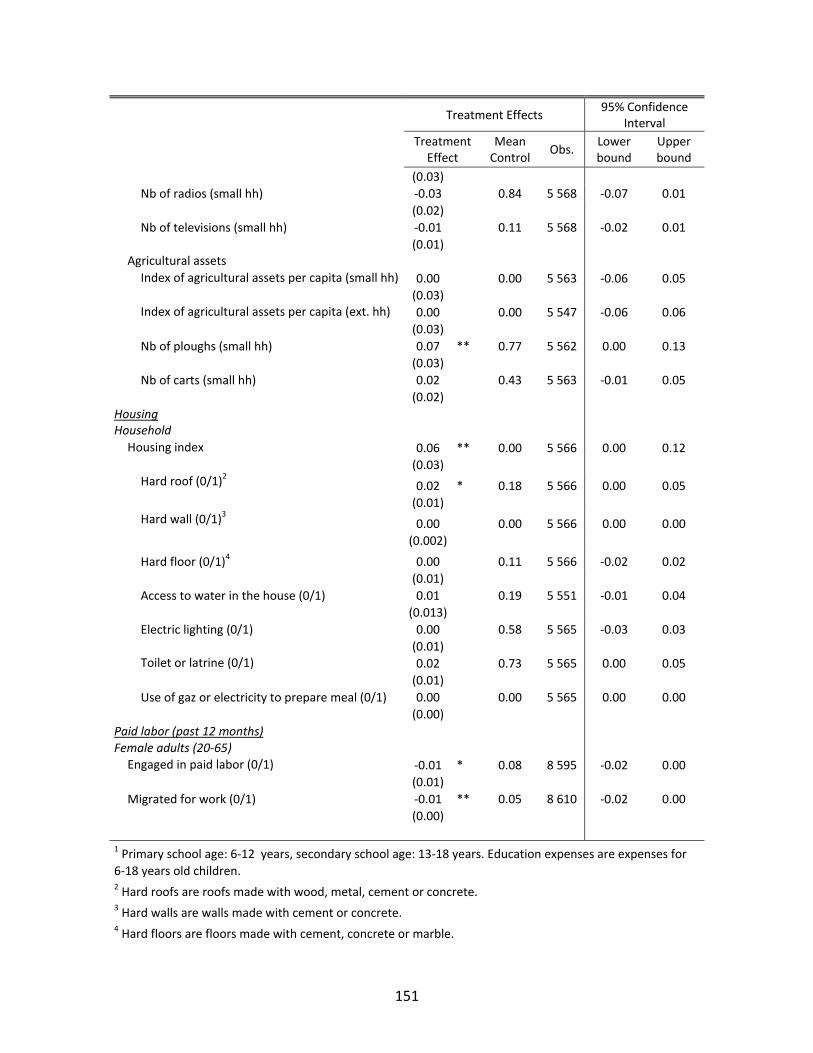
151
Treatment Effects
95% ConfidenceInterval
TreatmentEffect
Mean Control
Obs. Lower bound
Upper bound
(0.03)
Nb of radios (small hh) ‐0.03 0.84 5 568 ‐0.07 0.01
(0.02)
Nb of televisions (small hh) ‐0.01 0.11 5 568 ‐0.02 0.01
(0.01) Agricultural assets Index of agricultural assets per capita (small hh) 0.00 0.00 5 563 ‐0.06 0.05
(0.03) Index of agricultural assets per capita (ext. hh) 0.00 0.00 5 547 ‐0.06 0.06
(0.03)
Nb of ploughs (small hh) 0.07 ** 0.77 5 562 0.00 0.13
(0.03)
Nb of carts (small hh) 0.02 0.43 5 563 ‐0.01 0.05
(0.02)
Housing Household Housing index 0.06 ** 0.00 5 566 0.00 0.12
(0.03) Hard roof (0/1)2 0.02 * 0.18 5 566 0.00 0.05
(0.01) Hard wall (0/1)3 0.00 0.00 5 566 0.00 0.00
(0.002)
Hard floor (0/1)4 0.00 0.11 5 566 ‐0.02 0.02
(0.01)
Access to water in the house (0/1) 0.01 0.19 5 551 ‐0.01 0.04
(0.013)
Electric lighting (0/1) 0.00 0.58 5 565 ‐0.03 0.03
(0.01) Toilet or latrine (0/1) 0.02 0.73 5 565 0.00 0.05
(0.01)
Use of gaz or electricity to prepare meal (0/1) 0.00 0.00 5 565 0.00 0.00
(0.00)
Paid labor (past 12 months) Female adults (20‐65) Engaged in paid labor (0/1) ‐0.01 * 0.08 8 595 ‐0.02 0.00
(0.01)
Migrated for work (0/1) ‐0.01 ** 0.05 8 610 ‐0.02 0.00
(0.00)
1 Primary school age: 6‐12 years, secondary school age: 13‐18 years. Education expenses are expenses for
6‐18 years old children. 2 Hard roofs are roofs made with wood, metal, cement or concrete. 3 Hard walls are walls made with cement or concrete. 4 Hard floors are floors made with cement, concrete or marble.

152
Table A5.5. Impact estimates ‐ Empowerment and social capital
Treatment Effects
95% ConfidenceInterval
TreatmentEffect
Mean Control
Obs. Lower bound
Upper bound
E. Empowerment and social capital
Intra‐household decision making
Female primary respondent Index of intra‐household decision making power 0.02 0.00 5 425 ‐0.04 0.09
(0.03)
Free to decide about food expenses (0/1) ‐0.01 0.41 5 415 ‐0.04 0.03
(0.02)
Free to decide about educational expenses (0/1) 0.01 0.23 4 440 ‐0.02 0.04
(0.01)
Free to decide about health expenses for children (0/1) 0.01 0.34 5 315 ‐0.02 0.03
(0.01)
Free to decide about personal health expenses (0/1) 0.02 0.52 5 422 ‐0.01 0.05
(0.02)
Free to decide about visiting a friend (0/1) 0.01 0.30 5 398 ‐0.02 0.04
(0.01)
Free to take decisions about business (0/1) 0.01 0.43 4 180 ‐0.02 0.05
(0.02)
Community action
Female primary respondent Index of community action ‐0.03 0.00 5 425 ‐0.09 0.04
(0.03)
Talked to village chief in past year (0/1) ‐0.01 0.37 5 397 ‐0.04 0.02
(0.02)
Talked to a village councillor in past year (0/1) 0.01 0.58 5 297 ‐0.04 0.02
(0.02)
Talked to the president of the village womens' association in past year (0/1)
0.00 0.37 5 408 ‐0.03 0.03
(0.02)
Discussed community problems with people outside household in past year (0/1)
0.00 0.58 5 416 ‐0.03 0.03
(0.02)
Participated in a village meeting in past year (0/1) ‐0.02 0.34 5 424 ‐0.05 0.01
(0.01)
Spoke at a village meeting in past year (0/1) ‐0.01 0.13 5 424 ‐0.03 0.01
(0.01)
Voted in last elections (0/1) ‐0.02 0.70 5 419 ‐0.04 0.01
(0.01)
Social Networks (full sample) Female primary respondent Social integration index (0‐1) 0.02 0.00 5 421 ‐0.05 0.10

153
Treatment Effects
95% ConfidenceInterval
TreatmentEffect
Mean Control
Obs. Lower bound
Upper bound
(0.04) Knows other woman in sample (0‐1) 0.01 0.77 5 421 ‐0.01 0.03
(0.01) Asked other woman in sample for help (0‐1) 0.00 0.16 5 370 ‐0.01 0.02
(0.01) Would ask other woman in sample for money (0‐1) 0.00 0.44 5 370 ‐0.02 0.02
(0.01) Would give money to other woman in sample (0‐1) 0.01 0.65 5 370 ‐0.02 0.03
(0.01) Go to market with other woman in sample (0‐1) 0.01 0.24 5 370 ‐0.01 0.03
(0.01)
Social Networks (social network villages)
Adult women's network characteristics Degree centrality ‐0.02 4.44 5 521 ‐0.76 0.71
(0.38) Closeness centrality 0.00 0.18 5 521 ‐0.04 0.03
(0.02)
Village network characteristics Connectedness 0.00 0.76 40 ‐0.06 0.06
(0.03)

154
Table A5.6. Impact estimates ‐ Consumption and Poverty
Treatment Effects
95% ConfidenceInterval
TreatmentEffect
MeanControl
Obs. Lower bound
Upper bound
F. Consumption and Poverty
Food consumption (last week) Household Consumption per adult equivalent ‐ small hh ($) 0.06 1.33 5 550 ‐0.03 0.14
(0.04) Consumption per adult equivalent ‐ ext. hh ($) 0.11 3.80 3 736 ‐0.07 0.29
(0.09) Consumption per adult equivalent ‐ total ($) 0.13 * 3.89 5 535 ‐0.02 0.27
(0.07)
Non‐food expenditures (last month) Household Monthly non‐food expenses per adult equivalent ($)1 ‐0.04 2.85 5 555 ‐0.27 0.18
(0.11) Expenses for energy per adult equivalent ($) 0.02 0.54 5 555 ‐0.08 0.11
(0.05) Expenses for tabacco per adult equivalent ($) 0.04 * 0.15 5 554 0.00 0.08
(0.02) Expenses for transports per adult equivalent ($) ‐0.10 1.47 5 555 ‐0.26 0.06
(0.08) Durable good expenditures per adult equivalent ($)2 ‐0.03 5.78 5 555 ‐0.38 0.33
(0.18) Expenses for clothes per adult equivalent ($) ‐0.06 2.02 5 563 ‐0.19 0.06
(0.06)
Total expenditures (last month) Household
Total expenses per adult equivalent ‐ small hh ($) 0.23 11.48 5 572 ‐0.29 0.74
(0.26)
Poverty index Households PPI score (0‐100) 0.53 * 20.95 5 563 ‐0.10 1.16
(0.32)
PPI: National Food poverty line 0.00 0.91 5 563 ‐0.01 0.00
(0.00)
PPI: $1.25 dollar per day ‐0.01 * 0.82 5 563 ‐0.01 0.00
(0.00)
PPI: $2.50 dollar per day 0.00 0.98 5 563 0.00 0.00
(0.00) 1 Includes expenses on non‐durable household assets, transport and communication, energy and tobacco.2 Includes expenses about housing, durable household assets, clothes, social events and personal objects.

155
Table A5.7 Sample information (high‐frequency sample)
Number of
villages
Number of households
Number of completed
surveys
Number of rounds per households (median)
Control
Two weeks 24 154 2 979 21
Three months 36 152 496 4
Treatment Two weeks 24 155 2 836 20
Three months 35 145 493 4
Table A5.8 Health (high‐frequency sample)
At least one member sick
in last 3 months (0/1)
At least one member with
serious disease in last 3 months (0/1)
Health expenses in last 3 months
($)
Nb of adults which
experienced fever in last 3
months (>15 years)
Nb of children which
experienced fever in last 3
months (<=5 years)
Treatment 0.00 0.03 ‐0.10 ‐0.05 ‐0.03
(0.03) (0.02) (1.51) (0.05) (0.06)
Year 2011 0.05 ** ‐0.01 0.28 0.02 0.07 *
(0.02) (0.02) (1.13) (0.04) (0.04)
Year 2012 0.03 0.01 ‐0.55 ‐0.05 0.06
(0.03) (0.04) (1.69) (0.05) (0.07)
Survey frequency1 ‐0.08 *** 0.00 1.14 ‐0.07 ‐0.04
(0.03) (0.02) (1.53) (0.06) (0.07)
Constant 0.86 *** 0.18 *** 9.55 *** 0.45 *** 0.50 ***
(0.03) (0.02) (1.34) (0.06) (0.07)
Obs. 1 959 1 959 1 939 1 953 1 459
1 Survey frequency is a dummy variable (0 for the 2 weeks sample, 1 for the 3 months sample)

156
Table A5.9a Food consumption in lean season (high‐frequency sample)
Consumption per
equivalent adult ‐ total
($)
Consumption per
equivalent adult ‐ small
hh ($)
Consumption per
equivalent adult ‐ ext. hh
($)
FFH food insecurity index (0/1)
Lean season ‐0.50 ** ‐0.38 *** ‐0.11 0.02
(0.22) (0.12) (0.25) (0.03)
Treatment*lean season 0.35 0.39 ** ‐0.22 0.03
(0.28) (0.16) (0.36) (0.05)
Year 2011 ‐1.01 *** 0.06 ‐1.47 *** ‐0.06 ***
(0.20) (0.07) (0.25) (0.02)
Year 2012 ‐1.58 *** ‐0.38 * ‐1.83 *** ‐0.13 **
(0.32) (0.20) (0.32) (0.06)
Constant 4.69 *** 1.57 *** 4.10 *** 0.31 ***
(0.15) (0.05) (0.18) (0.02)
Obs. 1 936 1 936 1 503 1 771
Table A5.9b Food consumption variability (high‐frequency sample)
Treatment Effects 95% Confidence Interval
Treatment Effect
Obs. Lower bound Upper bound
Standard deviation of food consumption ‐0.21 272 ‐0.50 0.09
(0.15)
Coefficient of variation of food consumption 0.00 273 ‐0.05 0.05
(0.03)
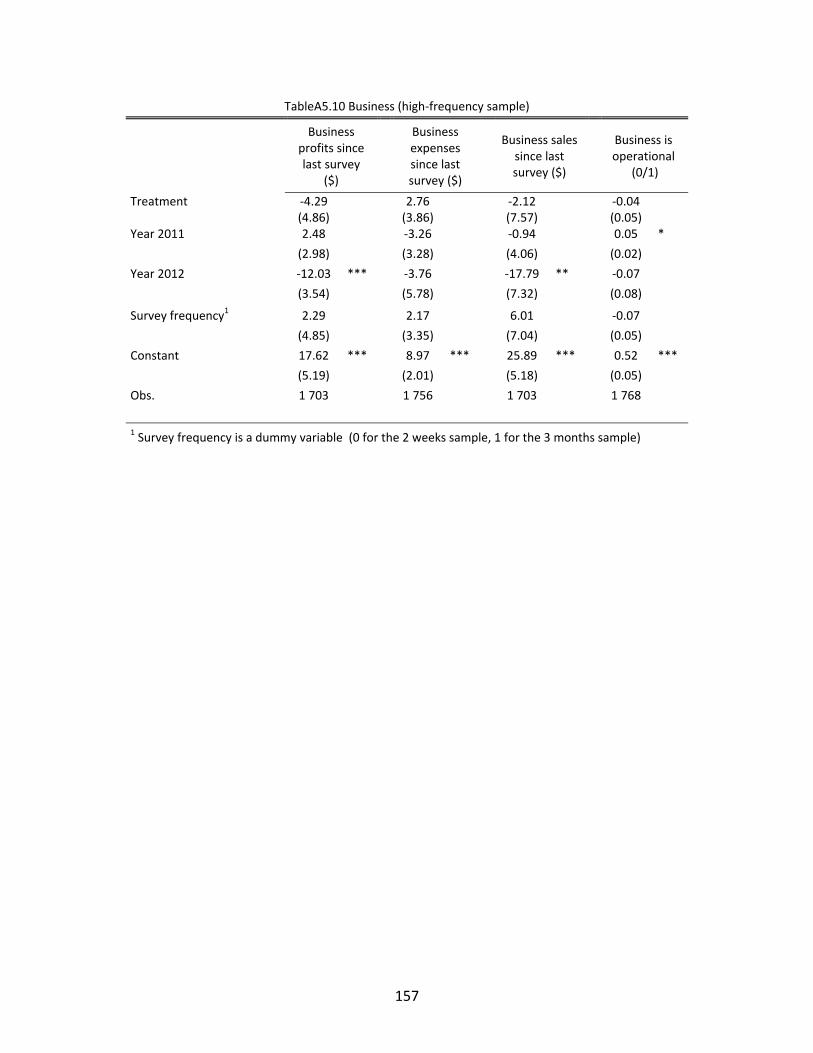
157
TableA5.10 Business (high‐frequency sample)
Business profits since last survey
($)
Business expenses since last survey ($)
Business sales since last survey ($)
Business is operational
(0/1)
Treatment ‐4.29 2.76 ‐2.12 ‐0.04 (4.86) (3.86) (7.57) (0.05) Year 2011 2.48 ‐3.26 ‐0.94 0.05 *
(2.98) (3.28) (4.06) (0.02)
Year 2012 ‐12.03 *** ‐3.76 ‐17.79 ** ‐0.07
(3.54) (5.78) (7.32) (0.08)
Survey frequency1 2.29 2.17 6.01 ‐0.07
(4.85) (3.35) (7.04) (0.05)
Constant 17.62 *** 8.97 *** 25.89 *** 0.52 ***
(5.19) (2.01) (5.18) (0.05)
Obs. 1 703 1 756 1 703 1 768
1 Survey frequency is a dummy variable (0 for the 2 weeks sample, 1 for the 3 months sample)

158
Table A5.11: Heterogeneity of treatment effects according to Type of household
Breakdown of sample according to
Type of household
(1) No ext. hh
(2) Head of small hh is head of extended hh
(3) Head of
small hh not head of
extended hh
p‐value(1) = (2) = (3)
A. Financial management Female primary respondent
Member of any savings groups (0/1) 0.01 0.04 0.07 *** 0.10 *
(0.03) (0.03) (0.02)
Member of SfC ‐ loosely defined (0/1) 0.26 *** 0.22 *** 0.25 *** 0.38
(0.03) (0.03) (0.02)
Total Savings Amount ($) 2.94 3.36 3.54 ** 0.98
(2.67) (2.63) (1.67)
Received a loan (last 12 months, 0/1) 0.02 0.02 0.04 ** 0.80
(0.03) (0.03) (0.02)
Gave a loan (last 12 months, 0/1) ‐0.06 ** 0.05 ‐0.03 * 0.01 **
(0.03) (0.03) (0.02)
Net saving ($) 2.06 9.56 ** 1.32 0.20
(4.04) (4.31) (2.22) Female adults (20‐65)
Received a transfer (30 days, 0/1) 0.02 0.02 0.01 0.97
(0.02) (0.02) (0.02)
Gave a transfer (30 days, 0/1) ‐0.03 0.01 0.00 0.35
(0.02) (0.02) (0.02)
B. Shocks and food security Household
Health expenditures ‐ past 30 days ($) ‐0.33 0.55 0.38 0.70
(0.77) (1.06) (0.45)
Resorted to costly strategy to cope with shock (0/1) ‐0.02 ‐0.03 ‐0.01 0.95
(0.03) (0.03) (0.02)
Household experienced shock with big impact (0/1) ‐0.03 ‐0.03 ‐0.03 0.99
(0.02) (0.03) (0.02) Female primary respondent
FFH food insecurity index (0/1) 0.02 ‐0.02 ‐0.07 *** 0.02 **
(0.03) (0.03) (0.02)
C. Malaria Female primary respondent Mentioned only mosquitoes as cause of malaria
(0/1) 0.03 0.02 ‐0.03 0.12 (0.02) (0.03) (0.02)
All members
Children slept under bednet (< 5 years, 0/1) ‐0.04 0.03 0.03 0.11
(0.03) (0.04) (0.02) Female primary respondent (pregnant in two last years)
Took drugs against malaria (0/1) 0.01 ‐0.05 0.00 0.54

159
Breakdown of sample according to
Type of household
(1) No ext. hh
(2) Head of small hh is head of extended hh
(3) Head of
small hh not head of
extended hh
p‐value(1) = (2) = (3)
(0.03) (0.05) (0.02)
D. Investment Female adults (20‐65) Has business (0/1) 0.01 0.03 0.02 0.87 (0.02) (0.03) (0.02) Engaged in a paid labor (0/1) ‐0.02 ‐0.01 ‐0.01 0.92 (0.01) (0.01) (0.01)
Total input expenses for agriculture ($) 0.53 0.00 ‐0.45 0.70
(1.09) (1.05) (0.52)
Value of agriculture output ($) 7.16 0.74 6.63 ** 0.39
(5.46) (3.94) (2.66)
Total value of livestock ($) 20.41 ‐2.06 8.59 0.33
(12.83) (10.03) (6.96) Household
Total input expenses for agriculture ($) 14.72 * 7.92 ‐2.31 0.13
(8.49) (9.10) (3.54)
Value of agriculture output ($) ‐44.52 49.56 9.25 0.16
(37.69) (32.35) (15.27)
Total value of livestock ($) 41.96 158.68 138.53 ** 0.45
(68.70) (106.15) (54.29)
Educational expenses per capita ($) 0.33 ‐0.09 0.21 0.52
(0.27) (0.29) (0.17) Index of assets per capita (ext. hh) 0.07 0.01 0.01 0.68 (0.06) (0.06) (0.03) Housing index 0.08 0.17 *** 0.01 0.05 * (0.05) (0.06) (0.04)
All members Primary school enrollment (girls, 0/1) 0.01 0.01 ‐0.02 0.64 (0.03) (0.03) (0.02) Primary school enrollment (boys, 0/1) 0.01 0.00 0.03 0.76 (0.03) (0.03) (0.02)
E. Empowerment and social capital Female primary respondent Index of intra‐household decision making power 0.00 ‐0.01 0.05 0.64 (0.06) (0.07) (0.04) Index of community action 0.03 ‐0.09 ‐0.03 0.35 (0.06) (0.07) (0.04) Social integration index (0‐1) 0.06 0.11 * ‐0.02 0.10 * (0.05) (0.06) (0.04)
F. Consumption and Poverty Household Consumption per adult equivalent ‐ total ($) 0.04 ‐0.15 0.27 ** 0.05 **

160
Breakdown of sample according to
Type of household
(1) No ext. hh
(2) Head of small hh is head of extended hh
(3) Head of
small hh not head of
extended hh
p‐value(1) = (2) = (3)
(0.10) (0.16) (0.11) Female adults (20‐65) Expenditures amount (frequent, $ per month) ‐0.25 ‐0.29 0.03 0.52 (0.20) (0.34) (0.19)
Household PPI Score (0‐100) 0.36 0.76 0.47 0.88 (0.56) (0.63) (0.41)
Nb of observation in treatment villages (small hh) 629 454 454

161
Table A5.12: Heterogeneity of treatment effects according to Food consumption
Breakdown of sample according to
Food consumption (per capita)
(1) Bottom 33%
(2) Between 33% and 66%
(3) Upper 66%
p‐value(1) = (2) = (3)
A. Financial management Female primary respondent
Member of any savings groups (0/1) 0.06 ** 0.05 ** 0.05 ** 0.93
(0.02) (0.02) (0.02)
Member of SfC ‐ loosely defined (0/1) 0.21 *** 0.25 *** 0.27 *** 0.04 **
(0.02) (0.02) (0.02)
Total Savings Amount ($) 4.45 *** 1.95 4.63 0.49
(1.47) (1.73) (3.06)
Received a loan (last 12 months, 0/1) 0.02 0.02 0.06 ** 0.41
(0.03) (0.03) (0.02)
Gave a loan (last 12 months, 0/1) ‐0.03 ‐0.03 ‐0.02 0.92
(0.02) (0.02) (0.02)
Net saving ($) 4.74 ** 0.95 5.08 0.47
(1.97) (2.69) (4.76) Female adults (20‐65)
Received a transfer (30 days, 0/1) 0.03 * ‐0.01 0.02 0.25
(0.02) (0.02) (0.02)
Gave a transfer (30 days, 0/1) ‐0.02 0.00 0.00 0.73
(0.02) (0.02) (0.02)
B. Shocks and food security Household
Health expenditures ‐ past 30 days ($) ‐0.04 ‐0.17 0.79 0.51
(0.52) (0.72) (0.65)
Resorted to costly strategy to cope with shock (0/1) ‐0.05 ** 0.01 ‐0.01 0.21
(0.02) (0.02) (0.02)
Household experienced shock with big impact (0/1) ‐0.04 0.00 ‐0.05 ** 0.17
(0.02) (0.02) (0.02) Female primary respondent
FFH food insecurity index (0/1) ‐0.06 ** ‐0.01 ‐0.04 0.37
(0.03) (0.02) (0.02)
C. Malaria Female primary respondent Mentioned only mosquitoes as cause of malaria (0/1) ‐0.03 0.00 0.01 0.44 (0.02) (0.02) (0.02)
All members
Children slept under bednet (< 5 years, 0/1) 0.00 0.02 0.01 0.84
(0.03) (0.02) (0.02) Female primary respondent (pregnant in two last years)
Took drugs against malaria (0/1) ‐0.03 0.02 0.00 0.35
(0.03) (0.03) (0.02)

162
Breakdown of sample according to
Food consumption (per capita)
(1) Bottom 33%
(2) Between 33% and 66%
(3) Upper 66%
p‐value(1) = (2) = (3)
D. Investment Female adults (20‐65) Has business (0/1) ‐0.01 0.01 0.05 ** 0.13 (0.02) (0.02) (0.02) Engaged in paid labor (0/1) ‐0.01 ‐0.02 * 0.00 0.59 (0.01) (0.01) (0.01)
Total input expenses for agriculture ($) ‐0.51 0.32 ‐0.11 0.71
(0.63) (0.74) (0.84)
Value of agriculture output ($) 4.04 9.92 *** 3.89 0.36
(4.43) (3.52) (3.30)
Total value of livestock ($) 7.46 9.91 8.07 0.98
(10.50) (8.60) (9.41) Household
Total input expenses for agriculture ($) ‐3.19 5.69 8.09 0.20
(3.99) (6.82) (6.33)
Value of agriculture output ($) ‐11.08 ‐15.15 37.23 0.24
(20.42) (24.86) (26.23)
Total value of livestock ($) 47.78 96.20 194.10 ** 0.31
(58.51) (65.77) (77.42)
Educational expenses per capita ($) 0.01 0.28 0.22 0.59
(0.23) (0.19) (0.24) Index of assets per capita (ext. hh) 0.00 0.00 0.07 0.46 (0.04) (0.04) (0.05) Housing index 0.03 0.07 0.07 0.78 (0.04) (0.05) (0.05)
All members Primary school enrollment (girls, 0/1) 0.01 ‐0.02 0.01 0.51 (0.03) (0.02) (0.03) Primary school enrollment (boys, 0/1) 0.01 0.01 0.03 0.61 (0.03) (0.03) (0.02)
E. Empowerment and social capital Female primary respondent Index of intra‐household decision making power ‐0.04 0.10 ** 0.03 0.08 * (0.05) (0.05) (0.05) Index of community action ‐0.01 0.01 ‐0.08 * 0.30 (0.05) (0.05) (0.05) Social integration index (0‐1) 0.02 0.00 0.06 0.61 (0.05) (0.05) (0.05)
F. Consumption and Poverty Household Consumption per adult equivalent ‐ total ($) 0.08 0.21 0.09 0.71 (0.12) (0.13) (0.12)

163
Breakdown of sample according to
Food consumption (per capita)
(1) Bottom 33%
(2) Between 33% and 66%
(3) Upper 66%
p‐value(1) = (2) = (3)
Female adults (20‐65) Expenditures amount (frequent, $ per month) ‐0.17 ‐0.22 0.01 0.77 (0.24) (0.24) (0.23)
Household PPI Score (0‐100) 0.08 0.49 0.90 * 0.41 (0.48) (0.50) (0.50)
Nb of observation in treatment villages (small hh) 780 862 831

164
Table A5.13: Heterogeneity of treatment effects according to Ethnicity
Breakdown of sample according to
Ethnicity
(1) Not Bobo
(2) Bobo
p‐value(1) = (2)
A. Financial management Female primary respondent
Member of any savings groups (0/1) 0.07 *** 0.02 0.11
(0.02) (0.03)
Member of SfC ‐ loosely defined (0/1) 0.29 *** 0.15 *** 0.00 ***
(0.02) (0.03)
Total Savings Amount ($) 2.88 4.38 ** 0.54
(1.77) (1.70)
Received a loan (last 12 months, 0/1) 0.04 ** 0.01 0.40
(0.02) (0.03)
Gave a loan (last 12 months, 0/1) ‐0.05 ** 0.02 0.04 **
(0.02) (0.03)
Net saving ($) 1.82 7.09 *** 0.17
(2.63) (2.71) Female adults (20‐65)
Received a transfer (30 days, 0/1) 0.02 0.00 0.30
(0.01) (0.02)
Gave a transfer (30 days, 0/1) 0.00 ‐0.04 0.14
(0.01) (0.02)
B. Shocks and food security Household
Health expenditures ‐ past 30 days ($) 0.00 0.66 0.39
(0.49) (0.58) Resorted to costly strategy to cope with shock
(0/1) ‐0.01 ‐0.03 0.68
(0.02) (0.02) Household experienced shock with big impact
(0/1) ‐0.05 ** 0.01 0.03 **
(0.02) (0.02) Female primary respondent
FFH food insecurity index (0/1) ‐0.04 ** ‐0.02 0.57
(0.02) (0.03)
C. Malaria Female primary respondent Mentioned only mosquitoes as cause of malaria
(0/1) ‐0.02 0.02 0.16 (0.02) (0.02)
All members
Children slept under bednet (< 5 years, 0/1) 0.02 0.00 0.56
(0.02) (0.03)

165
Breakdown of sample according to
Ethnicity
(1) Not Bobo
(2) Bobo
p‐value(1) = (2)
Female primary respondent (pregnant in two last years)
Took drugs against malaria (0/1) ‐0.01 0.01 0.51
(0.02) (0.03)
D. Investment Female adults (20‐65) Has business (0/1) 0.01 0.04 0.29 (0.02) (0.02) Engaged in paid labor (0/1) ‐0.01 ‐0.02 * 0.38 (0.01) (0.01)
Total input expenses for agriculture ($) ‐0.25 0.19 0.57
(0.57) (0.52)
Value of agriculture output ($) 6.48 ** 4.81 0.69
(3.13) (2.92)
Total value of livestock ($) 3.40 20.64 * 0.18
(6.98) (10.90) Household
Total input expenses for agriculture ($) 2.87 7.44 0.53
(4.77) (5.77)
Value of agriculture output ($) 6.67 4.97 0.96
(18.88) (24.29)
Total value of livestock ($) 142.02 *** 64.39 0.36
(50.66) (69.37)
Educational expenses per capita ($) 0.12 0.32 0.57
(0.14) (0.32) Index of assets per capita (ext. hh) 0.05 ‐0.01 0.34 (0.04) (0.05) Housing index 0.05 0.09 * 0.52 (0.03) (0.05)
All members Primary school enrollment (girls, 0/1) ‐0.02 0.05 * 0.04 ** (0.02) (0.03) Primary school enrollment (boys, 0/1) 0.02 0.02 0.82 (0.02) (0.03)
E. Empowerment and social capital Female primary respondent Index of intra‐household decision making power 0.03 0.01 0.78 (0.04) (0.06) Index of community action ‐0.02 ‐0.02 0.99 (0.04) (0.06) Social integration index (0‐1) 0.04 0.01 0.68 (0.04) (0.06)

166
Breakdown of sample according to
Ethnicity
(1) Not Bobo
(2) Bobo
p‐value(1) = (2)
F. Consumption and Poverty Household Consumption per adult equivalent ‐ total ($) 0.14 0.11 0.86 (0.09) (0.12)
Female adults (20‐65) Expenditures amount (frequent, $ per month) ‐0.13 ‐0.11 0.95 (0.18) (0.19)
Household PPI Score (0‐100) ‐0.01 1.61 *** 0.02 ** (0.38) (0.57)
Nb of observation in treatment villages (small hh) 1 696 786

167
Table A5.14: Heterogeneity of treatment effects according to Type of replication
Breakdown of sample according to
Type of replication
(1) Organic
(2) Structured
p‐value(1) = (2)
A. Financial management Female primary respondent
Member of any savings groups (0/1) 0.03 0.07 *** 0.15
(0.02) (0.02)
Member of SfC ‐ loosely defined (0/1) 0.21 *** 0.28 *** 0.01 **
(0.02) (0.02)
Total Savings Amount ($) 2.08 5.21 *** 0.11
(1.42) (1.83)
Received a loan (last 12 months, 0/1) 0.02 0.04 ** 0.45
(0.02) (0.02)
Gave a loan (last 12 months, 0/1) ‐0.02 ‐0.02 0.98
(0.02) (0.02)
Net saving ($) 3.24 4.43 * 0.70
(2.39) (2.67) Female adults (20‐65)
Received a transfer (30 days, 0/1) 0.02 0.01 0.84
(0.01) (0.02)
Gave a transfer (30 days, 0/1) ‐0.01 ‐0.01 0.90
(0.01) (0.02)
B. Shocks and food security Household
Health expenditures ‐ past 30 days ($) 0.17 0.25 0.89
(0.49) (0.45)
Resorted to costly strategy to cope with shock (0/1) ‐0.01 ‐0.03 0.45
(0.02) (0.02)
Household experienced shock with big impact (0/1) ‐0.03 ‐0.02 0.67
(0.02) (0.02) Female primary respondent
FFH food insecurity index (0/1) ‐0.01 ‐0.06 *** 0.08 *
(0.02) (0.02)
C. Malaria Female primary respondent Mentioned only mosquitoes as cause of malaria (0/1) ‐0.01 0.00 0.82 (0.02) (0.02)
All members
Children slept under bednet (< 5 years, 0/1) 0.00 0.02 0.29
(0.02) (0.02) Female primary respondent (pregnant in two last years)
Took drugs against malaria (0/1) ‐0.03 0.03 0.01 **
(0.02) (0.02)

168
Breakdown of sample according to
Type of replication
(1) Organic
(2) Structured
p‐value(1) = (2)
D. Investment Female adults (20‐65) Has business (0/1) 0.02 0.02 0.81 (0.02) (0.02) Engaged in a paid labor (0/1) ‐0.02 ** ‐0.01 0.25 (0.01) (0.01)
Total input expenses for agriculture ($) ‐0.53 0.33 0.17
(0.50) (0.55)
Value of agriculture output ($) 4.15 7.69 ** 0.34
(2.98) (3.01)
Total value of livestock ($) ‐0.81 18.46 ** 0.04 **
(7.61) (7.53) Household
Total input expenses for agriculture ($) 4.36 4.63 0.96
(4.30) (5.39)
Value of agriculture output ($) 14.28 ‐1.46 0.50
(18.91) (18.54)
Total value of livestock ($) 89.55 * 150.35 *** 0.37
(48.95) (57.09)
Educational expenses per capita ($) 0.12 0.23 0.64
(0.18) (0.18) Index of assets per capita (ext. hh) 0.00 0.06 0.27 (0.04) (0.04) Housing index 0.02 0.10 *** 0.08 * (0.04) (0.04)
All members Primary school enrollment (girls, 0/1) 0.01 ‐0.01 0.40 (0.02) (0.02) Primary school enrollment (boys, 0/1) 0.01 0.02 0.82 (0.02) (0.02)
E. Empowerment and social capital Female primary respondent Index of intra‐household decision making power 0.01 0.04 0.43 (0.04) (0.04) Index of community action ‐0.05 0.00 0.30 (0.04) (0.04) Social integration index (0‐1) ‐0.03 0.08 * 0.06 * (0.05) (0.05)
F. Consumption and Poverty Household Consumption per adult equivalent ‐ total ($) 0.06 0.20 ** 0.26 (0.10) (0.10)

169
Breakdown of sample according to
Type of replication
(1) Organic
(2) Structured
p‐value(1) = (2)
Female adults (20‐65) Expenditures amount (frequent, $ per month) ‐0.15 ‐0.08 0.72 (0.16) (0.18)
Household PPI Score (0‐100) 0.01 1.06 ** 0.04 ** (0.37) (0.44)
Nb of observation in treatment villages (small hh) 1 230 1247
Table A6.1: Cost‐benefit ratios under different scenarios
Outcome measure Program costs only
Program costs + saving contributions to SfC
ROI s.e. ROI s.e.
Total assets 794% 359% ** 243% 139% *
Total consumption + 5% return on livestock
107% 155% ‐21% 59%
Total consumption + 10% return on livestock
143% 160% ‐7% 61%

170
APPENDIX B: HIGH FREQUENCY VILLAGE CASE STUDIES (IPA AND BARA)
METHODOLOGY
IPA Case Studies
In order to gain an in‐depth understanding of the households participating in the Saving for
Change evaluation, a subset of about 300 families from both treatment and control villages was
selected by IPA to participate in high‐frequency surveys taking place about every two weeks
(when feasible). The interviews covered topics including health, financial transactions, assets,
income‐generating activities and consumption. The richness of the data collected provides a
dynamic picture of the households studied – one that is not possible to obtain with a baseline
and endline evaluation alone.
The outcomes described in case studies one through six reflect IPA high frequency data
collected over nineteen months, from mid‐June 2010 to mid‐January 2012. The information is
drawn exclusively from the quantitative data collected, with background information provided
by brief qualitative notes taken by the enumerators during the interviews. A mixed sampling
strategy was used in selecting the households to be studied, including typical case sampling
(households deemed to be “average”) and deviant case sampling (particularly wealthy or poor
households). Other than the above criteria, households for the case studies were selected
randomly, contingent on their data being fairly complete and back checks having been
conducted (households to back check are also chosen randomly). The following case studies are
not representative of the entire sample of respondents nor of the impact of the Saving for
Change program. Names of respondents and villages have been changed.
BARA Case Studies
Case studies seven through eleven report the results of qualitative research conducted by the
BARA team in August 2011 within five purposively selected households that participated in IPA
high frequency surveys from 2010‐2012, as described above. Households were selected in
collaboration with IPA and respondents (household heads) took part in household level
interviews with BARA researchers. Focus group discussions with men and women were also
conducted in those same villages where the high frequency survey households are located, as
part of the overall qualitative methodology for this phase of research.
171
CASE STUDY ONE ‐ Sangaré Household
BACKGROUND AND HOUSEHOLD COMPOSITION
The Sangaré household was visited 24 times between June 2010 and January 2012 in their
relatively small village of Dorosso Peulh, population of about 300. Headed by Issa Sangaré, 58,
of Peulh ethnicity, the household has seven members: Issa, his wife Binta, 37, and their five
children, ranging from 10 to 18 in age. Sata, their eldest daughter, married and left the
household in February 2011. Unlike many rural households in Mali, they do not belong to a
multigenerational household under the authority of the oldest male, so most meals and
economic activities are conducted within the seven‐ (and later six‐) member simple household.
AGRICULTURAL ACTIVITIES AND LIVESTOCK
Issa owned a 1.5 hectare rain‐fed plot on which the family grew sorghum. He stated using 34 kg
of organic fertilizer as the only input in his field. After the 2010 harvest, Issa declared having
500 kg of sorghum in their grain stock that November – the only stock the household owned –
but by mid‐January the family reported depleting it. The following year after the harvest, the
family stated keeping only 50 kg of sorghum at home. Issa sold 150 kg of sorghum in November
2010, earning him 9,000 FCFA47. In July 2010, a few months before the harvest, Issa had sold 70
kg of sorghum at the inflated price of 9,000 FCFA – more than double the price of the grain
right after the harvest period. In total, the household earned about 81,750 FCFA from sales of
grains.
In terms of livestock, at the start of the interviews the oldest son, Yacouba, owned an ox, and
Issa owned two goats and two‐dozen chickens and guinea fowls. Issa used his savings to buy a
goat in July 2010 at 7,250 FCFA and another in May 2011 for 11,000 FCFA, and by the end of the
study eleven kids were born. Guinea hens lay eggs during the rainy season, and Issa sold almost
10,000 FCFA of them between the 2010 and 2011 seasons. He also sold a dozen chickens at
1,750 FCFA each in August 2010 to supplement the family’s consumption. When it was time for
their daughter’s wedding, Issa sold five of his goats and several chickens, earning him 37,000
FCFA to pay for the ceremony, and for later repaying some loans he had obtained for the
occasion. In August and September 2011, he again used the sale chickens to earn 30,000 FCFA
used for consumption – particularly for the Ramadan feast.
47 The exchange rate is: $1 = 500 FCFA.
172
NON‐AGRICULTURAL LIVELIHOOD STRATEGIES
Other than from the sale of livestock and grains, part of the household’s income came from a
small business that Binta operated in July and August 2010 that netted about 2,600 FCFA over
the course of its operation. She abandoned the venture, claiming it was not profitable enough
and that she lacked time to manage it.
Issa practiced maraboutage48 but reported earning only 100 FCFA in one instance from this –
though discussing the income of religious roles such as this one is a sensitive topic. Yacouba
worked in neighboring villages tending to livestock. Although he expected to receive an ox after
several months of work, one employer paid him 25,000 FCFA for his work – less than the in‐kind
value he would have otherwise received. He earned about 44,500 FCFA in total through this
work during our visits.
HEALTH AND EDUCATION
Of their five children, daughter Sata, 18, and sons Dramane, 12, and Oumar, 10, attended a
Koranic school when we first visited the household. Their son Yacouba, 16, and daughter Kadia,
14, weren’t enrolled in school. The parents cited a need for Yacouba’s labor as the reason for
not enrolling him; in fact, Yacouba spent a few days to one month at a time tending to livestock
in neighboring villages. On the other hand, Issa and Binta preferred to keep Kadia at home
citing some mental health issues. A few months into the survey, the eldest daughter
interrupted her Koranic studies, and married shortly thereafter.
Over the course of the interviews, at least one household member had been ill during a
majority of the visits and a significant 43,255 FCFA was spent on healthcare. Fever was the most
recurring symptom, and in most cases the family sought medical attention, most often at
formal health centers and dispensaries. However, the Sangarés also consulted traditional
healers; when the two youngest children had a fever, they were brought to a traditional healer,
spending 2,000 FCFA for Oumar. Only after Oumar’s fever did not subside he was brought to a
community health center, at a cost of 2,300 FCFA. The fact that the village has no health center
may be a contributing factor to the parents’ decision to consult a traditional healer first, despite
the small difference in cost. A traditional healer was also consulted, and paid 4,250 FCFA, when
Oumar was bitten by a snake. Dramane was injured in July 2010 from falling from a tree; the
household spent 1,500 FCFA in transportation to get to a dispensary and 7,900 FCFA to treat
him. This was the same period as Oumar’s fever, translating to a significant 13,700 FCFA in
health expenditures in one month. The respondents cited drawing from individual savings to
cover all expenses.
48 A counselor/spiritual leader that mixes Islam and traditional beliefs.

173
FOOD SECURITY
The bulk of the family’s calories came from sorghum, supplemented by other grains and
condiments. The Sangaré family spent an average of about 7,300 FCFA every two weeks on
food purchases, totaling almost 150,000 FCFA over the 19 months they were visited. Purchases
were supplemented by in‐kind exchanges with others. Over one two‐week period in October
2010, Issa gave a gift of 100 kg of sorghum and received 12 kg of corn. The following month he
received 300 kg of sorghum, and again one month later he received 15 kg of sorghum and 70 kg
of millet, and gave 4 kg of the millet away and sold 50 kg of it at 4,000 FCFA. The Sangarés were
relatively food secure during this period, with scores of 2 in 2010 and 0 the next year.49
Food
insecurity
Chronic food
insecurity
Month
2 1 June 2010
2 2 November 2010
0 0 March 2011
0 0 August 2011
0 0 January 2012
SAVINGS AND FINANCIAL TRANSACTIONS
In January 2011, Binta joined a tontine in her village with 15 other members. She contributed
200 FCFA on a weekly basis, but suddenly quit the group for unspecified reasons after
contributing almost 2,000 FCFA and without collecting her share; this unpredictable nature of
some informal savings groups might be a reason why many women have decided to join SfC.
Since the beginning of the surveys, Binta had been one of twenty‐eight women in an SfC group.
At first she contributed 100 FCFA per week, but when the next cycle started she increased her
contribution to 200 FCFA. The three payouts she reported receiving, from 5,000 FCFA to 6,125
49 The food insecurity scores presented here are calculated following a methodology developed by FFH. The scores range from 0 to 9 with a higher score representing more food insecurity. The food insecurity score uses answers to 9 questions about the occurrence of certain events (reducing meals, etc) while the chronical food insecurity score also takes into account the frequency of the event.
174
FCFA, were used primarily to supplement food consumption and buy supplies for holiday
celebrations.
The only other liquid savings mechanism reported by the household was a 5,000 FCFA sum Issa
kept at home from November 2010 until January 2011, when it was depleted primarily for food
consumption and health expenditures.
The family reported receiving two gifts of cash over the course of the surveys: 1,000 and 4,000
FCFA from young relatives in a neighboring village. On the other hand, they stated giving nine
gifts averaging less than 800 FCFA to friends and relatives for a ceremonies in their own or
neighboring villages.
The most significant expense incurred by the family was over the study period was the 150,000
FCFA (300 USD) in kitchen utensils paid for their daughter’s dowry. This was counterbalanced in
part by over 50 items of clothing received in honor of the marriage.
Other articles bought by the household quite regularly were traditional soap (400 FCFA),
batteries (about 600 FCFA), matches (100 FCFA), tobacco (200 FCFA) and kola nuts (650 FCFA) –
all purchased by Issa. Examples of other types of expenses are 5,000 FCFA spent on hired
agricultural labor, 25,100 FCFA over several months for repairing their home, 2,100 FCFA for
flashlights, about 30,000 FCFA in clothing averaging less than 1,500 FCFA per item, three
veterinary visits costing about 1,500 FCFA each and 1,800 FCFA between three installments of
education costs for the Koranic school.
Issa and Binta say they did not give any loans during the survey period, but that they received a
few. Most notably, Binta received three loans of 5,000 FCFA and one of 10,000 FCFA from her
SfC group for food, debt repayments and to buy clothes for her children. Friends and neighbors
also lent the family money, ranging from a small amount of 250 FCFA for buying food, to 25,000
FCFA and 35,000 FCFA for food and religious ceremonies. The informal loans from family and
friends carried no interest and no repayment timeframe; in fact the 35,000 FCFA loan they
received in April 2011 was still unpaid by the time the surveys ended in January. On the other
hand, the SfC loans were more structured, with a three to six month repayment window and
average monthly interest payments of 750 FCFA.
CONCLUSION
The Sangaré household used a varied set of strategies and instruments to manage cash‐flow,
consumption and savings. The family used a mix of loans, sales of livestock and agricultural
goods, and in‐kind transactions to smooth their consumption over time. Although the
household did not report experiencing any shocks during the course of the financial diaries, the
ability to deal with unexpected events such as illnesses requires access to liquid or semi‐liquid

175
assets. Not relying on any formal credit and savings institutions – although they are present in
the village – Saving for Change offered a regular venue for Binta to save and access credit when
needed. There is an interesting dynamic among rural households such as the Sangarés’ when it
comes to balancing short‐term food security (consuming their stocks of grain) and strategic
long‐term grain management practices (preserving their stocks to sell them when prices are
high). This is why it may not have been irrational for the household to take an interest‐bearing
loan of 5,000 FCFA to repay a debt rather than selling part of their grain reserves when prices
were low.
CASE STUDY TWO – Diarra Household
BACKGROUND AND HOUSEHOLD COMPOSITION
The Diarra family lives in the village of Sinkuy, not far from the border with Burkina Faso. They
are of Bobo ethnicity, as are most of the families in their village of about 800 residents. Awa,
35, shares her eight‐member household with her husband Henri, 53, his first wife Georgine, and
their four boys, ranging from three to 14 in age. Henri’s mother joined their household during
the course of the interviews as her husband passed away. Henri is the head of the extended
household, comprising five adults and seven children. They were interviewed 26 times between
June 2010 and January 2012.
AGRICULTURAL ACTIVITIES AND LIVESTOCK
Henri owned a one‐hectare millet field, which produced 300 kg at the end of the 2010
agricultural season. Henri, Awa and Georgine also each owned half‐hectare peanut and dah
fields that produced about 600 kg of unshelled peanuts and 50 kg of dah. The family did not
spend any money on agricultural inputs, using only manure on their millet field.
Notwithstanding their relatively small plot sizes, the Diarra family, like many others, sometimes
relied on the sale of part of their harvest to finance expenses. They sold 8 kg of their peanuts at
1,150 FCFA in December 2010 to pay education expenses (which added up to 1,050 FCFA that
month between supplies and school fees) and food consumption. Just a few weeks later, Awa
sold 16 kg of her peanuts at 3,500 FCFA to pay for medical expenses when she fell ill with a
fever for two weeks.
The Diarra family is not very asset rich, especially considering that they are the head of the
extended household. The last time we visited the family, Henri owned two donkeys, Georgine
owned five goats and three sheep, and their nine‐year‐old son owned a chicken. Georgine had
just sold one of her goats for 4,750 FCFA when we started interviewing the family. Nobody else
in the extended household reported owning any animals.

176
NON‐AGRICULTURAL LIVELIHOOD STRATEGIES
Awa tried to make some money by producing and selling a local alcoholic beverage based on
fermented sorghum. During the 25 times we asked about how the business was going, more
than half the time she stated that she did not spend time on the activity, citing a lack of time or
more often, a lack of cash to finance it. In fact, while her expenses usually fluctuated around
2,500 FCFA to buy the millet, she made a profit only seven of the thirteen two‐week periods
when the business was operational. Admittedly, the family also consumed some of the
sorghum drink themselves – underlining the difficulty in keeping personal and business finances
separate with these types of activities.
Awa sometimes obtained the sorghum on credit from her supplier, and each time paid back
without interest. The production and sale or trade of traditional alcoholic beverages in Bobo
villages is considered not only a financial activity, but also as a community‐building enterprise,
where families may buy the drink on rotation from each other, even if each family is a producer
itself. From this social perspective, it may make more sense that Awa continued her enterprise
despite its lack of profitability.
During one interview, Awa told of trying to sell baobab leaves (used for preparing sauces), but
after earning her 3,250 FCFA she did not continue the activity, stating a lack of cash, though she
did not report any expenses.
Henri is a carpenter but over the course of the interviews he reported working as such only four
days in February 2011, earning 4,000 FCFA. His more frequent source of income was work as a
hired agricultural laborer in his own and in neighboring villages, which payed 500 to 700 FCFA
per day, totaling 7,700 FCFA for the fourteen days he worked over the two years. He tried
selling kapokier fruit once, netting 1,200 FCFA, but abandoned the activity by our following
visit. His 12‐year‐old son spent August and September 2011 in a neighboring village herding
cows and earning 3,500 FCFA per month.
EDUCATION AND HEALTH
When we first interviewed the family, their two middle sons, aged 9 and 12, were enrolled in
school, respectively in third and fourth grade. They stated that 14‐year‐old Bosso had a
disability that did not allow him to attend school. By the end of the study, Awa’s two sons had
completed fourth and fifth grade. From June 2010 to January 2012 the family spent 3,875 FCFA
on education, paid by selling their peanuts and through savings; a local shopkeeper let them
purchase a pen and notebook on credit.
Health expenses totaled 6,110 FCFA throughout the study. Their relatively low health expenses
were not a reflection of the family’s health status: at least one of the eight family members was

177
ill, to varying degrees, during all but one of the 26 visits. Fevers and stomach pains were the
most common symptoms. Less than 20 percent of reported illnesses resulted in a visit, and of
those, the majority was to pharmacies or informal medication vendors, costing from 50 FCFA to
200 FCFA. Traditional healers were consulted on three occasions of stomach pains, costing up
to 1,250 FCFA. Only Georgine was once brought to a health center for her persistent fever, after
the street‐bought medication did not help, at a cost of 3,500 FCFA.
FOOD SECURITY
Throughout the course of the visits the household self‐identified as food insecure, with their
score fluctuating between six and nine using method one, and going as low as three in using
method two.
Food
insecurity
Chronic food
insecurity
Month
8 8 June 2010
7 3 November 2010
6 6 March 2011
9 9 July 2011
8 8 November 2011
Though the Diarra family is part of an extended household, most meals were shared only
among members of the sub‐unit. Out of the five occasions we recorded their food consumption
over the course of a week, only in August 2010 did they report eating with the extended
household. We can notice a correlation between the amount of staple grains (fonio, sorghum,
millet and rice) eaten and the food security score: in November 2010 the family was at their
most food secure as their consumption included a high of 35 kg of fonio. Similarly, in July 2011,
when they were most food insecure among our periodic assessments, they ate only 15.5 kg of
sorghum and rice.
Most of the millet consumed came from Henri’s millet field. The family was sometimes able to
complement the food they grew themselves with gifts given by some of their relatives, such as
10 kg of rice from a cousin in March 2011, or 16 kg of peanuts received in January from another
family member.
178
SAVINGS AND FINANCIAL TRANSACTIONS
The family didn’t own assets that slightly wealthier households might own, such as a phone or
watch. Henri did purchase a radio at 2,350 FCFA in February 2011 using some savings. The
largest purchase the family made was a cart bought in June 2011 at 14,000 FCFA, with cash
earned from Henri’s income generating activities and saved at home. Other significant
purchases made throughout the study included children’s clothes and shoes bought for the
New Year at the end of 2010, for which Awa and Henri spent 6,250 FCFA of their resources.
Given their limited agricultural production, most of the family’s regular expenses went towards
buying food. Their median biweekly food expenses were 2,850 FCFA, with the majority of
money spent on sorghum (also used for alcoholic beverage production), millet, meat and fish.
Other common items purchased include traditional soap, batteries (for the two flashlights they
use as lighting) and matches; the median biweekly expenses on these kinds of items amounts to
200 FCFA.
Awa had been a member of SfC since we began interviewing the family. She contributed 100
FCFA each week to the 24‐member group. She stated using the bulk of the two 5,000 FCFA
payouts she received to finance her small beverage business and for buying food. She also
belonged to a work group with five other women, through which she was able to save 8,000
FCFA.
Other than the two savings groups, Awa didn’t report using other methods to save, other than
keeping small amounts of cash at home. The highest amount she stated having saved at home
were the 5,000 FCFA from the SfC payout, which didn’t last long before she spent it to finance
her business. Henri also stated having some savings at home, which reached a high of about
20,000 FCFA in June 2011, which was used mostly to finance the purchase of their cart.
Otherwise his savings fluctuated between zero and 5,000 FCFA, and were drawn from regularly
to pay for food consumption, education expenses and repaying a debt. Both Awa’s and Henri’s
savings at home didn’t seem to function as a fund to build up and use in case of emergencies,
but rather as cash temporarily stored and quickly withdrawn to finance needs.
The family’s lack of savings and assets made it difficult for them to react to the unexpected
events that had a negative impact on their household, such as the death of some of their
animals in June 2011 amounting to an estimated loss of 165,000 FCFA, or the drought in 2011
that led to about 170,000 FCFA of lost harvests.
The family frequently relied on assistance from family and friends to make it through difficult
times. They received ten gifts of cash totaling 12,550 FCFA from friends and relatives in the
same or neighboring villages, which were mostly used towards food consumption or health
expenses. More frequently, the Diarras relied on small loans averaging 1,550 FCFA to finance

179
their expenses. Of the 18 loans they received, the majority was from relatives and from the
shopkeeper as store credit, and only seven were repaid over the course of the interviews. Awa
reported receiving more loans than her husband. One of her loans was from the SfC group and
was for 2,800 FCFA; Awa stated using the cash to purchase sorghum for the family. Awa also
obtained a 5,000 FCFA loan that she used to buy millet. Her credit with the local store ranged
from 75 FCFA to 2,800 FCFA and went towards purchasing items such as soap, salt, shoes,
medication, rice, and sorghum for her small business. On one occasion she stated asking for a
300 FCFA loan from a relative to pay for a debt with the storekeeper. Henri’s median loan value
was slightly higher than Awa’s, and the six loans he obtained from friends and relatives were
used for buying agricultural equipment or food.
CONCLUSION
The Diarra family is a poor household in a precarious financial situation. Their two hectares of
land are not enough to produce enough for the family to last through the hungry season,
especially during bad years such as 2011. They generate little additional income to supplement
their farming, as their income‐generating activities are not managed continually and are not
always profitable. With no money saved and with few assets, they rely on their network of
family and friends to make it through difficult times.
CASE STUDY THREE – Gassama Household
BACKGROUND AND HOUSEHOLD COMPOSITION
Seydou Gassama and Djeneba Traoré live in the village of Degene. When we met them they
were respectively 35 and 28, and their household also comprised their 3 year‐old son Drissa,
their newborn daughter Sadia and their 16 year‐old niece Korotimi – although Korotimi was
away for school in a neighboring village for several months. The Gassama family is part of an
extended household headed by Moussa Gassama, of Sonike ethnicity. In total the extended
household counted nine active adults, one inactive adult, two children between the ages of 12
and 17, three children between the ages of 5 and 11, and six children under 5 years old. They
were interviewed 21 times between June 2010 and December 2011. Between May and July
2011, the family had traveled to Bamako to visit Djeneba’s sister, so data during this period is
not available.
AGRICULTURAL ACTIVITIES, LIVESTOCK AND OTHER LIVELIHOOD STRATEGIES
Seydou is a tailor and his work brought in an important portion of the household’s income at
about 39,500 FCFA over 18 months. The majority of the household’s income, however, came

180
from the sale of crops produced from Djeneba’s small one hectare field of beans, sesame and
groundnuts, and from the extended household’s 12.5 hectares of primarily millet, with cotton,
sorghum, corn, beans, groundnuts, sesame and rice occupying smaller portions of the land.
Djeneba’s small plot yielded about 20 kg of groundnuts, 40 kg of beans, though she gave half of
her yield away to family.
On the other hand, the extended household produced 3,100 kg of millet, more than 1,300 kg of
cotton, 1,700 kg of corn, 500 kg of groundnuts, 200 kg each of beans and sorghum, and about
60 kg each of sesame and rice. Djeneba did not use any inputs on her crops, but the extended
household spent over 100,000 FCFA on fertilizer in the 2010 season, largely on cotton, corn and
millet. Of course not all this production was destined for the five‐member Gassama household;
in total they were able to sell about 80,000 FCFA of these crops, in addition to what they
consumed themselves.
Seydou and Djeneba owned a goat – that was received as a gift from a relative in July 2010 and
that later bore a kid – and some chickens. The larger household owned three oxen, a cow, three
calves, a donkey, three sheep, and two‐dozen chickens. Seydou sold nine chickens over the
course of four months, earning 11,800 FCFA, to contribute towards ceremonies in the village,
and to pay for health expenses. He also gave two chickens as gifts to relatives in early 2011.
HEALTH AND EDUCATION
Throughout our visits to the Gassama household, family members were ill seven times, with
three of those illnesses lasting several weeks. With the exception of a severe cold, fever and
self‐reported malaria were the causes. Baby Sadia was the first to fall ill, and 8,000 FCFA from
sales of peanuts were spent in treatment at a health center. Towards the end of November
2010, when Djeneba and son Drissa fell ill, no health center was visited, and the parents opted
to buy 300 FCFA worth of medicine to treat their son. When the two did not get much better,
two weeks later Seydou explained that he used 7,000 FCFA of money earned from his tailoring
business to pay for a visit to a health center and medication. Seydou fell ill with a fever himself
in March 2011 but decided not to seek treatment. In fact, not seeking any medical attention
was the most common response to illness, followed by self‐diagnosing and buying medication
from informal sellers, and finally consulting a community health center – the most expensive
option. The lack of timely care often resulted in lost days of work for Djeneba and Seydou.
Korotimi, the niece taken in by the family, attended ninth grade in a neighboring village during
the 2010‐2011 academic year. Unable to pass the exam needed to continue her studies, she
dropped out of school and stayed with the Gassamas to provide her labor as needed. The family
did not report spending any money on her schooling.

181
FOOD SECURITY
The Gassama family classified as food secure all three times their status was assessed
Food
insecurity
Chronic food
insecurity
Month
0 0 June 2010
1 0 November 2010
0 0 December 2011
They spent an average of 1,620 FCFA every two weeks on food items, with significant variance,
spending nothing some weeks and more than 3,000 FCFA others. Seydou and Djeneba often
received corn, rice, beans and potatoes from relatives to supplement their consumption.
SAVINGS AND FINANCIAL TRANSACTIONS
When we first interviewed Djeneba, she was part of a savings group of about 100 women that
contributed 100 to 150 FCFA each week to a fund to be used to start a vegetable garden. By the
end of November 2010, when she had contributed about 3,000 FCFA, the group stopped saving
to focus on the harvest season; Djeneba complained for some time that those responsible for
managing the group did not give information about restarting contributions and upcoming
activities. However, by that February, the group had dug a well and began gardening, but
Djeneba did not report selling any produce from the group project.
At the start of the surveys, Djeneba belonged to a small tontine with eight other women,
contributing 750 FCFA per week. After three weeks, she stated that she could not afford the
weekly payments and cashed out her contribution of 2,250 FCFA and left the group. Other than
these two groups, Djeneba did not report belonging to any others, and she said she kept no
other savings – and neither did Seydou.
Seydou received a gift of 10,000 FCFA in August 2010, which he used to buy food. On the
another hand, the family gave three gifts of cash over the 18 months: 2,000 FCFA to help a
friend in a neighboring village to pay for health expenses, 10,000 FCFA to Djeneba’s mother,
and 1,000 FCFA towards a relative’s food expenditures.
182
Informal loans were also a strategy used by the household when in need of liquidity: Djeneba
obtained 12,500 FCFA from a neighbor and Seydou loaned 2,000 FCFA from a friend to help pay
for religious festivities. Djeneba was to repay the loan within two months, but it took her closer
to six months. For their part, Seydou gave loans of 2,500 FCFA and 5,000 FCFA to relatives in
nearby villages.
Over a typical two‐week period the household might spend 400 FCFA on soap, 400 FCFA on
batteries, 50 FCFA on matches and 750 FCFA on tea. On average the family spent 1,183 FCFA
every two weeks on these types of items. Other examples of expenses incurred include a 6,000
FCFA rental fee for a cart during the harvest, the purchase of four hoes at 2,000 FCFA, and eight
items of clothing for 21,000 FCFA.
CONCLUSION
Seydou and Djeneba face challenges typical to those of families in rural Mali. Their reliance on a
good harvest for subsistence and monetization places them in a precarious situation during bad
years. Tight‐knit networks of extended family and friends is what keeps them afloat during
difficult times, receiving gifts or requesting informal loans – and reciprocating for others in their
times of need.
Degene did not have a Saving for Change group at the time of the study, and Djeneba’s
participation in other forms of group saving illustrates some of the challenges with these
traditional systems. Djeneba had little information regarding the functioning of the large
gardening group and was unsure of her total contribution to the fund. On the other hand, the
tontine contribution of 750 FCFA proved to be unsustainable given her means, and she was
compelled to quit the group. SfC’s transparency and relative affordability are likely two of the
reasons it has been so successful in the Malian context. However, informal person‐to‐person
loans, such as the ones obtained by Djeneba, allow a degree of flexibility in repayment that
even SfC loans are unlikely to crowd‐out.

183
CASE STUDY FOUR ‐ Bouaré Household
BACKGROUND AND HOUSEHOLD COMPOSITION
One of the six households in Nimbougou that were a part of the high frequency study, the
Bouaré family was visited 20 times from June 2010 to January 2012. Youssouf Bouaré, 63, of
Bamabara ethnicity, is the head of the household. He has two wives, Kadidia Tangara50 (first
wife, age 44) and Sali Coulibaly (second wife, 46), and together they have 13 children, seven
girls and six boys, ranging from 4 to 25 in age. Youssouf is also the head of the 24‐member
extended household, which counts seven active adults, two inactive adults, eleven children
under the age of twelve and four children between the ages of 12 and 17.51 The family of 16
shared a 10‐room house. With no electricity, they used batteries for lighting and wood for
cooking.
AGRICULTURAL ACTIVITIES AND LIVESTOCK
In October 2010 the extended household possessed 14 cows, 15 oxen, 50 goats, 30 sheep, 8
horses, 6 chickens, one duck and a donkey, all owned by Youssouf. In June 2011, Youssouf sold
a cow and an ox, bringing in about 230,000 FCFA, an in December 2011 he purchased an
additional horse costing 250,000 FCFA using money earned from an income‐generating
business.
All agricultural activities were conducted with the extended household. Youssouf estimated
owning 26 hectares of land, where millet was the main crop, followed by rice, sorghum,
groundnuts and beans. All crops were rain‐fed and were farmed communally among the
members of the extended household. Over the course of an agricultural season, they stated
using 124 kg of organic fertilizer and 750 kg of chemical fertilizer (costing about 185,000 FCFA).
The extended household received help from paid labor during peak harvest times; in January
2011 Youssouf spent 70,500 FCFA to pay for workers and transportation during the rice harvest.
The household also had a garden from which Kadidia harvested 15 kg of eggplants in August
2010, and which her daughters exploited to grow tobacco, yielding 4 kg of the crop in April
2011.
NON‐AGRICULTURAL LIVELIHOOD STRATEGIES
Youssouf, Kadidia and Sali were involved in significant income‐generating activities. The two
wives jointly managed the sale of peanuts, shea butter and kola nuts. When their business was
operational, as was the case most weeks, their average revenues over two weeks amounted to
50 Kadidia is the primary respondent for the survey. 51 Unless otherwise noted, “household” refers to the sub‐unit.

184
almost 185,000 FCFA, with considerable variation depending on the availability of product to
resell. When they were unable to purchase many peanuts to sell, the wives made extra money
through the added value of shelling the peanuts themselves. During the last interview, Kadidia
complained that 35,000 FCFA worth of shelled peanuts had been stolen – she consulted a
clairvoyant in hopes to catch the culprit, with no success. Over the course of the surveys, their
revenues totaled over 3 million FCFA, with about a 6 percent profit margin.
Youssouf bought and sold livestock, and managed very large sums of money: between buying
the animals, transporting them and paying for labor, he spent between 300,000 and 1,000,000
FCFA any given two‐week period. Good business was not always guaranteed: In October 2011,
an ox worth 225,000 FCFA that he had just purchased died before being sold, and others were
afflicted with disease. Youssouf explained that he once had entrusted some merchants to sell
his livestock in Ivory Coast, and they fled with 400,000 FCFA worth of his oxen – a loss from
which he had not yet recovered. He estimated having lost about 18,000,000 FCFA over the
years from such situations. He averaged a 5 percent profit margin during the surveys, but he
took considerable risks in hiring people and dealing with such large sums of cash and assets.
Secondary sources of income for the household included Kadidia’s and Sali’s work in rice
paddies in neighboring villages; in October and December 2010, they worked three to five days
a week at a daily rate of 900 to 1,000 FCFA. The wives also sold eggplants from their garden,
earning about 6,000 FCFA over the course of several months. Youssouf sold milk and eggs for
3,500 FCFA and sold 26,500 FCFA worth of beans in July 2010. The eldest son occasionally
travelled to Bamako, other regions of Mali and as far as Senegal for up to two months at a time
for work.
HEALTH AND EDUCATION
Of the eleven school‐age children in the household, nine of them attended school. The parents
claimed that their youngest child at age six was still too young to start school, and that their
fourteen‐year‐old daughter was not interested in school and they needed her labor at home.
Incidence of illness was relatively low for the Bouaré household, despite the number of
members. Three children suffered from symptoms related to sickle‐cell anemia, keeping them
from engaging in their regular daily activities for two days to one week at a time. The household
often visted traditional healers or bought medication from vendors to help assuage their
episodes of pain. Fever was reported four times; Kadida tried to treat her fever with some
medication bought by informal street vendors, but the following visit she told us that she later
spent 8,150 FCFA on transportation and treatment from a community health center In all, the
family spent just over 33,000 FCFA on health care, mostly at health centers and pharmacies.

185
FOOD SECURITY
The family’s wealth relative to other households in the area is reflected in its self‐assessment of
food security. The months in which food was scarcer, as expected, were during the hungry
season before the start of the agricultural season. All meals were consumed with the extended
household. The extended household kept stocks of millet, beans, rice sorghum in their grain
storage. Their stocks fluctuated with the harvest seasons, reaching peaks of 6,000 kg of millet,
3,000 kg of rice and 1,000 kg each of beans, sorghum, and fonio. Their lowest stocks were
reported in September 2011, estimated at about 1,500 kg in total of all crops. Their food
security scores are presented in the table below.
SAVINGS AND FINANCIAL TRANSACTIONS
Neither Kadidia nor Youssouf were members of tontines but Kadidia was one of 29 women in
her village belonging to Keneya Ton, a Saving for Change group. Her weekly contribution was
100 FCFA each week. At the end of the 12‐month savings cycle in June 2011, Kadidia reported
receiving 18,450 FCFA, which was three times a regular share. After some investigation, Kadidia
admitted that she had encouraged two women to join the SfC group, but they were soon
unable to make the weekly payments, so she took over their shares. She used the majority of
the payout to purchase clothes, shoes and jewelry. When the next cycle started she increased
her weekly contribution to 200 FCFA.
Kadidia’s husband also stated belonging to a savings group, but he explained that he served
more as an elder counselor than an active member. The association functioned mostly as a
Food
insecurity
Chronic food
insecurity
Month
0 0 June 2010
1 0 October 2010
1 1 March 2011
1 1 August 2011
1 0 December 2011
0 0 January 2012

186
work group, with young men working in others’ fields to save money. The only contribution
Youssouf reported was of 6,900 FCFA in December 2011; the group collected 1,150 FCFA per
member to finance a water pump in the village, and Youssouf paid a contribution for six men in
his family.
Kadidia kept from 80,000 FCFA to 400,000 FCFA in savings at home, withdrawing and adding
money frequently from her business. Youssouf’s savings added up to 200,000 FCFA in October
2010, but after withdrawing from them repeatedly, mostly for his business but also for health
and transportation expenses, one year later he had depleted the cash.
Throughout the study, Kadidia gave eleven loans to friends for a total of 137,750 FCFA – an
average value of about 12,500 FCFA per loan. The majority of the loans were in‐kind to friends
and relatives, had no conditions attached and were hardly ever paid back, perhaps suggesting
that in substance they were more transfers than loans. The loans were supposedly used to
supplement food consumption, pay for health expenses and fund income generating activities.
During the same period, Youssouf gave seven loans adding up to a considerable 1,530,000 FCFA
in in‐kind goods to some friends for their businesses. The two times he specified a repayment
period, the loans were not paid back on time, and no warranty or interest was required.
Youssouf received two loans of 100,000 FCFA and one loan of 10,000 FCFA for his livestock
trading business from a merchant and repaid each one before our next visit. A larger loan from
the merchant of 400,000 FCFA had been obtained by Youssouf during our last interview.
The Bouarés did not report receiving any gifts of cash, but gave six gifts ranging from 500 FCFA
to 5,000 FCFA for social occasions in both their village and a neighboring one. The most
significant in‐kind transfer was a motorcycle bought for 356,000 FCFA by Youssouf and given as
a gift to his brother in December 2010. Other gifts include 15 kg of meat donated for Tabaski
and three gifts adding up to 1,000 kg in total of millet and rice donated throughout the course
of household visits to individuals that helped during the harvest (that the family differentiates
from a direct payment for the tasks performed) or given as a “sacrifice” after the harvest.
Highly significant events for the household during the study were the marriage of their oldest
daughter and of a young woman who they had informally served as caretakers for. In June 2011
the Bouarés spent 184,700 FCFA in purchasing new shoes and clothes for the soon‐to‐be
married women; Kadidia used her SfC payout to help cover some of the wedding costs. Their
eldest son also married around the same time, but the patrilocal nature of families and no
dowry requirements for males meant that his marriage did not have as big a financial and labor
impact on the household.
Typical items bought by the household every two weeks included commercial soap (1,100
FCFA), traditional soap (1,200 FCFA), phone cards (2,000 FCFA), gas (3,000 FCFA), batteries (425

187
FCFA) and tea (500 FCFA). Other example of expenses were a 8,500 FCFA flashlight bought by
Kadidia, 6,000 FCFA that Youssouf spent on clothes, a total of 16,200 FCFA spent on veterinary
fees over eight visits and 50,000 FCFA used to buy a sheep for the Tabaski holiday. The Bouaré
family also spent 11,805 FCFA on school supplies and about 15,000 FCFA on school fees,
financed by the savings from their businesses.
CONCLUSION
The Bouaré family is much wealthier than the average household in our study. Still, just as most
families, they pursue a variety of strategies to create streams of revenue. They rely mostly on
their income generating businesses rather than on the sale of their harvest. The household
deals with very large sums of cash, so it is all the more noteworthy that they do not use formal
institutions to safeguard or invest their money, but instead keep it at home. The fact that
Kadidia joined an SfC group underscores the diversity of groups’ membership. Even taking into
account that Kadidia effectively had three shares, her payout was did not constitute a very
significant portion of the household’s cash flow. The diversity of membership may reflect the
valued social capital opportunity that being a part of an SfC group might provide.
CASE STUDY FIVE ‐ Diallo Household
BACKGROUND AND HOUSEHOLD COMPOSITION
Oumou Bah lives in the small village of Djelibougou with her husband Hamadoun Diallo and
their five children. They are one of the several Peulh families in the majority Soninke village.
Oumou is in her late twenties and Hamadoun is ten years her senior. They have five children:
their daughters Batoma and Awa are twelve and seven years old respectively, their sons Aliou
and Ousmane are four and two, and little Mady joined the family in April 2011. Hamadoun is
also the head of the extended household, which counts a total of six adults and nine children.
The family was interviewed fifteen times over the course of the study – fewer times than most
other households, as the 2010 rainy season led to floods that rendered their village inaccessible
by the enumerators from September to January.
AGRICULTURAL ACTIVITIES AND LIVESTOCK
When we enumerated their livestock in June 2011, Hamadoun owned three cows, five calves,
seven goats, nine sheep (including one received as a gift in June 2011) and eleven chickens, and
Oumou owned four cows, eight goats and ten sheep. In addition, in the extended household
there were seven cows, twenty‐two goats, ten sheep five calves, thirty chickens and two oxen.

188
Selling their livestock was one of the principal strategies the family used to face unexpected
expenses – such as healthcare costs – and in total the Diallos earned about 73,000 FCFA this
way.
Having no plots exclusive to the household, the family participated in cultivating the extended
household’s 0.75 hectare of millet and beans and one hectare of rice. By early 2011, after the
harvest, the fields produced 300 kg of millet, 20 kg of beans and 700 kg of rice.
NON‐AGRICULTURAL LIVELIHOOD STRATEGIES
Oumou did not report managing any income‐generating activities but Hamadoun ran two small
businesses. He bought used cereal bags and repurposed them by shredding them and making
rope. He worked an average of five days every two weeks on this activity, had average biweekly
expenses of about 1,500 FCFA and his profits varied from a high of 3,500 FCFA to a loss of 5,000
FCFA – understandable since he often bought his raw material in bulk. On average, he netted
just over 1,500 FCFA every two weeks. Hamadoun also started a livestock business, but did not
report any profits yet as he was taking time to raise and fatten the animals before selling them.
HEALTH AND EDUCATION
Of their two school‐aged children, Awa began her education during the 2011 school year, as the
previous year her father did not think she was ready to begin. Batoma, on the other hand, was
not enrolled in school with her parents citing their need for her help at home. The family did
not report any education expenses.
Over the course of the interviews, the family spent a significant 44,600 FCFA on medical costs.
In January 2011 both parents and two children were ill with a fever but decided not to visit a
health center and purchased 6,050 FCFA worth of medication using money from the sale of a
sheep and Hamadoun’s rope‐making activity. When they did not get much better by March,
they spent an additional 14,450 FCFA – 12,650 FCFA on medicine, 750 FCFA on consultations
and 1,050 FCFA on transportation to the health center they visited. This time Hamadoun
obtained a loan from a friend, they sold some roosters and a goat to pay for the treatment. A
few weeks later, Oumou’s son Mady was born and the family spent 12,500 FCFA for her care.
Understandably, when we asked if the family experienced any shocks, Oumou and Hamadoun
mentioned the illnesses that significantly set them back financially.

189
FOOD SECURITY
The Diallo family has been classed as food secure all four times we assessed them in this area.
They used a combination of food grown in the extended household and food purchased using
cash from income‐generating activities and from loans from friends.
SAVINGS AND FINANCIAL TRANSACTIONS
Oumou belonged to a twenty‐member Saving for Change group. With the other women, she
saved 200 FCFA per week – unless they collectively decided to contribute a bit more a given
week. When she received a 12,000 FCFA payout in June 2011, she used most of it to purchase
some new clothes; her use of her SfC money may be a reflection of the household’s relative
wealth, as some other women are compelled to use the payout for food consumption or other
pressing family needs.
The Diallos had more savings than the average family in the study area. Hamadoun had a
savings account with the microfinance institution RMCR with funds fluctuating between 20,000
FCFA and 77,500 FCFA, averaging about 31,000 FCFA during the study. He received no interest
but paid 1,000 FCFA in fees each month. He withdrew money on several occasions for food
consumption, healthcare and ceremonies in the village. Hamadoun also belonged to a World
Vision savings group with 15 other people. They met a few times per year, and Hamadoun
stated having 27,500 FCFA with the group but didn’t report withdrawing any cash. In addition,
Hamadoun saved some money at home; by the last interview he had 70,000 FCFA.
Other than selling their animals and drawing from savings, the Diallo family relies on their
network of family in friends to help them through difficult times. Most of the financial aid is in
the form of no‐interest loans with no defined term. Such were the 700 FCFA loan Oumou
Food
insecurity
Chronic
food insecurity
Month
1 0 July 2010
1 1 March 2011
1 1 August 2011
1 1 December 2011

190
obtained from a neighbor to buy soap and paid back four months later, seven purchases
ranging from 200 FCFA to 400 FCFA she made on credit from a local shopkeeper to buy soap,
sugar and jewelry for her children paid back after about two months each time, and the 500
FCFA she borrowed from a neighbor to buy food towards the end of the interviews. Following a
common pattern of intra‐household financial roles in the study area, Hamadoun obtained fewer
but larger loans than his wife: 20,000 FCFA from a neighbor for food consumption, paid back in
full after one year, 7,500 FCFA from their supplier to buy rice on credit, paid back in one month,
and 3,000 FCFA from a friend to buy food and paid one month later.
Towards the end of the interviews, Hamadoun received a 100,000 FCFA loan from an
agricultural coop to buy feed for the animals for his business, to be paid in seven months with
15,000 FCFA interest.
Transfers of cash and goods are also common practice. Hamadoun gave five gifts ranging from
200 FCFA to 1,250 FCFA to friends celebrating marriages or other ceremonies. Another 2,350
FCFA went towards three gifts to relatives for food consumption and other needs. Hamadoun
received 2,500 FCFA himself from a sibling in another village that he used to buy food. Oumou
did not report receiving any cash, but she did receive 29 kg of rice from her sister, an uncle and
a friend when her son was born, balancing the 30 kg of rice Hamadoun gave to his brother a
few months earlier.
Examples of household expenses include 3,500 FCFA spent on repairs of their home, median
biweekly expenses of 1,525 FCFA on food items and 1,550 FCFA on items such as batteries, soap
and gas, and about 5,000 FCFA spent on clothes and shoes.
CONCLUSION
The Diallo family is wealthier than the average family in our study sample. Most remarkably,
though their income is not especially high, they are able to keep significant amounts of money
saved, both at home and in formal institutions. Oumou, however, reported using only SfC as her
savings environment, suggesting either a lack of additional cash to manage independently, or
disincentives to saving money at home or elsewhere. Learning what motivates families in
individuals to choose how to manage their finances could help shed light on the best strategies
for financial inclusion.

191
CASE STUDY SIX ‐ Boiré Household
BACKGROUND AND HOUSEHOLD COMPOSITION
Mamadou Boiré and Ramata Traoré live in Torosso, a village of just under 800 that did not have
any SfC groups during the study. Sixty‐five and 45 respectively, they live with four of their
unmarried children: Ousmane, 30, Kassoum, 20, Boureima, 6, and the only girl, Djelika, of 10.
Mamadou is the head of the extended household, which includes their married son, and counts
six adults and three children under eighteen. We visited the Boiré household 25 times from
mid‐June 2010 to mid‐January 2012
AGRICULTURAL ACTIVITIES AND LIVESTOCK
When we first tallied the Boirés' livestock in October, they owned five oxen, one cow, two
donkeys, two chickens and ten sheep – including the one they received as a gift from one of
their sons in June 2010. Mamadou bought two more oxen in June 2011 (at an estimated cost of
about 130,000 FCFA each, from their savings) and two sheep in August and November 2011 at
an average price of 29,000 FCFA, and two lambs were also born around that period. The family
reported the illness of one of their oxen as a significant shock, costing them 25,000
FCFA.Ramata sold three of her chickens in 2011 earning her 2,500 FCFA. Just about every other
month, Mamadou spent an average of 1,700 FCFA of his savings per month on veterinary fees.
The bulk of the family’s earnings came from the sale of rice from their fields. The extended
household owned two hectares of rice, one and a half hectares of millet and half a hectare of
groundnuts. Beans, okra and watermelons took up a less significant portion of their land. In
addition, Ramata exploited a small field on her own to grow okra and grew onions in a garden.
The household sold rice regularly – an 18‐month total of almost 3,500 kg – at an average price
of 150 FCFA/kg. Most of the money earned was used for food consumption, but large portions
were also used to cover agricultural expenses. Ramata and Mamadou stated spending 172,000
FCFA during the 2010‐2011 agricultural season, and 12,500 FCFA by January 2012 to pay for
agricultural labor, fertilizer, repairs to their cart, buying sacs for bagging the rice and similar
inputs. In one instance, rice was exchanged to acquire a solar panel to generate electricity for
the home.
NON‐AGRICULTURAL LIVELIHOOD STRATEGIES
From September to December 2010, and from April to September 2011, Ramata operated a
small business selling potatoes, rice and fried dumplings (“beignets”). Over the course of the
interviews, her revenues added up to 62,400 FCFA, but she only retained a profit of 1,850 FCFA

192
after paying for ingredients. She cited low profitability and lack of time to manage the business
as the reasons for pausing her activity.
Without telling his parents, 30 year old Ousmane left the village one morning in October 2010
to try his luck earning some money. For two months the family had no news of his whereabouts
but by December they reported that he was working in Bamako as a tailor. He was away during
most visits, and Ramata and Mamadou did not know exactly how much he was earning.
HEALTH AND EDUCATION
None of the children were enrolled in school when we visited the Boirés; the parents explained
that they needed the older two children's labor, and that the youngest was still too young to
enroll.
With regards to health, the family reported only six health problems over the year and a half:
two fevers treated by simply purchasing medicine costing 150 FCFA and 500 FCFA respectively,
general fatigue again treated with 300 FCFA worth of medication, and boils and an injury
treated with no‐cost traditional medicine. However, in November 2011 Ramata had to go to a
health center for treatment for an appendicitis, which cost 200,000 FCFA. With limited
resources to deal with this health emergency, her adult son working in Segou sent the money
for her intervention.
FOOD SECURITY
The Boiré household self‐evaluated as food secure, receiving a score of 1 in June 2010, then
scores of 0 the other times they were evaluated.
Food
insecurity
Chronic
food insecurity
Month
1 0 June 2010
0 0 October 2010
0 0 November 2010
0 0 February 2011
0 0 August 2011
0 0 December 2011

193
Mamadou kept stocks of rice and millet separate from the extended household, peaking at
2,000 kg and 500 kg respectively. The extended household’s stocks were at their highest after
the 2010‐2011 harvest, at 5,600 kg of millet, rice and groundnuts. The family spent an average
of 3,800 FCFA every two weeks on food purchases – on meat, fish and condiments.
SAVINGS AND FINANCIAL TRANSACTIONS
Mamadou donated more than 500 kg of rice and millet to relatives (valued at about 118,000
FCFA) over the course of the surveys; the largest gifts were given during the 2010 and 2011
hungry seasons. For their part, the Boirés declared receiving 25 kg of sugar from one of their
sons and 5 kg of millet from a relative in August 2011. They also reported receiving 14 items of
clothing and several household items, primarily by adult children outside the household, with
an estimated value of almost 45,000 FCFA. They themselves gave 7 items of clothing as gifts to
relatives, estimated at about 18,000 FCFA.
Mamadou and Ramata reported receiving 16 gifts in cash. The most significant one was 100,000
FCFA in August 2011 when one of their sons gave them money to help them pay for an
upcoming marriage in their extended family, and they then used most of the money for a
transfer to the relative to pay for the dowry. The other transfers received averaged 7,600 FCFA
and were mostly from their adult children living outside the village – including in Bamako and
Ivory Coast. The other 10 transfers given by Mamadou and Ramata (apart from the one to pay
for the dowry) were smaller and given to family and friends for ceremonies and
holidays. Ramata stated making only one loan of 600 FCFA to a friend, but she enumerated
seven loans received, ranging from 150 FCFA to 5,000 FCFA for her income‐generating
activities, mostly from a wholesaler.
When we first interviewed the family, Ramata was a member of a tontine. She met weekly with
the twenty‐nine other women in the group and contributed 100 FCFA per week then increased
her contribution to 200 FCFA. Shortly after her turn to collect 3,000 FCFA, she decided to quit
the group. Ramata also kept very small sums of cash at home, but never reported saving more
than 1,000 FCFA. Mamadou saved larger sums, declaring saving up to 40,000 FCFA at home,
with an average of 17,500 FCFA during our visits. Neither used any formal savings institutions.
Other than small food purchases, the family spent an average of 870 FCFA every two weeks on
common expenses such as soap, batteries and matches. Eleven items of clothing were bought,
mostly by Ramata using her savings or tontine payout. Over the course of the interviews
Mamadou spent 78,500 FCFA on repairs to his cart, plough and other agricultural equipment. In
Februrary 2011 Ramata purchased 51,150 FCFA worth of household items, such as buckets and
pots.
194
CONCLUSION
Given the relatively old age of Mamadou and Ramata, the Boiré family can count on financial
support from their grown children, mostly those that emigrated outside the village. Large
expenses, such as Ramata's expensive medical procedure, were financed this way. Their
alternative strategy was the periodic sale of their rice stocks when in need of liquidity.
Mamadou being the head of the extended household, he had significant influence in the
decision‐making associated with sharing plots and selling the harvest.
CASE STUDY SEVEN ‐ Dembele Household (N’Toba)
Background and Household Composition
The Dembele household lives in the village of N’Toba, situated in the commune of Yangasso in
the circle of San. The Dembele family is the founding family of the village. Headed by Moussa
Dembele, 70 years old, of Bambara ethnicity, the household is composed of 12 members:
Moussa, his wife Sitan Tangara, 60, their 5 children ranging in age from 40 to 12 years old, one
daughter in law, and 4 grandchildren ranging from 9 to 10 years in age. Two of the oldest
children are married, and the two youngest, a girl of 15 and a boy of 12 are in school. The
Dembele household is considered to be a wealthy household compared to other households in
the community.
Agricultural Activities and Livestock
Moussa owned one and a half rain‐fed parcels of land (7 hectares) on which the family grew
sorghum, millet, maize, peanuts, rice and fonio. Moussa stated that he does not own enough
land to support his ever‐growing household and that year after year the quality of the soil is
depleting because all the arable surface is continuously used. Moussa always reserves a small
area for his wife Sitan in order for her to cultivate peanuts and rice that she sells at the market.
Because of the bad rains in the past few years, prices of cereals have gone up significantly: in
2012 he sold a 100kg bag of millet for 25,000 FCFA (50 USD), a 100kg bag of maize for 18,000
FCFA (36 USD), and a 100kg bag of sorghum for 20,000 FCFA (40 USD). In 2011, Moussa sold his
old oxen for 250,000 FCFA (500 USD) and bought a younger one for 190,000 FCFA (380 USD).
Unfortunately, he lost his 5 sheep to a pancreatic disease.
The household derived the majority of its revenues from selling grains. The household also
practices animal fattening when they have enough money to buy livestock, mostly sheep and
cattle. Moussa also lends his ox to other farmers for a fee. The household’s revenues have

195
increased in 2012 because they had high rice yields and were able to sell 300,000 FCFA (600
USD) of rice in one day.
Non‐Agricultural Livelihood Strategies
Moussa’s wife Sitan sells rice, peanuts, and vegetable that she grows in her garden to the local
market to complement the household’s main revenues. In addition, three of their children
seasonally migrate to the town of Ségou and even to the Ivory Coast to earn extra money for
the household. The household receives about 176,000 FCFA (352 USD) in remittances every
year.
Health and Education
Moussa and his wife Sitan are not educated and do not know how to read or write, however, all
of their 5 children went to school and are literate.
Malaria affected all the household members and the children in particular. They use a mixture
of medication and traditional medicine to treat malaria. The closest health center is situated 11
km away in the commune of Yangasso. Moussa and his wife have noticed an increase of malaria
cases in the past few years and attribute this surge to the poor nutritive value of their food. All
the household members use mosquito nets at night and all the children under five years of age
have been vaccinated.
Food Security
The household was able to cover all its food needs for the past 12 months (2011‐2012). Rice
yields were above normal and part of the production was sold at a substantial profit. The
Dembele household was able to give away cereal bags not only for the Zakat but also to other
needy households outside the village.
Savings and Financial Transactions
The household does not have any debt at the moment. Moussa was very clear in stating that
having debts is against Islam’s teaching because of the interests that are accrued and the belief
that debt destroys human dignity.
The only form of savings available to the household is their animals. Moussa buys young
animals and feeds them until they reach a certain age and then sells them for a profit. The more
animals they can feed the more profit they will make.
The Zakat is practiced in the village and Moussa’s household gives away once a year to poor
households. In 2011 they gave away 10 sacks of grain including sorghum, rice, and millet.
196
Conclusion
The Dembele household had not experienced any shocks in the past 5 years and despite a
growing household they have been able to meet all their food needs. Like many rural
households in Mali, the Dembele family used a variety of livelihood strategies to manage cash‐
flow, consumption and savings. They used a mix of sales of livestock and agricultural products
and in‐kind transactions to smooth their consumption over time. Although the Dembele did not
report any shock in the past 5 years, unexpected events such as illness or accidents require
access to cash or assets that are easily sold since the family does not rely on any formal credit
or savings institutions.
CASE STUDY EIGHT – Coulibaly Household (Kerebere)
Background and Household Composition
The Coulibaly household lives in the village of Kerebere situated about 10 km from the
commune of Fangasso in the circle of Tominian. The Coulibaly family founded the village and
holds great power as well as land in the community.
Koussa, 58 is the head of household and his wife Waba Kamate, 52 have 8 children ranging in
age from 7 to 29 years old. The entire household is Bobo. The eldest of their children is a
widower who lives with them. Only the two youngest children, a girl of 7 years and a boy of 10
years, attend school. All the other children work either in the agricultural fields, gardens,
participate in petty commerce or are occupied with domestic work. The Coulibaly household is
a wealthy household that owns many assets. Koussa owns a machine to process rice (which he
rents for a fee to other households who cultivate rice), a motor pump to irrigate the vegetable
gardens, 2 oxen‐driven ploughs, 2 motorcycles (one for his children and one for himself), and a
bicycle for the children. The household also owns flashlights as well as petrol lamps and their
house is situated less than 80 meters from a deep well.
Agricultural Activities and Livestock
Koussa owns one and a half rain‐fed parcel of land (a little over 5 hectares) where he grows
millet, sorghum, rice, nièbe, peanuts, and maize. His wife Waba and the children tend to the
vegetable gardens that are irrigated by a motor pump. They grow a wide variety of vegetables
including tomatoes, and onions. The sale of agricultural products and vegetables is the main
source of revenues for the household. They supplement their revenues by raising livestock. The
animals belong to both Koussa and his wife. Koussa owns 30 heads of cattle and 2 sheep. Waba

197
owns 10 goats and a few chickens for domestic consumption mostly. This year (2012), however,
they have not sold nor bought any animals.
Non‐Agricultural Livelihood Strategies
Aside from selling agricultural products and livestock, the Coulibaly household has no other
revenue generating activities. The two eldest daughters (18 and 20 years old respectively)
migrate seasonally to the capital Bamako to save money for their weddings and therefore do
not send any remittances home.
Health and Education
Koussa and his wife Waba do not know how to read or write and only their youngest children
go to school. The other 6 children (boys and girls) do not know how to read or write either.
The most frequent disease that strikes the household is malaria and the children are the most
affected. In addition, Koussa suffered from headaches and stomachaches. The family usually
seeks treatment with the health agent in Kerebere. There is no health center, however, so the
health agent receives people at his house or makes house visits. The government and several
NGOs have distributed free mosquito nets and all the family members regularly sleep under a
net. All the children were vaccinated.
Food Security
Koussa was able to satisfy the household’s food need for 2012 because he created a cereal
stock in prevision of bad harvests. The 2011 production only covered 4 months of food needs
but he was able to supplement his production with his cereal stock and the vegetables from his
wife’s gardens. He was not able to give away food in 2012 because he barely had enough for his
own family.
Savings and Financial Transactions
The Coulibaly household does not have any loans at the moment and no members of the
household belong to a savings group. In case of needs, Koussa was a little vague about his
strategy to cover their needs and all he said was that the household is able to find ways to face
their needs. Even though the Coulibaly household is considered wealthy, they were recipients
of the Zakat (alms) in the amount of 20,000 FCFA (40 USD) in 2012.
Conclusion
Even though Koussa and Waba belong to a relatively wealthy household, they face many
challenges typical to those of families in rural Mali. Their reliance on a good harvest for
subsistence and monetization places them in a precarious situation during bad years. Tight‐knit
198
networks of extended family and friends is what keeps them afloat during difficult times,
receiving gifts or requesting informal loans – and reciprocating for others in their times of need.
This is mutual help and reciprocity among members of an extended family is exemplified by
how the household was able to cope with the divorce of Koussa and one of his wives in 2011
and the drought that struck the region the same year. Within one year the household suffered
from a loss of assets (both material and labor) and a significant reduction in grain production.
With the help of family and their own stock the Coulibaly were able to weather these two
shocks. During this final interview, Koussa stated that in order to face shocks that seem to be
recurring at a much more frequent pace, the household needs to diversify its activities to
generate more revenues. The lack of money and credit, however, are the main reasons that
prevent him and his wife from investing in new activities.
CASE STUDY NINE – Coulibaly Household (N’Torrosso Dlesso)
Background and Household Composition
Lassina and Minata Coulibaly are part of a small, yet fairly wealthy household in the small
village of N’Torrosso Dlesso in the circle of San. Lassina, 55, and Minata, 45, are both Bambara
and have 2 sons, a 30 years old who is single and an 18 years who is married and just had a
baby boy in 2012. Lassina’s sister who is 70 years old is also part of the household. The
household owns quite a few material assets including 3 carts, 1 bicycle, 1 motorcycle, 1 large
radio with a memory card, and 10 mosquito nets, all of which are available to all members of
the household.
Agricultural Activities and Livestock
Lassina owns 8 hectares of rain‐fed agricultural land where he cultivates sorghum, millet, fonio,
and peanuts. He mentioned some irrigated parcels but declined to specify the size of these
parcels or what was cultivated on them. Lassina mentioned that the soil is less and less fertile
because his land is always cultivated and that he does not always have the money to fertilize his
land on a regular basis. Lassina and his wife also own 20 goats, 9 sheep, and 10 chickens. In
2011, Lassina bought an ox for 135,000 FCFA (270 USD) and mentioned that 2 of his goats were
stolen. Minata is in charge of the garden where she cultivates mostly tomatoes, onions, and
bitter eggplants. She has to irrigate the garden by hand, which requires a lot of work. Very often
her domestic tasks and the help she needs to provide her husband prevent her from tending
her garden and her production is fairly low.

199
Non‐Agricultural Livelihood Strategies
Aside from agricultural production, Lassina makes chairs which brings some revenues. Young
relatives migrate to large cities during the dry season to work as laborers and domestic help.
This year they brought back about 50,000 FCFA (100 USD). Overall revenues in 2012 were lower
than the previous years because of lack of rain and the crisis to the North.
Health and Education
Lassina and his wife are illiterate and only their 18‐year old son knows how to read and write.
Malaria is the disease that affects everyone in the family and the children in particular. This
year his oldest son was sick with malaria and could not work for 2 weeks. They are aware that
malaria is transmitted by mosquito bites and everyone in the household regularly sleeps under
mosquito nets. When someone in the household is sick they go to the health center to seek
treatment.
Food Security
In 2012 the Coulibaly barely had enough of their own grain production to cover the needs of
the entire households. To make ends meet until the harvest, Lassina sold many chickens, 5
sheep, and 2 goats. Lassina blames the lack of rain and the troubles up North for the poor
harvest and the general high prices of commodities.
Savings and Financial Transactions
Lassina belongs to a village agricultural group that provides labor for other farmers. He
borrowed money to buy chickens that he later sold for a profit. With the profit he reimbursed
the loan and bought more chickens. He also was able to lend money to his neighbors in need in
the sum of 15,000 FCFA (30 USD). The Coulibaly household gave away bags of grains and
vegetable to other households in the village that did not have enough food to last until the next
harvest. The Zakat is practiced in the village but the Coulibaly household is not a recipient
because there are other households in the village that are more needy.
Conclusion
In the past five years the Coulibaly have had to face several shocks including the death of a
family member, a major flood that damaged their house, a severe drought that lowered their
production, and agricultural input price hike. One of the major impacts of these shocks on the
Coulibaly family was a net reduction of their income. To face the situation the Coulibaly family
had to sell many of their animals, reduce their expenses by decreasing the number of necessary
items they could purchase, and take out loans. Taking out loans, however, put the family
further into debt.

200
Even though the Coulibaly household is relatively wealthy compared to other households in the
village, a series of shocks has severely strained their resources and stretched their adaptive
strategies to their limit.
CASE STUDY TEN – Dabo Household (Yabara)
Background and Household Composition
The Dabo household lives in the village of Yabara situated 25 km from the commune of
Tominian. The Dabo household is headed by George, a Bobo man of 44 years. George and his
two wives have 7 children ranging from 5 to 24 in ages. The household has few assets that
include a couple hurricane lamps, dabas, mosquito nets, 2 oxen, and 2 goats. There is a
traditional well in the house courtyard and a deep well located about 300 meters from the
house.
Agricultural Activities and Livestock
George owns one and a half acres of rain‐fed agricultural land in 2 separate parcels. George and
his family cultivate millet, fonio, sesame, and peanuts. Most of the time, the household does
not have enough money to buy inputs and instead uses manure and organic fertilizers. George
notices that the land is becoming less and less productive because his 2 parcels are always
cultivated and he cannot afford fertilizers. This year George did not buy any animals and lost 2
goats that were sick.
Non‐Agricultural Livelihood Strategies
The only source of revenue for the household is the sale of their animals and loans. In addition,
two of their eldest sons seasonally migrate as agricultural laborers. They are usually paid in kind
in the form of grains and therefore do not bring any money back home.
Health and Education
George and his 2 wives and all of their children except one are illiterate. George stated that he
needs his children to help him in the fields and that their labor is essential for the well‐being of
the household.
All the children in the household suffer from malaria and stomach aches. They usually rely on
traditional medicines to cure their ailments but when the children are too sick they take them
to the health center situated 4 km away in the village of Koula.

201
Food Security
This year the Dabos did not produce enough to cover the needs of the household for an entire
year. They have had to rely on food donations from friends and family. Solidarity within the
community has been the strategy they always rely on during hard times.
Savings and Financial Transactions
George took a 5,000 FCFA (10 USD) loan from a friend that he is paying back without interest.
His wife Thérèse belongs to an SfC group and currently has a loan of 5,000 FCFA (10 USD) to
help her husband buy food for the household. She would like to be able to invest money in
starting a petty commerce but her loans are always needed to buy food or to buy medication
for her children when they get sick, with malaria in particular.
In the past, the Dabos were able to help others with loans in cash or in‐kind but they have not
been able to do so in a few years because of their low agricultural production.
Conclusion
The Dabo family is on the verge of becoming a poor household because of the series of shocks
that they have not been able to mitigate. In 2011 a major drought nearly destroyed the entire
agricultural production. Both George and his wife had to take on loans to feed the family. The
general price increase of food and agricultural input has further pushed the family into debt.
Their acre and a half of land is not sufficient to produce enough food for the entire household
to last through the hungry season, particularly during bad years like in 2011. They are not able
to generate much additional income to supplement their farming production, even though they
would like to be able to invest their loans into more income generating activities. With no
savings and very few productive assets, the Dabos rely on their network of family and friends to
cope with difficult times.
CASE STUDY ELEVEN – Sangare Household (Nerekoro)
Background and Household Composition
The Sangares are a large and relatively wealthy household in the village of Nerekoro near the
commune of Teneni in the circle of San. The head of household, Tahirou, 45, is a Peul. He lost
his first wife in 2008 and is currently married to Sada Sangare. Tahirou has 7 children ranging
from 1 to 14 in age. His mother and his mother‐in‐law, his brother and his wives as well as 7
other family members are part of the household. The household possesses a variety of assets
including 3 cows, 2 calves, 6 goats, 5 sheep, and poultry. In addition, Tahirou owns a cart, one

202
motorcycle, one bicycle, one radio, mosquito nets for the entire household, and 2 parcels of
agricultural land.
Agricultural Activities and Livestock
On his 2 parcels of land (2 hectares) Tahirou cultivates millet and rice. The millet field is rain fed
while the rice field is irrigated. Tahirou allows other households to cultivate on his land for no
fees.
The Sangare household also owns animals that they usually sell at a good price. Sada, his wife,
owns one cow and her calf, 2 goats, 2 sheep, and some poultry. She sells milk and sour milk to
the town’s market to generate some revenues.
Non‐Agricultural Livelihood Strategies
The great majority of the household’s revenues come from the sale of animals, dairy products,
and the manufacture of ropes. As of 2012, no members of the household had to migrate
because not only the household produces enough grains but they have enough animals to sell
to generate revenues.
Health and Education
Tahirou and his 2 eldest sons are literate. His wife and the other children do not know how to
read or write.
Malaria is the disease that affects the entire family and the children in particular. All the
household members regularly sleep under mosquito nets. The family seeks treatment at the
health center of Koro and the medicines are bought at the pharmacy.
Food Security
Before 2011 the Sangares produced enough grains to feed the entire household through the
hunger season, but for the past 2 years Tahirou recognizes that his production and rice in
particular is decreasing because of the lack of rain. This year he had to sell a cow and 2 goats for
a total of 150.000F to buy food in order to go through the hunger period because his
production only lasted 7 months.
Savings and Financial Transactions
In 2011 Tahirou borrowed 14,000 FCFA (28 USD) from a village association he belongs to in
order to buy seeds. In 2012 he borrowed 46,000 FCFA (92 USD) to buy agricultural inputs to
boost his production. He needs to repay the entire loan by February 2013. He did not disclose
the amount of the interest. The household is also able to borrow money through Savings for

203
Change because Tahirou’s mother is a member of SfC. The money she borrows is mostly used to
buy food and clothes and medicine for the children. She is able to pay the weekly contribution
thanks to Sada who sells milk and other dairy products.
Last year, the Sangares sold one cow for 110,000 FCFA (220 USD) to pay for their oldest son’s
wedding and one sheep to reimburse a debt. In addition to taking out loans, Tahirou also lends
money to other members of his community. In 2012 he lent 15,000 FCFA (30 USD) to a friend
who was in need. The Sangares also contribute 2 sacks of grains (100 kg total) a year to the
Zakat that is practiced in their village.
Conclusion
The Sangare household is a wealthy household compared to other households in their
community. In the past 5 five years they had to face many challenges like the loss of Tahirou’s
first wife in 2008, a devastating flood in 2010, a severe drought in 2011 accompanied by a
general increase in commodity prices. The household lost a lot of its savings (the majority of
their savings resides in the number of animals they own) and had to sell many of their assets.
The Sangares were able to weather this series of shocks because they had enough animals to
sale in order to generate revenues. In addition, Tahirou’s second wife is able to generate
additional revenue through the sale of her milk and other dairy products. The household also
has access to loans through Tahirou’s membership to a village association and his mother’s
membership to the SfC group. This diversity of income generating activities and access to loans
in addition to the tight network of family and friends has allowed the Sangare household to be
more resilient when facing shocks.

204
APPENDIX C: VILLAGE PROFILES (NEW BARA RESEARCH SITES IN 2012)52 Baramandougou
The village of Baramandougou was established in November 1996. It is managed by a
community council of eleven members including two women. It is located in the circle of San
and is bordered to the West by the rural community of Fio and to the East by the rural
community of Fangasso (circle of Tominian), to the North by the rural community of Niassamary
(circle of Djenné), and to the South by the rural community of Tene. The commune is located in
the Sahelian zone that is characterized by a dry season that lasts about 6 months, followed by a
wet season of about 3 months and a cold season of about the same length. Vegetation is mainly
a grassy savanna interspersed with small spiny bushes.
The commune of Baramandougou comprises 10 villages including Bara, Mayarasso‐Sobala,
Sonina, Tourmourague, Kokoula, Poporone, Kera‐Marka, Kera‐Peulh, Kongosso, and Quine for a
total population of 10,214 inhabitants including 5268 women, and 523 households.
The village includes several ethnicities including Bobo (90% of the population), Sonrai,
Bambara, and Peulh that practice Islam, Christianity, and Animism. Blacksmiths and griots are
the two castes present in the village that is governed by a traditional village chief and his
council of elders.
The majority of the village households are agro‐pastoralists. Farmers mainly grow millet,
soybeans, rice, peanuts, onions, and tobacco. Livestock holdings include about 5560 cattle,
1273 donkeys, 722 horses, 8085 sheep, 9009 goats, 752 pigs, and various poultry. Some women
are artisans and make woven mats with millet stalks and pottery that they sell at markets. Petty
commerce is not well‐developed in the village because of its isolation and inaccessibility,
particularly during the rainy season. Women are also producing vegetables and fruits in their
gardens. The village created a cereal bank to improve access to food particularly during the
difficult rainy season.
The government plays an important role in the village and established a school, a market, a
community health center (CSCOM), and a city hall. The Rural Economic Institute (IER)
distributes drought‐tolerant seeds and provides agricultural training to farmers. World Vision
also plays an important role in the village and built 2 large diameter wells and latrines. World
Vision also provides loans from 100,000 to 500,000 FCFA (200 to 1000 USD) for six months with
10% interest rate. One project, ESSAME, helped to develop thirty hectares for rice cultivation
52 Detailed profiles for other villages in the 2012 sample that were also studied in 2009 are available in the 2010 Baseline Study report by BARA and IPA.
205
while another project, GRADD (groupement de recherche, action et dévelopement), provided
literacy classes for both men and women and built 7 wells throughout the village.
Women created 2 savings group comprised of 65 members. They drew inspiration from the SfC
group that exists in a village nearby. Men are very supportive of women becoming members of
savings groups. Men established 6 savings groups according to neighborhood. Both men and
women stated that there are many advantages to belonging to a savings group that include
closer relationship among members, mutual help, closer social ties, and setting an example of
good conduct for the rest of the community. There is also a village savings group called
Cineweinavi that was established in 2007 with the help of the NGO Caritas Mali. This source of
credit is not accessible to many women because a member has to have at least 5000 FCFA (10
USD) in guaranty and paid a member fee of FCFA 2,250 (4.50 USD).
A household in Baramandougou is defined by all the people in the family who live together. It is
the role of the head of household to provide food for the family and to make sure that
everyone else contributes their part to the well‐being of the family. All the important decisions
are made by the head of the household; depending on the family, the head might consult with
other members of the family before making a decision. The head of the households owns the
land, the house, the large livestock, and agricultural equipment. Women own their cooking
utensils and small livestock like goats and chicken. She is also in charge of her garden and its
products.
Agriculture and animal husbandry are the main economic activities. Men work in agricultural
fields during the dry and rainy seasons. Women will help them during the rainy season and at
harvest time. During the dry season (September through February) women work in their
gardens while men tend their livestock and repair houses.
Agricultural production in normal years barely meets the needs of most of Baramandougou’s
households. The village has been subject to drought, floods, pest infestations, and epidemics of
both people and livestock. In those years, production was severely reduced and many animals
died, causing food insecurity for many households. The hardest times of the year are in May
and during the rainy season just before the harvest when money is scarce and food reserves are
very low. The village has always faced food shortages through mutual aid rather than a change
in their economic activities. The coping strategies the most widely used are selling livestock,
selling personal items, and migrating to larger cities or even abroad. In the past 5 years,
migration has played an increasingly important economic role, with over 90% of households
that have at least one member who migrates to look for work and sends remittances home
(usually young men and women).

206
Kérébéré
The village of Kérébéré is situated 10 km from the commune center of Fangasso in the
Tominian circle. During the rainy season the village is practically inaccessible.
The population of Kérébéré is estimated at 1,062 inhabitants (60% women) and has about 185
households. The Bobo are the main ethnic group and the two castes present are the griots and
the blacksmiths. The village is governed by a traditional chief and his council of elders. At the
household level, the head of the households makes all the decisions in consultation with his
wives and the children who have reached their majority. The head of household has the
ultimate authority over all the other members.
Kérébéré is predominantly agropastoralist, with men prioritizing agriculture during the rainy
season and animal husbandry during the rest of the year. Women are increasingly involved in
petty commerce. In their gardens women produce onions and tomatoes during the off‐season
for sale in Fangasso, which is about 10 km away, although limited land and labor resources
constrain the development of this activity. Nonetheless, the economic freedom of women is
limited: a wife cannot sell goods without her husband's permission, even if they belong to her.
Major crops during the rainy season are millet, sorghum, beans and peanuts; most of the
production is used for household consumption. For wealthier households, animal husbandry is
the principal buffer against food insecurity, and households generally sell off animals in difficult
years to assure adequate food resources for the household. For the past several years
agricultural production has severally decreased because of recurring droughts.
Kérébéré currently receives support from World Vision and the government. World Vision in
cooperation with UACT (Union des agriculteurs du Cercle de Tominian) and UAPAD (Union des
agriculteurs pour la Production Durable) provides agricultural and water conservation training.
World Vision built the first large diameter well equipped with a pump; the second one was built
by a German project (GTZ) and funded by Saudi Arabia. World Vision also built the only school
in the village. These organizations have encouraged villagers to plant fruit trees for their
consumption including baobabs, mango trees and also eucalyptus trees to provide cooking
wood and medicinal leaves.
Migration is practiced by the majority of the households. The most difficult time in the village is
the ‘soudure’ period (August through September) when all food reserves are gone and cash is
low.
The majority of the women are members of tontines, except elderly women and unmarried
young women. They participate in collective work and the money earned is loaned to members.
The interest rate is 10% and the reimbursement period is flexible. This is the only form of credit
for women in this community.

207
The Coulibaly family (founder of the village) controls the majority of agricultural land, except
rice fields that developed in the plain nearby. This has become increasingly significant because
the community has nearly exhausted its available fields. Because all land has been distributed,
any increase in population leads to fragmentation of existing family plots. At present, close to
80% of the villagers do not own land. Instead, land is rented out in cash transactions, in which
labor is promised for three full labor days in each of the critical seasons: preparing, planting,
and harvesting the fields. At harvest, the renter also gives a portion to the landlord as a sign of
gratitude.
N’Toba
The village of N’Toba is located about 11 km from the commune of Yangasso in the circle of Bla
and it is surrounded by 7 hamlets. The dirt road that connects the village is in very bad
condition, particularly during the rainy season.
N’Toba’s population is estimated to about 2040 inhabitants divided into 135 households. These
households are comprised of 9 families including: the Dembeles (they founded the village), the
Daw (they are forgerons cast), the Diarra, the Coulibaly, the Traoré, the Diallo, the Touré, the
Dicko, and the Bakayoko. The three most represented ethnicities in the village are the Bambara,
Peulh, and Bobo as well as the griot and blacksmith castes. All the different ethnicities and
caste groups are active in the socio‐economic life of the community and all of them participate
in decision making processes. In the past the village was mostly animist, but in recent years
Islam has replaced it. A maderasa school was built in 2004.
The male head of the household is in charge of all the members of his households and has the
last word on all the decisions. Depending on the household, he can make the decision with his
wives and other adult males. Women only own their cooking utensils and some small livestock
while the head of the household owns everything else, including the children. In case of the
death of the head of the household, his brother or his eldest son inherits all of his properties
and in turn becomes the head of the family.
The infrastructure at N’Toba is very basic and has been provided mostly by World Vision and
UNICEF, including: 2 large diameter wells with pumps (that do not function anymore), latrines,
a small marketplace, a primary school with 6 classrooms built in 1996, a secondary school built
in 2012, and a cereal bank. The government of Mali has provided very little support to this
community. The large diameter well that was built by World Vision is managed by a village
committed that comprises both men and women. Each household has to contribute FCFA 1,000
(2 USD) per year for well maintenance and repair.

208
Agriculture and livestock are the two economic pillars of N’Toba. Sorghum, millet, maize, rice,
and peanuts are cultivated by both men and women during the rainy season. Animal husbandry
is also a significant pillar of the village economy and includes cattle, sheep and goats, donkeys,
horses, and chickens. Animal fattening for resale (l’embouche) is also a lucrative source of
revenue for households that can afford to purchase the animals. Larger animals in particular
constitute a form of savings that may be sold if significant capital is needed, or an emergency
arises. Many households have mangoes and baobab trees, which are important sources of both
revenue and food. In addition to agricultural work, household chores, and gathering fire wood
(5 km away), women cultivate their gardens from September to February and grow vegetables
and fruits for both revenue and consumption. NGOs have encouraged farmers to plant fruit
trees as well as eucalyptus and acacia as a source of firewood, building timber, and as way to
keep moisture and nutrients in the soil. In terms of livelihood strategies, migration has become
an essential strategy and all households in N’Toba have at least one member who migrates to
large cities in Mali (Ségou, Bamako) or even go abroad to Nigeria, Burkina Faso, and Côte
d’Ivoire
There are no men’s savings groups in the village; however, many women in N’Toba belong to a
group called Benkadi, which means agreement. There are other groups as well. The money
borrowed by the group is not invested in collective activity but rather split among the members
of the group. These groups provide the only local access to credit for women.
There is a savings group called CCR (Caisse de la Commune Rurale) in the commune of Yangasso
that opened in 2004. This is the only source of formal credit for the villagers. Loans are
obtained through village groups that constitute a guarantee. The interest rate is 5% for each
FCFA 5,000 (10 USD) borrowed.
Almost all households in N’Toba own agricultural land except for a few very poor families who
have to work in other people’s fields. About 30% of families practice collective work in other
farmer’s fields and are paid in cash for their work. The Zakat (Muslim almsgiving tradition) is
practiced in the village and all wealthy households donate a portion of their production to the
neediest members of the community.
Nérékoro
Nérékoro is a small village situated about 15 kilometers from the town of San and it is
connected to two hamlets, Néréba and Lamissa Wèrè. There are no land disputes among these
three communities. The village is comprised of 550 inhabitants including 34 households. The
population is divided into two main ethnic groups, the Sarakolé and Peulh and some castes
(Wolosso). All the decisions in the village are made by consensus and include all groups.
209
Men’s activities are focused on agricultural work, animal husbandry, fishing, and animal
fattening. Women help their husbands in the field, particularly during the rainy season and tend
their gardens. With the presence of Saving for Change, women are able to save some money
and invest in their gardens, petty commerce, and animal fattening. They contribute more
economically to the households and their husband can access loans through them.
The infrastructure of the Nérékoro is very basic and consists of a school built in 2003, a large
diameter well, and a damaged deep well, both built by World Vision. There is no community
health center (CSCOM) in the village and the closest facility is 3 km from the village.
World Vision plays an important role in the village. They built a deep bore‐hole well and a
center for adult literacy, and latrines. World Vision has helped the villagers set up a water
management committee to improve quality and access to water. The EPC technical agent
provides a link between the village and government structures and NGOs.
High prices for goods, lack of rain, and lack of water for gardens are the greatest problems cited
by community members. Deforestation is linked to wood being cut down for daily firewood.
Men and women have been planting neem and néré trees and mango trees around the village
and in the gardens to provide fruits, shade, and eventually firewood.
In Nérékoro, 98% of the women are members of Savings for Change groups. There are 3
different groups of 18 to 26 members each. Women usually need loans during the soudure
period (July through September) to buy seeds for their garden, invest in their petty commerce,
and animal fattening. They also use the loans to buy clothes for the children, pay their medical
expenses, and buy food for the household.
People in the village also have access to a microfinance institution called Soroyiriwa so in San.
This institution lends to groups only or a maximum of FCFA 250,000 (500 USD). The interest rate
is 10% and the loan has to be reimbursed within 6 months.
N’Torosso Dlesso
N’Torosso Dlesso is a small village situated about one kilometer from the commune of
N’Torosso in the circle of San. There are no hamlets associated with the village. The population
is estimated between 400‐500 inhabitants. The village chief and his council consult the villagers
and then make a decision in matters concerning the village.
Men and women practice agriculture during the rainy season. Men practice some income
generating activities during the dry season including animal husbandry and migration as well.
Women also have some income generating activities during the dry season including petty

210
commerce and their vegetable gardens. Many young people migrated during the dry season to
cities in Mali or coastal areas in West Africa.
There are no government services in the village, but World Vision installed a motorized pump
and constructed a cereal bank in the village.
In an attempt to fertilize the soil and conserve water, farmers plant fruit trees and non‐fruit
trees in their fields. They also place rocks along the perimeter of their fields to retain rain
water. Most farmers use organic fertilizers because commercial inputs are too expensive.
Despite their efforts, soils are being depleted and yields are lower.
There is a financial institution in N’Torosso and you need to be a member to take out loans. This
savings and loans institution was started by the villagers and each member contributed CFA
6,000 (12 USD) at the beginning. At the markets many women have heard of Saving for Change
in other villages and would be interested in starting their own groups. Women belong to
traditional tontines in the village and the money is mostly used for domestic consumption and
their gardens.
The main crops are sorghum, mil, rice, maize, beans, and peanuts. The majority of households
have vegetable gardens. Women are in charge of the gardens. Every household in the village
has land but some households have more land and of better quality than other households. The
most widely used strategies to face food shortages are selling livestock (small and large) and
borrowing money from family members, friends, and neighbors.
Yabara
The village of Yabara is located 25 kilometers from the town of Tominian in the circle of
Tominian. The dirt road leading to the village is in very bad condition particularly during the
rainy season.
The village is entirely composed of Bobo who are either Protestant or animist. The population is
estimated to be around 800 inhabitants divided among 100 households. There are two castes in
Yabara, the griots and the blacksmiths. The village is headed by a male chief and his five council
members.
The village has one school and six teachers. There is no health center but there is a health agent
in the village.
Agriculture and animal husbandry are the two main revenue generating activities. Some
households in the village are weavers and furniture makers. Women also gather and process
shea nuts that they sell at the market.

211
The government has invested very little in Yabara but many NGOs have contributed to improve
the infrastructure. World Vision installed a motorized pump and provided a community garden;
Enfants du Monde and Santé Sud built three classrooms; and Caritas Mali donated agricultural
equipment.
Many farmers plant trees in their fields including mango trees, baobab, néré, caicédrat, and
neem to fertilize the soil. They also pile rocks around the perimeter of their fields to prevent
water run off. Migration, selling animals and borrowing money are the only strategies that
villagers have to face during food shortages and difficult periods in general.
There is only one SfC group comprised of 25 women in the village. All the members were
trained by a technical agent and the group functions very well. More women would like to
participate in SfC but the technical agent only trained one group and no other groups have
formed as of yet. The women in SfC meet weekly and their contribution went from FCFA 25 (5
cents) to 100 (25 cents) per week. Women use the loans for petty commerce, to buy food and
to buy seeds for their vegetable gardens. During the soudure period, everybody in the village
needs money to face this difficult time. Women in the group stated that being members helped
them and their husbands get along better because now they both participate in the financial
responsibilities of the household. They also both learned how to save money through SfC,
something that they never did before. If a woman has a difficult time coming up with the
weekly contribution, her husband will help her. The goal of their group is to help each other in
times of need but also to raise enough money to build a cereal bank for the entire community.
Caritas Mali also provides loans with an interest rate of 10% and with a maximum loan amount
of CFA 200,000 (400 USD). Only members who have some form of collateral can borrow money
from Caritas.
N’Gorosso Peulh
N’Gorosso Peulh is located 11 kilometers from the commune of Djeli in the circle of San. The
dirt road leading to the village is in terrible condition and during the rainy season N’Gorosso
Peulh is virtually inaccessible, isolating its inhabitants from the surrounding communities.
The village was established about 200 years ago by Ségou Amadou. The village comprises about
460 inhabitants and includes 25 households. The population is composed of both Fulani and
Bambara ethnic groups, as well as two castes, the griots and the blacksmiths. Decisions
concerning the village are made during a general assembly in which all the inhabitants are
welcome. The final decision is made by the village chief who also is the imam. He is a renowned
imam and carries great authority over the village. He is very aware of what is happening in the
village as well as very vigilant concerning the different projects carried out by NGOs.

212
Beside the community health center, the government does not provide any help in terms of
infrastructure. The village needs are being met by World Vision that built two deep wells,
latrines, and a school. There is no market in the village and villagers have to go the commune of
Djeli to buy and sell their goods.
The two main activities are agriculture and animal husbandry. During the rainy season all the
men work in the fields. During the rest of the year they tend to their animals. Livestock is
abundant in the village and include cows, sheep, goats, donkeys, and poultry. Young men bring
their cattle to the Sikasso region for better pastures. Women are allocated small land parcels to
cultivate whatever crops they want. They also tend their vegetable gardens. The blacksmiths
make agricultural equipment and tools and their wives make pottery. Some women in the
village are weavers and sell their work at the market in Djeli. Some households have very small
parcels of land that are not sufficient to produce the food needed by their households
therefore they work in the fields of others and are usually paid in kind.
Farmers plant fruit trees in the vegetable gardens to fertilize the soil and gather the fruits to sell
on the markets. Farmers also place rocks all along the perimeter of their fields to retain
rainwater. There is also a community water management group to deal with water distribution,
sanitation, and use.
Saving for Change started 3 years ago in the village and the members were trained by a
technical agent. There are now two SfC groups that saved a total of FCFA 550,000 (1100 USD).
The second group was formed by a replicating agent and both groups function very well. The
loans are used mostly to invest in petty commerce, seeds for their gardens, and weddings. In
2012 most of the loans were used to buy food because of low harvest yields and high prices.
Women would like to be able to save more and collectively invest in a poultry business but their
households need to financial support of the loans because of the bad economic situation and
the poor harvests of the past few years.
The village chief encouraged all the women to participate in SfC because he really understood
the benefits of the program. He stated that he saw a positive change in the village since the
inception of the program. He says that it created a much stronger sense of cooperation among
women and in greater creativity and also between husbands and wives who seem to have less
conflict because they both participate in the financial obligation of their households.
A majority of women also belong to traditional tontines. It is interesting to note that there is a
close relationship between the SfC groups and the tontines and that very often they support
each other to support the cost of wedding, baptisms, and burials.
There is a group comprised of men from N’Gorossso Peulh and N’Gorosso Bambara that
created a community cereal bank. The majority of the households from both villages are

213
members of the cereal bank. Profits from cereal sales are used to lend money to members at a
20% interest rate.

214
APPENDIX D: CONTACT INFORMATION FOR RESEARCH TEAMS
Name Role in Study Affiliation Email Address
Dr. Mamadou
Baro
Principal
Investigator (PI)
Bureau of
Applied Research
in Anthropology
(BARA), Univ. of
Arizona
Dr. Lori Beaman PI Innovations for
Poverty Action
(IPA)
Micah Boyer Research
Associate
BARA [email protected]
Sarah Custer
Project
Associate
IPA scuster@poverty‐action.org
Dr. Tara Deubel Research
Associate
BARA [email protected]
Megan Gash Research and
Evaluation
Specialist
Dr. James
Greenberg
PI BARA [email protected]
Dr. Dean Karlan PI IPA [email protected]
Dr. Clelia Anna
Mannino
Researcher Oxfam America [email protected]

215
Dr. Janina
Matuszeski
Research
Coordinator,
Community
Finance Dept.
Oxfam America [email protected]
Marie‐Blanche
Roudaut
Research
Assistant
BARA [email protected]
Jaye Stapleton Research
Manager
IPA j‐[email protected]
Dr. Bram
Thuysbaert
IPA Coordinator IPA bthuysbaert@poverty‐action.org