full report
39
AIR FLOW ANALYSIS AND DESIGN IN SINGLE CYLINDER FOUR STROKE ENGINE A PROJECT REPORT Submitted to MAHATMA GANDHI UNIVERSITY By ARUN R ATHUL K MERVIN JOE THOMAS RAHUL M.R in partial fulfilment for the award of the degree of BACHELOR OF TECHNOLOGY IN MECHANICAL ENGINEERING DEPARTMENT OF MECHANICAL ENGINEERING MAR ATHANASIUS COLLEGE OF ENGINEERING
Transcript of full report

AIR FLOW ANALYSIS AND DESIGN IN SINGLE CYLINDER
FOUR STROKE ENGINE
A PROJECT REPORT
Submitted to
MAHATMA GANDHI UNIVERSITY
By
ARUN R
ATHUL K
MERVIN JOE THOMAS
RAHUL M.R
in partial fulfilment for the award of the degree
of
BACHELOR OF TECHNOLOGY
IN
MECHANICAL ENGINEERING
DEPARTMENT OF MECHANICAL ENGINEERING
MAR ATHANASIUS COLLEGE OF ENGINEERING
KOTHAMANGALAM 686 666,
KERALA, INDIA.
MARCH 2014

CERTIFICATE
This is to certify that the project report entitled “AIR FLOW ANALYSIS AND DESIGN
IN SINGLE CYLINDER FOUR STROKE ENGINE” submitted by ARUN R, ATHUL
K, MERVIN JOE THOMAS and RAHUL M.R to the Mahatma Gandhi University
Kottayam, Kerala in partial fulfillment for the award of Degree of Bachelor of Technology in
Mechanical Engineering is a bonafide record of the project work carried out by him under my
supervision during the year 2013-2014.
Dr. Josephkunju Paul C
Professor and HOD
Department of Mechanical Engineering
Mr. Biju Cherian
Assistant Professor
(Project Guide)
MAR ATHANASIUS COLLEGE OF ENGINEERING
KOTHAMANGALAM 686 666
KERALA, INDIA

ACKNOWLEDGEMENT
First of all we thank GOD ALMIGHTY for making this project work a success. We would
also like to extent our thanks to our HOD, Dr. JOSEPHKUNJU PAUL for giving us this
opportunity to do this project. We also thank our PROJECT GUIDE, Mr. BIJU CHERIAN
for giving us proper guidance without which this project would not have been possible. We
would also like to extent our deepest gratitude to Dr. BENNY PAUL (asst. prof,
mechanical dept., MACE) and Dr. JAMES GUNASHEKHARAN (professor of
mechanical engineering, Annamalai University, Chidambaram- Tamil Nadu) for all the
effort and time they spent to help us complete our project. Last but not least, we thank all our
friends and family for supporting us in this endeavour.

LITERATURE REVIEW
Simple experimental tests in steady-state flow regions have been used on a regular basis to
characterize the flow motion generated by the induction system and more recently Yun, who
defines additional parameters to evaluate the bulk motion of in cylinder flow. In combination
with simple phenomenological models, such as those developed and used by Desantes et al.,
Davis and Kent, Dent and Derham and Murakami et al., these experimental procedures help
the determination of several fundamental variables that define the flow inside the cylinder.
The advantage of this type of approach lies in that it is easy and fast, but the information
provided is not detailed enough, and the assumptions made may lead to inaccurate results. An
alternative experimental technique is the measurement of the velocity field in the steady flow
test rig using Laser Doppler Velocimetry (LDV). This method provides high quality results
and more information than the conventional methods, but when compared from an expense
and time point of view, it is less efficient. The Laser Doppler Velocimetry technique is more
aptly used to measure the velocity field inside the cylinder while the engine is working,
although this requires expensive equipment and good optical access to the combustion
chamber. Several calculations of the flow in engine cylinders have been previously presented.
Zur Loye et al. and Kono et al. performed calculations of the compression stroke. In
particular, Kono et al. presented an analysis of the swirl intensity effects on spray formation
and obtained reasonable agreement with experimental data. However, since the intake
process was not included in the calculation, the initial swirl was imposed as a parameter.

ABSTRACT
Key Words: Air flow analysis, CREO, ANSYS GAMBIT, STAR – CD, Swirl velocity
This project discusses the predicted flow structure inside the cylinder of a Hero Honda cd-
100ss engine with three-dimensional modelling of engine cylinder having two different entry
angles (300 and 900) at 1500 rpm. Swirl velocities and turbulence inside the cylinder during
suction stroke for the above mentioned entry angles under cold combustion conditions were
compared.
The air flow motion within the engine cylinder was analysed using the STAR–CD simulation
software, which is an exclusive software for automobiles. Based upon the considered two
cases which are the various inlet manifold angle configurations, the most optimized design
will be concluded. The STAR–CD results of the mean swirl velocity of the engine for
different inlet manifold angles to the combustion chamber at the end of suction stroke was
obtained. The results obtained showed that inlet manifold angle of 90 degrees was found to
give better swirl motion within the engine cylinder than 30 degree inlet manifold angle of the
Hero Honda cd 100ss engine.

CONTENTS
ACKNOWLEDGEMENTS………………………………………………………………
ABSTRACT………………………………………………………………………………..
LITERARURE REVIEW………………………………………………………………
LIST OF FIGURES……………………………………………………………………….
CHAPTER 1: INTRODUCTION…………………………………………………………
CHAPTER 2: CFD APPROACH
2.1 INTRODUCTION…………………………………………………………………
2.2 STRATEGY OF STAR-CD……………………………………………………….
2.3 APPROACH…………………………………………………………………………
CHAPTER 3: MODELLING AND DISCRETISATION
3.1 CREO MODELLING SOFTWARE………………………………………………..
3.2 ANSYS GAMBIT MESHING SOFTWARE………………………………………
3.3 MESHING TECHNIQUE…………………………………………………………
CHAPTER 4: SOLUTION PHASE – CFD SIMULATION
4.1 INTRODUCTION…………………………………………………………………..
4.2 GEOMETRY………………………………………………………………………..
4.3 BOUNDARY CONDITIONS……………………………………………………….
CHAPTER 5: POST PROCESSING PHASE
5.1 INTRODUCTION…………………………………………………………………….
5.2 VELOCITY VECTOR DIAGRAMS…………………………………………………
5.3 AIR PARTICLE MOTION DIAGRAM………………………………………………
5.4 KINETIC ENERGY PLOTS………………………………………………………..
RESULTS AND CONCLUSIONS…………………………………………………………
REFERENCES………………………………………………………………………………..

LIST OF FIGURES
Figure Title Page
3.1 Model created in CREO
3.2 Meshed model created using GAMBIT
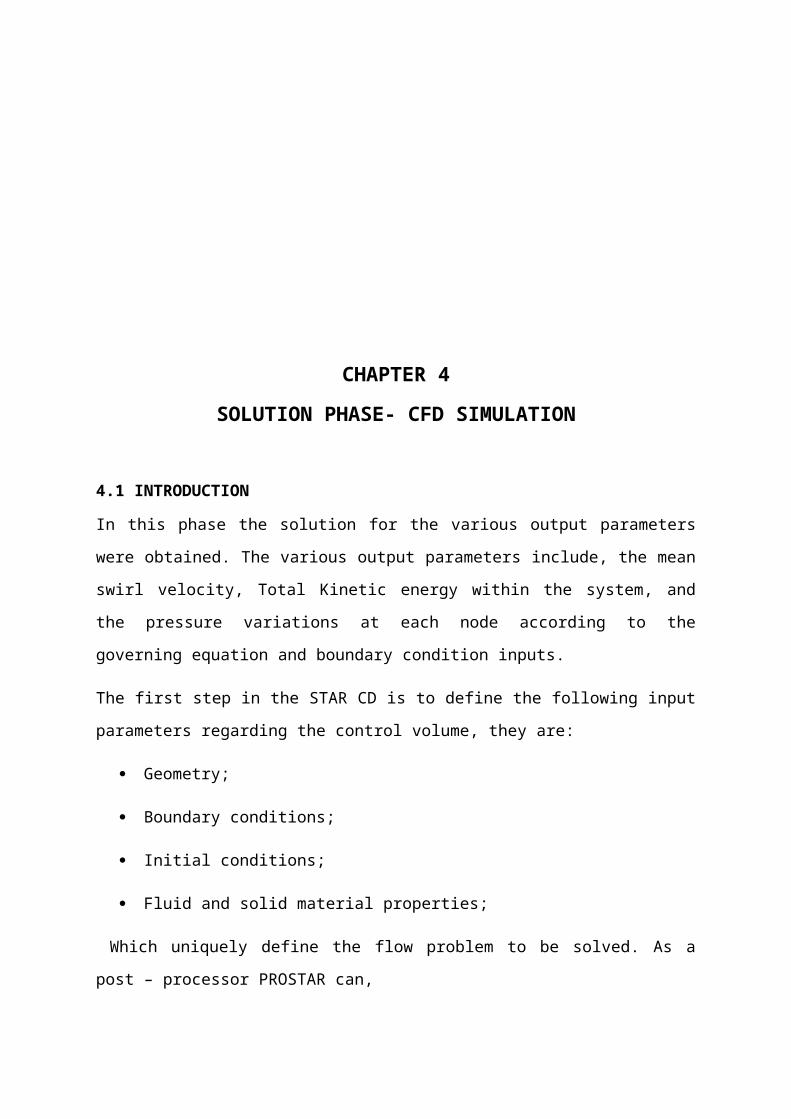
4.1 90˚ Manifold in STAR-CD
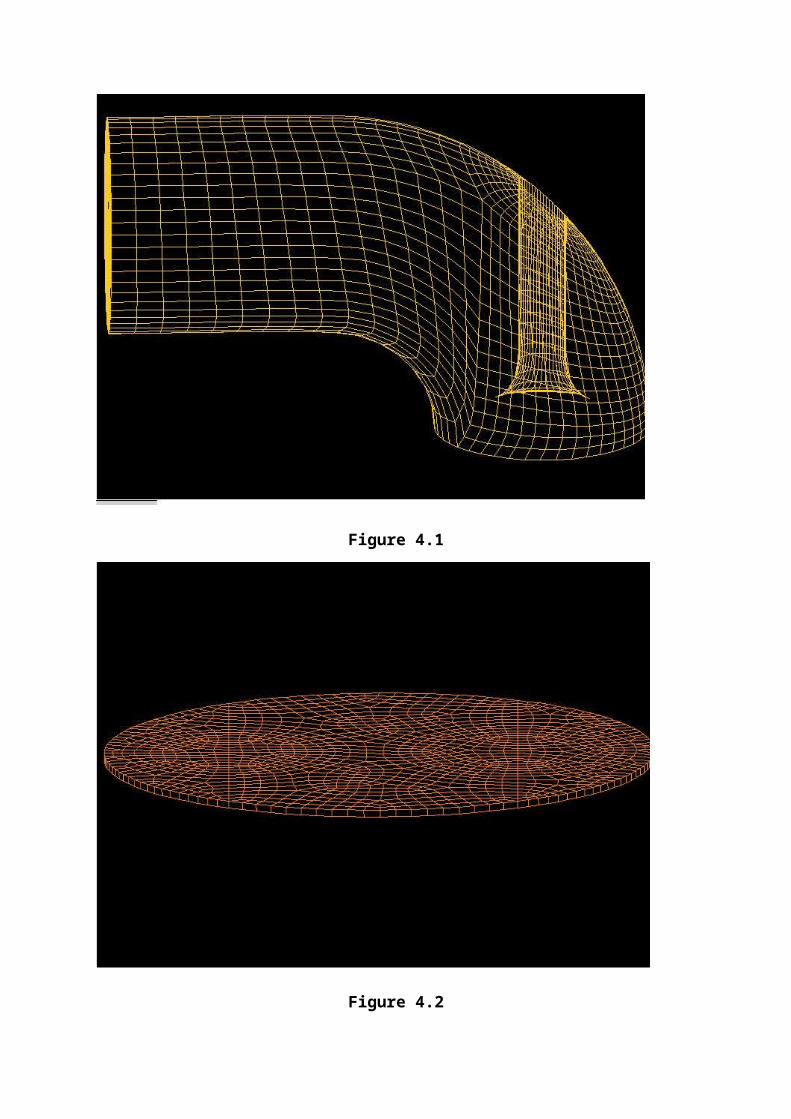
4.2 Single layer of engine cylinder in STAR-CD
4.3 Baffle created for pistin head in STAR-CD
4.4 Fully assembled engine cylinder in STAR-CD
5.1 Velocity vector plot of 90˚ inlet manifold
5.2 Velocity vector plot of 30˚ inlet manifold
5.3 Air particle motion diagram of 90˚ inlet manifold
5.4 Air particle motion diagram of 30˚ inlet manifold
5.5 Kinetic energy plot of 90˚ inlet manifold
5.6 Kinetic energy plot of 30˚ inlet manifold

CHAPTER 1
INTRODUCTION
All leading engine manufacturing companies are trying to create engines that are more fuel
efficient, more comfortable and with lesser emissions and noise. We live in a world, where
the conventional fuels are getting depleted fast and where the environment is deteriorated by
the harmful emissions from engines. Moreover, each year, world-wide organisations establish
stringent restrictions stating lesser emissions and better fuel economy. This in turn forces the
companies to do experiments and tests to improve the features of the engine to support a
sustainable future.
The conventional tests performed on an IC engine includes the load test, brake power test,
volumetric efficiency tests, etc. These traditional testing method involves the need of running
an actual engine. Such an action leads to the consumption of fuel, utilisation of man-power
and uptake of time on a staggering level. A viable alternative is the use of ‘Computational
Fluid Dynamics’ in place of manually performing these tests. The advent of high speed
digital computers combined with the development of accurate numerical algorithms for
solving physical problems on these computers has revolutionised the way we study and
practice fluid dynamics today. An abundant number of CFD packages are available in the
market in the present market with varying capacities. Few of the simulation software’s
includes the FALCON software, DAVYS software, Ansys Fluent. An apt CFD package can
be utilised for the analysis or testing of an engine. The main advantage of such CFD packages
is that the physical presence of an IC engine is redundant. We have the option to create a
model of the engine using suitable modelling software which are transferred into the CFD
packages to run the required analysis. Considering the parameters necessary for output which
includes swirl velocity, total Kinetic energy and pressure variations within engine cylinder,
we have chosen the STAR CD software which is an exclusive software for IC engines. STAR
-CD is an acronym which stands for Solver for Turbulent Air Flow Regions – Computational
Dynamics. Both static and cyclic analysis could be performed using this software. In this
project the static analysis for various inlet manifold configurations were considered.

The success or failure of fluid simulation depends not only the code capabilities, but upon
also upon the input data, such as:
Geometry of the flow domain;
Fluid properties;
Boundary conditions;
Solution control parameters.
In order to minimize the complexity of project the analysis was done assuming the cold
combustion process. Cold combustion implies the entry of air alone into the engine cylinder
and not the entry of both fuel and air. Thus, this analysis gives a rough picture regarding the
actual combustion process. Based on the output parameters obtained from STAR CD which is
in the form of velocity vector diagrams, velocity plots and air particle motion plots the
optimised design of the above mentioned configurations is concluded.
This project involves the following stages:
1) Pre – processing Phase : Discretisation of volume using Ansys GAMBIT
2) Solver Phase : Simulation using STAR – CD
3) Post Processing Phase : Optimisation of engine design based on obtained plots.

CHAPTER 2
CFD APPROACH
INTRODUCTION
The aim of this section is to introduce the most important issues involved in setting up and
solving a thermo fluids problems using a computational fluid dynamics course. Although the
discussion applies in principle to any such code, reference is made where appropriate to
particular capabilities of the STAR-CD system. The process of the computational flow
simulation does not usually start with a direct use of a CFD code. It is indeed important to
recognise that STAR-CD, or any other CFD, CAD or CAE systems, should be treated as a
tool to assist engineer in understanding physical phenomena.
STRATEGY OF STAR-CD
Broadly, strategy of STAR-CD and any CFD software is to replace the continuous problem
domain with a discrete domain using a mesh or grid. In the continuous domain each flow
variable is defined at every point in the domain. For instants, the velocity V of an air particle
in the continuous domain is given as
V=v(s), 0<x<1)
In the discrete domain each flow variable is defined only at the grid points. So in the discrete
domain the velocity of air particle would be defined only at the end grid point.
Pi=p (xi). I=1, 2… N

Continuous Domain Discrete
0 ≤ X ≤ 1 X=X1, X2 ….XN
X=0 X=1 X 1 X i
XN
Coupled PDEs + boundary Xn Grid point
Conditions in continuous boundary Coupled algebraic equations
Variables in discrete variables
APPROACH
The first step is to create a computer model of the engine cylinder which is to be analysed.
The modelled engine cylinder was then imported to the ANSYS GAMBIT, where the
meshing was done. The meshed volume was then opened in the simulation software which is
the STAR CD window. Here the first step is the creation of the control volume and creation
of grid needed for the solver phase. This is then followed by the setting of boundary
conditions. Then the system analysis of the control volume and results were obtained in the
form of vector diagrams and plots. The obtained plots were then compared and the results
were concluded.

CHAPTER 3
MODELLING AND DISCRETISATION
3.1 CREO MODELLING SOFTWARE
Modelling refers to creating a 3D geometry replica of the experimental setup. It is here that
the actual simulation process of the engineering problem begins. Modelling in the CFD
means to generate the fluid flow path geometry that is creating the space through which the
fluid (air in our case) flows. This can be done using any suitable software. The model for this
project was done using the CREO Parametric 2.0 modelling software. The modelling requires
the precise definitions of the physical system geometry, material properties and flow
conditions based on the best available understanding of the relevant physics.
Figure 3.1

3.2 ANSYS GAMBIT MESHING SOFTWARE
The process of subdividing the domain into a mesh of discrete, finite, contiguous volume
elements or cells is called as the volume discretisation and is an essential part of the
simulation process. Creation of a lattice of finite volume cells to represent the solution
domain is normally the most time consuming task in setting up a CFD model
The meshing process includes the following necessary tasks:
Planning the computational mesh (e.g.: number of cells, size and distribution of cell
dimensions, etc.)
Looking up numerical values for appropriate physical parameters (e.g.: density,
viscosity, specific heat, etc.)
Choosing the most suitable modelling option from what is available (e.g.: turbulence
model, combustion option, etc.)
The user also has to balance the requirement of physical fidelity and numerical accuracy
against the simulation cost and computational capabilities of the system. The main tasks
involved at this phase are:
Creating a computational mesh to represent the flow domain (i.e.; the model
geometry).
Specifying the thermo physical properties of the fluid present in the simulation.
Setting the solution parameters and output data formats.
Specifying the location and definition of boundaries and, for unsteady flow simulation
problems , further definition of transient boundary conditions and time steps
Writing appropriate data files as input to the analytical run for the simulation in the
STAR-CD.

Fig
ure
3.2

In creating a finite volume mesh, the user should aim to represent accurately the following
two entities:
1. The overall external geometry of the solution domain, by specifying an appropriate
size and shape for near boundary cells. Small inaccuracies may occur because all
boundary cell faces (including rectangular faces) are composed of triangular facets.
2. The internal characteristics of the flow regime. This is achieved by careful control of
mesh spacing within the solution domain interior so that the mesh is finest where the
flow characteristics change most rapidly.
Mesh Spacing Considerations
The chief considerations governing the mesh spatial arrangements are:
Accuracy - primarily determined by mesh density and, to a lesser extent, mesh
distortion.
Numerical stability - this is a strong function of the degree of distortion.
Cost - a function of both the aforementioned factors, through their influence on the
speed of convergence and CPU time required per iteration or time step.
Thus the user should aim at an optimum mesh arrangement which
Employs the minimum number of cells,
Exhibits the least amount of distortion,
Is consistent with the accuracy requirements.
The various computational cell shape available in the ANSYS GAMBIT are
Hexahedra
Prisms
Tetrahedral
Pyramids
Polyhedral
Hex cooper

In this project hex cooper computational cell shape was chosen for the meshing of the volume
because of its more symmetric nature.
MESHING TECHNIQUE
The most appropriate initial step when building a mesh is to decide on the number and
distribution of cells to be used. The amount of time spent on the planning of mesh generation
is usually dependent on the complexity of flow domain geometry. Steps involved in the
meshing of the solid created.
The solid created in the creo software is transferred to gambit in the ‘.iges’ format.
The solid is then split into fifteen different pieces. Each piece is separated by copying
the split volume and moving it to a suitable distance.
Each piece is meshed individually. Since each piece has a specific shape and size, the
number of nodes are pre-specified to control the mesh formed.
Each edge is assigned a specific number of nodes. These nodes act like points where
the mesh converges on the edges. The number of nodes on adjoining or coincident
edges must be of the same number and aligned to each other. Otherwise the meshing
will not be proper.
After the number of nodes are specified we create a surface mesh on the solid on one
of the faces. The mesh is of map-pave type.
Next we link the meshed face to the face geometrically opposite to the meshed face.
This is very important as the success of the volume mesh depends greatly on this step.
If the linking is done in a wrong manner the volume mesh will not be created
successfully.
After linking, the second face automatically gets a surface mesh created on it.
The next step is the creation of the volume mesh. Volume mesh of the hex-cooper
type is chosen for this specific case. The source faces are provided as the two linked
faces.

When a volume mesh is created, the colour of the mesh created is a bit darker yellow
in colour than the surface mesh.
The inlet manifold is split into 2 pieces before it is meshed. The same procedure is
followed for the individual pieces.
After each individual piece is meshed, all of them are assembled back together to
form the original solid model. This model is saved as a neutral file in the ‘.neu’
format.

CHAPTER 4
SOLUTION PHASE- CFD SIMULATION
4.1 INTRODUCTION
In this phase the solution for the various output parameters were obtained. The various output
parameters include, the mean swirl velocity, Total Kinetic energy within the system, and the
pressure variations at each node according to the governing equation and boundary condition
inputs.
The first step in the STAR CD is to define the following input parameters regarding the
control volume, they are:
Geometry;
Boundary conditions;
Initial conditions;
Fluid and solid material properties;
Which uniquely define the flow problem to be solved. As a post – processor PROSTAR can,
Read and reformat the various data files produced by the analysis;
Manipulate the data read in;
Produce extensive and easily comprehensible printouts;
Summarise informations on the calculated results;
Animate those images;
Draw graphs for various calculated quantities.
4.2 GEOMETRY
The basic skeleton from which the analysis begin is from the geometry. In this project the
skeleton was first created in the CREO modelling parameter, which was then imported to the
GAMBIT for meshing. The meshed form of the control volume which in this case is the
engine cylinder, was imported to STAR-CD in the ‘.neu’ format.

Figure 4.1
Figure 4.2

The imported geometry was then split into different volumes, which includes manifolds, the valve, the piston head shape, etc.. Then the general information needed for analysis was then specified. The general information on the problem at hand includes:
Number of cells
Number of boundaries specified
Computer memory requirements
The model’s overall dimensions
The frequency and extent of restart, post processing and screen output.
This was then followed by the creation of baffle for each of the control volume. Baffle
basically refers to a thin layer of the section considered. So, at the time of analysis the baffle
of the respective control volume is extruded between the necessary number of layers at the
required thickness.
Figure 4.3

For example, the blue surface shown in the figure 4.3 represents the baffle of the engine
cylinder. At the time of analysis of the engine cylinder the baffle layer is made to be extruded
from the BDC to the TDC within which the engine piston moves.
4.3 BOUNDARY CONDITIONS
After the creation of the geometry, the next important step to be followed before the analysis is to
specify the various boundary conditions. The important boundary condition considered in this
project are:
Intake port Constant Pressure (800Pa)
Length scale 1mm
Temperature Ambient Temperature (303K)
Wall type Smooth Wall
Wall heat type Adiabatic
Table 4.1
Intake Port: In this project the pressure variation within the engine cylinder is
considered to be negligible. Under the actual combustion process the pressure within the
engine cylinder is normally ranging between 1500Pa to 2000Pa. But in this project the
cold combustion was assumed. So, under this condition very high pressure and
temperature is not formed. Therefore, here in order to lower the complexity a constant
pressure of 800Pa was assumed within the engine cylinder. The inlet manifold angle for
the Hero Honda cd-100ss engine was measured to be 30 degrees.
Length scale: This is defined as the depth up to which the simulation occurs at a
particular instant. Smaller the value of length scale higher is the accuracy of the results
obtained. But smaller the length scale, higher would be the time taken for running. This in
further demands higher capacity computers. But in order to lower the running time and
complexity we have chosen an intermediate length scale of 1mm.

Temperature: The temperature within the engine cylinder was considered to be same as
that of the ambient atmosphere, as in this project cold combustion was assumed. In the
cold combustion process the burning of fuel does not occur as the entry of air alone into
the combustion chamber was considered. Therefore, the temperature of the ambient
atmosphere was taken which is 303K.
Wall Type: In order to lower the complexity of this project the presence of projections
and cooling fins along the outside surface of the cylinder was eliminated and assumed to
be smooth. Therefore the wall type was chosen to be the smooth wall type which is the
most basic option available.
Wall Heat Type: The wall heat type in this project is assumed to be adiabatic in nature,
i.e. heat transfer between the engine cylinder and surrounding is assumed to be zero.
I. Initial Conditions: In this project the valve is assumed to be in the open condition and
the piston is assumed to be in Bottom Dead Centre (BDC).Here static analysis of the
control volume is considered. Therefore the output obtained from the STAR CD is in the
form of static velocity plots and vector plots.
II. Fluid and Solid Material Properties: Both fluid and the material properties of the
engine cylinder and the piston must be specified at the time of analysis. For each stream,
the information supplied includes
The variables calculated, including the turbulence model, selected and the appropriate
characteristic length.
The thermophysical properties specified, such as density, viscosity, specific heat and
conductivity.
The reference pressure and temperature any fixed boundary fluxes included in the
model.
The fluid region in the case of conjugate heat transfer applications depends upon the
properties for solid regions such as density, specific heat and conductivity. The fluid and
solid region properties are followed by data specification for the two standard body forces,
namely
gravitational acceleration
rotation about user defined axis

Figure 4.4
CHAPTER 5
POST PROCESSING PHASE
From the solver phase which was explained in the previous chapter the result can be obtained
in the form of velocity vector diagram, velocity plots and air particle motion diagrams. From
these plots the various result and conclusions were made.
Here, the analysis of Hero Honda cd-100ss engine which has 30 degree inlet manifold angle,
was done and the results obtained in the form of plots and diagrams were compared to the
similar results of 90 degree inlet manifold angle.
5.1 VELOCITY VECTOR DIAGRAMS
The above figures represents the velocity vector diagrams for both Hero Honda cd-100ss
engine and the 90 degree inlet manifold angle design, for the same initial boundary
conditions. Here, the analysis was done for that particular instant when the piston is
positioned at the bottom dead centre and the valve in the fully opened conditions.
From the above two figures it is very clear that the distribution of the high velocity vector
particle is more uniformly distributed in the case of the 90 degree inlet manifold angle, while
that in the Hero Honda engine is concentrated more at a particular region within the engine
cylinder. From this we can infer that the kind of swirl motion happening within the engine
cylinder is better in the case of 90 degree inlet manifold than that of the Hero Honda engine
design.

Figure 5.1
Figure 5.2
5.2 AIR PARTICLE MOTION DIAGRAM
The above two figures shows the air particle motions in the two engine design considered at
the particular instant when the piston is positioned at the BDC and the valve is in the
completely opened position. From the above two figures it is clear that the turbulence of the
single air particle is faster and efficient in the case of 90 degree inlet manifold angle than the
Hero Honda engine design. Also, from these figures it could be concluded that the swirl
motion is more efficient in the case of 90 degree inlet manifold angle than the Hero Honda
inlet manifold angle.
Figure 5.3
Figure 5.4

5.3 KINETIC ENERGY PLOTS
The above figure represents the variation of the Kinetic Energy within the engine cylinder for
both 90 degrees inlet angle and for the Hero Honda Engine. In the case of Hero Honda engine
the concentration of the higher velocity particle is more concentrated at the upper half of the
engine cylinder. So, the tendency for the air particles in the next stroke when the exhaust
valve opens is more than that in the case of 90 degrees inlet manifold, as in this design the
higher velocity air particles is concentrated at the lower half of the engine. Hence, from the
Kinetic plots also it could be concluded that the 90 degrees inlet manifold design is better
than the Her Honda engine design.
Figure 5.5
Figure 5.6

CONCLUSIONS
• The value of mean swirl velocity is higher at regions closer to the engine cylinder
wall.
• The mean swirl velocity decreases on moving from TDC to BDC.
• 90 degree inlet manifold angle has been proven to have better swirl motion than 30
degree inlet manifold angle (Hero Honda cd-100ss engine).

REFERENCES
• Connor, O., J. F., McKinley, N. R, CFD simulation of intake port flow using
Automatic Mesh Generation and Comparison with Laser sheet, Swirl and LDA
measurement for steady flow conditions, SAE Paper No.9801291, (1998).
• Han-Sang Kim., Sang- Bong Park., Cha-Lee Myung., Kyoung-Min Cho., Kum-
Jung Yoon, A study of flow characteristics inside the two types of exhaust manifold
and CCC system SAE Paper No. 1999-01-0457, (1999).
• Zhao,Y., Winterbone,D.E., A study of multi-dimensional gas flow in engine
manifold., Proc. Instn. Mech. Engrs. Vol 208, 1994, pp 139-145.
• Wikipedia
• Google books
• howstuffwork.com