Full paper (2.4 MB)
16
INTERNATIONAL JOURNAL ON SMART SENSING AND INTELLIGENT SYSTEMS VOL. 7, NO. 2, June 2014 658 TRIBOACOUSTIC LOCALIZATION SYSTEM FOR MOBILE DEVICE - ENVIRONMENTAL EFFECTS TO ACCURACY Yeng Weng Leong a,b , Hiroaki Seki a , Yoshitsugu Kamiya a , Masatoshi Hikizu a a Graduate School of Natural Science and Technology, Kanazawa University, Kakuma-machi Kanazawa, Ishikawa 920-1192, Japan. b Department of Electronics and Communication Engineering, UNITEN, Jalan IKRAM- UNITEN, 43000 Kajang, Selangor, Malaysia. Emails: [email protected],[email protected], [email protected], [email protected] Submitted: Mar. 20, 2014 Accepted: Apr. 26, 2014 Published: June 1, 2014 Abstract - This paper simulates and discusses about the probable causes of error which might occur due to the environmental settings of the triboacoustic localization prototype previously developed. Erroneous conditions studied are sensor offsets and temperature mismatches while existing errors due to equation deficiencies are taken into considerations. Descriptions of the prototype's hardware and combinational system functionality which is to be simulated is described prior to the simulation and experimental step. It was found through simulations and verified via experiments that some environmental settings do have a large impact upon final outcome ( x,y offset and z offset) while some have negligible effects to the final outcome( temperature). Index terms : Triboacoustic localization, simulated errors, wearable computer, mobile device;
Transcript of Full paper (2.4 MB)

INTERNATIONAL JOURNAL ON SMART SENSING AND INTELLIGENT SYSTEMS VOL. 7, NO. 2, June 2014
658
TRIBOACOUSTIC LOCALIZATION SYSTEM FOR MOBILE
DEVICE - ENVIRONMENTAL EFFECTS TO ACCURACY
Yeng Weng Leong a,b, Hiroaki Seki a, Yoshitsugu Kamiya a, Masatoshi Hikizu a
a Graduate School of Natural Science and Technology, Kanazawa University, Kakuma-machi
Kanazawa, Ishikawa 920-1192, Japan.
b Department of Electronics and Communication Engineering, UNITEN, Jalan IKRAM-
UNITEN, 43000 Kajang, Selangor, Malaysia.
Emails: [email protected],[email protected], [email protected],
Submitted: Mar. 20, 2014 Accepted: Apr. 26, 2014 Published: June 1, 2014
Abstract - This paper simulates and discusses about the probable causes of error which might occur
due to the environmental settings of the triboacoustic localization prototype previously developed.
Erroneous conditions studied are sensor offsets and temperature mismatches while existing errors due
to equation deficiencies are taken into considerations. Descriptions of the prototype's hardware and
combinational system functionality which is to be simulated is described prior to the simulation and
experimental step. It was found through simulations and verified via experiments that some
environmental settings do have a large impact upon final outcome ( x,y offset and z offset) while some
have negligible effects to the final outcome( temperature).
Index terms : Triboacoustic localization, simulated errors, wearable computer, mobile device;
Yeng Weng Leong, Hiroaki Seki, Yoshitsugu Kamiya, Masatoshi Hikizu, TRIBOACOUSTIC LOCALIZATION SYSTEM
FOR MOBILE DEVICE - ENVIRONMENTAL EFFECTS TO ACCURACY
659
I. INTRODUCTION
The advent of ubiquitous computing, increased processing power in smaller packages and
reducing costs of manufacturing has fueled the increasing number of mobile devices in the
consumer market. The third wave of computing states that every person would have multiple
computers that recedes to the background of our lives[1][2]. However, in its quest in achieving
higher mobility through miniaturization, it has caused difficulties for users to interact with them
[3]. Mobility in this paper is defined as the reduction of parameters such as the mass, volume and
power usage in a device. Researchers have suggested some innovative methods to address this
problem by opportunistically acquiring the environment as the input medium hence eliminating
the need for a device with a large input space. Example of such an innovation is the 'Hand-
Menu-System' which utilizes visual capture device such as a camera to capture user's gestures
and unique shapes but unfortunately suffers from instabilities due to unstable lighting and
overlapping [4]. A predecessor to this technology is the 'OmniTouch' which utilizes the
'Microsoft Kinect' allowing it to mitigate the depth issues related to standard visual systems, as it
contains within it a depth camera [5]. It also allows for unique shape inputs and gestures.
Despite the benefits of being small and light, visual based systems are computationally intensive
and also requires large amounts of energy, making it a poor choice for mobile devices which are
required to be ubiquitous.
Acoustic or vibration based sensors require much less power as compared to visual ones,
examples of innovations which utilizes such sensors are the 'Hambone' which transfers voice
through the human body to the ear which also eliminates noise from the environment at the same
time and the 'Skinput' which utilizes the human body as the medium for conducting the vibrations
of taps via the specialized cantilever system developed[6][3]. Despite both these systems being
able to achieve high mobility, the input range were limited to pre-defined gestures, taps or voice
commands with corresponding outcomes.
'Apple' revolutionized the mobile device industry's input method by replacing the use of
styluses with the ever present fingers users have [7]. In this research, instead of limiting
ourselves to the confines of a predefined area of a touch screen or touchpad for input, we can
easily acquire any available surface from the surroundings as an input surface [8]. The authors
have successfully designed and developed a system which incorporates the high mobility of the
acoustic system with wide input range and the versatility to be used on multiple surfaces but
INTERNATIONAL JOURNAL ON SMART SENSING AND INTELLIGENT SYSTEMS VOL. 7, NO. 2, June 2014
660
preferably on the human skin due to readily available mechanoreceptor feedback[8] [9]. As the
device can be used on many surfaces, it would be utilized in many different settings, hence this
paper simulates effect the settings have on the accuracy.
The first section describes the function of the existing hardware which would be
simulated, followed by the algorithms used for localization and the nature of the triboacoustic
signals. The subsequent section simulates and discusses the various 'arrangement's which could
cause accuracy issues such as the z displacement, x-y displacement, temperature effect but
without first considering the base reading of the inherent error from the currently used
localization algorithm, the Angle-of-Arrival method (AOA). Lastly would be the verification of
the simulations via prototype experimentations.
II. PROPOSED LOCALIZATION SYSTEM
a. Prototype overview
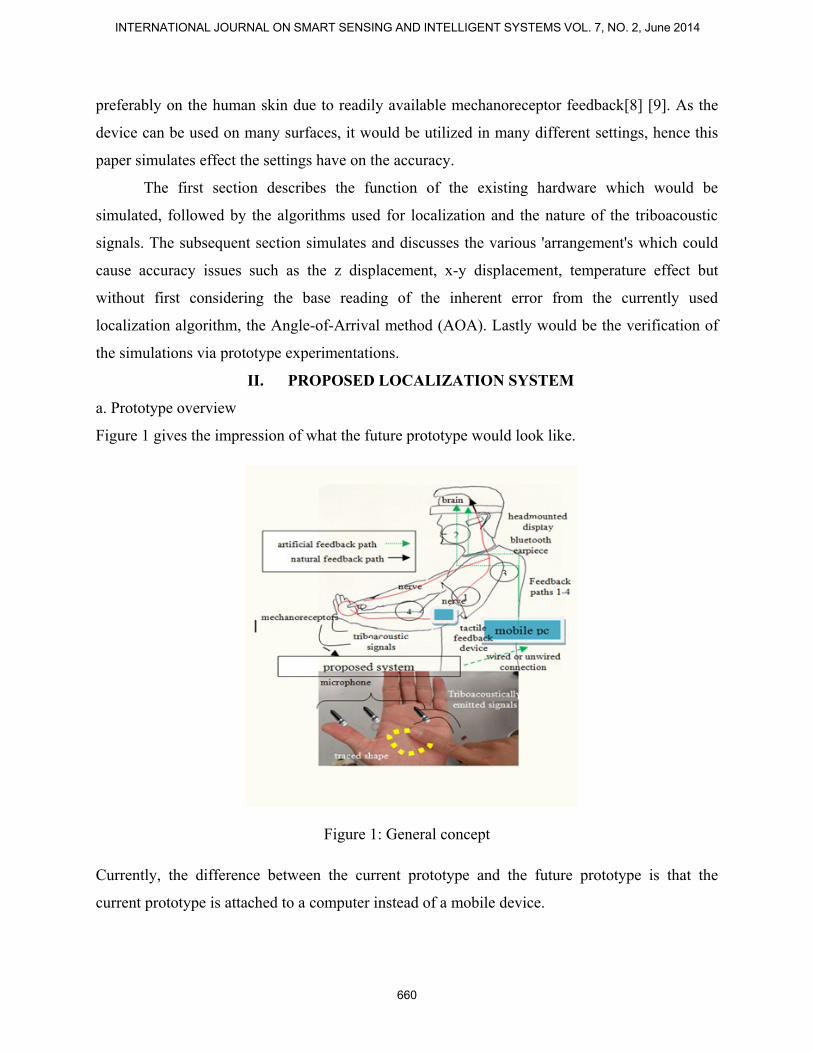
Figure 1 gives the impression of what the future prototype would look like.
Figure 1: General concept
Currently, the difference between the current prototype and the future prototype is that the
current prototype is attached to a computer instead of a mobile device.
Yeng Weng Leong, Hiroaki Seki, Yoshitsugu Kamiya, Masatoshi Hikizu, TRIBOACOUSTIC LOCALIZATION SYSTEM
FOR MOBILE DEVICE - ENVIRONMENTAL EFFECTS TO ACCURACY
661
Briefly, the diagram shows how the action of the user tracing the finger on a surface, in
this case the palm creating triboacoustic emitted signals (TES) which are picked up by the
microphones, subsequently localized upon by the accompanying processor unit. This prototype
can work on numerous surfaces but illustrated here is the usage which utilizes the feedback from
the mechanoreceptors[8]. For the system to be successful it requires a few key components, first
being the hardware set up, followed by the algorithm implemented by means of software and
finally the type of acoustic signal generated. The subsequent sections will briefly discuss about
these.
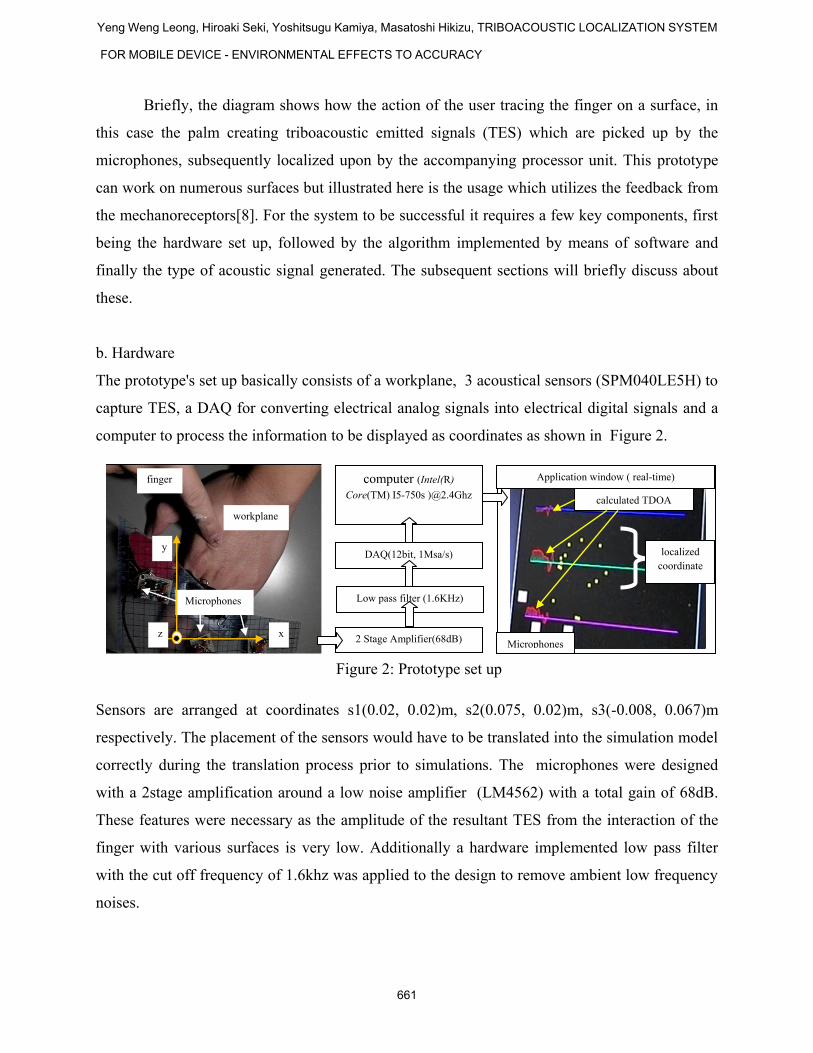
b. Hardware
The prototype's set up basically consists of a workplane, 3 acoustical sensors (SPM040LE5H) to
capture TES, a DAQ for converting electrical analog signals into electrical digital signals and a
computer to process the information to be displayed as coordinates as shown in Figure 2.
Figure 2: Prototype set up
Sensors are arranged at coordinates s1(0.02, 0.02)m, s2(0.075, 0.02)m, s3(-0.008, 0.067)m
respectively. The placement of the sensors would have to be translated into the simulation model
correctly during the translation process prior to simulations. The microphones were designed
with a 2stage amplification around a low noise amplifier (LM4562) with a total gain of 68dB.
These features were necessary as the amplitude of the resultant TES from the interaction of the
finger with various surfaces is very low. Additionally a hardware implemented low pass filter
with the cut off frequency of 1.6khz was applied to the design to remove ambient low frequency
noises.
DAQ(12bit, 1Msa/s)
computer (Intel(R)
Core(TM) I5-750s )@2.4Ghz
Microphones
localized
coordinate
s
Application window ( real-time)
finger
workplane
Microphones
y
x z 2 Stage Amplifier(68dB)
Low pass filter (1.6KHz)
calculated TDOA

INTERNATIONAL JOURNAL ON SMART SENSING AND INTELLIGENT SYSTEMS VOL. 7, NO. 2, June 2014
662
Meanwhile the sampling rate of the DAQ was 1Msa/s per channel. High sampling rates
provided by the DAQ produces high resolution data which is required by the cross-correlation
process to attain highly accurate Time-Difference-of-arrival (TDOA). The TDOA is then
utilized to attain the coordinate of the sound source as discussed in the following section of basic
localization methods.
c. Basic localization techniques
Figure 3: TDOA workings (a) sensor configuration in relation to sound source (b) resultant
electronic signals (c) TDOA calculated via cross-correlation
Figure 3(a) shows the general set up of the sensors in relative to the sound source. The
figure displays that the distances between the sound source to the respective sensors are
different. This therefore yields different time of flight between each sensor from the sound
source. Since the generation of the signal is uncontrolled and unknown, the relative time
difference has to be used instead of the absolute time. This is done by collecting the signals from
the 3 sensors as shown in Figure 3 (b). The TDOA is attained by cross-correlating the signals,
and discovering phase lags between the identical signals. Repeating this process for multiple
'blocks' of data in turn yields the TDOA graph as in Figure 3(c). Equation (1) illustrates how the
AOA
Sensor
A
Sensor
B
Sound
source
Base plane
Sensor
C
R3
R1 R2
(x3, x3)
y1) (x1,y1) (x2,y2)
(xs,ys)
(a) (b)
(c)
t12 delay = 49
us
t13delay = 39
us
Raw signals captured
and digitized
chan1
chan 2
chan3
t12
t13
Cross-correlation

Yeng Weng Leong, Hiroaki Seki, Yoshitsugu Kamiya, Masatoshi Hikizu, TRIBOACOUSTIC LOCALIZATION SYSTEM
FOR MOBILE DEVICE - ENVIRONMENTAL EFFECTS TO ACCURACY
663
TDOA is attained where, Variables tn and td represents the time taken for sound to travel from
the sound source to the sensor pairs.
t n,d = tn -td , n≠d
(1)
Using the AOA algorithm in tandem with the TDOA data attained, the location of the sound
source can be discovered as shown in Figure 4
Figure 4: AOA method
Utilizing the measured TDOA, the sound source angle of arrival is measured from the center
point of the base plane between 2 sensors. The calculations that can be derived from Figure 4 as
shown in Equation ( 2 )
( 2 )
ϕ describes the calculated angle of arrival of the sound source with reference to the axis
perpendicular with the base plane, Ld is the distance between the 2 sensors. Using a minimum of
3 sensors of known location, localization of a sound source point in 2 dimensional space via the
intersection of the angles of arrivals is attainable. The AOA method is quick in implementation
and easy to program but had errors in localization as the equation was an approximation. Figure
4 highlights the error which is inherent in the AOA equation. Despite using ideal TDOA values,
the equation will produce an angle of arrival smaller than that of the actual angle of arrival. As a
Sensor
A
Sensor
B
Actual Sound
source
Base plane
ϕ 1 angle of arrival
Ld
Sensor
C
ϕ 2 angle of arrival
Intersection of AOA
actual angle of
arrival

INTERNATIONAL JOURNAL ON SMART SENSING AND INTELLIGENT SYSTEMS VOL. 7, NO. 2, June 2014
664
result, the intersection of the 2 angle's vector will occur sooner and closer to the base planes as
opposed to the actual sound source location. The 'star' represents the localization derived from
the AOA method and the 'triangle' represents the actual sound source location. The simulation
would address this deficiency in the algorithm by first calculating the best possible localization
that can be attained by means of AOA as the base model data.
d. Scratch sounds characteristics
The sound source is the keystone to the entire system, yet its parameters are not within the
control of the system. The sound source utilized by the system is created from the action of 2 or
more surfaces in contact with each other with a net relative motion creating triboacoustic signals
in the process. This sound source is similar to that of Acoustic Emissions(AE) which are caused
by the impaction of 2 or more asperities [10]. The frequencies generated by the phenomenon are
normally from 20khz to 1 Mhz of low amplitude which can be loosely categorized as white
noise[11][12]. The frequency utilized in this research is the 8th subharmonic of 25khz.
III. SIMULATIONS OF ERROR CAUSING ENVIRONMENTAL FACTOR
This section, speculates the possible cause of errors originating from the prototype's set
up. The system utilizes AOA localization method which is fast to implement but has known
errors [13]. Prior to searching for prototype's assembly related caused errors to the localization,
the errors contributed by the AOA must first be take into account as the baseline. Hence the first
subsection discusses in detail and simulates the effect of the AOA on the localization of the
coordinates.
After the contribution of error from the AOA has been identified, the validity of possible
errors caused by prototype's assembly factors are evaluated using simulations. They are namely
the erroneous relative displacement of sensor's plane from the workplane or from each other.
Another possible contributor to errors is the discrepancies between ambient temperature and the
software declared temperature.
The evaluation method for the simulation consisted of a grid 0.01X0.01 m boxes
arranged to create a 0.06 X 0.06 m box created by points spaced in 0.001m intervals. These ideal
sound source coordinates would be exposed to the simulated erroneous environment creating the
resultant TDOA and processed using AOA to attain the final coordinates. The resultant
coordinates were compared against the ideal grid coordinates.

Yeng Weng Leong, Hiroaki Seki, Yoshitsugu Kamiya, Masatoshi Hikizu, TRIBOACOUSTIC LOCALIZATION SYSTEM
FOR MOBILE DEVICE - ENVIRONMENTAL EFFECTS TO ACCURACY
665
a. AOA equation effect on baseline data
In this particular test, the ideal coordinate points are generated arithmetically. The number of
pseudo coordinates are 834 which forms a square as shown in Figure 5. A software which
emulates the travel of sound through the atmosphere prior to reaching the individual sensors
calculates the TDOA between the sensors on a homogenous flat plane for a sound source on the
same plane. The resultant TDOA calculated data were then inserted into the AOA algorithm to
produce a set of coordinates for evaluation. The results of simulation yields the data as shown in
Figure 5.
Figure 5: Results - AOA vs Ideal
Visually it can be seen that the AOA method is able to approximate the ideal data in
terms of shape, but not perfectly. There exists an 'error free region' area which approximates the
ideal grid coordinates closely as compared to the other regions of the grid. Also, the error trend
in coordinate displacement and angle deviation becomes more pronounced as the coordinates re-
created are further from the 'error free region'. This could be explained by the fact that AOA is an
angled based localization system, any small angle deviations become more pronounced as the
distance from the sensors increases. In addition to that, the error trends tend to reverse as they
past the 'error free region' for example, if the coordinate re-created has an erroneous positive
offset prior to the 'error free region', after that it would have an erroneous negative offset. Closer
inspection reveals that the 'error free region' is the coordinate which is equidistance from all 3
sensors. This fact was used advantageously in subsequent sections.
0
0.02
0.04
0.06
0.08
0.1
0.12
-0.02 0 0.02 0.04 0.06 0.08 0.1 0.12
y a
xis
(m)
x axis(m)
AOA grid
coordinates
Ideal grid
coordinates
Sensors
Error free region

INTERNATIONAL JOURNAL ON SMART SENSING AND INTELLIGENT SYSTEMS VOL. 7, NO. 2, June 2014
666
b. Effect of displacement of sensors
This particular test was to evaluate the effect of the sensors in a homogenous plane being
displaced from the workplane in the z direction and also the displacement of individual sensors
in the xy-plane which are not accounted for by the software. Such displacements could cause
TDOA errors which in turn result in localized errors when they are fed into the AOA equation
for localizations. It has to be noted that AOA weakness does not in any way affect the quality of
the attained TDOA.
b.1 Sensor plane offset : Z
This simulation utilized the ideal pseudo data which was then processed to produce TDOA.
Different conditions were simulated where the planes sensor and workplane were displaced in
the z axis with the increments of 0.01m starting from 0.01 to 0.03m. With each increment, the
TDOA was re-calculated for the same xy-coordinates and then introduced to the AOA algorithm
for evaluation. This simulation was chosen as it simulates the effect of the using this prototype
on different flat and homogenous surfaces which might be in relative state of offset from the
sensor plane. The results of the prototype are as shown visually in Figure 6(a)-(c).
It is visually evident from the visual results that the grid generated by the AOA localized
points via the captured TDOA shrinks as compared to the ideal grid coordinate as the plane of
the sound source is moved further away from the sensor plane. The 'error free region' is strangely
not affected by the z -offset. This phenomenon can be utilized as a calibration spot for
comparison between the ideal TDOA and the experimental TDOA (collected from the prototype)
of the same shape traced. If the TDOA of the experimental data is the same to that of the ideal
TDOA on the 'error free region', but the extremums are different, it can be deduced that a z offset
of the sensor plane in relation to the workplane could have occurred in the prototype's set up.

Yeng Weng Leong, Hiroaki Seki, Yoshitsugu Kamiya, Masatoshi Hikizu, TRIBOACOUSTIC LOCALIZATION SYSTEM
FOR MOBILE DEVICE - ENVIRONMENTAL EFFECTS TO ACCURACY
667
Figure 6: Z displacement simulation (a) Z displacement 0.01m (b) Z displacement 0.02m (c) Z
displacement 0.03
b.2 Individual sensor offset: (x,y)
In this particular test, it is assumed that the errors of translocation of the cumulative coordinates
to produce a grid is caused by the unaccounted shifting of sensors along the x or y axis. The set
up had 3 sensors, and in this simulation, it assumed that only 1 of the sensors were susceptible to
erroneous shifting in the x or y axis of 0.01m per shift, the results are shown as in Figure 7.
0
0.02
0.04
0.06
0.08
0.1
0.12
-0.02 0.03 0.08
y a
xis
(m)
x axis(m)
Ideal AOA Disp 0.01m Sensors 0
0.02
0.04
0.06
0.08
0.1
0.12
-0.02 0.03 0.08
y a
xis
(m)
x axis(m)
Ideal AOA Disp 0.02m Sensors
0
0.02
0.04
0.06
0.08
0.1
0.12
-0.02 0.03 0.08
y a
xis
(m)
x axis(m)
Ideal AOA Disp 0.03m Sensors
(a) (b)
(c)

INTERNATIONAL JOURNAL ON SMART SENSING AND INTELLIGENT SYSTEMS VOL. 7, NO. 2, June 2014
668
Figure 7: Simulated shapes due to displaced sensor 2 (a) x +0.005m (b) x-0.005m (c) y+0.005m
(d) y-0.005m
The grids re-created due to the shifting the sensor in its x or y position are very different
from that of the ideal grid in terms of size and shape. The 'error free region' in this particular test
is also affected which would indicate that the TDOA of the ideal and that of the experimental
would be different. In conclusion, any offset of sensors whether in the x or y axis is highly
detrimental to the final outcome of the localization system.
c. Effect of temperature
Temperature effects the speed of sound. This system relies upon the propagation delay of sound
waves moving though the air, therefore, the ambient temperature of air intuitively could be a
factor which affects the accuracy of the system.
0
0.02
0.04
0.06
0.08
0.1
0.12
-0.03 0.02 0.07 0.12
y a
xis
(m)
x axis(m)
s2 x+0.005
Ideal
Sensors 0
0.02
0.04
0.06
0.08
0.1
0.12
-0.03 0.02 0.07 0.12
y a
xis
(m)
x axis(m)
s2 x-0.005
Ideal
Sensors
0
0.02
0.04
0.06
0.08
0.1
0.12
-0.03 0.02 0.07 0.12
y a
xis
(m)
x axis(m)
S2 y+0.005
Ideal
Sensors 0
0.02
0.04
0.06
0.08
0.1
0.12
-0.03 0.02 0.07 0.12
y a
xis
(m)
x axis(m)
S2 y-0.005
Ideal
Sensors
(a) (b)
(c) (d)
Yeng Weng Leong, Hiroaki Seki, Yoshitsugu Kamiya, Masatoshi Hikizu, TRIBOACOUSTIC LOCALIZATION SYSTEM
FOR MOBILE DEVICE - ENVIRONMENTAL EFFECTS TO ACCURACY
669
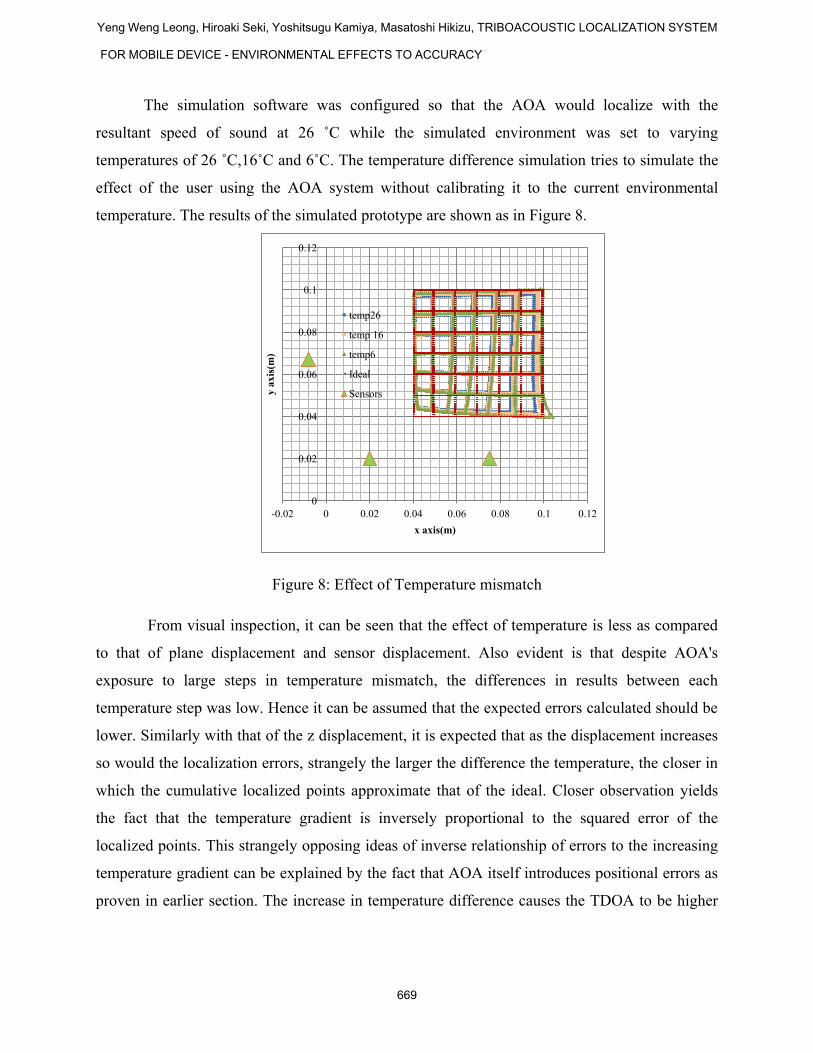
The simulation software was configured so that the AOA would localize with the
resultant speed of sound at 26 ˚C while the simulated environment was set to varying
temperatures of 26 ˚C,16˚C and 6˚C. The temperature difference simulation tries to simulate the
effect of the user using the AOA system without calibrating it to the current environmental
temperature. The results of the simulated prototype are shown as in Figure 8.
Figure 8: Effect of Temperature mismatch
From visual inspection, it can be seen that the effect of temperature is less as compared
to that of plane displacement and sensor displacement. Also evident is that despite AOA's
exposure to large steps in temperature mismatch, the differences in results between each
temperature step was low. Hence it can be assumed that the expected errors calculated should be
lower. Similarly with that of the z displacement, it is expected that as the displacement increases
so would the localization errors, strangely the larger the difference the temperature, the closer in
which the cumulative localized points approximate that of the ideal. Closer observation yields
the fact that the temperature gradient is inversely proportional to the squared error of the
localized points. This strangely opposing ideas of inverse relationship of errors to the increasing
temperature gradient can be explained by the fact that AOA itself introduces positional errors as
proven in earlier section. The increase in temperature difference causes the TDOA to be higher
0
0.02
0.04
0.06
0.08
0.1
0.12
-0.02 0 0.02 0.04 0.06 0.08 0.1 0.12
y a
xis
(m)
x axis(m)
temp26
temp 16
temp6
Ideal
Sensors

INTERNATIONAL JOURNAL ON SMART SENSING AND INTELLIGENT SYSTEMS VOL. 7, NO. 2, June 2014
670
than the ideal therefore increasing the size of the shape which in turn opposes the effect of the
AOA which shrinks the shape. The increase of TDOA with increase in temperature difference.
In general the temperature has not much effect to the final outcome of the shapes or the
accuracy of the localized points. Hence it can be concluded that temperature in which humans
find comfortable operating this system in would not affect the final outcome of the localization
points.
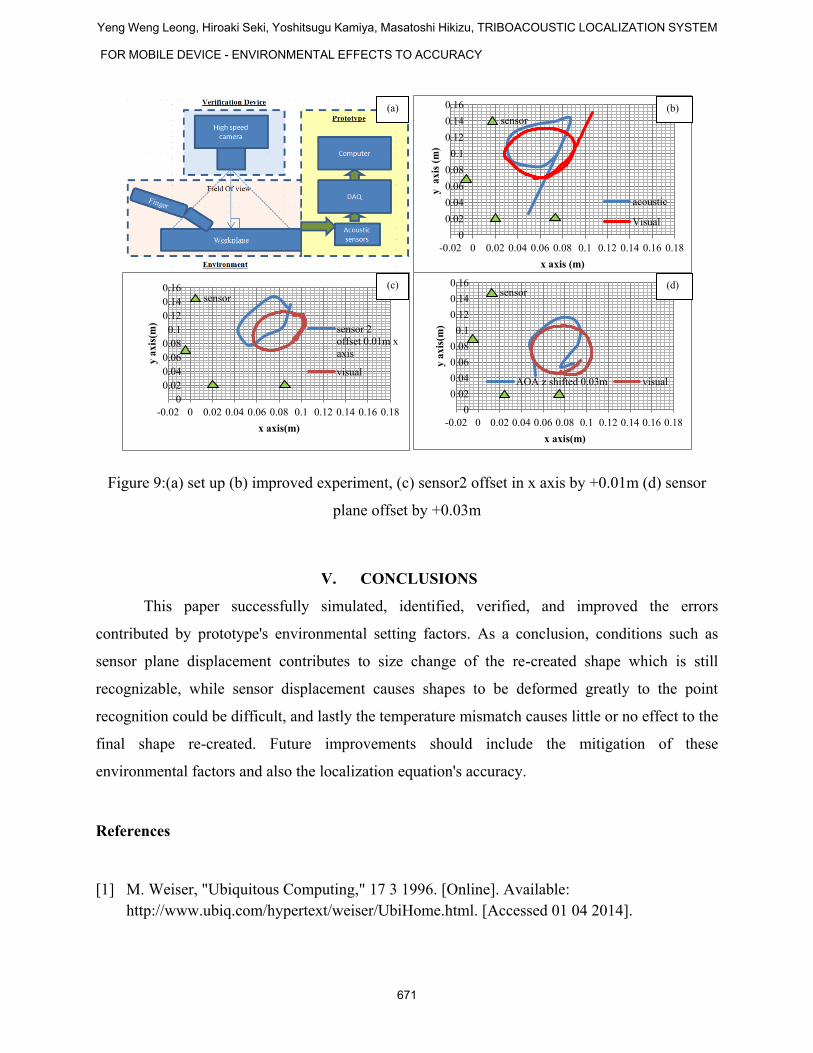
IV. PROTOTYPE EXPERIMENTS
The observations seen in the simulations were verified in this section with the help of a high
speed camera affixed perpendicularly to the workplane for the purpose of capturing the
coordinates of the moving finger. The results of the acoustically captured coordinates versus the
visually captured coordinates in various settings are shown in Figure 9.
The result of eliminating the environmental factors to errors produced the graph as shown
in Figure 9(b) which indicates very close approximation to the visual data. Simulation results of
Figure 7(a) and experimental results in Figure 9(c) which share similar key settings which is the
offset of sensor 2 by 0.005m in the x axis, show similar characteristics such as shape mismatch,
and shape offset. Similarly, simulation conditions were re-created and tested for the condition
where the sensor plane was offset by 0.03m from the workplane produced results as shown in
Figure 9(d) which also showed same characteristics as the graph in Figure 6(c) where the shapes
re-created were smaller than the ideal version.
Extreme care had been taken in setting up the camera for the z axis distortion experiment
as any slight error will be compounded and cause the 'ideal' data to be erroneous. Experiments
related to temperature were not done as the simulations indicate that its effects are negligible.
Nevertheless, future improvements such as inserting a temperature sensor into the design which
can measure the ambient temperature, simultaneously updating the software could improve the
accuracy of the system when used in extreme temperature conditions.
Yeng Weng Leong, Hiroaki Seki, Yoshitsugu Kamiya, Masatoshi Hikizu, TRIBOACOUSTIC LOCALIZATION SYSTEM
FOR MOBILE DEVICE - ENVIRONMENTAL EFFECTS TO ACCURACY
671
Figure 9:(a) set up (b) improved experiment, (c) sensor2 offset in x axis by +0.01m (d) sensor
plane offset by +0.03m
V. CONCLUSIONS
This paper successfully simulated, identified, verified, and improved the errors
contributed by prototype's environmental setting factors. As a conclusion, conditions such as
sensor plane displacement contributes to size change of the re-created shape which is still
recognizable, while sensor displacement causes shapes to be deformed greatly to the point
recognition could be difficult, and lastly the temperature mismatch causes little or no effect to the
final shape re-created. Future improvements should include the mitigation of these
environmental factors and also the localization equation's accuracy.
References
[1] M. Weiser, "Ubiquitous Computing," 17 3 1996. [Online]. Available:
http://www.ubiq.com/hypertext/weiser/UbiHome.html. [Accessed 01 04 2014].
0
0.02
0.04
0.06
0.08
0.1
0.12
0.14
0.16
-0.02 0 0.02 0.04 0.06 0.08 0.1 0.12 0.14 0.16 0.18
y ax
is (
m)
x axis (m)
acoustic
Visual
0
0.02
0.04
0.06
0.08
0.1
0.12
0.14
0.16
-0.02 0 0.02 0.04 0.06 0.08 0.1 0.12 0.14 0.16 0.18
y a
xis
(m)
x axis(m)
sensor 2
offset 0.01m x
axis
visual
0
0.02
0.04
0.06
0.08
0.1
0.12
0.14
0.16
-0.02 0 0.02 0.04 0.06 0.08 0.1 0.12 0.14 0.16 0.18
y a
xis
(m)
x axis(m)
AOA z shifted 0.03m visual
(a) (b)
(c) (d)
sensor
sensor sensor

INTERNATIONAL JOURNAL ON SMART SENSING AND INTELLIGENT SYSTEMS VOL. 7, NO. 2, June 2014
672
[2] Fakhreddine Karray, Milad Alemzadeh, Jamil Abou Saleh and Mo Nours Arab, "Human-
Computer Interaction: Overview on State of the Art," International Journal on Smart
Sensing and Intelligent Systems, vol. 1, no. 1, pp. 137-159, 2008.
[3] Harrison, C., Tan, D. Morris, "Skinput: Appropriating the Body as an Input Surface," in In
Proceedings of the 28th Annual SIGCHI Conference on Human Factors in Computing
Systems , Atlanta, Georgia, 2010,pp. 453-462.
[4] Hiroshi Sasaki, Tomohiro Kuroda, Peter Antoniac, Yoshitsugu Manabe, Kunihiro Chihara,
"Hand-Menu System: A Deviceless Virtual Input Interface for Wearable Computers," CEAI,
vol. 8, no. 2, pp. 44-53, 2006.
[5] Harrison, C., Benko, H., and Wilson, A. D., "OmniTouch: Wearable Multitouch Interaction
Everywhere," in In Proceedings of the 24th Annual ACM Symposium on User interface
Software and Technology , Santa Barbara, California, 2011,pp. 441-450.
[6] Deyle, T.; Palinko, S.; Poole, E.S.; Starner, T., "Hambone: A Bio-Acoustic Gesture
Interface," in Wearable Computers, 2007 11th IEEE International Symposium on, 2007,pp.
3-10.
[7] W. Isaacson, Steve Jobs, New York: Simon & Schuster, 2011.
[8] Yeng Weng Leong, Hiroaki Seki, Yoshitsugu Kamiya, Masatoshi Hikizu, "A Feasibility
Study of Utilizing Tribo-Acoustics for Mobile User Interface," in Sensing Technology
(ICST), 2013 Seventh International Conference on Sensing Technology, Wellington,
2013,pp. 800-805.
[9] N.Rajaei, M.Ohka, T.Miyaoka, Hanafiah Yussof, Ahmad Khushairy Makhtar, Siti Nora
Basir, "Investigation of VHI Affected by the Density of Mechanoreceptive Units for Virtual
Sensation," International Journal on Smart Sensing and Intelligent Systems, vol. 6, no. 4,
pp. 1516-1532, 2013.
[10] Mhmod Hamel, Abdulmajid Addali, David Mba, "Investigation of the influence of oil film
thickness on helical gear defect detection using Acoustic Emission," Applied Acoustics, vol.
79, pp. 42-46, 2014.
[11] H. Zahouani, R. Vargiolu, G. Boyer, C. Pailler-Mattei, L. Laquièze, A. Mavon, "Friction
noise of human skin in vivo," Wear, Vols. 5-8, no. 267, pp. 1274-1280, 2009.
[12] H. Zahouani, G. Boyer, C. Pailler-Mattei, M. Ben Tkaya, R. Vargiolu, "Effect of human
ageing on skin rheology and tribology," Wear, vol. 271, no. 9-10, pp. 2364-2369, 2011.

Yeng Weng Leong, Hiroaki Seki, Yoshitsugu Kamiya, Masatoshi Hikizu, TRIBOACOUSTIC LOCALIZATION SYSTEM
FOR MOBILE DEVICE - ENVIRONMENTAL EFFECTS TO ACCURACY
673
[13] Jinsong Zhang, Malaka Walpola, David Roelant, Hao Zhu, Kang Yen, "Self-organization of
unattended wireless acoustic sensor networks for ground target tracking," Pervasive and
Mobile Computing, vol. 5, no. 3, pp. 148-164, 2009.