FUJITSU Cloud Service K5 API Management · All Right Reserved, Copyright FUJITSU LIMITED 2018 1.5....
75
All Right Reserved, Copyright FUJITSU LIMITED 2018 FUJITSU Cloud Service K5 API Management Function Manual Version 1.4 FUJITSU LIMITED
Transcript of FUJITSU Cloud Service K5 API Management · All Right Reserved, Copyright FUJITSU LIMITED 2018 1.5....
All Right Reserved, Copyright FUJITSU LIMITED 2018
FUJITSU Cloud Service K5
API Management
Function Manual
Version 1.4
FUJITSU LIMITED

All Right Reserved, Copyright FUJITSU LIMITED 2018
No reproduction or republication without written permission.
FUJITSU Cloud Service K5
API Management Function Manual Version 1.4
Date of issue: March 2018
All Right Reserved, Copyright© FUJITSU LIMITED

All Right Reserved, Copyright FUJITSU LIMITED 2018
Revision History
Version Date Description
1.0 Feb. 1st, 2016 Original version
1.1 Feb. 25th, 2016 Update of the screen image for version up.
1.2 Jul. 1st, 2016 For API Management Standard released.
1.3 Jul. 22nd, 2016 Modification to sections to improve usability
1.4 Mar. 22nd, 2018 Add description of “Java Callout” and “API, Product and
organization History”.
All Right Reserved, Copyright FUJITSU LIMITED 2018
Introduction
This document provides an a functional explanation of FUJITSU Cloud Service K5 API Management
(hereinafter referred to as APIM). The APIM Platform as a Service (PaaS), provides customers with a
WebAPI management platform.
Notes
The contents of this manual are subject to change without notice.
Only API Managment Pro Available in the API Management Pro.

All Right Reserved, Copyright FUJITSU LIMITED 2018
Table of Contents
1. Introduction ......................................................................................................................................................7
1.1. WebAPI Service Overview........................................................................................................................8
1.2. Function Overview ....................................................................................................................................9
1.3. API Services ............................................................................................................................................10
1.4. What is an API Proxy? ............................................................................................................................ 11
1.5. What is a Policy? ....................................................................................................................................12
1.6. What is a Publishing API? ......................................................................................................................13
1.7. What is a Backend Service? ..................................................................................................................14
1.8. What is API Analytics? ...........................................................................................................................15
1.9. APIM System Constitution Diagram .....................................................................................................16
2. Dashboard .......................................................................................................................................................17
2.1. What is the dashboard? .........................................................................................................................18
3. API Policies .....................................................................................................................................................20
3.1. List of Policies .........................................................................................................................................21
3.1.1. Traffic Management .........................................................................................................................21
3.1.2. Security .............................................................................................................................................22
3.1.3. Mediation ..........................................................................................................................................24
3.1.4. Extension ..........................................................................................................................................25
3.2. API Proxy Flows ......................................................................................................................................26
3.2.1. What are Flows? ..............................................................................................................................26
3.3. Understanding API Resources ..............................................................................................................28
3.4. API Development Lifecycle ....................................................................................................................29
3.5. Trace Tool ................................................................................................................................................32
3.5.1. Online Trace Tool .............................................................................................................................32
3.5.2. Offline Trace Tool .............................................................................................................................37
4. Publish .............................................................................................................................................................38
4.1. Publishing Overview ...............................................................................................................................39
4.1.1. Task1: Create an API product on API Management .........................................................................40
4.1.2. Task2: Register an app developer on API Management .................................................................41
4.1.3. Task3: Register an app on API Management ...................................................................................42
4.2. What is an API Product? ........................................................................................................................43
4.2.1. Access API products from an app .....................................................................................................44
4.2.2. Register developers for your API ......................................................................................................44
4.3. API Developers ........................................................................................................................................45
4.4. About Apps ..............................................................................................................................................46
5. Analytics..........................................................................................................................................................47
5.1. Proxy Performance .................................................................................................................................48
5.1.1. Traffic ....................................................................................................................................................48
5.1.2. Average Response Time .....................................................................................................................49
5.1.3. Traffic by Proxy ...................................................................................................................................49
5.1.4. Average Response Time by Proxy ....................................................................................................49
5.2. Target Performance ................................................................................................................................50
5.2.1. Traffic by Target ...................................................................................................................................50
5.2.2. Traffic ....................................................................................................................................................50
5.2.3. Response Time ....................................................................................................................................51
5.2.4. Target Errors ........................................................................................................................................51
5.2.5. Payload Size ........................................................................................................................................52
5.3. Cache Performance ................................................................................................................................53
5.3.1. Metrics ..................................................................................................................................................53
5.4. Latency Analysis .....................................................................................................................................54

All Right Reserved, Copyright FUJITSU LIMITED 2018
5.4.1. Metrics ..................................................................................................................................................55
5.5. Error Analysis ..........................................................................................................................................56
5.5.1. Error Composition ...............................................................................................................................57
5.5.2. Proxy Errors .........................................................................................................................................57
5.5.3. Target Errors ........................................................................................................................................57
5.5.4. Errors by Proxy ...................................................................................................................................57
5.5.5. Errors by Target ...................................................................................................................................58
5.6. Developer Engagement ..........................................................................................................................59
5.6.1. Engagement .........................................................................................................................................59
5.6.2. Active Developers ...............................................................................................................................59
5.6.3. Analyze developer engagement ........................................................................................................60
5.6.4. Metric ....................................................................................................................................................61
5.7. Traffic Composition ................................................................................................................................62
5.7.1. Metric ....................................................................................................................................................62
5.7.2. By Dimension mode ............................................................................................................................63
5.7.2.1. Dimension..............................................................................................................................................63
5.7.2.2. Traffic Composition ..............................................................................................................................63
5.7.2.3. Top 10 Monthly Composition ..............................................................................................................63
5.7.2.4. Traffic by Dimension ............................................................................................................................63
5.8. Business Transactions ...........................................................................................................................64
5.8.1. Metric ....................................................................................................................................................64
5.8.2. MOST TRAFFIC ....................................................................................................................................64
5.8.3. LEAST TRAFFIC ..................................................................................................................................64
5.8.4. HIGHEST ERROR RATE ......................................................................................................................64
5.8.5. LOWEST ERROR RATE ......................................................................................................................65
5.9. Devices .....................................................................................................................................................66
5.9.1. Traffic by Platform ...............................................................................................................................66
5.9.2. Traffic by Agent ...................................................................................................................................66
5.9.3. Traffic by Device Type.........................................................................................................................67
5.10. Custom Reports ..................................................................................................................................68
5.10.1. + Custom Report button .................................................................................................................68
5.10.2. Report Name Links ..........................................................................................................................68
5.10.2.1. Edit button ...........................................................................................................................................69
5.10.2.2. Analyze buttons ..................................................................................................................................69
6. Admin ..............................................................................................................................................................70
6.1. About Users .............................................................................................................................................71
6.1.1. What Information Defines a User? .................................................................................................71
6.1.2. What are Roles? ...............................................................................................................................71
6.1.2.1. User roles ...........................................................................................................................................71
6.1.2.2. Predefined organization roles .........................................................................................................72
6.1.3. Managing organization users .........................................................................................................72
6.1.3.1. What are Organization Users? ........................................................................................................73
6.1.3.2. API Management Entities and Organization Users interaction ....................................................73
6.2. API, Product, and organization history ................................................................................................74
6.2.1 API history ........................................................................................................................................74
6.2.2 API product history .........................................................................................................................75
6.2.3 Organization history ........................................................................................................................75

All Right Reserved, Copyright FUJITSU LIMITED 2018
1. Introduction This chapter provides an overview of APIM service and its functional components that are required
to use this service.
All Right Reserved, Copyright FUJITSU LIMITED 2018
1.1. WebAPI Service Overview
As the API centric Application architecture becomes a foundation for development of robust and scalable
enterprise applications, Fujitsu K5 API management service provides customers with API governance,
standardized conventions for documentation, consistent security and access control to build next generation
applications.
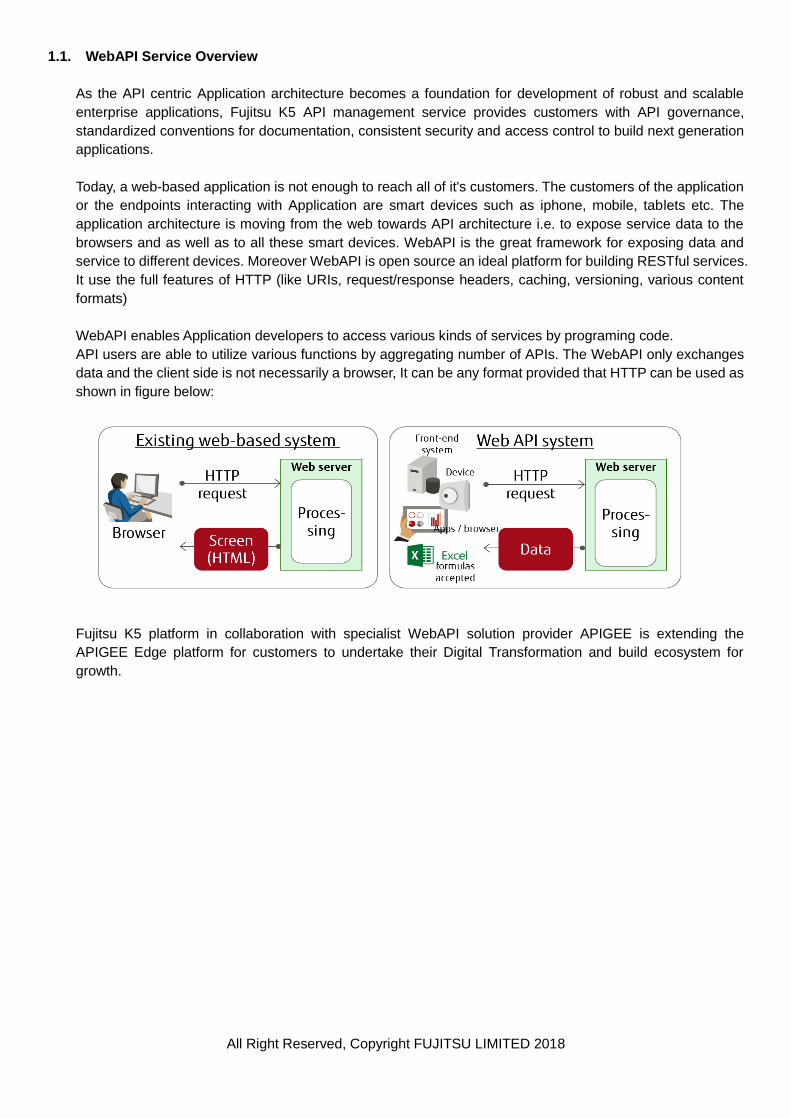
Today, a web-based application is not enough to reach all of it's customers. The customers of the application
or the endpoints interacting with Application are smart devices such as iphone, mobile, tablets etc. The
application architecture is moving from the web towards API architecture i.e. to expose service data to the
browsers and as well as to all these smart devices. WebAPI is the great framework for exposing data and
service to different devices. Moreover WebAPI is open source an ideal platform for building RESTful services.
It use the full features of HTTP (like URIs, request/response headers, caching, versioning, various content
formats)
WebAPI enables Application developers to access various kinds of services by programing code.
API users are able to utilize various functions by aggregating number of APIs. The WebAPI only exchanges
data and the client side is not necessarily a browser, It can be any format provided that HTTP can be used as
shown in figure below:
Fujitsu K5 platform in collaboration with specialist WebAPI solution provider APIGEE is extending the
APIGEE Edge platform for customers to undertake their Digital Transformation and build ecosystem for
growth.

All Right Reserved, Copyright FUJITSU LIMITED 2018
1.2. Function Overview
APIM service includes 5 functional components as per the table below.
Function Description
API Proxy The main function is to manage (create, edit, delete, and deploy) API Proxy.
Policies and Flows can be defined to the API Proxy. API Proxy provides
development lifecycle function including versioning and deployment to optimize
development processes of API Proxy and trace function to debug API Proxy.
Publish This function exposes your API Proxies and make available to apps. To expose and
available the API Proxy:
1. Create Products
2. Register Developers
3. Register Apps
Each step and components details, see 4.1 Publishing Overview.
Analytics APIM Analytics Services collects and analyzes a wealth of information that flows
through APIs. This information is gathered, analyzed, and provided immediately, in
real time. The information on how is API traffic trending over time? Who are top
developers? When is API response time fastest? Slowest? Is it attracting more
developers? Geographically where is the most API traffic?
The answers to questions like these help improve APIs, attract the right app
developers, troubleshoot problems, and, ultimately, make better business decisions
related to API program.
Analytics also provide the custom report. The custom report is a way to specify
precisely what is to be measured across your API program.
Dashboard The APIM dashboard gives a quick overall view of API program -- patterns for API
traffic, developer engagement, and developer apps. More detailed view is available
for each chart and customers can select further information.
Admin An organization administrator uses the Admin function to add a global user to an
existing organization with a specific role. For details, see 6 Admin.
Note: If user is not organization administrator, do not show the Admin menu on
screen of API Management UI.

All Right Reserved, Copyright FUJITSU LIMITED 2018
1.3. API Services
APIM is about creating and consuming APIs, whether building API proxies as a service provider or using APIs,
SDKs, and other convenience services as an app developer.
The APIM services provides an API management server tools for adding and configuring your API proxies, setting
up API products, and managing app developers and client apps. It offloads many common management
concerns from backend services. When adding an API proxy, policies can be applied to the API proxy for adding
security, rate-limiting, mediation, caching, and so on. APIM services also supports customization of the behavior
of API proxy by applying custom scripts, making calls out to third-party APIs and services, and so on.
As a Node.js developer, the node.js modules can be added to APIM service instance to create APIs and API
mashups, all the while leveraging the benefits API Management provides, from message transformation to
security to analytics. Following diagram shows the use cases for APIM services

All Right Reserved, Copyright FUJITSU LIMITED 2018
1.4. What is an API Proxy?
API Proxy is like a control point which is fully aware of API content, communications patterns, and able to present
the API to the external end points / users. As a server or service, sitting between the client (regardless of type of
node) and as the traffic runs through it, meaningful data can be captured for immediate outcomes (block access,
change the message, or respond from a cache) and later used for behavior analysis and business planning.
API proxies decouple the app-facing API from backend services, shielding those apps from backend code
changes. As changes are made to the backend code to enhance the services, apps continue to call the same API
without any interruption.
API Proxy is an important component of API Management, located between apps and backend services. In order
to use the various functions of API Management, and as explained in the figure below an API Proxy is created
and set of policies to flows of new API Proxy are defined.
In an API proxy configuration, there are two types of endpoints:
ProxyEndpoint: Defines the way client apps consume the backend APIs. The proxy endpoint also
determines whether apps access the API proxy over HTTP or HTTPS. The ProxyEndpoint is configured to
define the URL of the API proxy which is used by the external end points when accessing the service. The
policies are attached to the ProxyEndpoint to enforce security, quota checks, and other types of access
control and rate-limiting.
TargetEndpoint:: Defines the way the API proxy interacts with the backend services. The TargetEndpoint
is configured to forward requests to the proper backend service, including defining any security settings,
HTTP or HTTPS protocol, and other connection information. Policies can be attached to the
TargetEndpoint to ensure that response messages are properly formatted for the app that made the initial
request
All Right Reserved, Copyright FUJITSU LIMITED 2018
1.5. What is a Policy?
An API policy is like a module that implements a specific, limited management function as part of the proxy
request/response flow during an API message exchange. The API Policies allow API developers to modify and
monitor API’s behavior using out-of-the-box policies available when using APIM service. The out-of-the-box
policies provide ability to augment API’s with sophisticated features to control traffic, enhance performance,
enforce security, and increase the utility of the APIs, without requiring to write any code or to modify any backend
services. Policies are designed to let you add common types of management capabilities to an API easily and
reliably. The user of Extension policies allows API developer’s to implement custom logic in the form of JavaScript,
Python, Java, and XSLT.
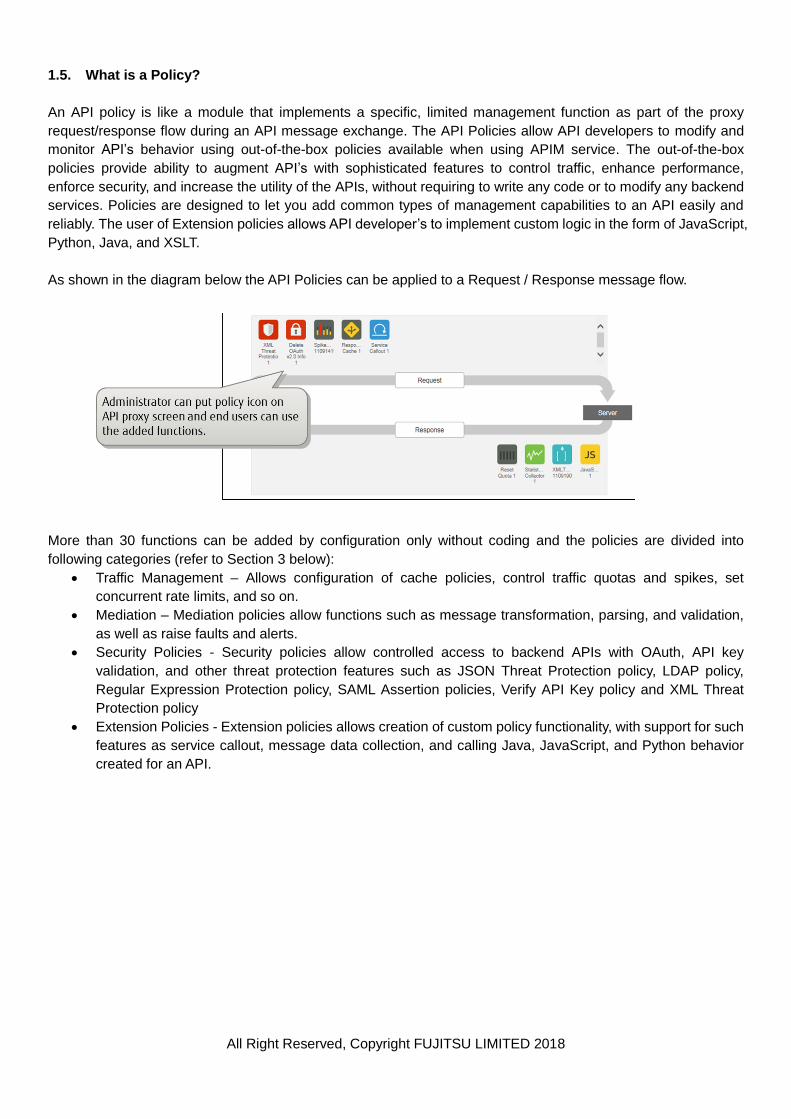
As shown in the diagram below the API Policies can be applied to a Request / Response message flow.
More than 30 functions can be added by configuration only without coding and the policies are divided into
following categories (refer to Section 3 below):
Traffic Management – Allows configuration of cache policies, control traffic quotas and spikes, set
concurrent rate limits, and so on.
Mediation – Mediation policies allow functions such as message transformation, parsing, and validation,
as well as raise faults and alerts.
Security Policies - Security policies allow controlled access to backend APIs with OAuth, API key
validation, and other threat protection features such as JSON Threat Protection policy, LDAP policy,
Regular Expression Protection policy, SAML Assertion policies, Verify API Key policy and XML Threat
Protection policy
Extension Policies - Extension policies allows creation of custom policy functionality, with support for such
features as service callout, message data collection, and calling Java, JavaScript, and Python behavior
created for an API.

All Right Reserved, Copyright FUJITSU LIMITED 2018
1.6. What is a Publishing API?
Publishing is the process of making APIs available to app developers for consumption. APIM service supports a
flexible publishing model that gives complete control over the publishing process such as; it can disclose API
based on the usage, configuring the access right and restriction of traffic after making a package as a product of
API Proxy. Publishing APIs can be broadly defined by the following tasks:
1. Create the API products on API Management that bundle your APIs.
2. Register app developers on API Management.
3. Register apps on API Management.
Following diagram shows the tasks covered in Publishing API and refer to Section 4 for more details on Publish
function.

All Right Reserved, Copyright FUJITSU LIMITED 2018
1.7. What is a Backend Service?
A large group of enterprise and consumer applications can be put into the category of “client-server apps”.These
are the applications which consist of the client-side (frontend) and the server-side (backend).
The client-side is ultimately what the user sees on the screen, whether it is the screen of a mobile device or a
computer monitor. The client-side is responsible for guiding the user through the workflows established by the
application which ultimately is the user experience.
The backend consists of two primary components: application business logic and data processing/management.
APIM Services includes a backend-as-a-service (BaaS) solution that provides developers with access to a
flexible data store and enables developers to quickly integrate valuable features into an app, including social
graphs, user management, data storage, push notifications, performance monitoring, and more.
Using API BaaS, developers can set up cloud-based data platform in minutes instead of months – no server-side
coding or back-end development needed. This allows app developer teams to focus on developing the rich
features and user experience that truly differentiate your app, rather than on the time-consuming details of
implementing core back-end services and infrastructure.
By using the extension policy and Node.js, backend services can be referenced in addition to the WebAPI and
mashup the data from more than one backend service. A Diagram below shows the interaction of APIM and
Backend serves and how a Data Mash-up can be achieved.
Data Mashup
DB/Storage
Backend Services
SaaS
API Proxy
API Management
Apps
Web API REST
SOAP
RDB
NoSQL
Amazon S3
Amazon
SQS/SNS Salesforce
Backend Services
CRM/ERP/DWH
/SOA
Node.js EXTENSION
Policy
Connector
Connector

All Right Reserved, Copyright FUJITSU LIMITED 2018
1.8. What is API Analytics?
APIM service includes built in API Analytics and Monitoring capability which records a wide variety of operational
and business data that flows across APIs. The metrics derived from this data are useful for operational monitoring
and business monitoring. Using Analytics Services customers can, for example, determine which APIs are
performing well or poorly, which developers are delivering the highest value traffic, and which apps are causing
the most issues for your backend services.
To help access this data easily, APIM Analytics Services exposes a RESTful API which can be used to automate
certain Analytics functions, such as retrieving metrics periodically using an automation client or script. The
RESTful API also allows customers to build custom visualizations in the form of custom widgets that can embed
in portals or custom apps. The Analytics can also be used to build Dashboards for business decisions and
operational decisions. The following diagram shows the analytics services screen shot and type of analytics data
available from APIM service. Please refer to Section 5 for more details on Analytics Service

All Right Reserved, Copyright FUJITSU LIMITED 2018
1.9. APIM System Constitution Diagram
The use of APIM Service will require a care consideration of integration of APIM with in customer environment
and following diagram represent the APIM System Constitution and various functional components that would
require configuration and integration for supporting an end to end WebAPI enabled Digital Service
API Service
Organization
Org Users
Org Roles
Developers
Developer
Apps
Products
API Proxy
Flow
Policy
Deployment
Trace
One-to-many Analytics
Service
API Management
Backend Services
Web API
Apps
Website
Mobile App
Other system
App developers Backend Services
Developers
Users
API
Developer
End user
Exploration
Dashboard
Create Analyze Use
All Right Reserved, Copyright FUJITSU LIMITED 2018
2. Dashboard This chapter describe the functions of dashboard and use of Dashboards for API development,
API operational management.

All Right Reserved, Copyright FUJITSU LIMITED 2018
2.1. What is the dashboard?
The API Management dashboard is the first thing you see when you log in to APIM service and it gives a quick
overall view of API program supported by APIM -- patterns for API traffic, developer engagement, and developer
apps..
This dashboard has three sections (shown below in diagram):
•Proxy Traffic -- Plots overall traffic for all of the APIs in an organization. See at a glance the error rate as a
percentage of total traffic.
•Developer Engagement -- Gives a quick sense of how developers are engaged with your APIs.
•Developer Apps -- Breaks down API traffic by developer app. Shows you which apps are receiving the most
traffic.
The customers can see this dashboard anytime by selecting Dashboard from the main API Management menu.

All Right Reserved, Copyright FUJITSU LIMITED 2018
Dashboard contents
Proxy traffic All the API traffic for an organization over the selected period of time.
Traffic, also called "throughput", represents the number of API requests
and responses seen by an API organization.
Click the "more details" link to drill down to a more detailed view.
Developer Engagement Measures the average number of API calls for registered developers during
the selected period of time.
Shows you active and highly active developers (greater than 50
transactions per hour). Also shown are the total number of developers who
have signed up to use your APIs.
Click the "more details" link to drill down to a more detailed view.
Note: It's possible that the Developer Engagement could reflect higher
numbers for a Week timespan than for a Month. This is because
engagement is calculated based on the average number of calls during a
specific period of time (week/month). You could have a large number of
developers register their apps, but for a period of time the apps are not
generating traffic (perhaps because their apps are still in development). If
traffic starts later, in the most recent week, then calculated engagement will
be higher for the most recent week than over the previous month, because
most of the traffic was generated in the most recent week.
Developer Apps Traffic for your top-performing developer apps for the selected time period
is displayed in this chart.
Click the "more details" link to drill down to a more detailed view.
All Right Reserved, Copyright FUJITSU LIMITED 2018
3. API Policies This chapter explains the various out of the box functions available within APIM service to enhance
the functions of APIs.

All Right Reserved, Copyright FUJITSU LIMITED 2018
3.1. List of Policies
3.1.1. Traffic Management
Traffic management policies allow API developers to configure cache, control traffic quotas and spikes, set
concurrent rate limits, and so on. Below is list of Traffic Management Policies that can be applied to
Request/Response messages in an API flow.
Quota
Use the Quota policy to configure the number of request messages
that an API proxy allows over a period of time, such as a minute, hour,
day, week, or month.
Spike Arrest The Spike Arrest policy protects against traffic spikes. It throttles the
number of requests processed by an API proxy and sent to a
backend, protecting against performance lags and downtime.
Concurrent Rate Limit Throttles inbound connections from your API proxies running on API
Management to your backend services.
Response Cache
Caches data from a backend resource, reducing the number of
requests to the resource. As apps make requests to the same URI,
you can use this policy to return cached responses instead of
forwarding those requests to the backend server. The
ResponseCache policy can improve your API's
performance through reduced latency and network traffic.
Lookup Cache Configures how cached values should be retrieved at runtime.
Populate Cache Configures how cached values should be written at runtime.
Invalidate Cache Configures how the cached values should be purged from the cache.
Reset Quota
Use to dynamically modify the remaining number of requests allowed
by the target Quota policy. You typically use this policy to decrease
the current quota count of the target Quota policy rather than waiting
for the quota count to reset.

All Right Reserved, Copyright FUJITSU LIMITED 2018
3.1.2. Security
Security policies allow API developers and IT managers to control access to APIs with OAuth, API key validation,
and other threat protection features described in table below:
Basic Authentication
Enables you to use lightweight Basic Authentication for
last-mile security. The policy takes a username and password,
Base64 encodes them, and writes the resulting value to a
variable. The resulting value is in the form Basic
Base64EncodedString. You typically write this value to an
HTTP header, such as the Authorization header.
XML Threat Protection
Address XML vulnerabilities and minimize attacks on your API.
Optionally, detect XML payload attacks based on configured
limits.
JSON Threat Protection
Minimizes the risk posed by content-level attacks by enabling
you to specify limits on various JSON structures, such as arrays
and strings.
Regular Expression Protection
Extracts information from a message (for example, URI Path,
Query Param, Header, Form Param, Variable, XML Payload, or
JSON Payload) and evaluates that content against predefined
regular expressions. If any specified regular expressions
evaluate to true, the message is considered a threat and is
rejected.
OAuth v2.0
The heart of the API Management OAuth 2.0 implementation. It
lets you configure OAuth 2.0 "operations" on API Management
that generate access and refresh tokens, issue authorization
codes, and validate tokens. This topic includes code samples to
help illustrate how things work.
Get OAuth v2.0 Info
Gets attributes of tokens and makes them available to policies
and code executing in an API proxy. This policy type can be
useful when you need to configure dynamic, conditional
behavior based on a value in an access token.
Set OAuth v2.0 Info Updates the profile of an access token. For example, you may
want to embed a tag that is unique to your business.
Delete OAuth V2 Info Deletes the specified OAuth V2 authorization code or access
token.
OAuth v1.0a
OAuth 1.0a defines a standard protocol that enables app users
to authorize apps to consume APIs on their behalf, without
requiring app users to disclose their passwords to the app in the
process. API Management enables you to protect APIs in a way
that ensures that an app uses has authorized the app to
consume an API. API Management also provides policy-based
functionality for configuring the endpoints that app developers
can use to obtain access tokens.

All Right Reserved, Copyright FUJITSU LIMITED 2018
Get OAuth v1.0a Info
Gets attributes of tokens and keys and populates flow variables
with the values of those attributes. This policy type can be
useful when you need to configure dynamic, conditional
behavior based on a value in a token or key. Whenever token
validation occurs, variables are automatically populated with
the values of token attributes. However, in cases where token
validation has not occurred, you can use this feature to
explicitly populate variables with these attribute values.
Delete OAuth V1 Info Deletes OAuth v1.0a request tokens, verifiers, and access
tokens.
Verify API Key
The Verify API Key policy lets you enforce verification of API
keys at runtime, letting only apps with approved API keys
access your APIs. This policy ensures that API keys are valid,
have not been revoked, and are approved to consume the
specific resources associated with your API products.
Access Control The Access Control policy lets you allow or deny access to your
APIs by specific IP addresses.
LDAP
Use the LDAP Policy when access to protected resources
should be limited to users in your LDAP provider—such as your
admin users, organization users, and developers—especially
when OAuth token access is either unnecessary or too
heavyweight. The policy is also designed for retrieving DN
metadata for use in API proxy flows.
Generate SAML Assetion
The SAML policy type enables API proxies to attach SAML
assertions to outbound XML requests. Those assertions are
then available to enable backend services to apply further
security processing for authentication and authorization.
Validate SAML Assertion
The SAML policy type enables API proxies to validate SAML
assertions that are attached to inbound SOAP requests. The
SAML policy validates incoming messages that contain a
digitally-signed SAML assertion, rejects them if they are invalid,
and sets variables that allow additional policies, or the backend
services itself, to further validate the information in the
assertion.

All Right Reserved, Copyright FUJITSU LIMITED 2018
3.1.3. Mediation
Mediation policies allows API developers to include any message transformation, parsing, and validation, as well
as raise faults and alerts as part of API development and integration.
JSON to XML
This policy converts messages from the JavaScript Object
Notation (JSON) format to extensible markup language (XML),
giving you several options for controlling how messages are
converted.
XML to JSON
This policy converts messages from the extensible markup
language (XML) format to JavaScript Object Notation (JSON),
giving you several options for controlling how messages are
converted.
Raise Fault Generates a custom message in response to an error condition.
Use Raise Fault to define a fault response that is returned to the
requesting app when a specific condition arises.
XSL Transform
The XSL Transform policy applies custom Extensible stylesheet
language transformations (XSLT) to XML messages, letting you
transform them from XML to another format, such as XML, HTML,
or plain text. The policy is often used to integrate applications that
support XML, but that require different XML-formats for the same
data.
SOAP Message Validation Validates a message against an XSD schema or WSDL definition
and rejects the message if it does not conform.
Assign Message Creates or modifies HTTP request or response messages during
an API proxy flow.
Extract Variables
Extract content from a variable. Often the source variable contains
a request or response messages, including headers, URI paths,
JSON/XML payloads, form parameters, and query parameters.
The policy works by applying a text pattern to the message
content and, upon finding a match, sets a variable with the
specified message content.
Access Entity
Retrieves entity profiles you specify from the API Management
data store. The policy places the profile in a variable whose name
follows the format AccessEntity.{policy_name}.
Key Value Map Operations
Provides policy-based access to a key/value map store available
in API Management. Key/value pairs can be stored, retrieved, and
deleted from named existing maps by configuring
KeyValueMapOperations policies that specify PUT, GET, or
DELETE operations. (At least one of these operations must be
performed by the policy.)

All Right Reserved, Copyright FUJITSU LIMITED 2018
3.1.4. Extension
Extension policies allow creation of custom policy functionality, with support for such features as service callout,
message data collection, and JavaScript behavior to be called within API proxy flow..
JavaScript
This policy lets you add custom JavaScript code that executes
within the context of an API proxy flow. In your custom JavaScript
code, you can use the objects, methods, and properties of the API
Management JavaScript object model.
Service Callout
The Service Callout policy lets you call to another service from your
API proxy flow. You can make callouts to either an external service
(such as an external RESTful service endpoint) or internal services
(such as an API proxy in the same organization and environment).
Statistics Collector
Enables you to collect statistics for data in a message, such as
product ID, price, REST action, client and target URL, and
message length. The data can come from flow variables predefined
by API Management or custom variables that you define.
Message Logging
One of the best ways to track down problems in the API runtime
environment is to log messages. You can attach and configure a
Message Logging policy on your API to log custom messages to a
local disk or to syslog.
Java Callout
Enables you to use Java to implement custom behavior that is not
included out-of-the-box by API Management policies. In your Java
code, you can access message properties (headers, query
parameters, content) and flow variables in the proxy flow. About
policy setting, please see WebAPI-Reference.pdf.
Note: This policy can be used only Advanced Gateway or Backend
Secure Connection services.

All Right Reserved, Copyright FUJITSU LIMITED 2018
3.2. API Proxy Flows
API proxies manage request and response messages using a pipeline processing mode, where the pipeline
consists of a sequence of flows. The API Proxies are attached to different flows in the pipeline, depending on the
type of policy and the action that is to be performed.
3.2.1. What are Flows?
API proxies define request and response flows that are executed in a specific order. The order allows application
of logic and behavior at specific points in the API proxy execution. The request and response flows are subdivided
into proxy and target segments. Each segment is subdivided into the following flow 'stages':
•PreFlow: Always executes before any conditional flows.
•Conditional flows: One or more flows, each of which has an associated condition. Conditional flows tell API
Management, "When you see this, perform this logic." For example, when an API call is a GET on the
/movies resource (the condition), transform the response to JSON (through a policy attached to the
conditional flow). Only one flow executes per transaction—the first flow whose condition evaluates to true.
In a conditional flow, the condition is evaluated in both the request and response. You cannot have separate
conditions for request and response.
•PostFlow: Always executes after any conditional flows.
•PostClientFlow: An optional flow that executes after the response message has been sent to the requesting
client app. (This is a specialized flow, and only MessageLogging policies can be attached to it.)
The following figure shows a basic request and response exchange between an app and a backend service. In
this figure, the ProxyEndpoint and TargetEndpoint have been expanded to show the flows used to process the
request and response:
Flows are executed in the following order in both the Proxy Endpoint and the Target endpoint, first in the request,
then in the response.

All Right Reserved, Copyright FUJITSU LIMITED 2018
3.2.1.1. PreFlow
PreFlows always execute first, and the logic attached in the PreFlow applies to all calls made to the API proxy.
They are useful to make sure that a policy or code executes before anything else happens. For example, you
usually don't want an API proxy to waste any resources on an unauthenticated user. Also, you don't want to
service an app that has exceeded its quota. To support these requirements, security and quota policies can be
put in the PreFlow segment. That way these control policies will always execute before any other processing
takes place.
3.2.1.2. Conditional Flow
API proxy programming starts to get interesting when implementing 'branching' logic for an API. For example, you
might want to convert XML to JSON only when the requesting app is running on a mobile device; or create a new
HTTP response header when the /foo API resource is called; or you might want to return a targeted ad based on
the data in the user's request. This can be achieved by setting up conditional flows.
3.2.1.3. PostFlow
As with PreFlow, the logic attached to the PostFlow applies to all calls made to the API proxy. PostFlow is useful
when there is requirement to log some data, send a notification that something happened, transform the message
format, and so on.
3.2.1.4. PostClientFlow(response only)
An optional PostClientFlow can be added to the ProxyEndpoint that executes after the response is returned to the
requesting client app. Only MessageLogging policies can be attached to this flow. PostClientFlow reduces API
proxy latency and makes information available for logging that is not calculated until after the response is sent,
such as the client.send.start.time and client.send.end.time. The flow is used primarily for measuring the time
interval between the start and end timestamps for the response message.

All Right Reserved, Copyright FUJITSU LIMITED 2018
3.3. Understanding API Resources
RESTful services are collections of API resources. An API resource is a URI path fragment that identifies some
entity that developers can access by calling your API. For example, if your service provides weather reports and
weather forecasts, your backend service might define two API resources:
•http://weather.example.com/reports
•http://weather.example.com/forecasts
When you create an API proxy, at a minimum you're creating an alias base URL that maps to your backend
service. For example:
At this point you can make API calls to your backend using either base URL. But when you use the API proxy
URL, things start to get interesting.
In addition to API analytics that API Management starts to collect when you use the API proxy, proxies also let you
define conditional flows that map to the resources on your backend. In essence, "If a GET call comes in to the
/reports resource, API Management should do something."
Backend base URL New/equivalent API proxy URL
http://weather.example.com http://{assigned_your_domain}/weatherexample
GET
http://{assigned_your_domain}/weatherexample/reports
q
GET
http://weather.example.com/reports
Response:
<tempLastYear>60F</tempLastYear>
Backend resource
Conditional flow to resource
XML to JSON
Response:
{
“tempLastYear”:”60F”
}

All Right Reserved, Copyright FUJITSU LIMITED 2018
3.4. API Development Lifecycle
Every organization has a unique software development lifecycle (SDLC). It is often necessary to synchronize and
align API proxy deployment with the same processes that you use today for developing, testing, and deploying
other applications.
API Services provides tools and RESTful APIs that enable you to integrate API proxy deployment and
management into your organization's SDLC. A common usage of the RESTful API is to write scripts or code that
programmatically deploy API proxies, or that migrate API proxies from one environment to another, as part of a
larger automated process that also deploys or migrates other applications. API Services makes no assumptions
about your SDLC (or anyone else's, for that matter). Rather, it exposes atomic functions that can be coordinated
by your development team to automate and optimize your API development lifecycle.
Environments
Every organization on API Management has two deployment environments that are available for API proxies:
'test' and 'prod'. The distinction between the two environments is arbitrary — each environment is simply
identified by a different set of network addresses (URLs). The goal is to provide you with a domain in which you
can build and verify API proxies before the API is exposed to external developers.
You can leverage these environments to synchronize API proxy development processed with your SDLC. Each
environment is defined by a network address, enabling you to segregate traffic between the API proxies that you
are working on, and those that are being accessed by apps at runtime. The network addresses available for each
environment is defined in the set of VirtualHosts available in that environment.
Inbound, server SSL is automatically enabled for each environment. Two VirtualHosts are pre-defined in each
environment: default and secure. Default defines an HTTP address, while secure defines an HTTP/S address,
with pre-configured server-side SSL. In an API proxy configuration, you indicate which VirtualHosts the
ProxyEndpoint should listen on. When promoting to prod, you typically disable HTTP by removing the default
VirtualHost from the API proxy configuration.
You can see which VirtualHosts are available in an environment by selecting Environments in the API
management UI main menu.
Environments also provide segregation of data and resources. You can, for example, set up different caches in
test and prod, which can be accessed only by API proxies executing in that environment. Additionally, API keys
that are issued in the test environment are not valid in the prod environment, and vice-versa.
Deploying API proxies to environments
When you create an API proxy you'll need to decide which environment you'll be working in. You can choose to
create a new API proxy on production, but that is not recommended as you may expose an API to developers
before it's ready. In general you want to start by creating an API proxy in test which, after testing, you then
'promote' to prod.
Note: Depending on your role, you may not be able to deploy to all environments. For example, the 'user' role can
only deploy to the test environment. If you're an administrator you can deploy to any environment.
All Right Reserved, Copyright FUJITSU LIMITED 2018
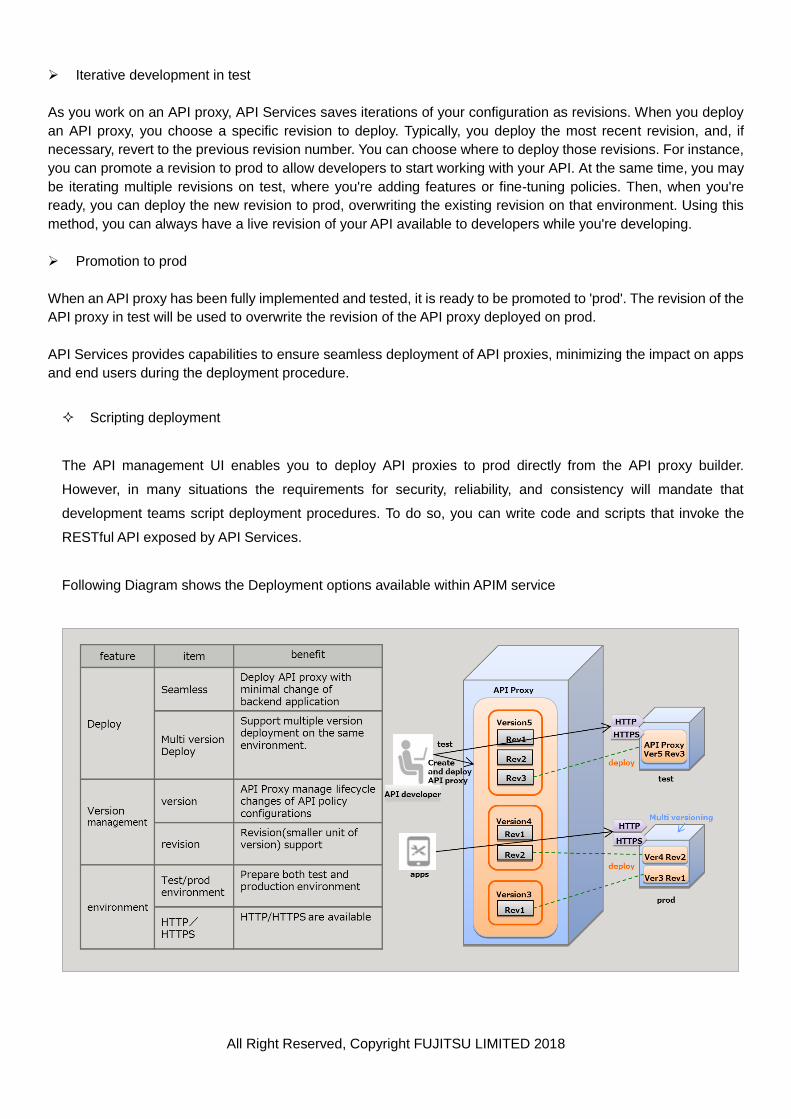
Iterative development in test
As you work on an API proxy, API Services saves iterations of your configuration as revisions. When you deploy
an API proxy, you choose a specific revision to deploy. Typically, you deploy the most recent revision, and, if
necessary, revert to the previous revision number. You can choose where to deploy those revisions. For instance,
you can promote a revision to prod to allow developers to start working with your API. At the same time, you may
be iterating multiple revisions on test, where you're adding features or fine-tuning policies. Then, when you're
ready, you can deploy the new revision to prod, overwriting the existing revision on that environment. Using this
method, you can always have a live revision of your API available to developers while you're developing.
Promotion to prod
When an API proxy has been fully implemented and tested, it is ready to be promoted to 'prod'. The revision of the
API proxy in test will be used to overwrite the revision of the API proxy deployed on prod.
API Services provides capabilities to ensure seamless deployment of API proxies, minimizing the impact on apps
and end users during the deployment procedure.
Scripting deployment
The API management UI enables you to deploy API proxies to prod directly from the API proxy builder.
However, in many situations the requirements for security, reliability, and consistency will mandate that
development teams script deployment procedures. To do so, you can write code and scripts that invoke the
RESTful API exposed by API Services.
Following Diagram shows the Deployment options available within APIM service

All Right Reserved, Copyright FUJITSU LIMITED 2018
Environment resources
For additional control during promotion, it is recommended that you only iterate on API proxies in test, and
make as few changes as necessary to API proxies deployed in prod.
To do so, you need to ensure that certain resources associated with each environment are configured in such a
way that they can remain static in an API proxy configuration.
•Target URLs: It is common for API proxies to call different backend URLs during testing and production. You
can use TargetServer configurations to create environment-independent TargetEndpoint configurations.
•Caches and Key/value maps: Both persistence resources are scoped by environment. You should ensure
that naming conventions are used to enable API proxies to store data without requiring configuration
changes during promotion.
•ServiceCallout targets: Service callouts may use different targets depending on the environment, if, for
example, a ServiceCallout in the test environment consumes a demo service.
To make API proxy configurations environment-independent, you can also use conditional statements.
Conditional statement built with the environment.name variable can be used to evaluate the current
environment before enforcing a policy or before routing to a URL on the backend.
All Right Reserved, Copyright FUJITSU LIMITED 2018
3.5. Trace Tool
3.5.1. Online Trace Tool
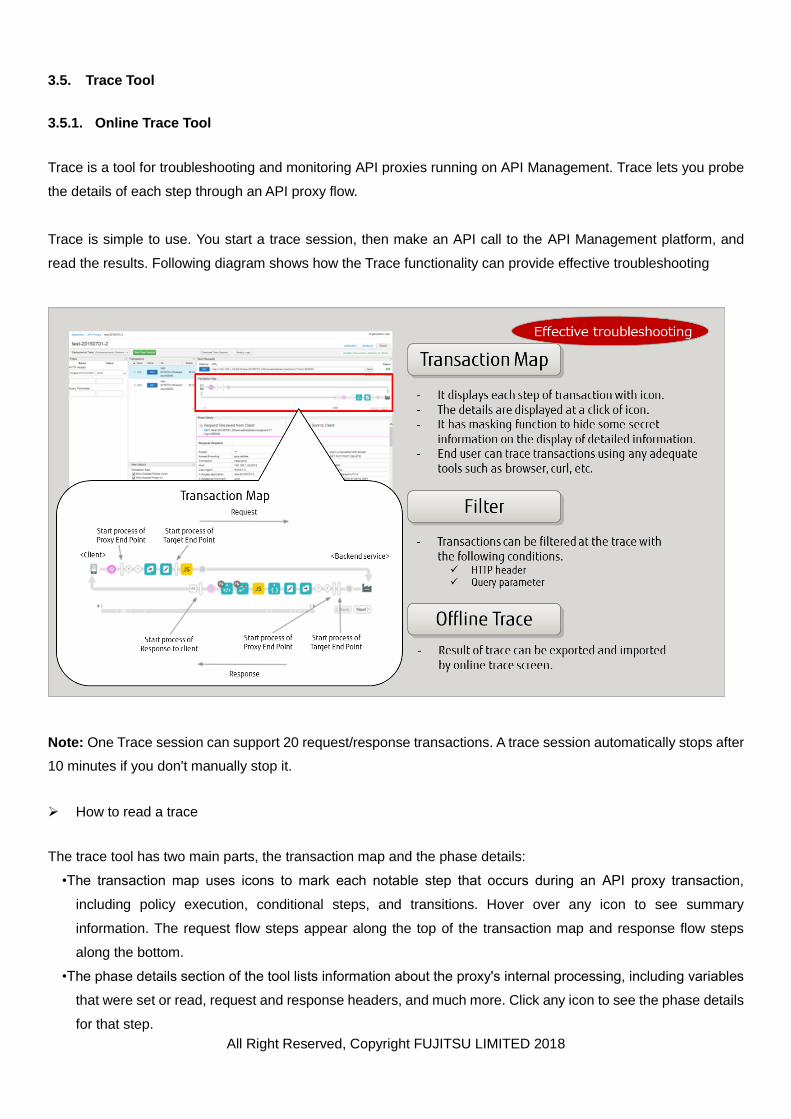
Trace is a tool for troubleshooting and monitoring API proxies running on API Management. Trace lets you probe
the details of each step through an API proxy flow.
Trace is simple to use. You start a trace session, then make an API call to the API Management platform, and
read the results. Following diagram shows how the Trace functionality can provide effective troubleshooting
Note: One Trace session can support 20 request/response transactions. A trace session automatically stops after
10 minutes if you don't manually stop it.
How to read a trace
The trace tool has two main parts, the transaction map and the phase details:
•The transaction map uses icons to mark each notable step that occurs during an API proxy transaction,
including policy execution, conditional steps, and transitions. Hover over any icon to see summary
information. The request flow steps appear along the top of the transaction map and response flow steps
along the bottom.
•The phase details section of the tool lists information about the proxy's internal processing, including variables
that were set or read, request and response headers, and much more. Click any icon to see the phase details
for that step.

All Right Reserved, Copyright FUJITSU LIMITED 2018
Trace tool's transaction map
Here's a sample trace tool map with the main proxy processing segments labeled:
Transaction map legend
The following table describes the intent of the icons you will see in the transaction map. These icons mark each of
the notable processing steps throughout the proxy flow.
Transaction map icons
The client app that sends a request to the ProxyEndpoint of the API
proxy.
The circles mark transitional endpoints in the proxy flow. They are
there when a request comes in from the client, when the request goes
to the target, when the response comes back from the target, and
when the response goes back to the client.
The tall bars indicate the beginning of a flow segment in the API proxy
flow. Flow segments are: ProxyEndpoint request, TargetEndpoint
request, TargetEndpoint response, and ProxyEndpoint response. A
segment includes the PreFlow, Conditional Flows, and PostFlow.
Indicates that Analytics actions have occurred in the background.
A conditional flow that evaluates to true.
A conditional flow that evaluates to false.

All Right Reserved, Copyright FUJITSU LIMITED 2018
…
Polices. Each type of policy has a unique icon. This one is for the
AssignMessage policy. These icons let you see where policies are
executed in the proper order and if they are successful or not. You can
click a policy icon to see the results of its execution and if they are
expected or not. For example, you can see if the message was
transformed properly or if it is being cached.
Note: Properly executing policies are clearly indicated by
check-marks. In the case of an error, a red exclamation mark is
displayed on the icon.
Tip: Pay attention to the tooltip or the time line to see if any policy is
taking longer than expected.
Appears when the backend target is a Node.js application.
The backend target called by the API proxy.
The time line indicates how long (in milliseconds) that the processing
time took to complete. Comparing the elapsed time segments helps
you isolate the policies that are taking the longest to execute that are
slowing down your API calls.
The Epsilon indicates a time-span smaller than a millisecond.
Disabled. Appears on a policy icon when a policy is disabled. A policy
can be disabled with the public API.
Error. Appears on a policy icon when the Policy Step condition
evaluates to false, or on the RaiseFault policy icon whenever a
RaiseFault policy executes.
Skipped. Appears on a policy icon when the policy was not executed
because the step condition evaluated to false.

All Right Reserved, Copyright FUJITSU LIMITED 2018
Understanding the phase details
The Phase Details part of the tool tells you a lot about the state of your proxy at each processing step. Here are
some of the details provided in the Phase Details. Click any icon in the trace tool to see details for the selected
step, or use the Next/Back buttons to move from one step to another.
Debugging with Trace
Trace lets you see a lot of internal details about an API proxy. For example:
•You can see at a glance which policies are executing correctly or failing.
•Let's say you noticed through one of the Analytics dashboards that one of your APIs is experiencing an
unusual decrease in performance. Now, you can use Trace to help identify where the bottleneck is occurring.
Trace gives the time, in milliseconds, that it takes for each processing step to complete. If you find one step is
taking too long, you can take corrective action.
•By looking at the phase details, you can check headers that are being sent to the backend, view variables set
by policies, and so on.
•By verifying the base path, you can ensure that a policy is routing the message to correct server.
Phase Detail Description
Proxy Endpoint Indicates which ProxyEndpoint flow was selected for execution. An
API proxy can have multiple named proxy endpoints.
Request Headers Lists the HTTP request headers.
Request Content Shows the HTTP request body.
Properties Properties represent the internal state of the API proxy. These are
not shown by default.
Variables Read Lists the flow variables that were read by a policy.
Variables Read and Assigned Lists the flow variables that were read and assigned a value by a
policy.
Target Endpoint Indicates which TargetEndpoint was selected for execution.
Response Headers Lists the HTTP response headers.
Response Content Shows the HTTP response body.
PostClientFlow
Shows information about the PostClientFlow, which executes after
the request is returned to the requesting client app. Only
MessageLogging policies can be attached to the PostClientFlow.
The PostClientFlow is currently used primarily for measuring the
time interval between the start and end timestamps for the response
message.

All Right Reserved, Copyright FUJITSU LIMITED 2018
Selecting View Options
Choose the view options for the trace session.
Downloading trace results
You can download an XML file of the trace results for viewing offline. The file shows the complete details of the
listening session including the contents of all headers, variables and policies.
To download raw trace output, click Download Trace Session.
Option Description
Show Disabled Polices Show any disabled policies. A policy can be disabled with the public
API.
Show Skipped Phase
Show any phases that were skipped. A skipped phase occurs when
policy was not executed because the step condition evaluated to
false.
Show all FlowInfos Represent transitions within a flow segment.
Automatically Compare Selected Phase Compares the selected phase to the previous one. Turn this off to
see only the selected phase.
Show Variables Show or hide variables that were read and/or assigned a value.
Show Properties Properties represent the internal state of the API proxy. (Hidden by
default.)

All Right Reserved, Copyright FUJITSU LIMITED 2018
3.5.2. Offline Trace Tool
What is the Offline Trace tool?
The Offline Trace tool lets you view and analyze trace sessions that were previously saved. A saved trace session
is essentially a "recording" of a trace session, and can be useful for cases where troubleshooting and further
analysis is required. The UI for the Offline Trace tool is similar to the "live" Trace tool. To learn about the Trace
Tool UI and on saving trace sessions, see 3.5.1 Online Trace Tool.

All Right Reserved, Copyright FUJITSU LIMITED 2018
4. Publish This chapter explains the process of Publishing APIs within APIM service and the tasks to be
completed both at API development and API Proxy definition stage before the external end points
can access the API service.

All Right Reserved, Copyright FUJITSU LIMITED 2018
4.1. Publishing Overview
A developer builds an app that makes requests to your APIs to access your backend services. The following
image shows the relationship of a developer to an app and to an API:
Publishing is the process of making your APIs available to app developers for consumption. API Management
supports a flexible publishing model that gives you complete control over the publishing process.
Publishing API tasks can be broadly defined by the following tasks:
1. Create the API products on API Management that bundle your APIs.
2. Register app developers on API Management.
3. Register apps on API Management.

All Right Reserved, Copyright FUJITSU LIMITED 2018
4.1.1. Task1: Create an API product on API Management
The first task in publishing is to create an API product. An API product is a collection of API resources that are
offered as a package to app developers for consumption. Create API products by using the API Management
UI.
In this figure, your API consists of two products, each containing three API resources.
As an API provider, you are responsible for building the APIs and API products to handle access control, usage
restrictions, and any other business requirements. For example, you might:
•Release a free API product that allows read-only access to its API resources.
•Release a second API product for a low price that allows read/write access to the same API resources as
the free version but with a low access limit, such as 1000 requests per day.
•Release a third API product for a higher price that allows read/write access the same API resource but with
a high access limit.
The important thing to remember is that API Management give you the flexibility to create API products that
match the business requirements of your APIs.

All Right Reserved, Copyright FUJITSU LIMITED 2018
4.1.2. Task2: Register an app developer on API Management
A developer creates the apps that consume your APIs. Developers must be registered on API Management
before they can register an app and receive an API key.
Through the app registration process, you control who has access to your APIs. At any time, you can delete an
app developer, which invalidates all API keys associated with that developer, therefore denying that developer
access to your APIs.
As an API provider, you decide how to register developers. For example, you can use a manual registration
process that requires a potential developer to contact your organization to register. The potential developer
must supply all necessary information, such as an email address, first and last name, and company name. If
you approve the developer’s request, you can use the API management UI to manually register the developer.

All Right Reserved, Copyright FUJITSU LIMITED 2018
4.1.3. Task3: Register an app on API Management
Before an app can access your APIs, the app must be registered on API Management.
At the time of app registration, you selects one or more API products. For example, you might publish multiple
API products corresponding to different types of services and pricing plans. You can then pick and choose from
the list of available API products.
Note: API Management does not require that you to let the developer associate multiple API products with an
app. Your publishing plan can be structured such that the developer can select only a single API product.
In response to registering the app on API Management, API Management assigns a unique API key to the app.
The app must pass that API key as part of every request to an API resource. The key is authenticated and, if
valid, the request is granted. At any time, you as the service provider can revoke the key so that the app can no
longer access your APIs.

All Right Reserved, Copyright FUJITSU LIMITED 2018
4.2. What is an API Product?
API products are the central mechanism for authorization and access control to your APIs. In API Management,
API keys are provisioned, not for APIs themselves, but for API products. In other words, API keys are provisioned
for bundles of resources with an attached service plan. When an app attempts to access an API product,
authorization is enforced by API Management at runtime to ensure that:
The requesting app is permitted to access a particular API resource.
The requesting app has not exceeded the permitted quota.
If defined, the OAuth scopes defined in the API product matches those associated with the access token
presented by the app.
The API product is the mechanism through which your APIs are bundled and published so that developers can
consume them.
An API product is a collection of API resources (URIs) combined with a service plan and presented to developers
as a bundle. The API product can also include some metadata specific to your business for monitoring or
analytics.
API products are also a good way to control access to a specific bundle of resources. For example, you can
bundle resources that can only be accessed by internal developers, or bundle resources that can only be
accessed by paying customers.
The API resources bundled in a product can come from one or more APIs, so you can mix and match resources
to create specialized feature sets as shown below

All Right Reserved, Copyright FUJITSU LIMITED 2018
You can set different properties on each API product. For example, you might make available one API product
with a low access limit, such as 1000 requests per day, for a bargain price. You then release another API product
that provides access to the same resources, but with a much higher access limit, for a higher price. Or, you might
create a free API product that allows read-only access to resources, and then sell an API product to the same
resources that allows read/write access.
4.2.1. Access API products from an app
Apps are how developers access your API products. When a developer registers an app, you select the API
products to associate with the app, and API Management generates an API key for the app. By default, a single
key provides access to all API products associated with the app. When the app makes a request, API
Management first verifies that the API key is valid and fails the request if not.
4.2.2. Register developers for your API
Developers build the apps that access your APIs. However, a developer must first be registered in your
organization before they can register an app.
All Right Reserved, Copyright FUJITSU LIMITED 2018
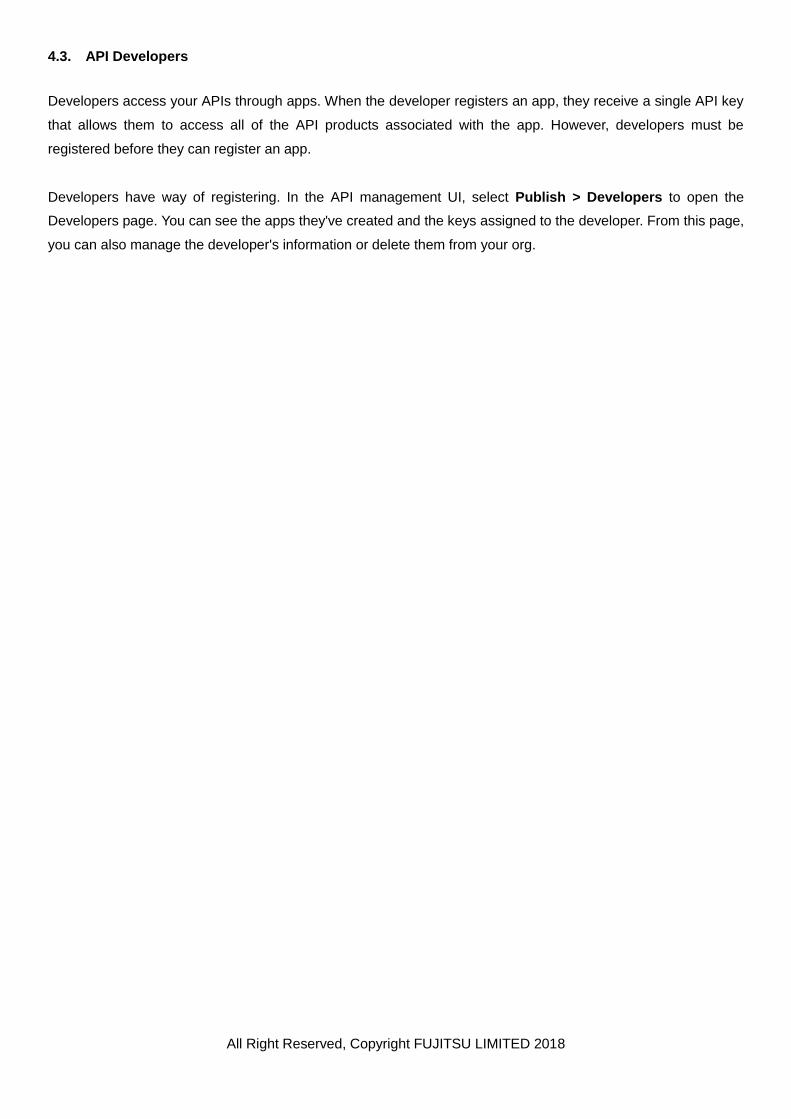
4.3. API Developers
Developers access your APIs through apps. When the developer registers an app, they receive a single API key
that allows them to access all of the API products associated with the app. However, developers must be
registered before they can register an app.
Developers have way of registering. In the API management UI, select Publish > Developers to open the
Developers page. You can see the apps they've created and the keys assigned to the developer. From this page,
you can also manage the developer's information or delete them from your org.

All Right Reserved, Copyright FUJITSU LIMITED 2018
4.4. About Apps
Developers register apps to access your API products. When a developer registers an app, the developer selects
the API products to associate with the app and API Management generates an API key. Each app has a single
API key that provides access to all API products associated with the app.
Apps allow you to control who can access your APIs. You can revoke an app's key, preventing it from accessing
all API products. Or you can revoke access to a single API product associated with the app.
You can see all of your organization's apps in the API Management UI on the Publish > Developer Apps
summary page. This page displays performance data for each app, and general information on app keys. You can
select a specific app from the table to get more detailed information, including the API products that app can
access and the resources those products expose. You can also see the key associated with the app.

All Right Reserved, Copyright FUJITSU LIMITED 2018
5. Analytics This chapter provides details on various analytics information available about the API’s supported
as part of API Proxy service on APIM platform.

All Right Reserved, Copyright FUJITSU LIMITED 2018
5.1. Proxy Performance
The Proxy Performance dashboard helps you see API proxy traffic patterns and processing times. You can easily
visualize how much traffic your APIs generate and how long it takes for API calls to be processed, from the time
they are received by API Management until they are returned to the client app.
5.1.1. Traffic
TOTAL TRAFFIC The total number of API requests received by API Management for an API
environment in an organization.
TRAFFIC SUCCESS The total number of requests that resulted in a successful response. Error
responses do not count.
TRAFFIC ERRORS The total number of all API requests that are unsuccessful, that is, the
request does not deliver a response as desired by the end user.
AVERAGE TPS The average number of API requests and resulting responses per second.

All Right Reserved, Copyright FUJITSU LIMITED 2018
5.1.2. Average Response Time
AVERAGE RESPONSE TIME The average of the Total Response Time measured for all API calls
made to an API Management organization environment. The Total
Response Time is the amount of time it takes for an API call to API
Management to return (in milliseconds).
Or, put another way, total response time is the time measured from
when an entire API call is received on API Management to the time API
Management begins sending a response back to the client app.
This chart measures the average for all proxies. For individual proxies,
see the Average Response Time by Proxy chart below.
AVERAGE PROXY RESPONSE
TIME
This value is calculated as the average of the Total Response Time
minus the Target Response Time for all API calls made to an API
Management organization environment.
It's basically a measure of how much time the API calls spend flowing
through API Management itself (in milliseconds).
AVERAGE TARGET RESPONSE
TIME
The average number of milliseconds that it takes from the point the last
byte of a request is sent from API Management to a backend target to
the time API Management receives the last byte of the response.
It's basically measuring how much time the API call spends on the
target system.
5.1.3. Traffic by Proxy
For the specified API proxy, the number of recorded API requests and responses.
5.1.4. Average Response Time by Proxy
For the specified API proxy, the average of the Total Response Time measured for all API calls made to an API
Management environment. The Total Response Time is the amount of time it takes for an API call to API
Management to return (in milliseconds).
Hover over the graph to see the total amount of time spent on the proxy side and the target side, as well as the
average

All Right Reserved, Copyright FUJITSU LIMITED 2018
5.2. Target Performance
The Target Performance dashboard helps you visualize traffic patterns and performance metrics for API proxy
backend targets.
5.2.1. Traffic by Target
All Targets Traffic Measures the total amount of traffic that passes from API Management
to all backend targets.
<Target name> Measures the total amount of traffic that passes from API Management
to the specified backend target.
5.2.2. Traffic
TOTAL TRAFFIC Measures the total amount of traffic that passes from API
Management to all backend targets. Same as All Targets Traffic.
ERRORS The total number of requests to backend targets that resulted in an
unsuccessful response. Error responses do not count.
SUCCESS The total number of all requests to backend targets that are
successful (that do not return an error).
Only API Managment Pro

All Right Reserved, Copyright FUJITSU LIMITED 2018
5.2.3. Response Time
AVERAGE TIME The average of the Total Response Time measured for all API calls
made to an API Management organization environment. The Total
Response Time is the amount of time it takes for an API call to API
Management to return (in milliseconds).
Or, put another way, total response time is the time measured from
when an entire API call is received on API Management to the time
API Management begins sending a response back to the client app.
AVERAGE TARGET TIME The average number of milliseconds that it takes from the point the
last byte of a request is sent from API Management to a backend
target to the time API Management receives the last byte of the
response.
It's basically measuring how much time the API call spends on the
target system.
AVERAGE PROXY TIME This value is calculated as the Total Response Time minus the
Target Response Time.
It's basically a measure of how much time the API call spends
flowing through API Management itself (in milliseconds).
5.2.4. Target Errors
TOTAL ERRORS Measures the total number of errors sent from backend targets to
API Management.
3XX ERRORS Measures the total number of HTTP 3XX sent from backend targets
to API Management.
4XX ERRORS Measures the total number of HTTP 4XX errors sent from backend
targets to API Management.
5XX ERRORS Measures the total number of HTTP 5XX sent from backend targets
to API Management.

All Right Reserved, Copyright FUJITSU LIMITED 2018
5.2.5. Payload Size
TOTAL PAYLOAD SIZE The total payload size for all requests and responses between API
Management and backend targets.
REQUEST PAYLOAD SIZE The total payload size for all requests sent from API Management to
backend targets.
RESPONSE PAYLOAD SIZE The total payload size for all responses sent from backend targets to
API Management.

All Right Reserved, Copyright FUJITSU LIMITED 2018
5.3. Cache Performance
The Cache Performance dashboard lets you see at a glance the value of your API Management cache. The
dashboard helps you visualize the benefit of the cache in terms of lower latency and reduced load backend
servers.
5.3.1. Metrics
Average cache hit rate The rate of calls hitting the cache measured against total API traffic.
All cache hits The sum of calls that hit the cache.
Average time with cache The average amount of time for an API call when it hits the cache.
Average time without cache The average amount of time for an API call when it does not hit the
cache.
Cache improvement Compares the average time with cache and average time without
cache, giving you an idea of the overall effect of the cache on API
performance.
Cache hits by app Sum of calls hitting the cache broken down by developer app.
Only API Managment Pro

All Right Reserved, Copyright FUJITSU LIMITED 2018
5.4. Latency Analysis
The Latency Analysis dashboard can alert you to any latency issues your API proxies may be experiencing. It
displays latency measurements down to the window of a minute, highlighting the median, 95th percentile, and
99th percentile values.
The median value tells you the point at which half of your traffic is experiencing latency that is less than this value
and half of your traffic is experiencing latency that is greater than this value. For example, if the median response
time latency for your selected API proxy is 62 ms, it means that half of the responses from this API proxy take less
than 62 ms. It also means that half of the responses from this API proxy take more than 62 ms.
The 95th percentile and 99th percentile values tell you the point at which 95% and 99% of your traffic is
experiencing latency that is less than these values. Or rather more importantly, it can point out outlying behavior,
telling you that 5% and 1% of your traffic is experiencing latency values that are out-of-range.
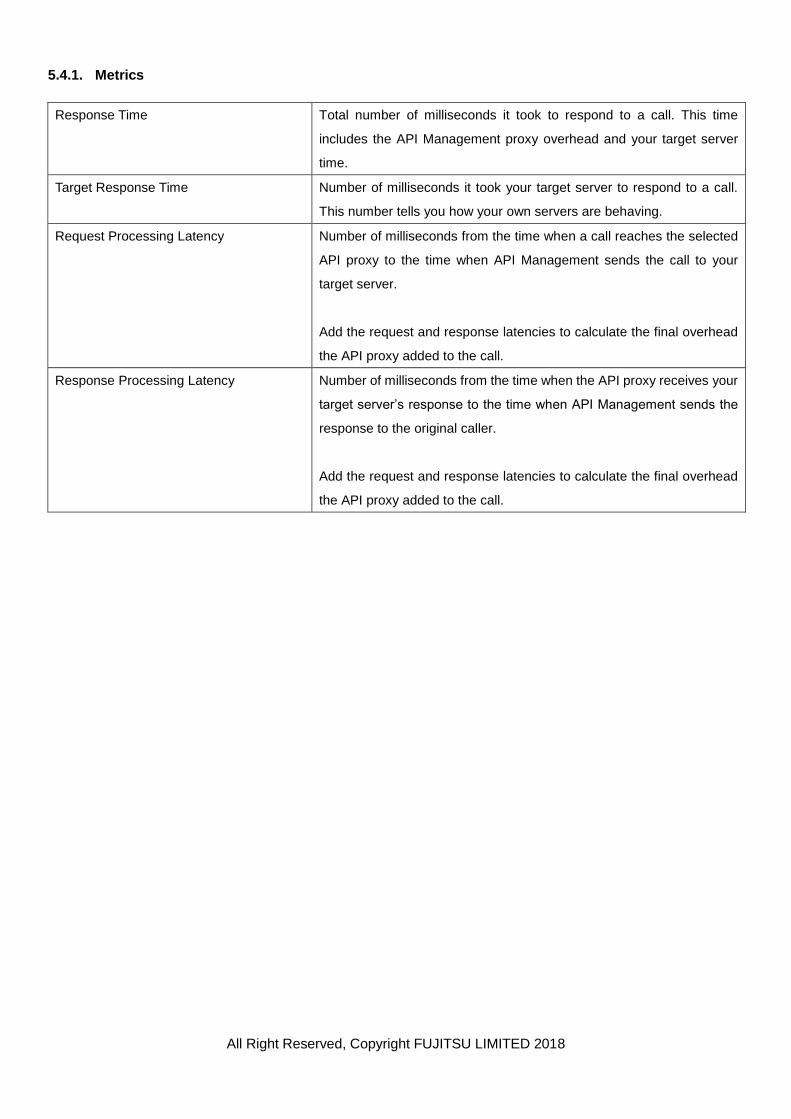
All Right Reserved, Copyright FUJITSU LIMITED 2018
5.4.1. Metrics
Response Time Total number of milliseconds it took to respond to a call. This time
includes the API Management proxy overhead and your target server
time.
Target Response Time Number of milliseconds it took your target server to respond to a call.
This number tells you how your own servers are behaving.
Request Processing Latency Number of milliseconds from the time when a call reaches the selected
API proxy to the time when API Management sends the call to your
target server.
Add the request and response latencies to calculate the final overhead
the API proxy added to the call.
Response Processing Latency Number of milliseconds from the time when the API proxy receives your
target server’s response to the time when API Management sends the
response to the original caller.
Add the request and response latencies to calculate the final overhead
the API proxy added to the call.

All Right Reserved, Copyright FUJITSU LIMITED 2018
5.5. Error Analysis
The Error Analysis dashboard tells you about error rates for API proxies and targets.
Only API Managment Pro

All Right Reserved, Copyright FUJITSU LIMITED 2018
5.5.1. Error Composition
Total Errors The total number of errors that resulted from all requests and
responses seen in an API Management organization over the specified
time period.
Proxy Errors The total number of proxy errors seen in an API Management
organization in the specified time period. Proxy errors are measured
between the time an entire request is received by API Management
from a client and the time the request is sent to the backend target.
Target Errors The total number of target errors seen in an API Management
organization in the specified time period. Target errors are measured
between the time an entire request is sent by API Management to a
backend target and the time the response is returned the client app.
5.5.2. Proxy Errors
Total Proxy Errors The total number of proxy errors seen in an API Management
organization in the specified time period. Proxy errors are measured
between the time an entire request is received by API Management
from a client and the time the request is sent to the backend target.
4XX Shows the number proxy errors that resulted in HTTP 4xx errors.
5XX Shows the number API requests that resulted in HTTP 5xx errors. For a
complete list of HTTP status codes, see "Status Code Definitions" in the
HTTP specification.
5.5.3. Target Errors
Total Target Errors The total number of target errors seen in an API Management
organization in the specified time period. Target errors are measured
between the time an entire request is sent by API Management to a
backend target and the time the response is returned the client app.
4XX The number target errors that resulted in HTTP 4xx errors.
5XX The number target errors that resulted in HTTP 5xx errors.
5.5.4. Errors by Proxy
The total number of proxy errors seen in an API Management organization in the specified time period for each
individual proxy. Hover over the bars to see the number of errors that came from the each proxy request flow and
from the target request flow, respectively.
Proxy errors are measured between the time an entire request is received by API Management from a client and
the time the request is sent to the backend target.

All Right Reserved, Copyright FUJITSU LIMITED 2018
5.5.5. Errors by Target
The total number of target errors seen in an API Management organization in the specified time for each
individual target. The number of error calls that did not reach any target are listed in the Target Not Contacted
column. Hover over the bars to see the number of errors that came from the each proxy response flow and from
the target response flow, respectively.
Target errors are measured between the time an entire request is sent by API Management to a backend target
and the time the response is returned to the client app. The chart shows the number of errors that came from the
proxy response flow and from the target response flow, respectively.

All Right Reserved, Copyright FUJITSU LIMITED 2018
5.6. Developer Engagement
The Developer Engagement dashboard tells you which of your registered app developers are generating the
most API traffic. For each of your developers, you can find out who is generating the most API traffic and the most
errors. For example, if a particular developer's app is generating a lot of errors relative to other developers, you
can pro-actively address the problem with that developer.
5.6.1. Engagement
Total Developers The total number of developers associated with APIs deployed to an
organization.
Developers with Apps The total number of developers associated with apps in an
organization.
Active Developers The number of developers generating any amount of API traffic.
Developers may exist in the organization and have apps, but if their
apps aren't making any API calls, they're not active.
Highly Active Developers The number of developers generating API traffic exceeding 50
transactions per hour.
5.6.2. Active Developers
"Active developers" means the number of developers generating any amount of API traffic. Developers may exist
in the organization and have apps, but if their apps aren't making any API calls, they're not active.
App Name The name of the app.
Proxy Name The name of the API proxy associated with the app.
Only API Managment Pro

All Right Reserved, Copyright FUJITSU LIMITED 2018
Developer Email The email address of the developer who registered the app.
Product Name The product name associated with the app.
Traffic The amount of traffic generated by the app for the selected time period.
TPH The transactions per hour generated by the app for the selected time
period.
Errors The total number of errors generated by the app for the selected time
period.
Error Rate The error percentage calculated by dividing total errors by total traffic
for the selected time period.
Actions Click the Analyze button to see more details about an app.
5.6.3. Analyze developer engagement
In this view, select the metric you wish to view for the selected app.

All Right Reserved, Copyright FUJITSU LIMITED 2018
5.6.4. Metric
Proxies used by <App Name> Measures all APIs that have traffic generated by the selected app.
Traffic level of other apps using the same
proxies
Measures the API traffic flowing through all apps using the same set of
APIs as the currently selected app.
Other Apps by Developer Measures other apps generating traffic registered by the same
developer as the developer of the selected app.
Other Apps using the same Proxies Measures other apps, from the same developer or not, that use the
same set of APIs used by the selected app

All Right Reserved, Copyright FUJITSU LIMITED 2018
5.7. Traffic Composition
The Traffic Composition dashboard measures the relative contribution of your top APIs, apps, developers, and
products to your overall API program.
Use the report to detect business problems such as lower traffic trends or diminishing contribution from key apps
and developers. Based on this data, you can decide what corrective action to take. You can also get early
notification of new entities that contribute to API traffic, and take actions to respond — for example, you can
determine which new developers are highly contributing and include them in nurturing programs.
Note: The Traffic Composition dashboard requires data range queries to be more than a month (for example,
November 30 to December 31). Queries over less than a month return an empty page (for example, December 1
to December 31).
5.7.1. Metric
Top 10 Proxies Traffic Shows the top 10 proxies measured by API traffic.
Top 10 Apps Traffic Shows the top 10 developer apps measured by API traffic.
Top 10 Products Traffic Shows the top 10 products measured by API traffic.
Top 10 Developers Traffic Shows the top 10 developers measured by API traffic.

All Right Reserved, Copyright FUJITSU LIMITED 2018
5.7.2. By Dimension mode
This mode lets you drill in to see traffic pattern details for specific proxies, developer apps, developers, and
products. For example, you can see at a glance how traffic for a specific proxy compares to all other proxies.
5.7.2.1. Dimension
Proxies Show the traffic of each API Proxy.
Developer Apps Show the traffic of each App.
Developers Show the traffic of each Developer.
Products Show the traffic of each Product.
5.7.2.2. Traffic Composition
Shows the traffic for all entities of the selected dimension or all entities combined over the selected time interval.
5.7.2.3. Top 10 Monthly Composition
This view's pie charts let you quickly compare traffic patterns for all of your proxies, developer apps, products, or
developers.
5.7.2.4. Traffic by Dimension
All Dimensions Traffic Shows the traffic for all of the selected dimension in one chart.
Dimensions can include API proxies, developer apps, developers, or
products.
Proxy-specific traffic Shows the traffic for the selected dimension.

All Right Reserved, Copyright FUJITSU LIMITED 2018
5.8. Business Transactions
The Business Transactions Dashboard lets you monitor and visually compare traffic for specific API patterns
across multiple API proxies. This information helps you understand changes in API traffic that might be caused by
specific business, marketing, or partner events.
For example, suppose that your marketing team hosts a program that drives customers to a specific site. The URI
pattern for that site will experience an increase in traffic, giving the team a way to measure the impact of the
program in real time.
5.8.1. Metric
Traffic Also known as throughput. The number of API requests and resulting
responses seen by the organization.
Average Response Time The time an API takes to respond to an incoming request.
Error Rate The fraction of all API requests that are unsuccessful, that is, the
request does not deliver a response as desired by the end user.
Average Data Exchange The size of request and response. That is, the amount of data that is
transferred in both directions as a request for an API, and as a
response that is generated and delivered to the calling entity.
5.8.2. MOST TRAFFIC
Show the biggest number of traffic, and the path related.
5.8.3. LEAST TRAFFIC
Show the least number of traffic, and the path related.
5.8.4. HIGHEST ERROR RATE
Show the highest error rate, and the path related.

All Right Reserved, Copyright FUJITSU LIMITED 2018
5.8.5. LOWEST ERROR RATE
Show the lowest error rate, and the path related.

All Right Reserved, Copyright FUJITSU LIMITED 2018
5.9. Devices
The Devices dashboard tells you about the devices and servers that are being used to access your APIs. It lets
you spot trends in how users are accessing your APIs. For instance, you might notice that traffic from one type of
device is increasing, while another is going down, and then decide if the change requires any action or not.
5.9.1. Traffic by Platform
Measures how much traffic is coming from a specific application, like Google Chrome, Safari, Firefox, cURL, IE,
and other platforms.
5.9.2. Traffic by Agent
Tells you if traffic is coming from a browser, a robot, a library, or other agents.

All Right Reserved, Copyright FUJITSU LIMITED 2018
5.9.3. Traffic by Device Type
Tells you if traffic is coming from a PC, a mobile device, and other categories.

All Right Reserved, Copyright FUJITSU LIMITED 2018
5.10. Custom Reports
A custom report is a way to specify precisely what you want to measure across your API program. For instance,
you can measure all API traffic generated from a specific client IP address.
A custom report is similar in look and feel to analytics dashboards, however the data that's displayed depends on
the metrics and drill-down dimensions you selected when you created the custom report.
5.10.1. + Custom Report button
You can create custom reports by clicking + Custom Report button.
5.10.2. Report Name Links
Displays the result of analytics for clicked Report Name, like a figure below.
Only API Managment Pro

All Right Reserved, Copyright FUJITSU LIMITED 2018
5.10.2.1. Edit button
You can edit the custom report by clicking on the Edit button.
5.10.2.2. Analyze buttons
Click Analyze button in the Summary table to see more metrics, including Compare to Previous Period and
Analyze Anomalies.

All Right Reserved, Copyright FUJITSU LIMITED 2018
6. Admin This chapter covers the details on Administrative functions available within APIM service.

All Right Reserved, Copyright FUJITSU LIMITED 2018
6.1. About Users
When you assign a user to an organization, you must specify the user's role in that organization. The user's role
determines the actions that the user is allowed to perform in that organization. For example, some users are
allowed to create APIs, while others can view APIs but cannot modify them.
6.1.1. What Information Defines a User?
An API Management user is defined by a:
•First name
•Last name
•Email address
•Password
The email address and password function as the user's credentials when logging in to the API management UI.
6.1.2. What are Roles?
Roles determine the actions allowed by the user in that organization.
Roles are essentially CRUD-based permission sets. CRUD means "create, read, update, delete". For example, a
user may be given a role in an organization that permits read, or "get", access to details about a protected entity,
but not write permission to update or delete it. The organization administrator is the highest-level role in the
organization, and can perform any CRUD operation on any entity in the organization.
6.1.2.1. User roles
In API Management, user roles form the basis of role-based access, meaning that you can control what functions
a person can access by assigning them a role (or roles). Here are a few things you need to know about roles:
•When an org admin adds you to an org, your role (or roles) are determined by the administrator. The
organization administrator can later change your role(s) if necessary.
•Users can be assigned more than one role. If a user has multiple roles assigned, the greater permission takes
precedence. For example, if one role doesn't allow the user to create API proxies, but another role does, then
the user can create API proxies. In general, it is not a common use case to assign users multiple roles.
•By default, all users associated with an organization can view details about other organization users, such as
email address, first name, and last name.
It's important to understand that user roles are specific to the organization in which they were assigned. An API
Management user can belong to multiple organizations, but roles are organization-specific. For example, a user
can be have the organization administrator role in one org and only the user role in another.

All Right Reserved, Copyright FUJITSU LIMITED 2018
6.1.2.2. Predefined organization roles
All API Management organizations are created with the following roles with a predefined set of permissions:
Role Description
Business User The business user has permission to edit the Analytics and can
operate the Trace. However, Admin function and screen of the
Environment Configuration are not displayed and also the other
functions are read-only.
Operations Administrator The operations admin has permission to deploy the APIs and can
operate the Trace. However, Admin function and screen of the
Environment Configuration are not displayed and also the other
functions are read-only.
Organization Administrator The org admin has permission to do full CRUD operations on all
protected entities in the admin's organization.
User The user has permission to edit the API Proxies and can operate the
Trace. However, Admin function and screen of the Environment
Configuration are not displayed and also the other functions are
read-only.
You can also create custom roles, with custom permissions, in your organization.
An organization contains two distinct types of users:
•Organization users: Create, modify, and deploy APIs, create and manage entities such as API products,
developers, and developer apps, generate analytics reports, and perform other administrative tasks.
•Developers: Build the apps that make requests to your APIs. A developer is not an API Management global
user. Think of developers as your API customers. To access the APIs in your organization, a developer must
be registered with the organization and then request an API key. A developer can be registered with multiple
organizations to consume APIs from different organizations.
The big difference between users and developers in an organization is that users are API Management users
that build and maintain APIs, while developers are customers that build apps that consume those APIs.
Developers typically do not have user accounts on API Management, and cannot log in to the API Management
UI. The exception to this is an organization user who creates their own developer and developer apps for testing
purposes.
6.1.3. Managing organization users
This topic explains how to manage organization users. You must be an organization administrator to perform
these tasks.

All Right Reserved, Copyright FUJITSU LIMITED 2018
6.1.3.1. What are Organization Users?
Organization users are given explicit permission by the organization administrator to create, read, edit, and/or
delete entities in an API Management organization. Permissions are role-based, where a role conveys a specific,
targeted set of permissions. This permission scheme is also called role-based access control, or RBAC for short.
Note: Organization users are typically members of your API team who develop and test APIs, run reports, and
perform other API admin tasks. Do not confuse organization users with app developers, the consumers of your
APIs. The process of onboarding app developers and managing their access to your APIs is an entirely separate
topic. See 4.1 Publishing Overview.
Also, note that topic applies to API management, not API BaaS, which has its own user management framework.
6.1.3.2. API Management Entities and Organization Users interaction
Organization users can interact with the following entities. The degree of interaction permitted depends on the
role or roles that are assigned to the user by the organization administrator.
•API proxies
•API products
•Developer apps
•Developers
•Environments (Trace tool sessions and deployments)
•Custom reports (Analytics)

All Right Reserved, Copyright FUJITSU LIMITED 2018
6.2. API, Product, and organization history
API Management provides a "history" feature that can be helpful in troubleshooting problems as well as
managing API usage. The history feature enables you to view the operations (create, update, read, delete, deploy
or undeploy) that have been performed on your APIs and API products over time. You can see who performed
each operation, when the operation was performed, the request URI, and the response code. For update
operations, you can also view the request body that was as passed in the API call.
6.2.1 API history
This screen will shows the logs that are operations history to API Proxy. You can change the date range for the
history to the last day, last week, 2 months, 3 months, or last year, by selecting from the menu next to Showing
data for last.
You can also view the request body for the each operation by clicking Show in the Request Body column for the
operation.

All Right Reserved, Copyright FUJITSU LIMITED 2018
6.2.2 API product history
This screen will shows the logs that are operations history to API product. You can change the date range for the
history to the last day, week, 2 months, 3 months, or year, by selecting from the menu next to Showing data for
last. And also, can view the request body for the each operation by clicking Show in the Request Body column for
the operation.
6.2.3 Organization history
This screen will shows the logs that are operations (e.g. create API proxy) history to organization. Click Details in
row to see more information about a particular change, such as the management API call that was made and the
operation that was executed.


![2007.5 FUJITSU LIMITED Product Guide...FUJITSU SEMICONDUCTOR circuit examples, in this document are presented solely for the [Microcomputer] PRODUCT GUIDE 2007.5 ©2007 FUJITSU LIMITED](https://static.fdocuments.us/doc/165x107/5e4b3af7c22c8804e260d1a6/20075-fujitsu-limited-product-guide-fujitsu-semiconductor-circuit-examples.jpg)