Fuel Research at UTRC - kinetics.nist.gov
39
Med Colket, Steve Zeppieri, Zhongtao Dai, and Don Hautman 5th Annual Fuel Research Meeting Multi-Agency Coordinating Council for Combustion Research Sandia National Laboratories, Livermore, CA September 17-20, 2012 Fuel Research at UTRC
Transcript of Fuel Research at UTRC - kinetics.nist.gov

Med Colket, Steve Zeppieri, Zhongtao Dai,
and Don Hautman
5th Annual Fuel Research Meeting Multi-Agency Coordinating Council for Combustion Research
Sandia National Laboratories, Livermore, CA
September 17-20, 2012
Fuel Research at UTRC

2
Background
Secure supply
Military needs guaranteed fuel supply in time of war
Global Warming:
Combustion of fossil-derived fuels
Combustion emissions (soots/particulates)
Physics-based combustor models
Existing models barely sufficient for design predictions
Physical vs. chemical effects
Typically, physical effects presumed to dominate (except soot)
Complexity of fuels
Large number of species
Unknown/uncertain reaction rate laws
DoD needs
AF – 50% utilization of alternative fuels by 2016 (in US)
Navy - Sailing the 'Great Green Fleet' by 2016/50% Utilization by 2020
SERDP – Understand impact on emissions

3
Acknowledgements
Sharon Beermann-Curtin
Jennifer Klamo
Mel Roquemore
Tim Edwards
Dale Shouse
Bruce Sartwell
Fokion Egolfopoulos
Matt Oehlschlaeger
Tonghun Lee
Tony Dean
Bob Kee
Bill Pitts
Tom Litzinger
Jeff Lovett
Heidi Hollick
4
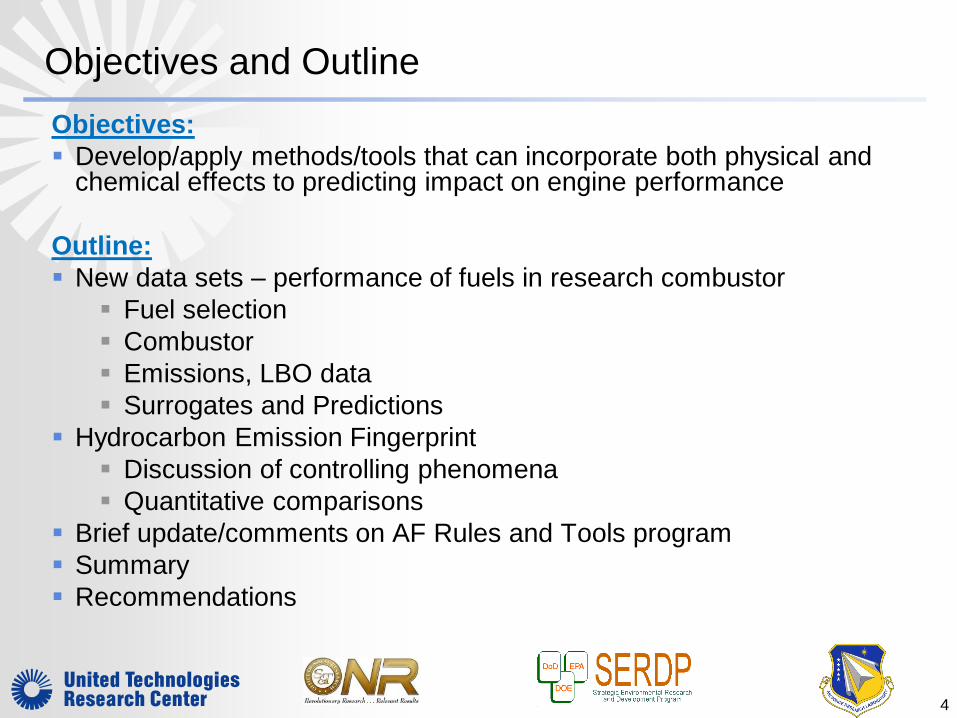
Objectives and Outline
Objectives:
Develop/apply methods/tools that can incorporate both physical and chemical effects to predicting impact on engine performance
Outline:
New data sets – performance of fuels in research combustor
Fuel selection
Combustor
Emissions, LBO data
Surrogates and Predictions
Hydrocarbon Emission Fingerprint
Discussion of controlling phenomena
Quantitative comparisons
Brief update/comments on AF Rules and Tools program
Summary
Recommendations

5
Combustor Validation Data – Fuels Tested
Feedback from ONR – We need combustor data for different fuels!
Fuels Description
Mean
MW
Flash
Point [C]
Density
[g/ml]
Cetane
#
IBP FBP
Jet-A Baseline
JP-5 Baseline 63 0.815 182 253 43.0
HRJ
JP-5
ONR Supplied, Camelina
based alternate fuel 62 0.768 174 286 66.0
Sasol
IPK
Coal-derived kerosene,
supplied by AFRL (POS
7629) 149 53 0.765 174 232 31.3
Shell
GTL
Natural gas based gas-to-
liquid kerosene, supplied by
AFRL (POS 5729) 137 43 0.736 154 195 58.4
LinPar
1416 Low aromatic solvent 201 117 0.768 247 277 81.8*
L-142 Low aromatic solvent 156 61 0.804 177 233 46.5*
L-210 Low aromatic solvent 193 96 0.825 240 283 53.1*
Boiling Pt.
[C]

6
Combustor Validation Data – Fuels
(cyclo: sum of monocyclic and dicyclic compounds
0
10
20
30
40
50
60
70
8 9 10 11 12 13 14 8 9 10 11 12 13 14 15 16 8 9 10 11 12 13 14 15 13 14 15 16
Ma
ss F
ract
ion
[%
]
Carbon Number
normal-
iso-
cyclo-
Sasol IPK Shell GTL
LinPar 1416
L-142 L-210
Wide range of chemical properties
Solvents and synthetic fuels explore contrasting physical/chemical changes

7
Combustor Validation
Validation data sets for JP-5 and alternatives
Testing performed in UTRC JBTS facility
Rig simulates conventional combustor flowpath/operation

8
Rich-Quench-Lean (RQL) Combustor Technology
Optimized for operability while minimizing
NOx emissions and combustor length
9
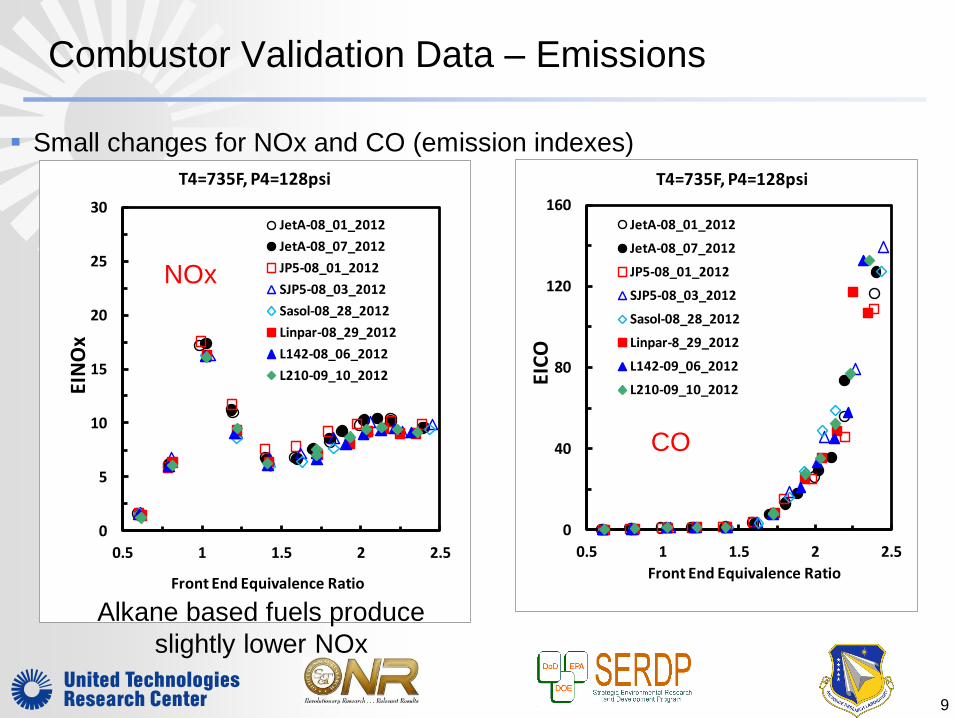
Combustor Validation Data – Emissions
Small changes for NOx and CO (emission indexes)
0
5
10
15
20
25
30
0.5 1 1.5 2 2.5
EIN
Ox
Front End Equivalence Ratio
T4=735F, P4=128psi
JetA-08_01_2012
JetA-08_07_2012
JP5-08_01_2012
SJP5-08_03_2012
Sasol-08_28_2012
Linpar-08_29_2012
L142-08_06_2012
L210-09_10_2012
Alkane based fuels produce
slightly lower NOx
0
40
80
120
160
0.5 1 1.5 2 2.5E
ICO
Front End Equivalence Ratio
T4=735F, P4=128psi
JetA-08_01_2012
JetA-08_07_2012
JP5-08_01_2012
SJP5-08_03_2012
Sasol-08_28_2012
Linpar-8_29_2012
L142-09_06_2012
L210-09_10_2012
NOx
CO

10
Combustor Validation Data – Emissions
Smoke data for several jet fuels and solvents
10
Alkane based fuels
(synthetic jet fuels and
solvents) produce less
soot.
Anomalous high soot
levels at low f/a ratios
for Camelina HRJ
(SJP5)
0
20
40
60
80
0.5 1 1.5 2 2.5
Smo
ke N
um
ber
f - Front End
T4=735F, P4=128psi
JetA-08_01_2012
JetA-08_07_2012
JP5-08_01_2012
SJP5-08_03_2012
Sasol-08_28_2012
Linpar-08_29_2012
L142-09_07_2012
L210-09_10_2012

11
Fuels Analyzed (courtesy of Tonghun Lee (MSU))
11
• Navy & Air Force Fuels Total Ion Chromatograms
Petroleum JP-5
Camelina HRJ
(JP-5)
Camelina HRJ
(JP-8)
Retention Time [min]
Anomalous soot possibly due to large concentration of high MW species

12
0.55
0.56
0.57
0.58
0.59
0.60
0.61
0.62
0.63
0.64
0.65
Sasol IPK L-210 JP-5 Jet-A L-142 HRJ JP-5 Linpar
1416
Fro
nt-
End
Eq
uiv
ale
nce
Ra
tio
Test 1
Test 2
Test 3
Combustor Validation Data – Lean Blow Off
Lean Blow-Out (LBO) data
Highest temperature (most robust)
Lowest Pressure (least robust)

13
Combustor Validation Data – Lean Blow Off
LBO data
Highest temperature (most robust)
Lowest Pressure (least robust)
0.55
0.56
0.57
0.58
0.59
0.60
0.61
0.62
0.63
0.64
0.65
Sasol IPK L-210 JP-5 Jet-A L-142 HRJ JP-5 Linpar
1416
Fro
nt-
End
Eq
uiv
ale
nce
Ra
tio
Test 1
Test 2
Test 3
Uncertainties are significant

14
Combustor Validation Data – Lean Blow Off
LBO data for jet fuels and solvents
Highest temperature (most robust)
Lowest Pressure (least robust)
0.55
0.56
0.57
0.58
0.59
0.60
0.61
0.62
0.63
0.64
0.65
Sasol IPK L-210 JP-5 Jet-A L-142 HRJ JP-5 Linpar
1416
Fro
nt-
End
Eq
uiv
ale
nce
Ra
tio
Test 1
Test 2
Test 3
Petroleum fuels are similar;
HRJ maybe slightly better

15
Modeling Methods – Physical Models
Lean Blow Off – Extinction of a ‘Perfectly Stirred Reactor’
Simplified, kinetics-based model of physical problem (CHEMKIN based)
1600
2100
2600
3100
3600
1.00E-06 1.00E-05 1.00E-04 1.00E-03
Tau (sec)
Tem
pera
ture
(F
)
n-Heptane/Air
Ti = 1857 F
P = 6 atm.
Phi = 2.0
PSR
Extinction Time
PSR Ignition Time
Extinction
Time
Ignition
Time
Te
mp
era
ture
Tau (sec)
Volume, V
Residence time,
Temperature, T
Enthalpy, hk
Mass Fraction, Yk
inlet outletm
Y*k
h*k
m
Yk
hk
Heat loss
Q
. .Volume, V
Residence time,
Temperature, T
Enthalpy, hk
Mass Fraction, Yk
inlet outletm
Y*k
h*k
m
Yk
hk
Heat loss
Q
Volume, V
Residence time,
Temperature, T
Enthalpy, hk
Mass Fraction, Yk
inlet outletm
Y*k
h*k
m
Yk
hk
Heat loss
Q
. .

16
Surrogate Selection – preliminary (awaiting new data)
Targets –
Chemical
classes, MW
Liq vol
fraction
Mass
fraction
Liq vol
fraction
Mass
fraction
Liq vol
fraction
Mass
fraction
Liq vol
fraction
Mass
fraction
n-decane 0 0 0 0
n-dodecane 0 35 0.358 35 0.349 0
n-tetradecane 0 0 0 0
n-cetane (n-hexadecane) 43 0.428 25 0.264 25 0.257 0
iso-octane (2,2,4-trimethylpentane) 20 0.178 40 0.378 0 20 0.188
2,2,4,6,6-pentamethylheptane 0 0 40 0.394 70 0.704
methylcyclohexane 15 0.149 0 0 0
n-butylcyclohexane 0 0 0 10 0.109
m-xylene (1,3) 22 0.245 0 0 0
grams/cc 0.776 grams/cc 0.732 grams/cc 0.751 grams/cc 0.736
MW 137.5 MW 152.1 MW 181.9 MW 152.7
H/C 1.903 H/C 2.19 H/C 2.16 H/C 2.16
BP(K) 462.8 BP(K) 463.8 BP(K) 493.3 BP(K) 438.1
ONR - JP-5 ONR - JP-5 (HRJ) ONR - JP-5 (HRJ) - a Sasol IPK
Liq vol
fraction
Mass
fraction
Liq vol
fraction
Mass
fraction
Liq vol
fraction
Mass
fraction
Liq vol
fraction
Mass
fraction
n-decane 30 0.305116 0 0 0
n-dodecane 0 30 0.293 0 10 0.099
n-tetradecane 0 0 0 0
n-cetane (n-hexadecane) 0 70 0.707 0 5 0.051
iso-octane (2,2,4-trimethylpentane) 40 0.386 0 0 0
2,2,4,6,6-pentamethylheptane 30 0.309 0 30 0.286 60 0.589
methylcyclohexane 0 0 20 0.198 0
n-butylcyclohexane 0 0 50 0.515 15 0.159
m-xylene (1,3) 0 0 0 0
grams/cc 0.718 grams/cc 0.766 grams/cc 0.775 grams/cc 0.753
MW 136.3 MW 206.5 MW 135.6 MW 171.0
H/C 2.21 H/C 2.14 H/C 2.05 H/C 2.13
BP(K) 420.2 BP(K) 539.4 BP(K) 438.0 BP(K) 466.4
Shell GTL Linpar 1416 L-142 L-210Reaction model
complied from
JetSurf,
SERDP, LLNL
(iso-octane) +
new
isododecane
model

17
Iso-dodecane Combustion Model
Iso-Octane
(2,2,4 tri-methyl-pentane)
Iso-Dodecane
(2,2,4,6,6 penta-methyl-heptane)
Iso-Cetane
(2,2,4,4,6,8,8 hepta-methyl-nonane)
-Gasoline primary reference fuel -Diesel reference fuel
Constructed by analogy from Curran, et al iso-octane model
Pyrolysis portion validated against data (see Zeppieri, et al)
Higher MW iso-alkane oxidation model needed to match jet fuel MW
Detailed model unavailable

18
1.00E-06
1.00E-05
1.00E-04
1.00E-03
1.00E-02
1.00E-01
0.0004 0.0006 0.0008 0.001 0.0012
Ign
itio
n D
ela
y [s
ec.
]
1/Temperature [K-1]
Iso-Octane
Iso-Dodecane
P=10 atm.Stoichiometric Fuel-Air
Oxidation Model Benchmarked Against Iso-Octane Model
Iso-Dodecane ignition delay comparable to iso-octane value above ~1500 K;
Iso-C12 delay ~ 1.3-1.75 x Iso-C8 delay below 1500K

19
Computed Stirred Reactor Extinction Times
surrogates
1.00E-05
1.00E-04
1.00E-03
1.00E-02
1.00E-01
1.00E+00
0.5 0.7 0.9 1.1 1.3 1.5 1.7 1.9
Exti
nct
ion
Tim
e [
sec.
]
PSR Equivalence Ratio
Sasol IPK
L-210
L-142
Jet A
JP-5
HRJ JP-5
Linpar 1416
Test Conditions:
T3: 430 F
P3: 80 psia
Combustor LBO Calibration (1.1E-04 sec)

20
Comparison to Model Calculations
PSR Extinction Times consistent with Experimental Trends
0.54
0.56
0.58
0.6
0.62
0.64
0.66
0.68
0.56 0.58 0.6 0.62 0.64 0.66
Sim
ula
ted
Fro
nt-
End
LB
O E
qu
iv. R
atio
Experimental Front-End LBO Equiv. Ratio
Sasol IPK
L-210
L-142
Jet-A
JP-5
HRJ JP-5
Linpar 1416
Based on calibrated
LBO time

21
Comparison to Model Calculations
0.54
0.56
0.58
0.6
0.62
0.64
0.66
0.68
0.56 0.58 0.6 0.62 0.64 0.66
Sim
ula
ted
Fro
nt-
End
LB
O E
qu
iv. R
atio
Experimental Front-End LBO Equiv. Ratio
Sasol IPK
L-142
Jet-A
JP-5
HRJ JP-5
Linpar 1416
PSR Extinction Times consistent with Experimental Trends
Homogeneous reaction chemistry appear
to dominate – Physical effects would
suggest counter trends

22
Or ---- LBO Correlates with DCN even Better!
30
40
50
60
70
80
90
0.55 0.56 0.57 0.58 0.59 0.6 0.61 0.62
(Der
ived
) C
eta
ne
Nu
mb
er
Average Experimental Front-End LBO Equiv. Ratio
Sasol IPK
L210
L-142
Jet-A
JP-5
HRJ JP-5
Linpar 1416

23
Objectives and Outline
Objectives:
Develop/apply methods/tools that can incorporate both physical and chemical effects to predicting impact on engine performance
Outline:
New data sets – performance of fuels in research combustor
Fuel selection
Combustor
Emissions, LBO data
Surrogates and Predictions
Hydrocarbon Emission Fingerprint
Discussion of controlling phenomena
Quantitative comparisons
Brief update on AF Rules and Tools program
Summary
Recommendations

24
Challenge Problem: HC Emissions from Gas turbine Engines
Empirical evidence that emissions scale linearly – independent of engine or power
• What physical/chemical processes control this scaling?
• Can impact of alternative fuels on atmospheric pollution be anticipated?
APEX 2 APEX 3

25
Approach – presented last year
Identify chemistry and physics controlling scalability of HC emissions
Methodology:
• Utilize reactor-network formulation to simulate flowfield of burner • Fuel used: 77% dodecane, 23% m-xylene (vol %) – SERDP mechanism
• Initially assumed “bulk flow” conditions (e.g., total flow rates, total burner volume,
etc.)
• Modified to focus on conditions with measurable emission levels and those
exhibiting scaling
• Approximate “Idle”/low-power conditions:
P3 = 4.08 atm,
T3 = 478 K
F overall ~ 0.25
•
• Good Results – but Reactor Model: Too Complex!!!!

26
Reactor Network Solutions – Phi Sweep
UHC EI are functions of equivalence ratio of first quench reactor
0
20
40
60
80
100
120
140
0
5
10
15
20
25
30
35
40
45
50
0 5 10 15 20 25
C2
H4
Exi
t E
I [g
m/k
g-fu
el]
HC
Exi
t E
I [gm
/kg-
fue
l]
CH2O Exit EI [gm/kg-fuel]
CH4-EI
CH3CHO-EI
C3H6-EI
C4H6-EI
C6H6-EI
C2H4-EI
Fuel (initial)
Primary Air
Secondary/Dilution Air
(evenly added over 20 reactors)
Fuel (final)
Lean Quench Inlet
Rich Quench Inlet
Idle (5% Power)

27
Hypothesis for Fingerprint
Fuel CO CO2 Prod1,2
Fuel => Prod1 + Prod2
Prod1 Prod2 (?) - or just decomposition species
Prod1,2 + oxidizer => CO, CO2
Prod1 , Prod2 stay in constant ratio – formation and decay
Related to known oxidation sequence

28
Example: Structure of Opposed Jet Flame (premixed)
Scaling of HC species corresponds to fuel chemistry (decomposition of parent fuel
(Burned gas vs. fuel/air)
0
500
1000
1500
2000
2500
0
10
20
30
40
50
60
70
80
90
1.1 1.105 1.11 1.115 1.12 1.125 1.13 1.135 1.14
Fue
l, C
O,
CO
2 E
I [gm
/kg-
fue
l]
EI [
gm/k
g-fu
el]
Distance [cm.]
CH2O
CH4
C2H4
C3H6
C4H6
C6H6
NC12H26
MXYLENE
CO
CO2
Reactant side
of flame
(premixed)

29
Example: Computed HC Ratios in Opposed Jet Flames
HC-EI Trends vs. CH2O-EI very similar to trends from PSR Network Analysis
(Burned gas vs. fuel/air)
0
10
20
30
40
50
60
70
80
90
0 5 10 15 20
HC
EI [
gm/k
g-fu
el]
CH2O EI [gm/kg-fuel]
CH4
C2H4
C3H6
C4H6
C6H6
Premixed
(phi=1)

30
Extended studies
Opposed jet – premixed (variable phi)
Premixed flames (variable phi)
Altered Network reactor assumptions
Variable initial equivalence ratio
Variable initial reactor residence time
Variable quench time
O2
heated fuel/N2
flame

31
Example : Impact of Initial Equivalence Ratio
Lower branch shows scaling of EI values
0
20
40
60
80
100
120
140
160
180
0 5 10 15 20 25
Eth
en
e E
I [gm
/kg-
fue
l]
Formaldehyde EI [gm/kg-fuel]
0.6
0.8
1.0
1.2
2.0
Initial Streak Equivalence Ratio:

32
Impact of Quench Time (in first quench reactor)
Scaling independent of injection time up to point of peak CH2O formation
0
20
40
60
80
100
120
140
160
180
0 5 10 15 20 25
Eth
en
e E
I [gm
/kg-
fue
l]
Formaldehyde EI [gm/kg-fuel]
0.8 microsec.
1.6 microsec.
2.4 microsec.
3.2 microsec.
Quench Fuel Addition Injection Time:

33
Computed Scaling Factors vs. Experiments
- Scaling factors are slopes of HC-EI/CH2O-EI correlations
- All models used SERDP mechanism with n-Dodecane/m-Xylene Fuel
Similar results amongst model assumptions AND reasonable agreement with
experimental data
PSR
Network Opposed Jet Opposed Jet
Pre-
mixed
Pre-
mixed Spicer Aerodyne
(Lean Side)
(Burned (0.6)
vs. Fuel/Air
(Fuel/Air (1.0)
vs. Fuel/Air
Phi =
0.6
Phi =
1.0
(JP-5/CFM-
56/idle)
(AAFEX/J
P-8)
CH4 0.44 0.49 0.72 0.42 0.76 0.43 -
C2H4 3.27 4.25 3.93 3.2 4.2 2.69 1.33
C3H6 0.61 1.63 1.59 1.45 1.66 0.79 0.51
C4H6 0.06 0.23 0.14 0.14 0.15 0.3 -
C6H6 0.17 0.18 0.09 0.05 0.1 0.32 0.16
Engine DataModel Predictions
Lean side –
independent of
model
assumptions

34
0
500
1000
1500
2000
2500
3000
0
50
100
150
200
250
300
350
0 0.1 0.2 0.3 0.4 0.5 0.6 0.7 0.8 0.9 1
Tem
pe
ratu
re [K
]
Ve
loci
ty [c
m/s
ec]
Distance [cm.]
Vel.
Temp.
Time Scale Considerations
Quench time-scales need to be significantly less than reactive flame-front
residence times
0
500
1000
1500
2000
2500
-150
-100
-50
0
50
100
150
200
0 0.2 0.4 0.6 0.8 1 1.2 1.4 1.6 1.8 2
Tem
pe
ratu
re [K
]
Ve
loci
ty [c
m/s
ec]
Distance [cm.]
V(cm/s)
T(K)
tau-res:
~ 250 msec. tau-res:
~ 175 msec.
PSR-quench time scales: 20 msec. Fuel (initial)
Primary Air
Secondary/Dilution Air
(evenly added over 20 reactors)
Fuel (final)
“Idle”/low-power conditions
P3 = 4.08 atm,
T3 = 478 K

35
AF – Rules and Tools Program
Restarted late last spring
Combustor rig preliminary design complete
Rig construction and testing not expected until mid next year
Fuels selected (~10)
Combustion tests recommended for the fuels
Extinction strain rate
Ignition
Flow reactor speciation

36
Conclusions – Emission and LBO tests
Lean Blow-off limits trend with chemical nature of fuel
Pure n-alkane fuel is most robust
Largely branched i-alkanes least robust
Physical effects not quantified but appear to be minor
Correlates with PSR extinction and DCN
Near to blow-off (not shown) CO emissions trend similarly
Higher power CO emissions – no clear trend
NOx emissions nearly identical
Small decrease with alkane fuels

37
Conclusions – Hydrocarbon Fingerprint
• Network PSR quench model yields linear relationship amongst selected
hydrocarbon products
• relatively independent of initial assumptions
• Linear relationships also observed through flame-fronts of opposed-jet
and premixed fuel-air systems
• Calculated emission index ratios (HCEI/CH2OEI) from PSR Network,
opposed-jet and premixed flame calculations are qualitatively similar to
each other and to experimental values
• Quenching must occur faster than progression of reaction front, e.g., 10-
50 microseconds
• Preliminary results (not shown) indicate results dependent on surrogate
chemistry

38
Recommendations - 2012
Assess LBO – DCN correlation generality – or limitations
Plot of DCN vs. extinction for surrogate compounds?
Reactivity index
Mechanisms – with defined accuracies/uncertainties – how to
quantify?
Robust surrogate generation method
(Better) Validated mechanisms for monocyclic and bicyclic
alkanes

39
Thank You!!!!!