Measuring Availability in Telecommunications Networks Mattias Thulin, November 2004

Slide 2
Fuel Manufacturing and its Environmental Effects
Ernst Thulin [email protected]
Jakob [email protected]
ATS YGN meeting in Espoo 3 November

Slide 3
Outline of Presentation
I. Overview of Fuel Factory in Västerås
II. Conversion and Pelletizing
III. Overview of Fuel Rod Manufacturing
IV. Environmental Effects

Slide 4
The Nuclear Fuel Factory in Västerås/Sweden
•In operation since 1966
•One of the most modern fabrication plants in the world
•Licensed for 600 t UO2/y
•Products: BWR and PWR fuel, BWR control rods, UO2-powder
• Processes: UF6 –>UO2
conversion to final assembly incl component manufacturing
•Certified to ISO 9001, 14001 and other standards
General:
Slide 5
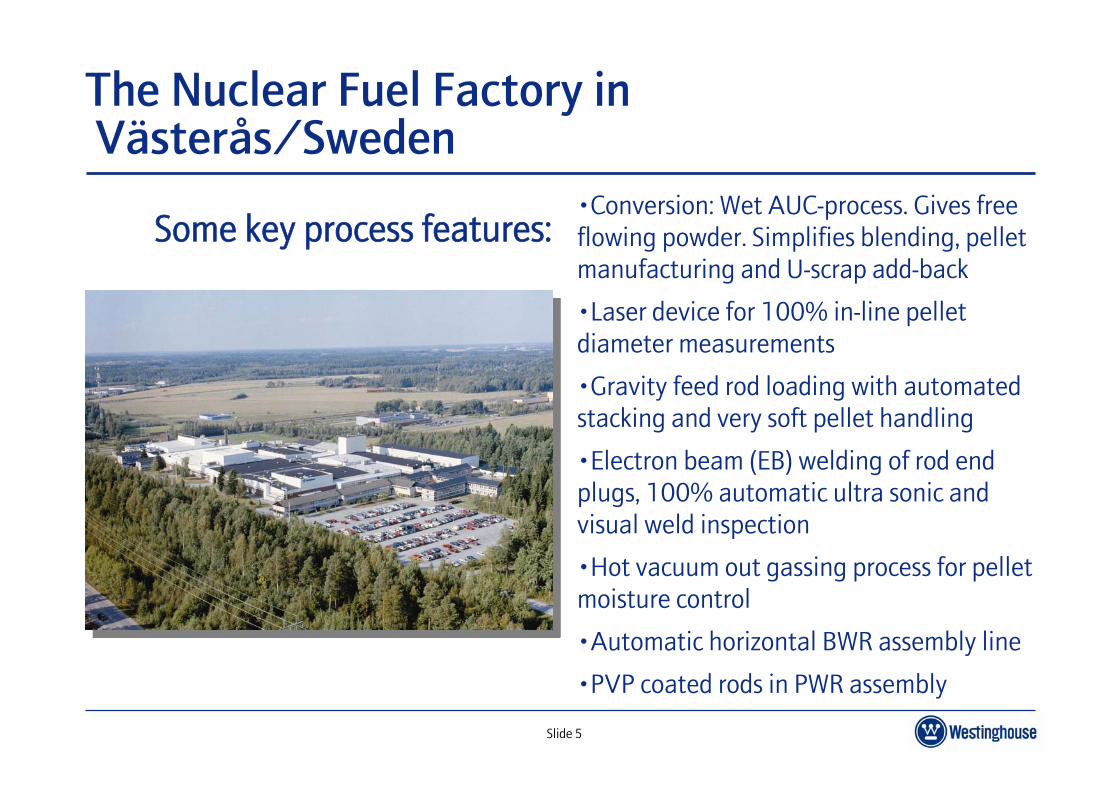
The Nuclear Fuel Factory in Västerås/Sweden
•Conversion: Wet AUC-process. Gives free flowing powder. Simplifies blending, pellet manufacturing and U-scrap add-back
•Laser device for 100% in-line pellet diameter measurements
•Gravity feed rod loading with automated stacking and very soft pellet handling
•Electron beam (EB) welding of rod end plugs, 100% automatic ultra sonic and visual weld inspection
•Hot vacuum out gassing process for pellet moisture control
•Automatic horizontal BWR assembly line
•PVP coated rods in PWR assembly
Some key process features:

Slide 6
Sweden Fuel Fabrication Experience (31 May, 2005)
BWR 31316 FA(10x10 13004 FA)
PWR 1934 FA(17x17 1114 FA) Conversion 9234 ton UO2 powder
Control Rods5058 pcs.
BWR Fuel Channels38571 pcs.(20916 SVEA)
Slide 7
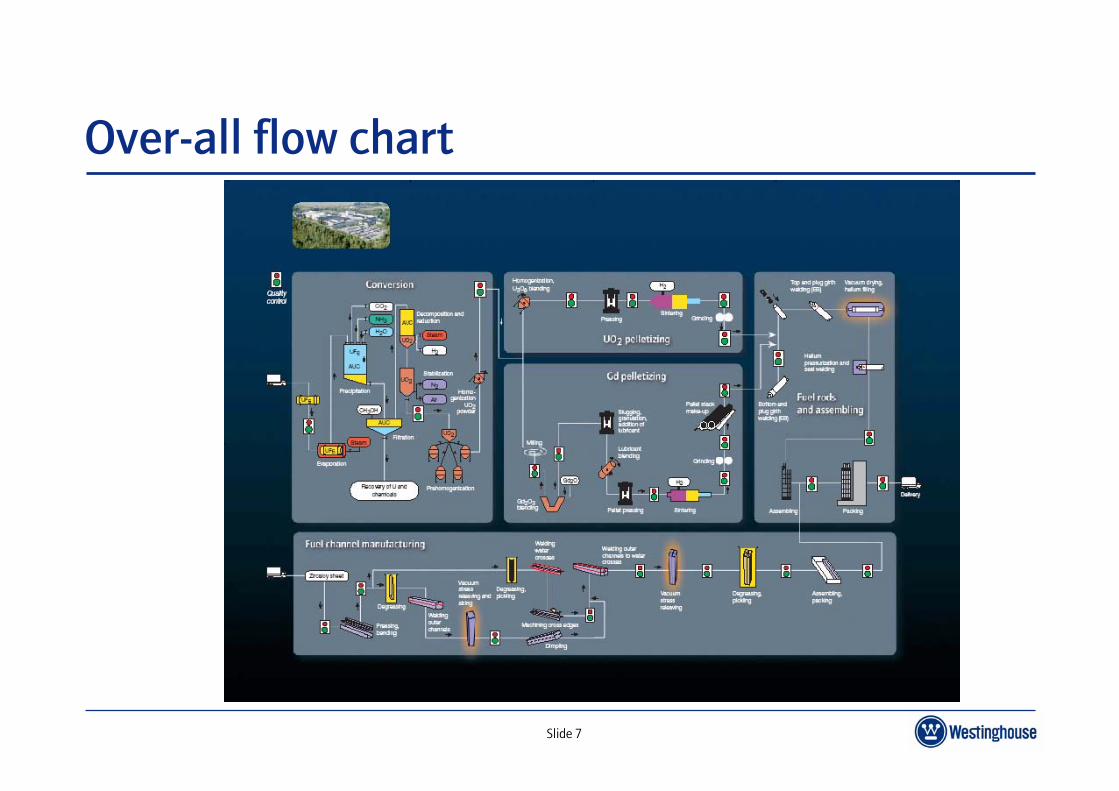
Over-all flow chart
Slide 8
Conversion and Pelletizing
Slide 9
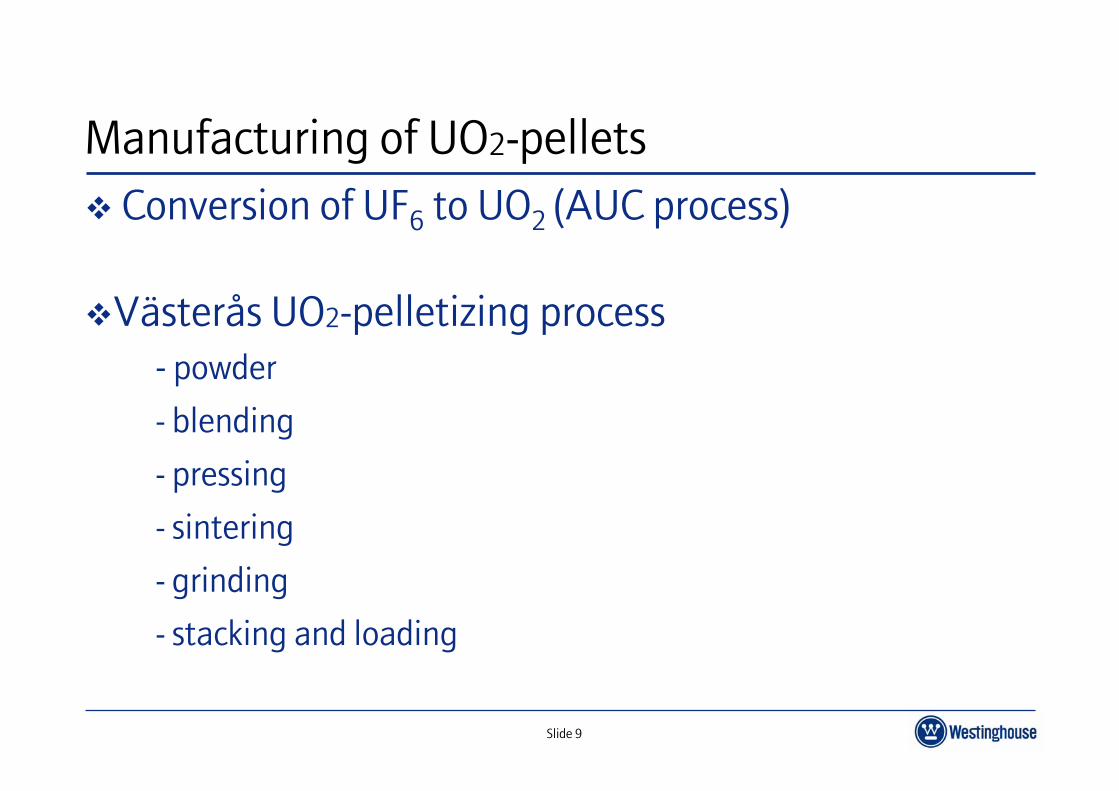
Manufacturing of UO2-pelletsConversion of UF6 to UO2 (AUC process)
Västerås UO2-pelletizing process- powder
- blending
- pressing
- sintering
- grinding
- stacking and loading
Slide 10
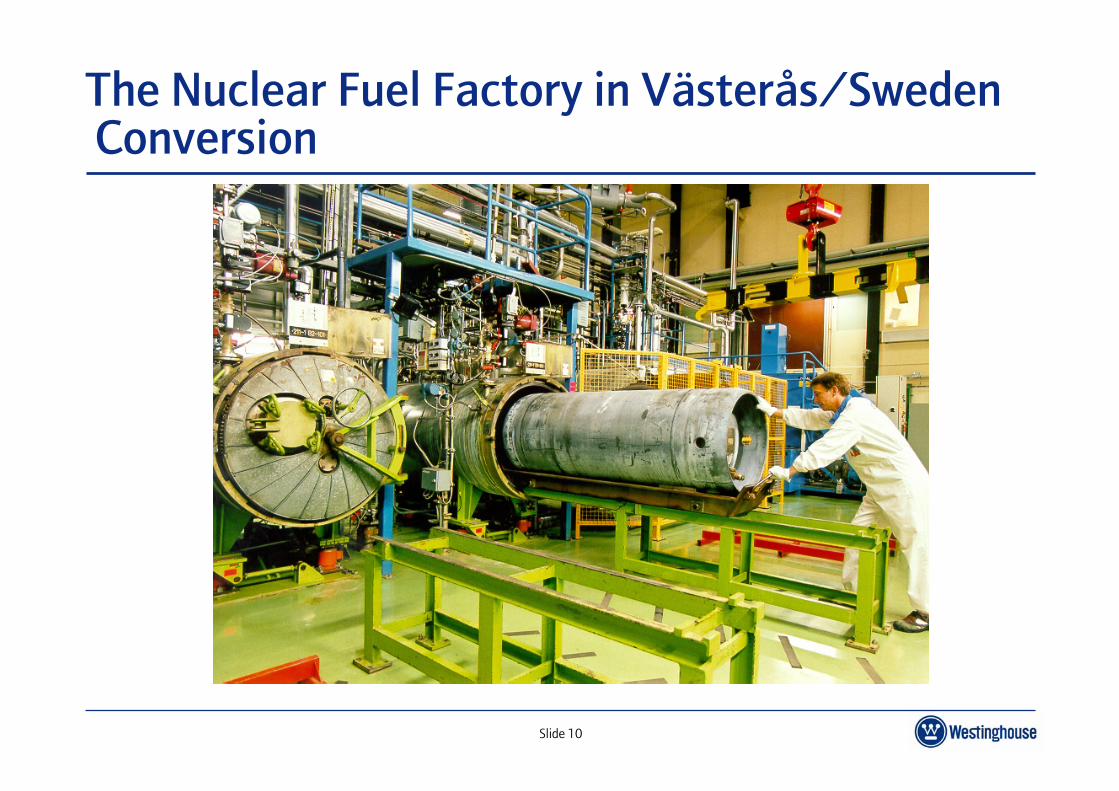
The Nuclear Fuel Factory in Västerås/SwedenConversion

Slide 11
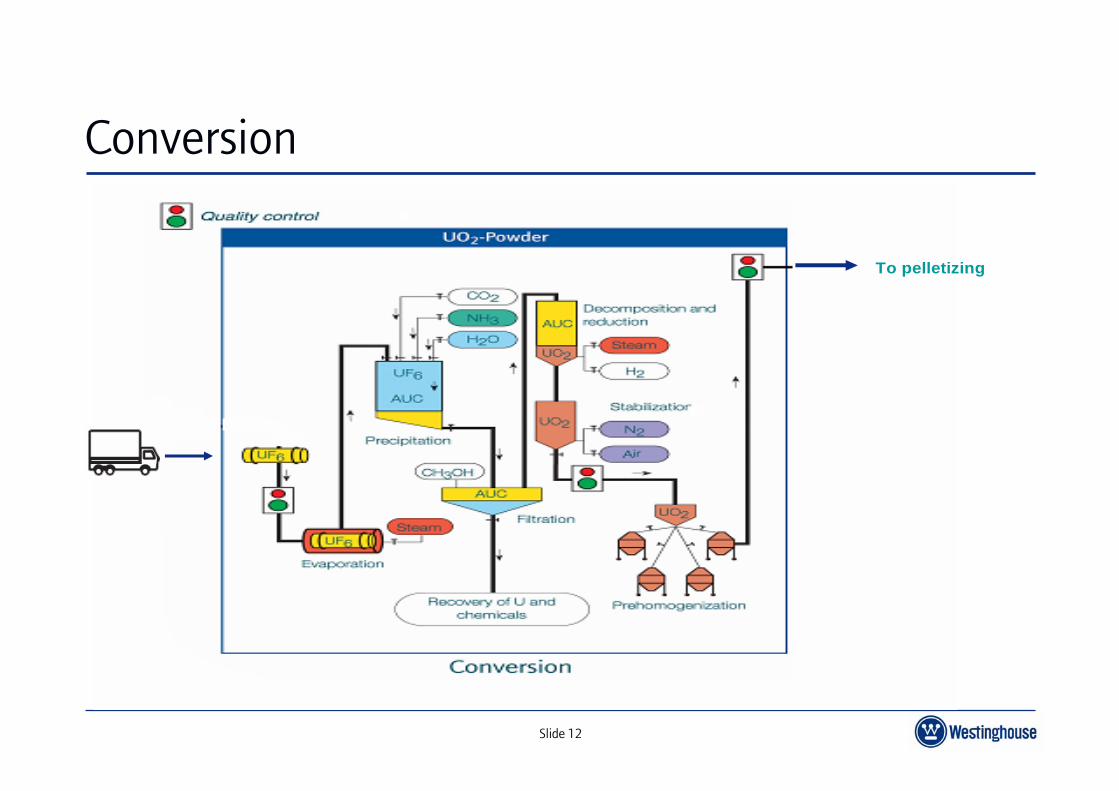
AUC Powder and Pellets PropertiesAUC, Ammonium Uranyl Carbonate, (NH4)4UO2(CO3)3,conversion process facilitates:
simple blending technique in large bulks due to free flowing powder. WSE use enrichment blending as standard
direct to press without pre pressing and granulation operations
efficient and flexible recovery of chemicals and Uranium using standard processes
low impurity levels in powder and pellet
Slide 12
Conversion
To pelletizingTo pelletizing
Slide 13
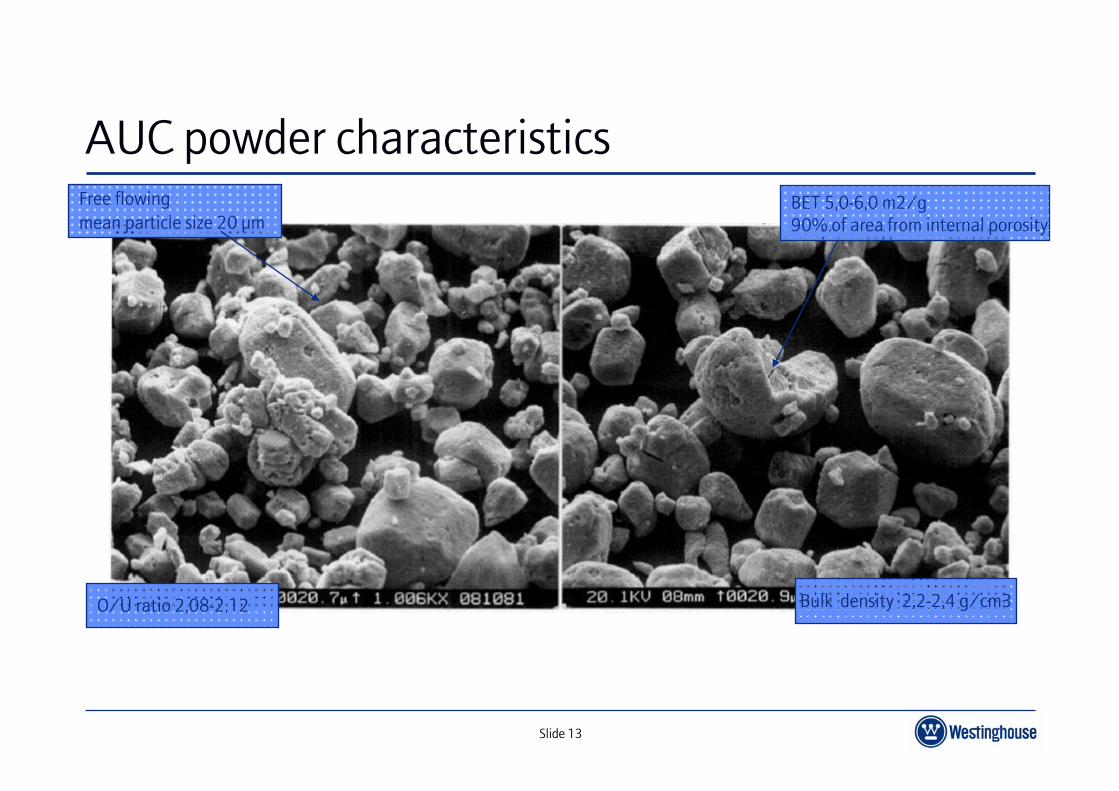
AUC powder characteristicsFree flowingmean particle size 20 µm
O/U ratio 2,08-2,12
BET 5,0-6,0 m2/g90% of area from internal porosity
Bulk density 2,2-2,4 g/cm3
Slide 14
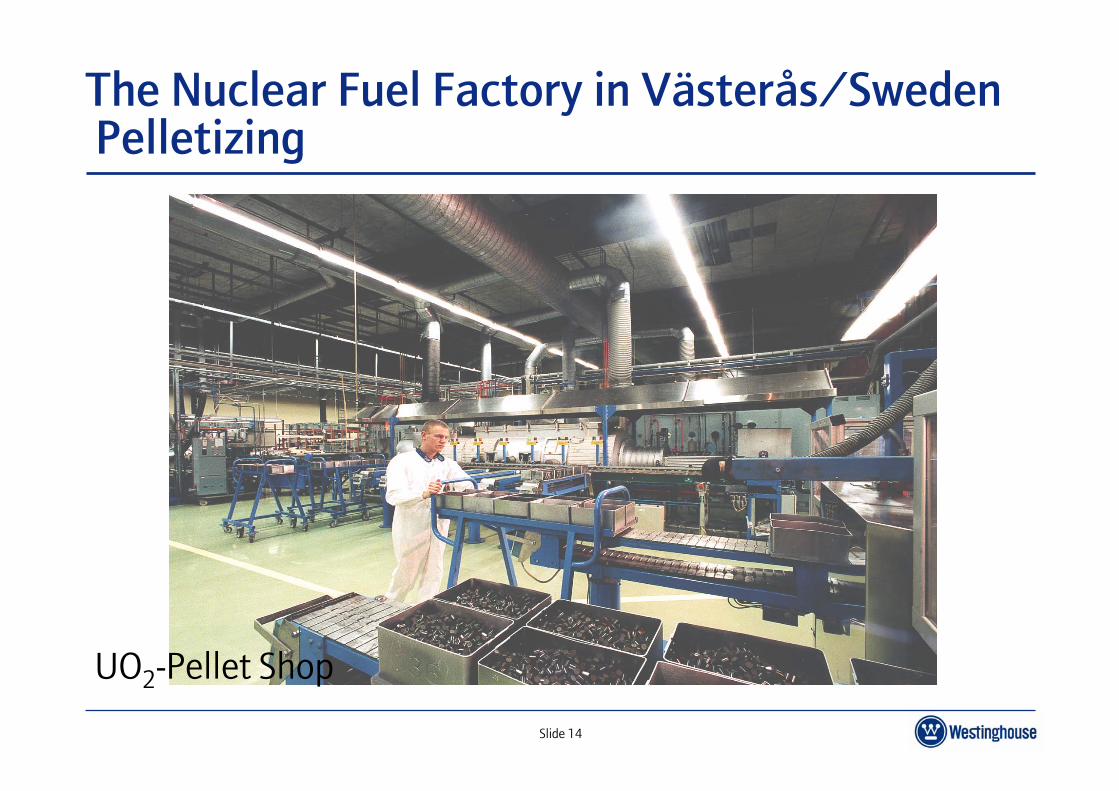
The Nuclear Fuel Factory in Västerås/SwedenPelletizing
UO2-Pellet Shop

Slide 15
Pelletizing
H2+CO2
H2+CO2
Two step blending in V-shell blenders
Gd2O3 ,U3O8Al2O3, Dry Flow
To fuel rodloading
From conversion

Slide 16
UO2 -pelletizing process: Blending
Free flowing AUC powder allows:Easy enrichment blending as standard
Blending in 500 l Bi-cone containers
Direct to press after blending without prepressing and granulation.
Enrichment blending qualified up to 5% of U-235.
Slide 17
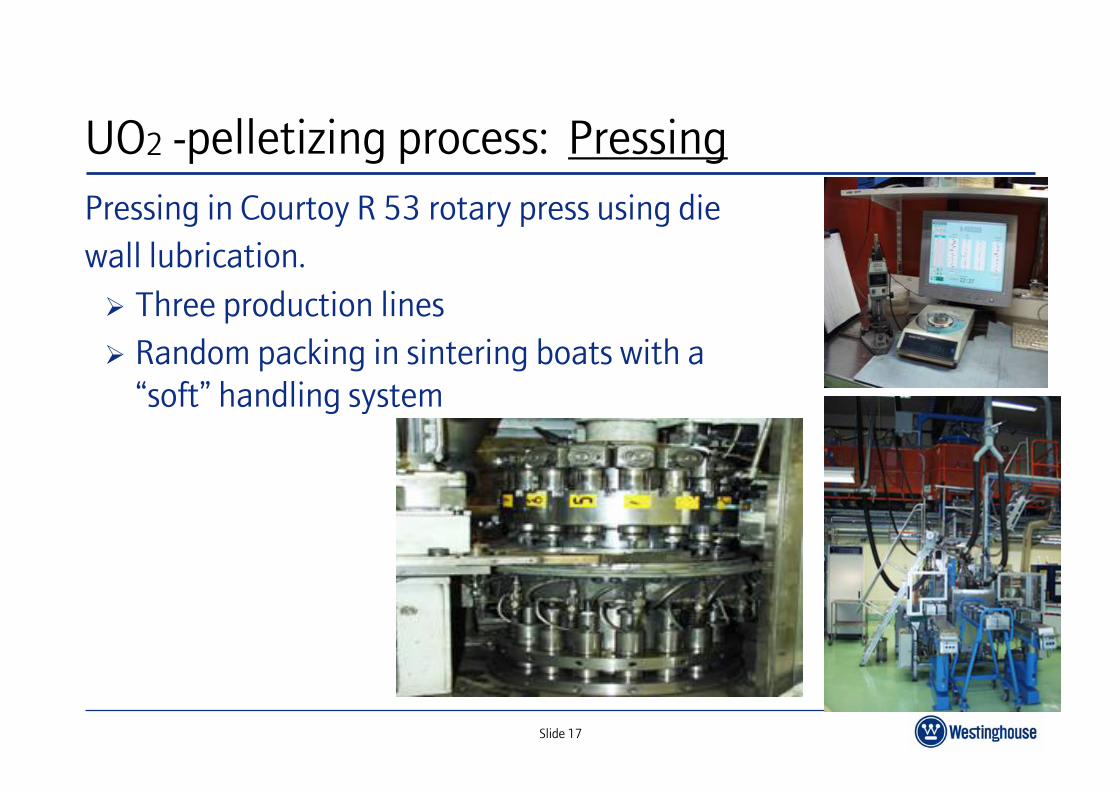
UO2 -pelletizing process: PressingPressing in Courtoy R 53 rotary press using die wall lubrication.
Three production linesRandom packing in sintering boats with a “soft” handling system

Slide 18
UO2 -pelletizing process: SinteringSintering in Degussa furnaces
Trough push furnace with 5 heating zones
Mass flow regulation of the sintering atmosphere
Typical values in manufacturing:Temperatures up to 1800 °CAtmosphere of H2 and CO2
Sintering time about 5 hours
Slide 19
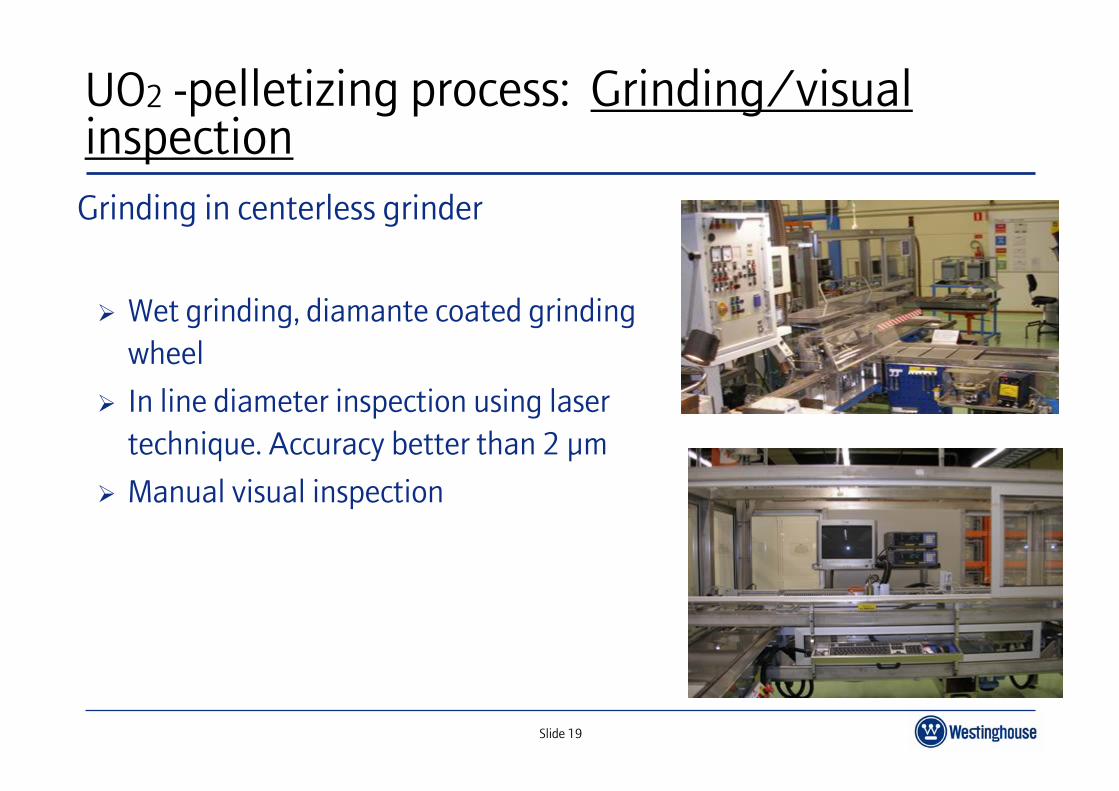
UO2 -pelletizing process: Grinding/visual inspection
Grinding in centerless grinder
Wet grinding, diamante coated grinding wheel
In line diameter inspection using laser technique. Accuracy better than 2 µm
Manual visual inspection

Slide 20
UO2 -pelletizing process: Stacking and loading
Automatic stacking of pellets up to 6 zones and 3 enrichments.
Loading in an equipment using inclined position of tubes. Feeding of the pellets is very smooth since only gravity is used

Slide 21
UO2-Pellets : Density and Grain sizePWR
Pellet density 10,50 g/cm3 (95,8%)
Typical grain sizes 7-9 µm
BWR Optima 2
Pellet density 10,60 g/cm3 (96,7%)
Typical grain sizes 7-9 µm
Slide 22
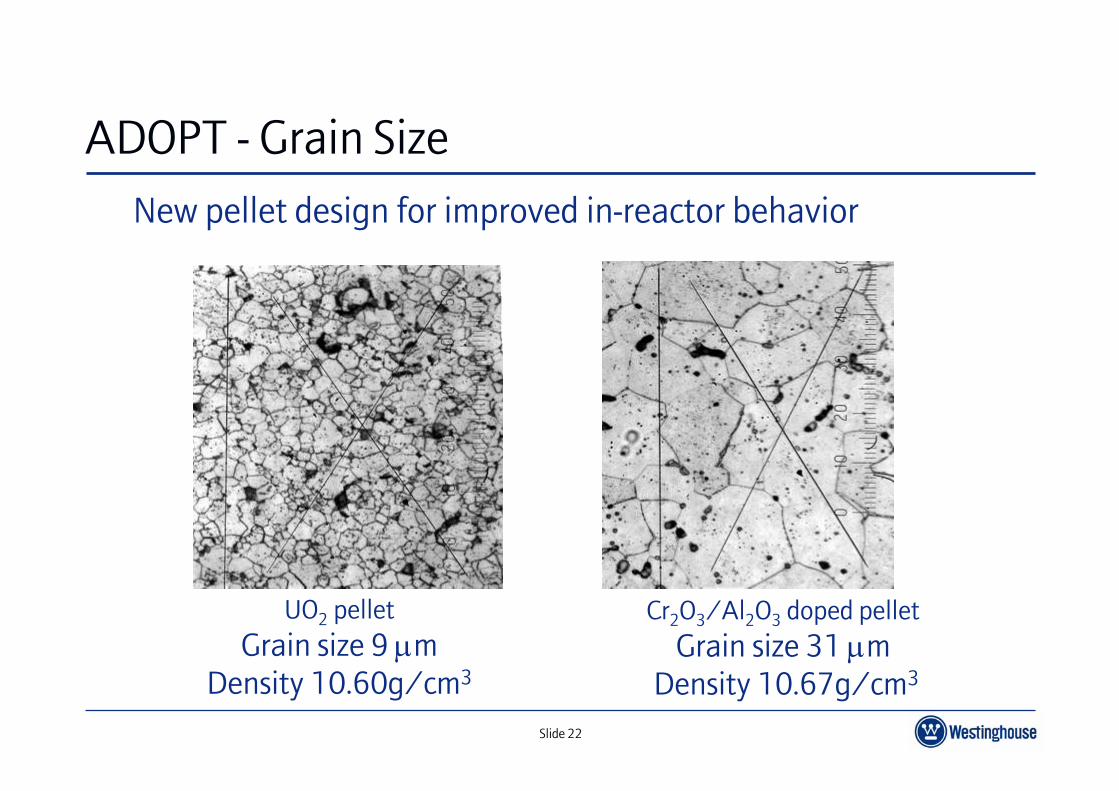
ADOPT - Grain Size
UO2 pelletGrain size 9 μm
Density 10.60g/cm3
Cr2O3/Al2O3 doped pelletGrain size 31 μm
Density 10.67g/cm3
New pellet design for improved in-reactor behavior

Slide 23
Overview of Fuel Rod Manufacturing
Slide 24
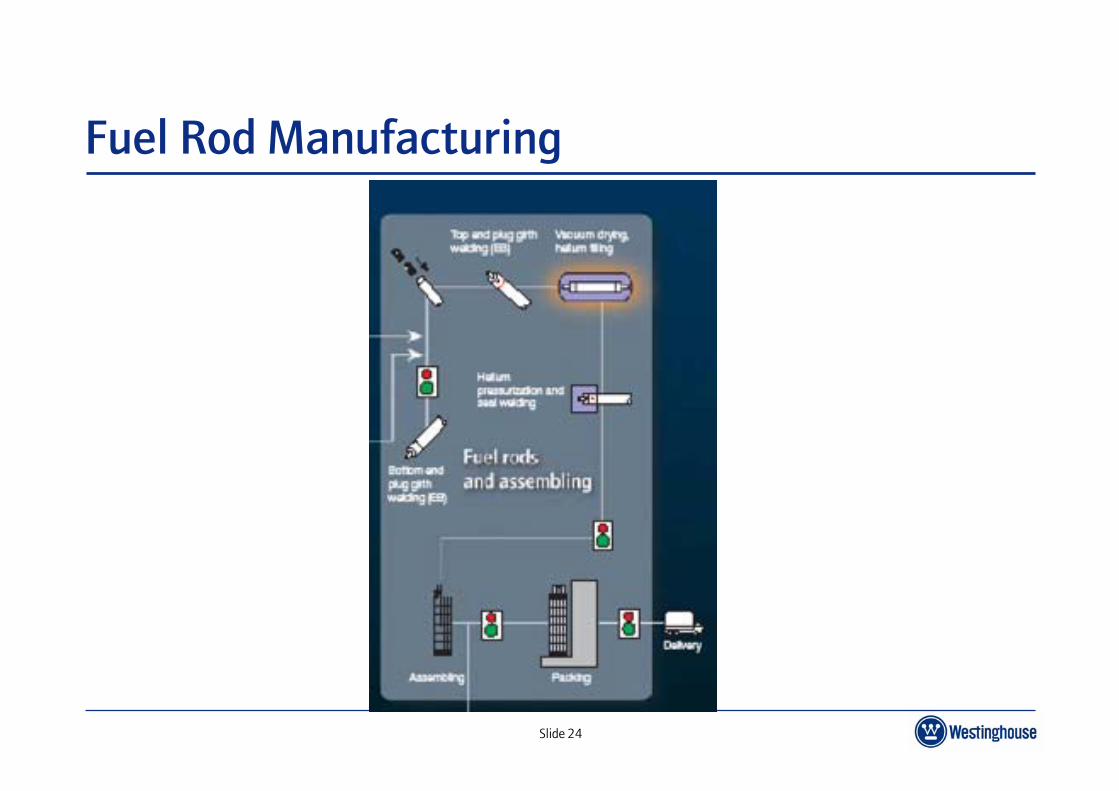
Fuel Rod Manufacturing
Slide 25
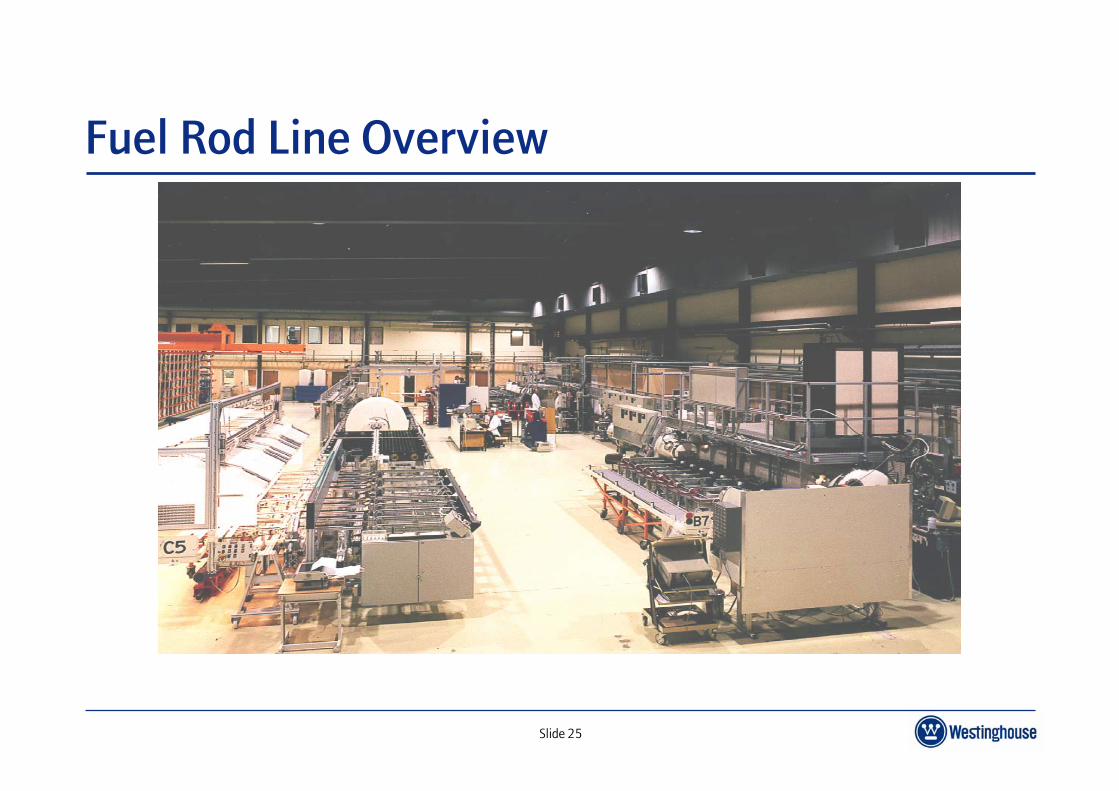
Fuel Rod Line Overview
Slide 26
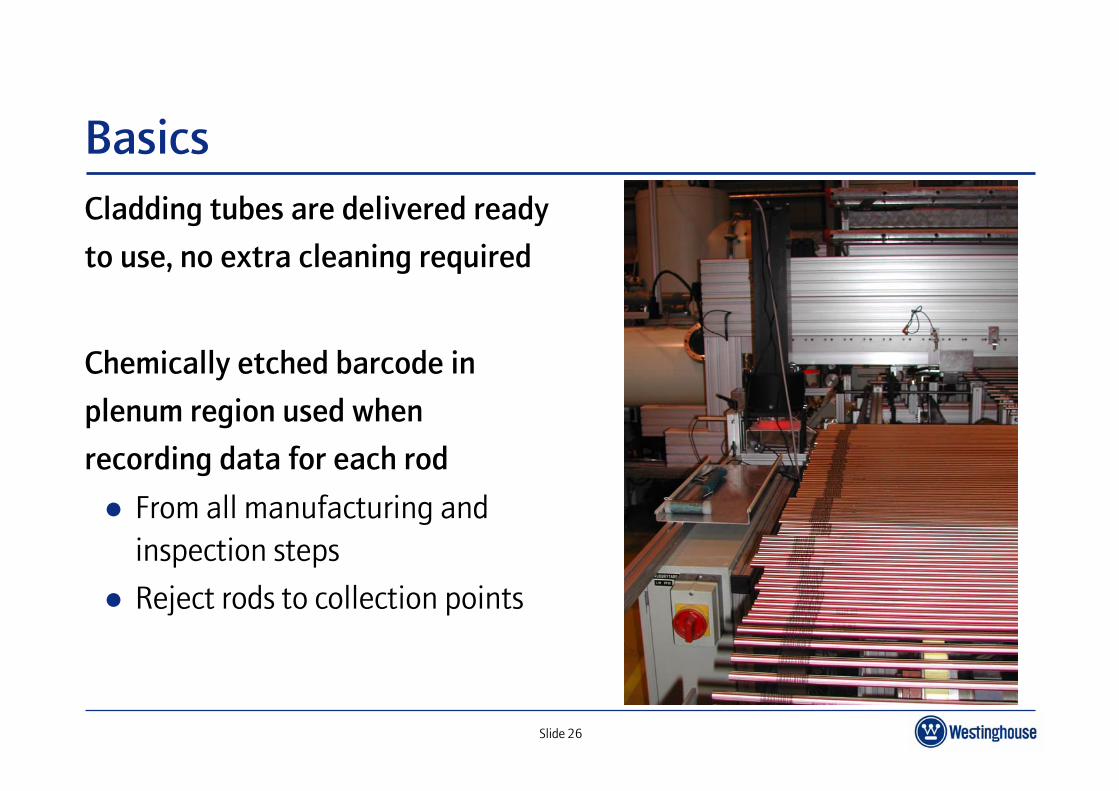
BasicsCladding tubes are delivered ready
to use, no extra cleaning required
Chemically etched barcode in
plenum region used when
recording data for each rod
From all manufacturing and inspection steps
Reject rods to collection points
Slide 27
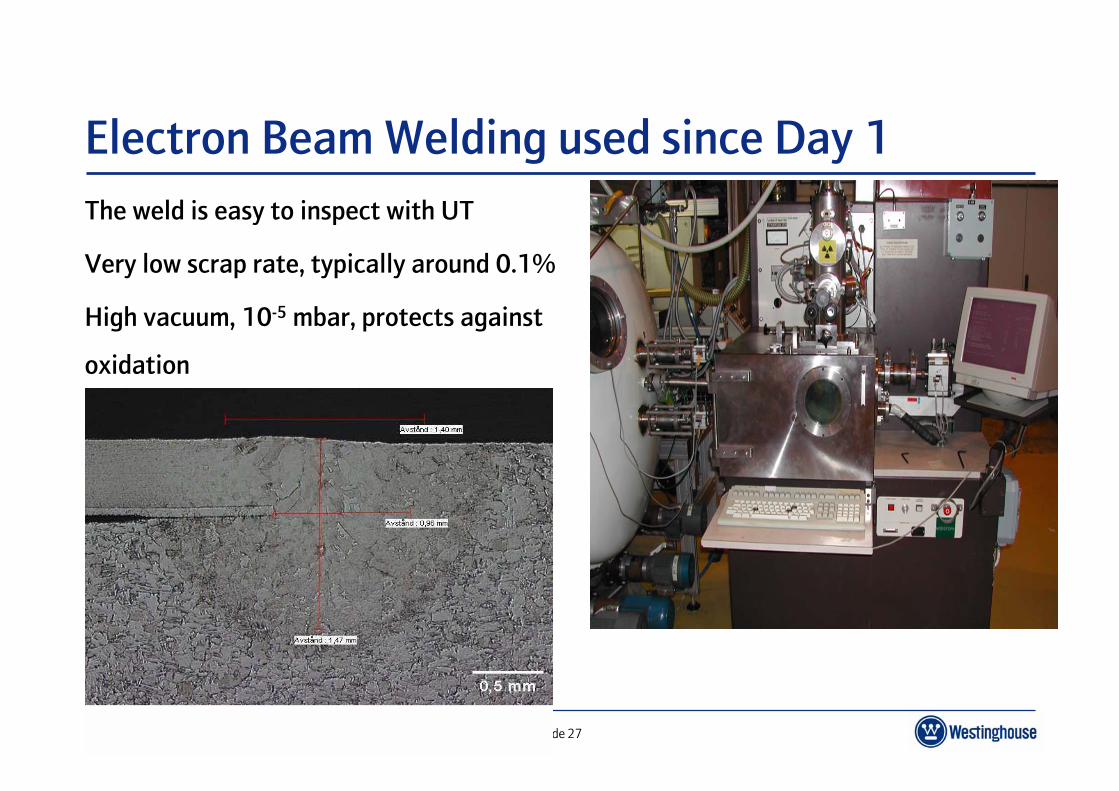
Electron Beam Welding used since Day 1The weld is easy to inspect with UT
Very low scrap rate, typically around 0.1%
High vacuum, 10-5 mbar, protects against
oxidation

Slide 28
Mainly Automatic Weld InspectionsUT used for circumferential weld,
checks for presence of pores,
penetration
Vision system used for geometrical
weld dimensions, end plug
streightness and weld
discoloration. Also verifies
presence of weld in fill hole.
Slide 29
Gravity loading of pelletsSoft handling
Pre-measurement of all zone lengths. Process computer in full control of loading, keeps track of all rod data
Automatic plenum length measurement checked by computer against rod length, accumulated zone lengths and rod drawing
Slide 30
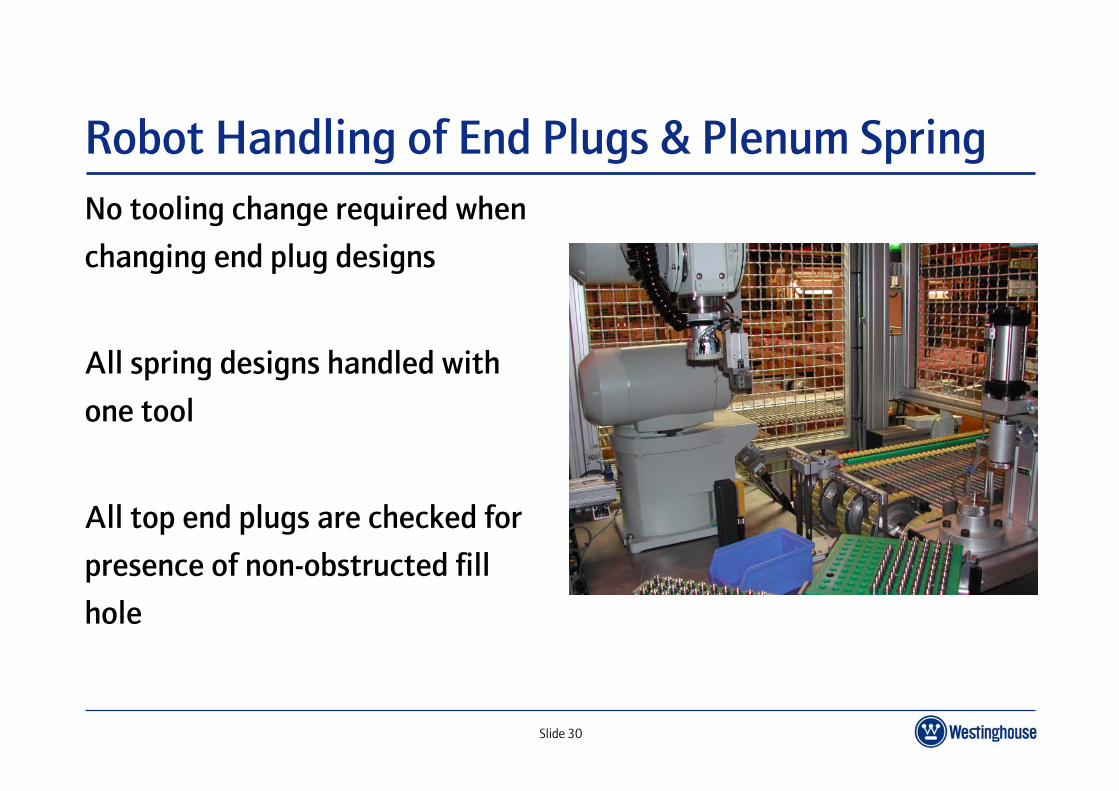
Robot Handling of End Plugs & Plenum SpringNo tooling change required when
changing end plug designs
All spring designs handled with
one tool
All top end plugs are checked for
presence of non-obstructed fill
hole

Slide 31
Hot Vacuum Out-Gassing (HVOG) for all RodsVerified to eliminate any water content on pellets or in cladding tubes
Batches of 90 rods processed in sequenceHeated in nitogen to above 200 °CSits in vacuum for over 30 minutesCooled down in nitrogen
Slide 32
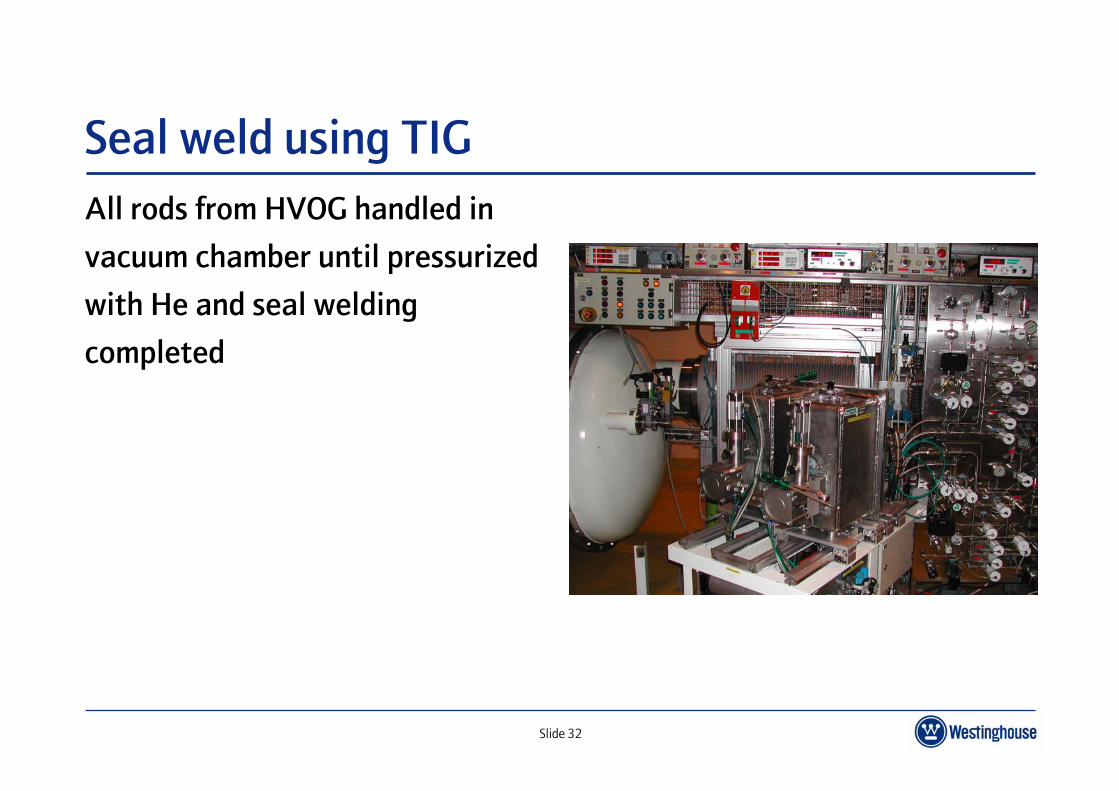
Seal weld using TIGAll rods from HVOG handled in
vacuum chamber until pressurized
with He and seal welding
completed

Slide 33
Rod ScanningAutomatic rescanning of rods with
suspected defect
Detection with 95% probability
for defects:
± 10% deviant enrichmentpellet
± 4% deviant enrichment zone
Inter pellet gaps larger than1mm
Slide 34
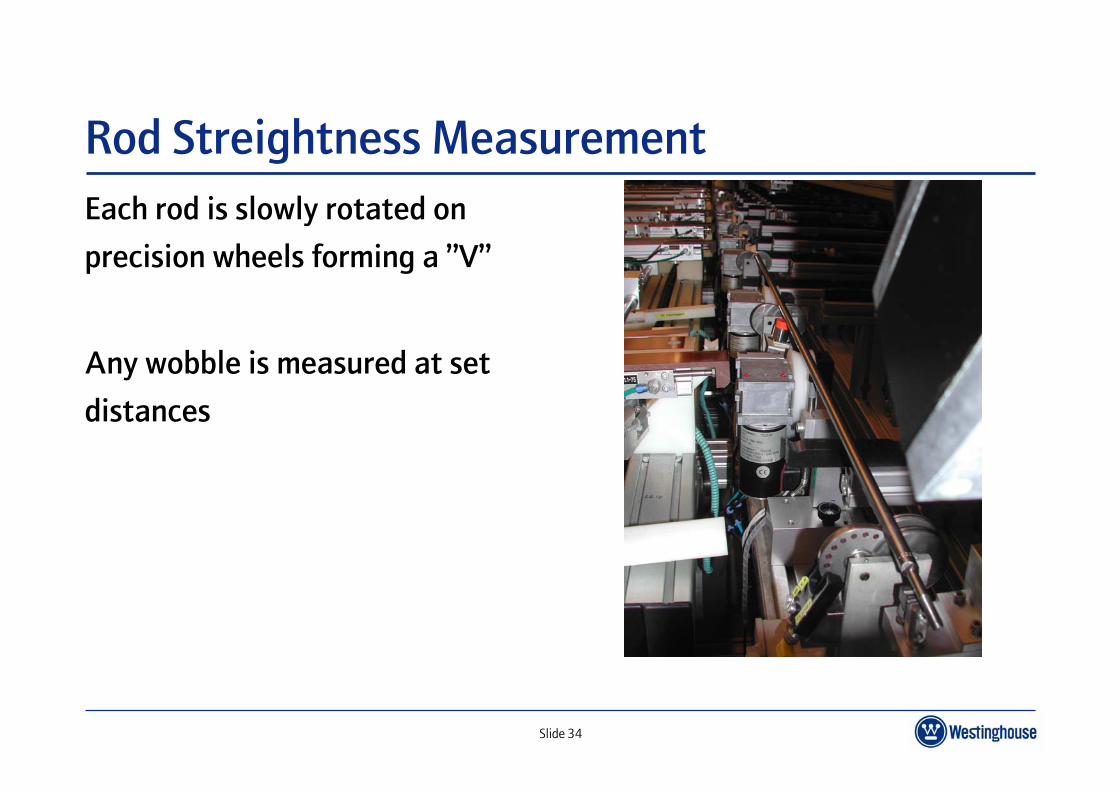
Rod Streightness MeasurementEach rod is slowly rotated on
precision wheels forming a ”V”
Any wobble is measured at set
distances
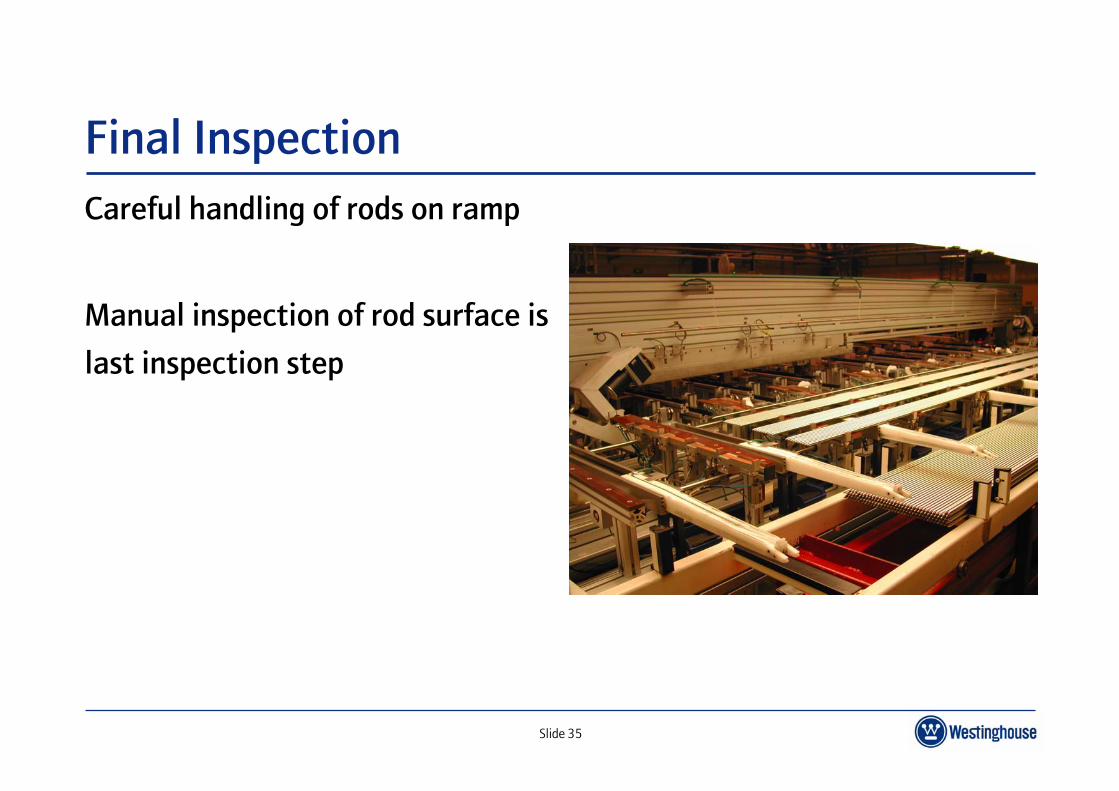
Slide 35
Final InspectionCareful handling of rods on ramp
Manual inspection of rod surface is
last inspection step
Slide 36
Environmental Effects
Slide 37
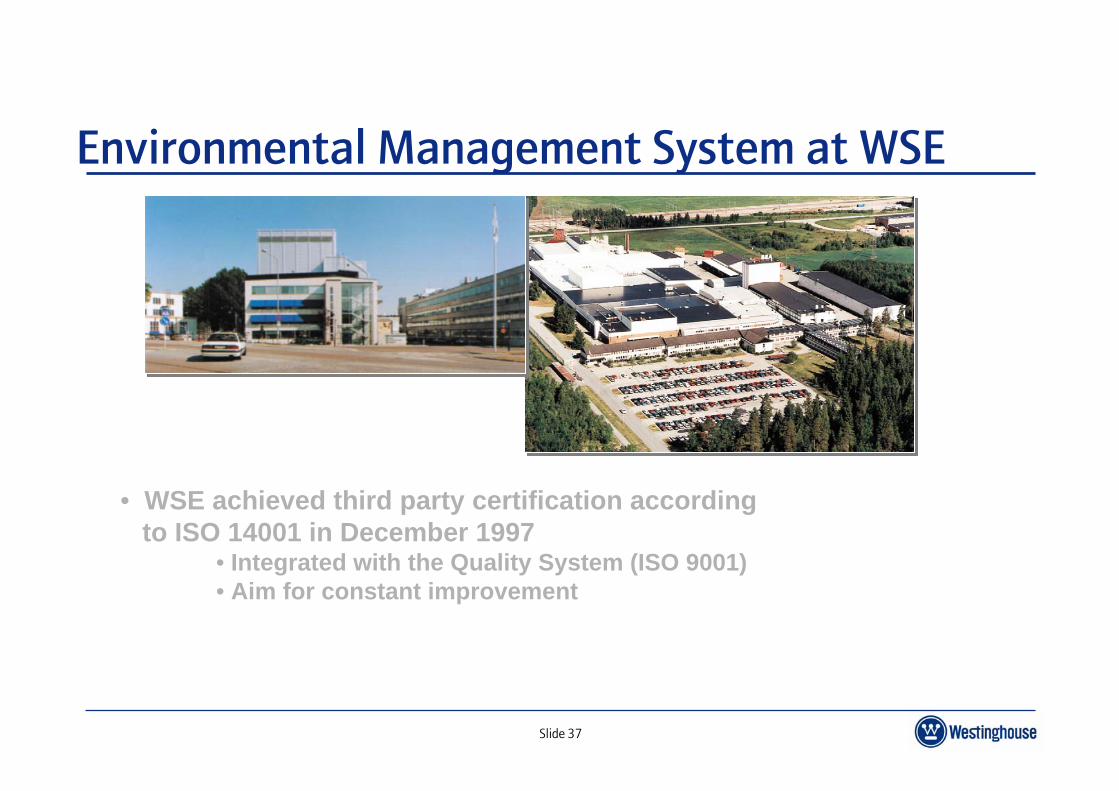
Environmental Management System at WSE
• WSE achieved third party certification according to ISO 14001 in December 1997
• Integrated with the Quality System (ISO 9001)• Aim for constant improvement
Slide 38
Significant Environmental Aspects
Chemical handlingWaste handlingSuppliersProduct and process developmentEnergy consumptionPollution to the waterPollution to the airTransports
Slide 39
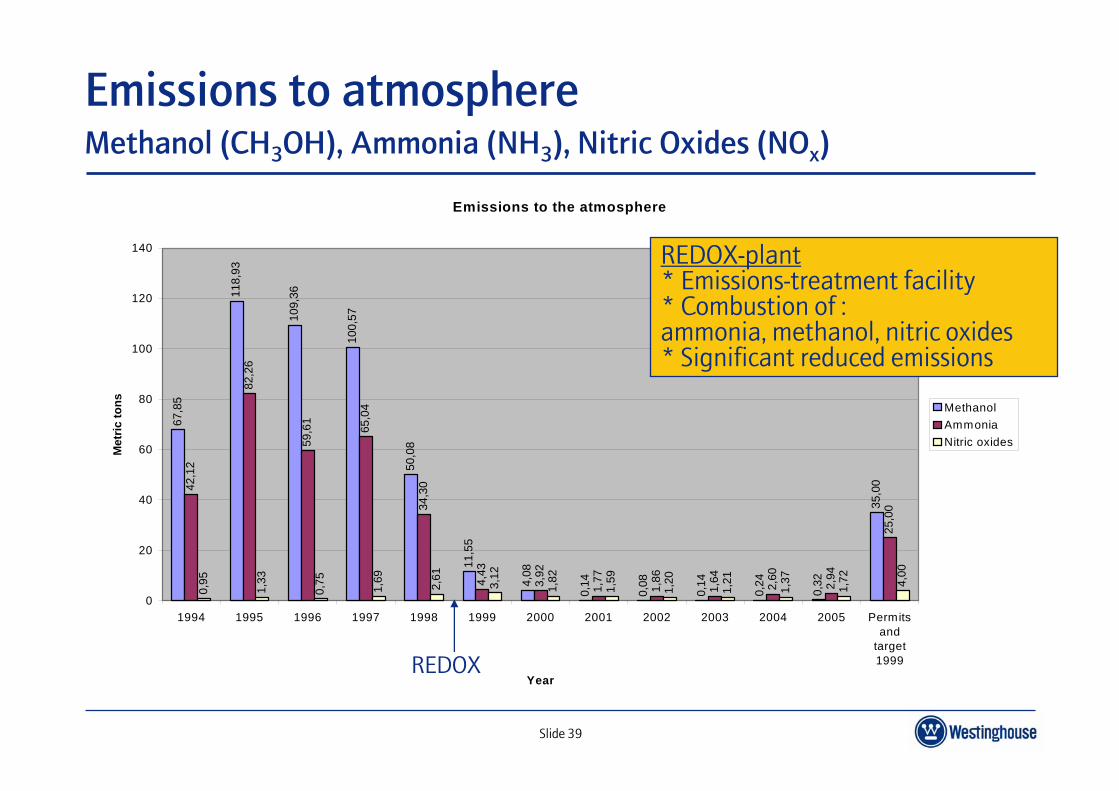
Emissions to atmosphereMethanol (CH3OH), Ammonia (NH3), Nitric Oxides (NOx)
Emissions to the atmosphere
67,8
5
118,
93
109,
36
100,
57
50,0
8
11,5
5
4,08
0,14
0,08
0,14
0,24
0,32
35,0
042,1
2
82,2
6
59,6
1
65,0
4
34,3
0
4,43
3,92
1,77
1,86
1,64 2,60
2,94
25,0
0
0,95
1,33
0,75 1,69 2,61
3,12
1,82
1,59
1,20
1,21
1,37
1,72 4,00
0
20
40
60
80
100
120
140
1994 1995 1996 1997 1998 1999 2000 2001 2002 2003 2004 2005 Permitsand
target1999
Year
Met
ric to
ns MethanolAmmoniaNitric oxides
REDOX
REDOX-plant * Emissions-treatment facility* Combustion of :ammonia, methanol, nitric oxides* Significant reduced emissions

Slide 40
Emissions to waterMethanol (CH3OH), Ammonia (NH3), Nitric Oxides (NOx)
Emissions to the local utility plant (MälarEnergi)2,
397
4,45
0
5,44
5
5,57
7
2,10
0
0,02
1
0,02
2
0,01
5
0,03
3
0,01
4
0,00
8
0,03
3
0,50
0
50,9
10 54,0
56 59,3
59
62,2
31
36,1
49
0,01
7
0,02
1
0,00
3
0,00
7
0,19
8
0,00
1
0,04
9
2,00
0
0
10
20
30
40
50
60
70
1994 1995 1996 1997 1998 1999 2000 2001 2002 2003 2004 2005 Permitsand
target1999
Year
Met
ric to
ns
AmmoniaNitrates
Improved denitrification system
Water purification * Joint effort with a local utility* Significant reduced emissions

Slide 41
Emissions to atmosphere of Uranium
Emissions to the atmosphere0,
41
0,05
0,04 0,06
0,07
0,04
0,01
0,02
0,02
0,03
0,01 0,05
3,00
2,00
0,0
0,5
1,0
1,5
2,0
2,5
3,0
1994
1995
1996
1997
1998
1999
2000
2001
2002
2003
2004
2005
Permitte
d pre
1998
Permitte
d sinc
e 1998
Year
Kg Uranium (actual)

Slide 42
sampling in the surroundings
precipitation, grass , sediment, …

Slide 43
Tack!