Fuel Cell Transportation Cost Analysis, Preliminary Results
29
Fuel Cell Transportation Cost Analysis, Preliminary Results Brian D. James Strategic Analysis, Inc. 17 May 2012 Project ID #FC018 This presentation does not contain any proprietary, confidential, or otherwise restricted information
Transcript of Fuel Cell Transportation Cost Analysis, Preliminary Results

Fuel Cell Transportation Cost Analysis, Preliminary Results
Brian D. James Strategic Analysis, Inc. 17 May 2012
Project ID #FC018 This presentation does not contain any proprietary, confidential,
or otherwise restricted information

2
Overview
Auto/Stationary FC Cost Analysis • Project start date: 7/8/10 • Project end date: 9/7/12 • Percent completion: 80%
Transportation FC Cost Analysis • Project start date: 11/30/12 • Project end date: 9/13/16 (all 5 Budget Periods)
• Percent complete: 3% (of total budget)
System Cost: • Realistic, process-based system costs • Need for realistic values for current and
future cost targets Demonstrates impact of technical targets
& barriers on system cost: • Balance of plant components • Materials of construction • System size and capacity (weight and
volume)
2
Timeline
Budget
Barriers
Partners Auto/Stationary FC Cost Analysis
• Total Project Funding: $746k Transportation FC Cost Analysis
• Total project funding: $1M over 5 years FY12: $166K/$68k for SA/Labs
Argonne National Laboratory National Renewable Energy Laboratory

3
Relevance: Objectives Project Goals: • Process-based cost analysis of stationary, light duty automotive, and bus
fuel cell power systems. • To be used to used to inform and guide industry R&D and DOE targets.
Sensitivity studies • Used to determine system cost effects of reaching specific technical
component targets.
Five-year project, annually renewed (Transportation Cost Analysis) • Analyze systems of interest identified by ANL. • Allows researchers cost impact updates throughout year and feedback on
technical advances or proposed strategies.
Identify most fruitful research paths to cost reduction • System technology and design parameters • System size and capacity • Balance of plant components • Materials of construction
3

4
Relevance: Systems of Interest Stationary • System sizes: 1 kW, 5 kW, 25 kW, 100 kW • Annual manufacturing rates: 100, 1k, 10k, 50k • Fuel Cell Technologies: Low Temp PEM, High Temp PEM, Solid Oxide
Light duty automotive • 80 kW system size • Annual manufacturing rates: 1k, 10k, 30k, 80k, 130k, 500k
Buses • 150 kW system size • Annual manufacturing rates: 1k, 10k, 30k, 80k, 130k, 500k
Analyses will be updated annually to reflect altered performance/assumptions/design.
4

5
Approach: SA’s DFMA® - Style Costing Methodology What is DFMA?
DFMA® (Design for Manufacturing & Assembly) is a registered trademark of Boothroyd-Dewhurst, Inc. • Used by hundreds of companies world-wide • Basis of Ford Motor Co. design/costing method for the past 20+ years
SA practices are a blend of: • “Textbook” DFMA®, industry standards and practices, DFMA® software, innovation,
and practicality
Estimated Cost = (Material Cost + Processing Cost + Assembly Cost) x Markup Factor
Manufacturing Cost Factors: 1. Material Costs 2. Manufacturing Method 3. Machine Rate 4. Tooling Amortization
Methodology Reflects Cost of Under-utilization:
Annual Minutes of Equipment Operation
Capital Cost Installation
Maintenance/Spare Parts Utilities Miscellaneous
Operating Expenses
Initial Expenses
Used to calculate annual capital recovery factor based on: • Equipment Life • Interest Rate • Corporate Tax Rate
Annual Capital
Repayment
+ Annual Operating Payments = Machine Rate
($/min)
5

6
Approach: Cost Factors Included in Estimates
6
Not Included in Cost Analysis • Markup for primary manufacturer/assembler (G&A, scrap, R&D, profit) • Non-recurring RD&E costs • Warranty • Advertising • Taxes
Profit One-Time Costs General Expenses
Fixed Costs • Equipment depreciation • Tooling amortization • Utilities • Maintenance
Variable Costs • Direct Materials used in manufacturing • Direct Materials purchased from
suppliers • Manufacturing scrap • Manufacturing labor • Assembly labor
Included in Cost Analysis Factory Expenses Direct Materials Direct Labor
OEM Price
Cost Included in
SA Analysis
Cost Excluded from SA Analysis

7
Approach: Basic Cost Modeling Work Flow
7
1. Obtain or create system design for technology of interest • ANL or Industry partner provides key parameters, system diagram
2. Develop physical embodiment of system design • Materials, scaling, dimensions, design embodiment • ANL/Industry partner may provide design details
3. Investigate & conceptually model the manufacturing process train for system production
• Manufacturing methods based on SA experience, industry input, analogy to similar products
4. Vary key parameters to obtain sensitivity data for modeled technology
5. Share results with ANL, NREL, DOE, and Industry to obtain feedback/improvements
6. Modify cost analysis as needed

8
Accomplishments: Stationary FC Systems
8
Design includes SMR reformer for natural gas reforming and fuel cell unit based on one of three technologies: Low Temperature PEM, preliminary analysis complete High Temperature PEM, preliminary analysis complete Solid Oxide, preliminary analysis underway
Integrated reformer design based on Ballard prototype
Systems for all three FC technologies analyzed at different system sizes and manufacturing rates System size 1kW, 5kW, 25kW, and 100kW 100kW system represents four parallel 25 kW systems Manufacturing rates of 100, 1k, 10k, and 50k systems/year
Final analysis will incorporate analysis refinements developed for Solid Oxide into High and Low Temp PEM analyses.

9
Stationary System Reactor Design
9
Title:
Reformate
NG Fuel
Water
Burner Exhaust
Cathode Exhaust
Anode Exhaust
Burner Fuel
A A
Section A-A
Top End Plate
Water Inlet Port
Burner Inlet PortBurner Exhaust Outlet Port
NG Fuel Inlet PortReformate Outlet Port
Air Inlet Port
Cylinder 4 (Outer Shell)
Bottom End Plate
WGS Catalyst Bed
Cylinder 3 (Fuel-Reformate Shell)
Steam Reforming Catalyst Bed
Fuel-Steam Mixing Orifice Plate
Fuel Feed Coil
Cylinder 2 (Burner Shell)
Cylinder 1 (Burner Exhaust Shell)
Burner Head
Gas Supply Tube
Burner Head Assembly Reactor Assembly
Drawn by:
Revision Date: 15 November 2011
Helical Spacer Coil
Not Shown:Insulation BlanketInsulation, Load Bearing
Highly heat integrated thermal reformer able to operate with 3:1 turndown.
Key Features: High thermal integration Concentric design modeled
on Tokyo Gas1,2 concept Natural Gas Steam Reforming Combines HX and functions
for SMR, WGS, & PROX (for Low-Temp PEM).
Catalyst on metal monoliths Designed for rapid assembly
and low cost
1 US Patent 7,037,472 B2 2 US Patent 7,182,921 B2

10
Stationary System Design, Low Temperature PEM
10


12
Accomplishments: Low Temp PEM Stationary FC Systems
12
System preliminary total system cost results are shown below
Each System is broken down into 5 sections • Fuel cell subsystem
• Stack • Fuel Cell System Balance of Plant (BOP)
• Reformer subsystem • Reactor • Reformer Balance of Plant
• Power & Electronics subsystem • Housing and Final System Assembly • Cost Margin
1 kW sys 5 kW sys 25 kW sys 100 kW sys100 sys/yr $11,963 $19,586 $43,083 $108,131
1,000 sys/yr $9,311 $15,554 $35,066 $90,66510,000 sys/yr $7,891 $13,165 $28,702 $71,74850,000 sys/yr $7,179 $11,748 $25,223 $63,503
Total System Cost, $1 kW sys 5 kW sys 25 kW sys 100 kW sys
100 sys/yr $11,963 $3,917 $1,723 $1,0811,000 sys/yr $9,311 $3,111 $1,403 $907
10,000 sys/yr $7,891 $2,633 $1,148 $71750,000 sys/yr $7,179 $2,350 $1,009 $635
Total System Cost per kWnet

13
Accomplishments: Low Temp PEM Stationary FC Systems
13
Preliminary total system cost results
• Reformer Subsystem is major contributor to system cost. • Reformer BOP is dominant fraction of Ref. Subsystem cost.

14
Accomplishments: Low Temp Stationary Reformer Subsystem Cost Breakdown
14
• BOP dominates the cost of the reformer subsystem. • This observation also holds true for the High Temp. PEM system. • Additional scrutiny of these BOP costs is planned.
15
Accomplishments: High Temp PEM Stationary FC Systems
15
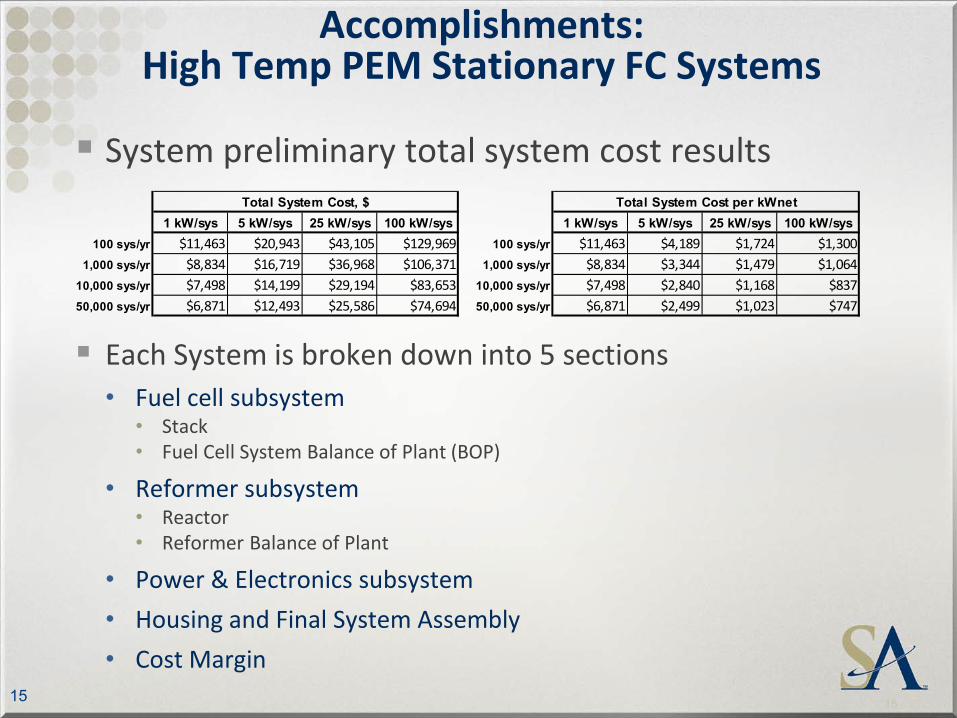
System preliminary total system cost results
Each System is broken down into 5 sections • Fuel cell subsystem
• Stack • Fuel Cell System Balance of Plant (BOP)
• Reformer subsystem • Reactor • Reformer Balance of Plant
• Power & Electronics subsystem • Housing and Final System Assembly • Cost Margin
1 kW/sys 5 kW/sys 25 kW/sys 100 kW/sys100 sys/yr $11,463 $20,943 $43,105 $129,969
1,000 sys/yr $8,834 $16,719 $36,968 $106,37110,000 sys/yr $7,498 $14,199 $29,194 $83,65350,000 sys/yr $6,871 $12,493 $25,586 $74,694
Total System Cost, $1 kW/sys 5 kW/sys 25 kW/sys 100 kW/sys
100 sys/yr $11,463 $4,189 $1,724 $1,3001,000 sys/yr $8,834 $3,344 $1,479 $1,064
10,000 sys/yr $7,498 $2,840 $1,168 $83750,000 sys/yr $6,871 $2,499 $1,023 $747
Total System Cost per kWnet

16
Accomplishments: High Temp PEM Stationary FC Systems
16
Preliminary total system cost results
• High Temp. PEM Stationary system follows same trend as Low Temp. PEM Sys. • Reformer Subsystem is major cost contributor. • Reformer BOP, rather than reactor itself, is cost driver.

17
Accomplishments: 2012 80kW Automotive Update System Diagram
17 No substantive configuration changes between 2011 & 2012.

18
Accomplishments: 2012 Automotive Update System Details
18
2011 AMR System 2012 AMR SystemPower Density (mW/cm2) 1,110 1,110
Total Pt loading (mgPt/cm2) 0.186 0.186
Gross Power (kWgross) 89.25 89.25
Operating Pressure (atm) 3.0 3.0
Peak Stack Temp. (°C) 95 95
Active Cells 369 369
Membrane Material Nafion® on 25-micron ePTFE Nafion® on 25-micron ePTFE
Radiator/ Cooling SystemAluminum Radiator,
Water/Glycol Coolant,DI Filter, Air Precooler
Aluminum Radiator,Water/Glycol Coolant,DI Filter, Air Precooler
Bipolar Plates Stamped SS 316L with TreadStone Coating Stamped SS 316L with TreadStone Coating
Air Compression Centrifugal Compressor,Radial-Inflow Expander
Centrifugal Compressor,Radial-Inflow Expander
Gas Diffusion Layers Carbon Paper Macroporous Layer with Microporous Layer
Carbon Paper Macroporous Layer with Microporous Layer
Catalyst Application Nanostructured Thin Film (NSTF) Nanostructured Thin Film (NSTF)Air Humidification Tubular Membrane Humidifier Tubular Membrane HumidifierHydrogen Humidification None NoneExhaust Water Recovery None None
MEA Containment Injection-Molded LIM Hydrocarbon MEA Frame/Gasket around Hot-Pressed M&E
Injection-Molded LIM Hydrocarbon MEA Frame/Gasket
Coolant & End Gaskets Laser Welding/Screen-Printed Adhesive Resin
Laser Welding/Screen-Printed Adhesive Resin
Freeze Protection Drain Water at Shutdown Drain Water at Shutdown
Hydrogen Sensors2 for FC System
1 for Passenger Cabin (not in cost estimate)1 for Fuel System (not in cost estimate)
2 for FC System1 for Passenger Cabin (not in cost estimate)
1 for Fuel System (not in cost estimate)End Plates/Compression System
Composite Molded End Plates with Compression Bands
Composite Molded End Plates with Compression Bands
Stack Conditioning (hrs) 5 5

19
Accomplishments: 2012 Automotive Changes from Previous Year
19
Change Reason Change from
previous value
Cost $/kW (at 500k sys/year)
2011 AMR Preliminary Cost Value N/A $47.81 Press force calculations & capital cost parameters for bipolar plate stamping
Analysis altered to account for swageing of material, as opposed to simple bending. $0.06 $47.87
Gasket injection molding calculations Model refined and molding cavity count re-optimized $0.31 $48.18
GDL Thickness reduced from 300 µm to 150 µm Response to industry review -$0.25 $47.93 Final system assembly calculations refined and expanded Response to industry review -$0.16 $47.78 Piping configuration/costing updated & expanded Response to industry review $0.66 $48.43 Air temperature sensor added to system to monitor coolant exit conditions Response to industry review $0.06 $48.49 Purge valve upgraded to multi-function model Response to industry review $0.33 $48.82 Hot pressing process removed and replaced with crimping roller process prior to cutting & slitting
Hot pressing incompatible with NSTF catalyst deposition, new method required for combining membrane & GDL layers
-$0.06 $48.76
Final 2012 AMR Value $0.95 $48.76 • Changes from last year consist of a series of small cost impact
refinements/improvements.

20
Accomplishments: 2012 Automotive System and Stack Costs
20
• Stack and System cost curves exhibit similar shape as seen in previous year’s analysis.
• “Knee in curve” occurs at ~50k systems/year.

21
Tornado Chart
21
• Power density remains dominant cost parameter. • Air compressor error bands large due to diversity of
approach/opinion within community.
Parameter UnitsLow
ValueBase Value
High Value
Power Density mW/cm2 700 1110 1400
Air Compressor Cost $/system $366.48 $732.95 $1,099.43
Pt Loading mgPt/cm2 0.1 0.186 0.25
Compressor/Expander Eff. % 50% 64% 69%
Air Stoichiometry 1.3 1.5 2.0
Membrane Cost $/m2 $2.50 $23.21 $34.82
Bipolar Plate Coating Cost Factor 0 1 2
GDL Cost $/m2 $3.00 $11.03 $16.55
Balance of Air Compressor Cost $/system $73.15 $146.30 $292.60
Operating Pressure atm 1.5 3 3
Bipolar Plate Cost Factor 0.75 1.00 1.25
Operating Temperature °C 80 95 95
Membrane Humidifier Cost $/system $29.51 $59.01 $88.52
System Cost ($/kWnet), 500,000 sys/year
2012 AMR System Cost $48.76
22
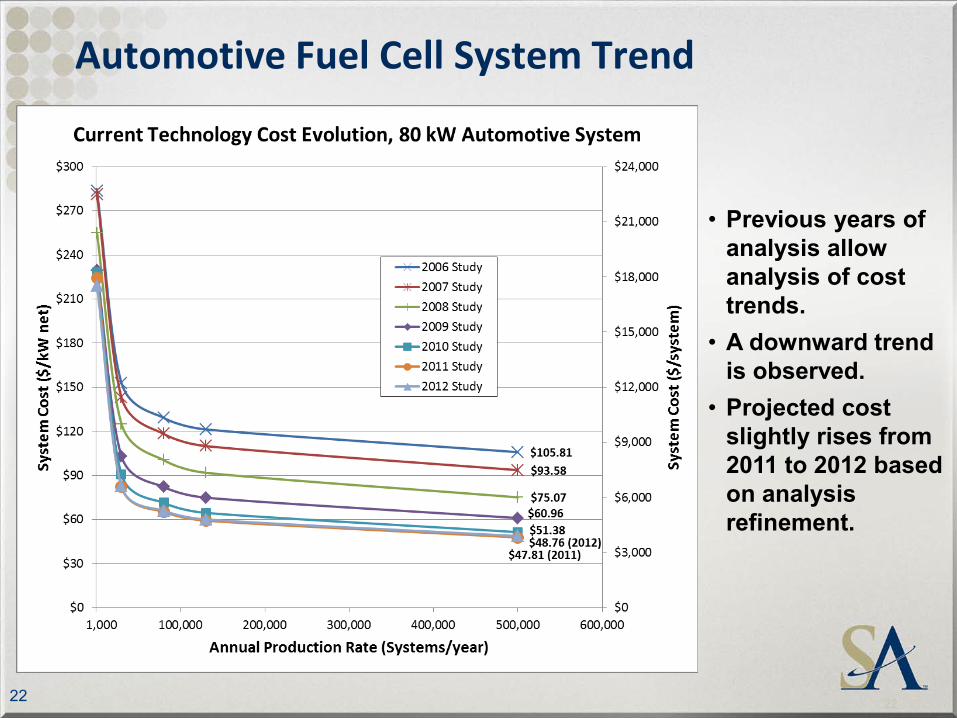
Automotive Fuel Cell System Trend
22
• Previous years of analysis allow analysis of cost trends.
• A downward trend is observed.
• Projected cost slightly rises from 2011 to 2012 based on analysis refinement.

23
Collaborations
Argonne National Labs System design and modeling support Specify key system parameters and range of sensitivity studies SA calculations and point designs verified against ANL modeling
National Renewable Energy Laboratory Expertise on manufacturing and quality control systems
Industry Collaborators Ford, Ballard, NexTech, Catacel, Enersys Innovation, PNNL Vet results and provide manufacturing process insight Stationary reformer design based on concept supplied by Industry
23

24
Proposed Future Work: Stationary Solid Oxide FC System Bus Systems • 150 kW systems • Manufacturing rates of 1k, 10k, 30k, 80k, 130k, 500k
Explore differences between light duty vehicle and bus systems • Peak installed power • System lifetime • Number of start/stop cycle over system lifetime, • Layout of system components due to available volume • Differences in system component form (cell aspect ratio) • Drive cycle impact on LCC and resulting FC operating
parameter optimization
Life Cycle Cost Analysis 24

25
Summary Overview
• Cost analysis of stationary, automobile, and bus fuel cell systems • Final stage of auto & stationary project • In year 1 of 5 year transportation project
Relevance • Cost analysis used to assess practicality of proposed storage system,
determine key cost drivers, and provide insight for direction of R&D priorities Approach
• Process based cost analysis methodologies (e.g. DFMA) Accomplishments
• Low and High Temperature PEM stationary systems analysis complete • 2011 Automobile analysis complete • 2012 Automotive analysis underway • In progress analysis of Solid Oxide stationary system
Collaborations • ANL and NREL provide cooperative analysis and vetting of assumptions/results • Ballard/NexTech provide system design input for stationary systems.
Future Work • Conclude Solid Oxide and final pass of stationary systems • Conclude analysis of automobile and bus systems
25

Technical Backup Slides
26

27
Stationary System Overview Cost of system is highly dependent on specific application and configuration.
Therefore, we have made the following assumptions Operation on Natural Gas Cost of operation on Propane would be quite similar but fuel compressor might not be
needed, and sizing of reactor would slightly change Natural Gas supply pressure For 1kW and 5kW systems: NG gas supplied at 2 psig (thereby requiring a NG compressor) For 25kW and 100kW systems: NG supplied at 15 psig (thereby requiring only a pressure
regulator) Design for Water Neutral Operation System assumes an initial charge of DI water Condenser on flue gas is used to recover all future system water needs In hot/dry climate, additional water might be necessary (and water cleanup up subsystem)
Moderate climate is assumed No extreme cold heat tracing is added to the system
Fuel Cell stack is oil cooled Combined Heat and Power (CHP) operation System configurations assumed usable heat from both the stack and from the reactor Quantity and Quality of excess heat from these two streams are quite different System cost includes two CHP heat exchangers: 1) Liquid/Liquid Heat exchanger (Fuel Cell Oil Coolant to Building Liquid Coolant) 2) Gas/Liquid Heat exchanger (Reactor Flue Gas to Building Liquid Coolant)
Further details of the heat transfer to the building have not been modeled 27

28
Low Temp PEM FC System Configuration Assumptions
28
Technology Type
Annual Production Rate systems/year
System Net Electric Power (Output) kWnet 1 5 25 100 1 5 25 100
System Voltage @ Peak Power V 24 120 250 250 24 120 250 250
Active Width cm 10.60 10.66 11.69 16.54 10.60 10.66 11.69 16.54
Active Height cm 7.07 7.11 7.80 11.03 7.07 7.11 7.80 11.03
Active Cells per Stack cells/stack 36 178 185 370 36 178 185 370
Cell Voltage @ Peak Power V/cell 0.676 0.676 0.676 0.676 0.676 0.676 0.676 0.676
Stacks per System stacks/system 1 1 4 4 1 1 4 4
System Gross Electric Power (Output) kWgross 1.10 5.50 27.50 110.00 1.10 5.50 27.50 110.00
MEA Areal Power Density @ Peak Power mW/cm2 408 408 408 408 408 408 408 408
100 1,000
Stationary Low Temp PEM
Annual Production Rate systems/year
System Net Electric Power (Output) kWnet 1 5 25 100 1 5 25 100
System Voltage @ Peak Power V 24 120 250 250 24 120 250 250
Active Width cm 10.60 10.66 11.69 16.54 10.60 10.66 11.69 16.54
Active Height cm 7.07 7.11 7.80 11.03 7.07 7.11 7.80 11.03
Active Cells per Stack cells/stack 36 178 185 370 36 178 185 370
Cell Voltage @ Peak Power V/cell 0.676 0.676 0.676 0.676 0.676 0.676 0.676 0.676
Stacks per System stacks/system 1 1 4 4 1 1 4 4
System Gross Electric Power (Output) kWgross 1.10 5.50 27.50 110.00 1.10 5.50 27.50 110.00
MEA Areal Power Density @ Peak Power mW/cm2 408 408 408 408 408 408 408 408
10,000 50,000

29
High Temp PEM FC System Configuration Assumptions
29
Technology Type
Annual Production Rate systems/year
System Net Electric Power (Output) kWnet 1 5 25 100 1 5 25 100
System Voltage @ Peak Power V 21.84 109.2 104 209.52 21.84 109.2 104 209.52
Cell Active Width cm 14.56 14.56 33.36 33.36 14.56 14.56 33.36 33.36
Cell Active Length cm 9.71 9.71 22.24 22.24 9.71 9.71 22.24 22.24
Active Cells per Stack cells/stack 42 210 200 403 42 210 200 403
Cell Voltage @ Peak Power V/cell 0.520 0.520 0.520 0.520 0.520 0.520 0.520 0.520
Stacks per System stacks/system 1 1 1 2 1 1 1 2
System Gross Electric Power (Output) kWgross 1.19 5.93 29.67 119.57 1.19 5.93 29.67 119.57
MEA Areal Power Density @ Peak Power mW/cm2 200 200 200 200 200 200 200 200
Total FC Subsystem Cost $/kWnet $3,506 $1,506 $815 $681 $2,508 $1,125 $715 $551
Total Stacks Cost $/kW (Net) $1,762 $1,085 $706 $643 $1,080 $774 $622 $518
Stationary High Temperature PEM
100 1,000
Annual Production Rate systems/year
System Net Electric Power (Output) kWnet 1 5 25 100 1 5 25 100
System Voltage @ Peak Power V 21.84 109.2 104 209.52 21.84 109.2 104 209.52
Cell Active Width cm 14.56 14.56 33.36 33.36 14.56 14.56 33.36 33.36
Cell Active Length cm 9.71 9.71 22.24 22.24 9.71 9.71 22.24 22.24
Active Cells per Stack cells/stack 42 210 200 403 42 210 200 403
Cell Voltage @ Peak Power V/cell 0.520 0.520 0.520 0.520 0.520 0.520 0.520 0.520
Stacks per System stacks/system 1 1 1 2 1 1 1 2
System Gross Electric Power (Output) kWgross 1.19 5.93 29.67 119.57 1.19 5.93 29.67 119.57
MEA Areal Power Density @ Peak Power mW/cm2 200 200 200 200 200 200 200 200
Total FC Subsystem Cost $/kWnet $2,052 $966 $507 $381 $1,828 $745 $417 $327
Total Stacks Cost $/kW (Net) $789 $655 $425 $352 $695 $465 $343 $301
50,00010,000