Fuel Cell Development Status - Energy.gov€¦ · Utility emissions rates based on eGRID 2007 V1.1...
20
Fuel Cell Development Status Michael Short Systems Engineering Manager
Transcript of Fuel Cell Development Status - Energy.gov€¦ · Utility emissions rates based on eGRID 2007 V1.1...

Fuel Cell
Development
Status
Michael Short
Systems Engineering Manager

United Technologies Corporation
Research
Center
Hamilton
Sundstrand
UTC Power UTC Fire
& Security
Fortune 50 corporation
$52.9B in annual sales in 2009
~60% of Sales are in building technologies

Transportation Stationary Fuel Cells Space & Defense
• Fuel cell technology leader since 1958
• ~ 550 employees
• 768+ Active U.S. patents, more than
300 additional U.S. patents pending
• Global leader in efficient, reliable, and
sustainable fuel cell solutions
UTC Power
About Us

PureCell® Model 400 Solution
Process Overview
Power Conditioner
Converts DC power to
high-quality AC power
3 Fuel Cell Stack
Generates DC power
from hydrogen and air
2 Fuel Processor
Converts natural gas
fuel to hydrogen
1
Electric Output: 42%
400 kW, 480V, 60 Hz
Heat Recovery: 1.537 MMBtu/hr (kW)
High-Grade up to 250°F (120°C) 683,000 (200)
Low-Grade up to 140°F (60°C) 854,000 (250)
Fuel Input (LHV):
Natural gas
3.2 MMBtu/hr (950 kW)
All Values are Beginning-of-Life (BOL)
Product Certified To FC-1 & CARB 2007
4
Overall System
Efficiency Up To
90%
5
Environmental Benefits
400
600
800
1000
1200
1400
1600
1800
2000
0% 20% 40% 60% 80% 100%
CO
2 E
mis
sio
ns R
ate
(lb
s/M
Wh
)
% Heat Utilization
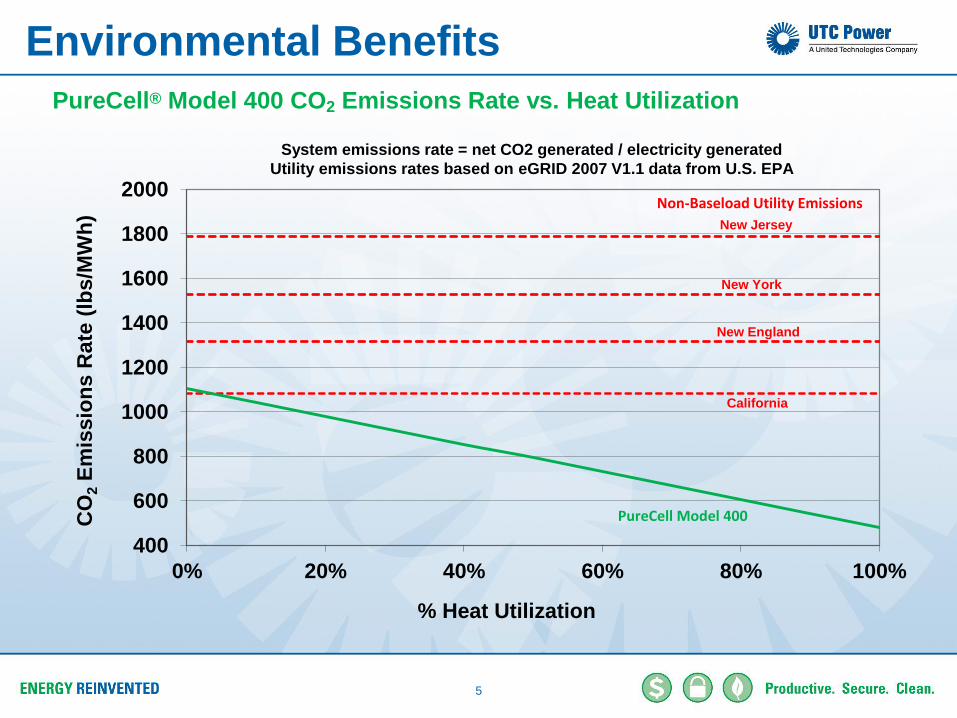
Non-Baseload Utility Emissions
PureCell Model 400
System emissions rate = net CO2 generated / electricity generated
Utility emissions rates based on eGRID 2007 V1.1 data from U.S. EPA
New Jersey
New England
California
New York
PureCell® Model 400 CO2 Emissions Rate vs. Heat Utilization

PureCell® Model 400 Manufacturing
6
• Manufacturing plant modernization completed
• Automated cell stack assembly/robotics
• New cell stack test stands in place
• Rail/turntable assembly line to rapidly move
powerplants – eliminating cranes
• New final test stands for completed power plant
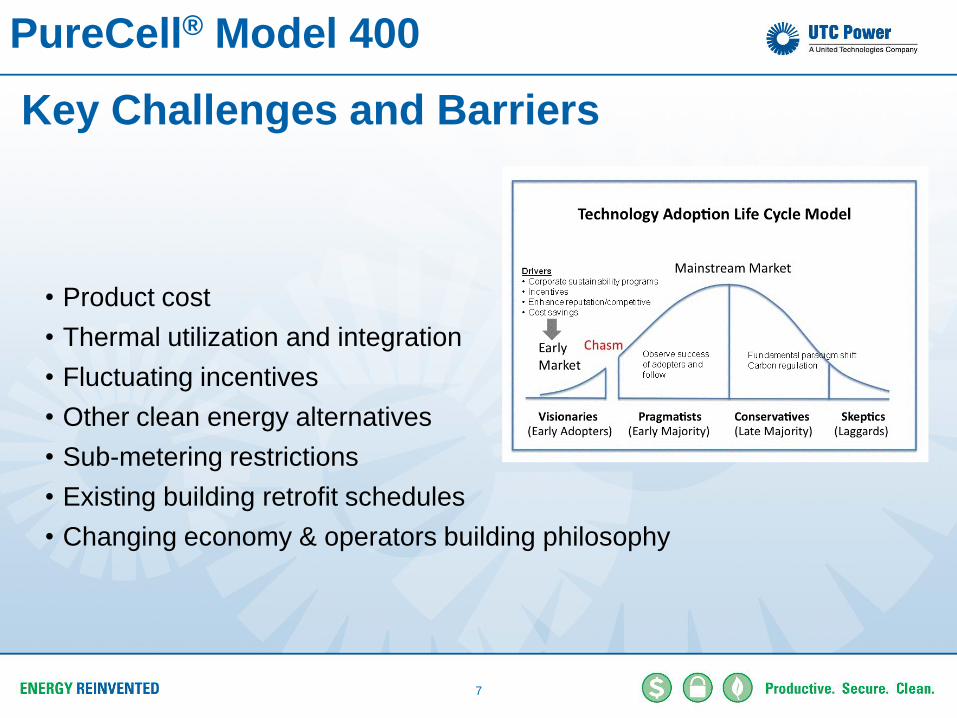
PureCell® Model 400
Key Challenges and Barriers
7
• Product cost
• Thermal utilization and integration
• Fluctuating incentives
• Other clean energy alternatives
• Sub-metering restrictions
• Existing building retrofit schedules
• Changing economy & operators building philosophy

Transportation Fuel Cells

Product summary
PureMotion® 120 fuel cell power plant for buses PEM fuel cell, 120 kW, hydrogen
Automotive fuel cell systems for primary power PEM fuel cell, 60-80 kW, hydrogen
Automotive fuel cell systems for auxiliary and
traction power and technology development PEM fuel cell, 5 kW, hydrogen
Fuel cell system for the Space Shuttle Orbiter Alkaline fuel cell, 12 kW, hydrogen
Transportation Fuel Cells
9

2005 2006 2007 2008 2009 2010 2011
PureMotion®120 fuel cell for transit bus applications
Fleet of six buses in California, Connecticut and Belgium
Two buses continue to operate in California and Connecticut
PEM Stack durability demonstrated in revenue service
Fleet recorded 471,000 miles, 46,800 hours & 11,300 starts
Original Fleet
2012 2013 2014 2015
Current Fleet Next Generation PureMotion®120 for transit bus application
Sixteen new fuel cell buses in California and Connecticut
Entered revenue service August 2010 – April 2011
10
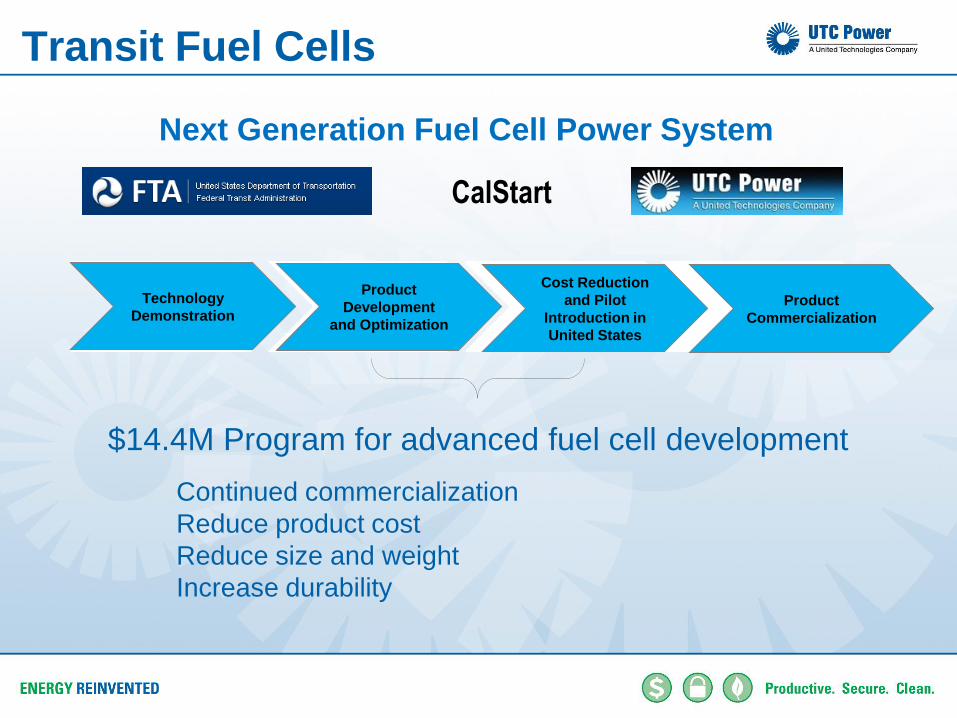
Transit Fuel Cells
Transit Fuel Cells
Next Generation Fuel Cell Power System
CalStart
$14.4M Program for advanced fuel cell development
Continued commercialization
Reduce product cost
Reduce size and weight
Increase durability
Technology
Demonstration
Product
Development
and Optimization
Cost Reduction
and Pilot
Introduction in
United States
Product
Commercialization

Space and Defense Fuel Cells
12
Metric Design
Status
Average Net Power 300 kW
Fuel Bio-ethanol
Reformate
Oxidant Pure Oxygen
Shock & Vibration US Naval
Equivalent
Tilt Submarine
Requirements
Air Independent Propulsion Power System

Advanced SOFC Systems
High efficiency (55%) achievable in a simple atmospheric system on NG
570 cm
215 cm
215 cm
Conceptual layout of a net 400 kW SOFC power system
High overall fuel utilization via
anode recycling,
High level of in-stack methane
reforming
Commitment to lower parasitic
power loss from balance-of-
plant (BOP) components.
Levelized cost of electricity, driven
by durability, efficiency &
equipment cost, is the key figure of
merit for commercialization
Stack scale up (>50 kW) and
durability (>40,000 h) represents
the largest technology gap
13

Ground Generator
14
Metric Design Status
Average Net Power (kW) 12
Net Efficiency 35%
Power Density (W/L) 20
Specific Power (W/kg) 40
Start Up Time (min) < 30 min
Mil-Std Comp. Yes
Maintenance Int. (hrs) 150
Ambient Rating Conditions: 4000 ft altitude, 95 °F
Design Challenges – power density, 30
minute start up on liquid fuels
TRL-3 in Q4 10
Stacks Liquid Fuel Desulfurizer
Main Blower
Recycle Blower Batteries High Temperature
Heat Exchanger
74
cm
12 kW on JP-8, JP-5, ULSD with < 400 ppmw S
Advanced SOFC Systems
Advanced SOFC Systems
15
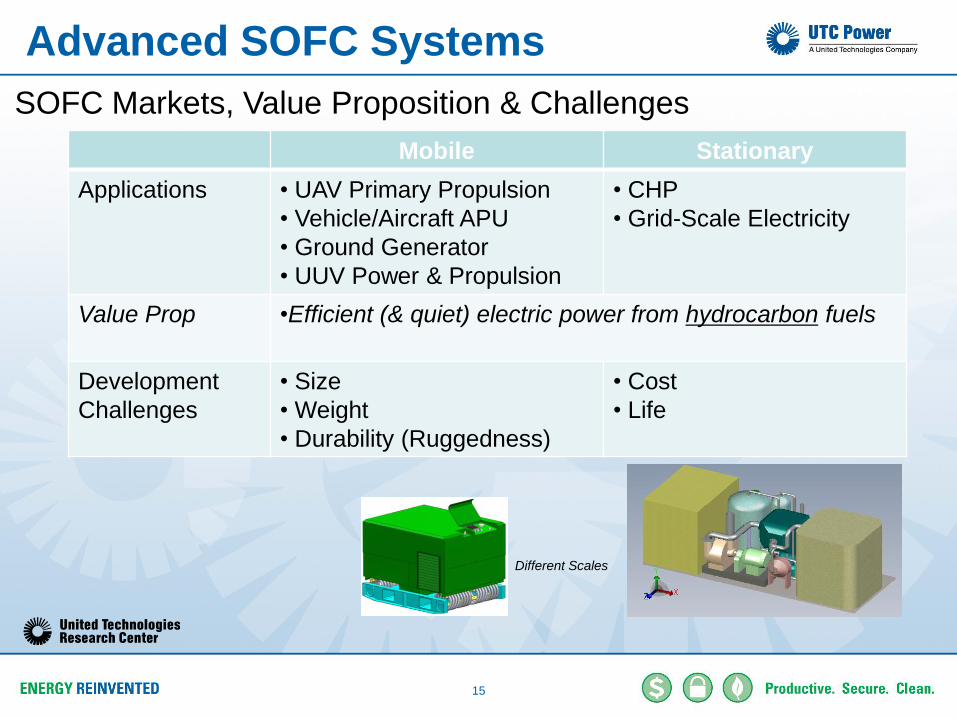
Mobile Stationary
Applications • UAV Primary Propulsion
• Vehicle/Aircraft APU
• Ground Generator
• UUV Power & Propulsion
• CHP
• Grid-Scale Electricity
Value Prop •Efficient (& quiet) electric power from hydrocarbon fuels
Development
Challenges
• Size
• Weight
• Durability (Ruggedness)
• Cost
• Life
SOFC Markets, Value Proposition & Challenges
Different Scales

THANK YOU !
www.utcpower.com
R041310
16

How A Fuel Cell Works
External Circuit
The electrons cannot pass through
this electrolyte and, therefore, must
flow through an external circuit in the
form of electric current. This current
can power an electric load.
Cathode
As oxygen flows into the fuel cell
cathode, another catalyst layer
helps the oxygen, protons, and
electrons combine to produce pure
water and heat.
Electrolyte
The electrolyte in the center allows
only the protons to pass through
the electrolyte to the cathode side
of the fuel cell.
Anode
As hydrogen flows into the fuel cell
anode, a catalyst layer on the
anode helps to separate the
hydrogen atoms into protons
(hydrogen ions) and electrons.
1 3
2 4

How A Fuel Cell Works
Left and Right Sides
It’s a Wrap! – Connecticut Science Center
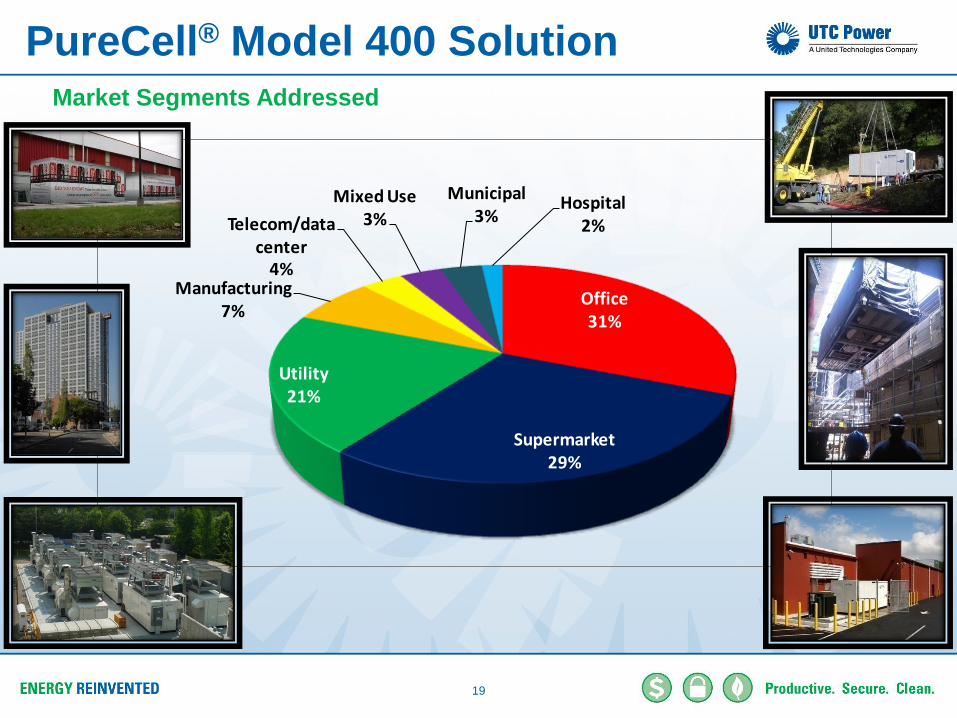
Office31%
Supermarket29%
Utility21%
Manufacturing7%
Telecom/data center
4%
Mixed Use3%
Municipal3%
Hospital2%
PureCell® Model 400 Solution
19
Market Segments Addressed

Source: AC Transit ; http://www.actransit.org/environment/hyroad_environmental.wu
12
10
8
6
4
2
0
Diesel with
aftertreatment
Standard
compressed
natural gas
Gasoline
hybrid
Fuel cell
hybrid
(miles per equivalent gallon gasoline)
Transit bus fuel efficiency
Transit Fuel Cells Energy productivity