
FT-ICR MS analysis of asphaltenes: Asphaltenes go in, fullerenes come out
10
1 3 FT-ICR MS analysis of asphaltenes: Asphaltenes go in, fullerenes come 4 out 5 6 7 Thieres M.C. Pereira a Q1 , Gabriela Vanini a , Lílian V. Tose a , Felipe M.R. Cardoso b , Felipe P. Fleming b , 8 Paulo T.V. Rosa c , Christopher J. Thompson d , Eustáquio V.R. Castro a , Boniek G. Vaz e,⇑ , 9 Wanderson Romão a,f,⇑ 10 a Petroleomic and Forensic Chemistry Laboratory, Department of Chemistry, Federal University of Espírito Santo, 29075-910 Vitória, ES, Brazil 11 b Petróleo Brasileiro S/A – PETROBRAS, CENPES, Rio de Janeiro, RJ, Brazil 12 c Chemistry Institute, University of Campinas, Campinas, Brazil 13 d Bruker Daltonics, 40 Manning Road, Billerica, MA 01821, United States 14 e Chemistry Institute, Federal University of Goiás, 74001-970 Goiânia, GO, Brazil 15 f Federal Institute of Education, Science and Technology of Espírito Santo, 29106-010 Vila Velha, ES, Brazil 16 17 19 highlights 20 21 We describe FT-ICR MS analysis of asphaltene using different ionization sources. 22 LDI/MALDI facilitated clustering reactions to form characteristic fullerene ions. 23 The clusterization of asphaltenes showed a dependency on the laser power density. 24 APCI/APPI should be more suitable to access the chemical composition of asphaltene. 25 27 article info 28 Article history: 29 Received 10 January 2014 30 Received in revised form 13 April 2014 31 Accepted 15 April 2014 32 Available online xxxx 33 Keywords: 34 Petroleomics 35 Asphaltenes 36 Ionization source 37 FT-ICR MS 38 Fullerene clusters 39 40 abstract 41 Asphaltenes analysis still remains a challenge due to their unknown molecular structure and self-associa- 42 tive behavior. FT-ICR MS analyses using five different ionization methods, ESI, APCI, APPI, LDI and MALDI, 43 in both positive and negative mode were performed. A characteristic and typical behavior was observed 44 for the experiments using LDI(±) and MALDI(±)FT-ICR analyses: a broadband mass spectrum ranging from 45 m/z 500 to 3000 was observed with a 24 Da interval. This phenomenon was attributed to fullerene cluster 46 formation. The most abundant allotropic form of fullerene, C 60 , was observed at m/z 719.99914. These 47 species were not observed in APCI(+)/APPI(+) analyses. This last analysis of asphaltene samples doped 48 with the C 60 solution promptly reveals the typical fullerene ions. LDI(+) analyses of pure C 60 showed con- 49 densation products. These results indicate a clusterization of asphaltenes in the LDI/MALDI plume, which 50 showed a highly dependency on the laser power density. The dispersion of LDI results on carbonaceus 51 samples in the literature is associated with the lack of control of these parameters. However, to access 52 the sample composition, APPI and APCI should be more suitable. 53 Ó 2014 Elsevier Ltd. All rights reserved. 54 55 56 57 1. Introduction 58 Asphaltenes are defined by their solubility in toluene and their 59 insolubility in normal paraffinic solvents (e.g., n-heptane). Compo- 60 sitionally, asphaltenes characteristically have a high heteroatomic 61 content (N, O, S) and polar nature. Despite its importance, asphalt- 62 enes analysis is challenge majorly due to the difficulties imposed to 63 the analytical methods by its aggregation properties [1]. 64 Asphaltenes are intimately related to several operational issues 65 in both upstream and downstream oil production, putting its 66 behavior in the center of attention and attracting research invest- 67 ments [1–5]. 68 Spectrometric analysis of asphaltene fractions remains chal- 69 lenging because their molecular properties cause limited solubility 70 and subsequent self-aggregation [6,7]. Fluorescence quenching 71 measurements indicated that the critical nanoaggregate concen- 72 tration (CNAC) is around 60 mg/L in toluene [1]. http://dx.doi.org/10.1016/j.fuel.2014.04.049 0016-2361/Ó 2014 Elsevier Ltd. All rights reserved. ⇑ Corresponding authors at: Federal Institute of Education, Science and Technol- ogy of Espírito Santo, 29106-010 Vila Velha, ES, B Q2 razil. Tel.: +55 27 3149 0833 (W. Romão). Tel.: +55 62 3521 1016x261 (B.G. Vaz). E-mail addresses: [email protected] (B.G. Vaz), [email protected] (W. Romão). Fuel xxx (2014) xxx–xxx Contents lists available at ScienceDirect Fuel journal homepage: www.elsevier.com/locate/fuel JFUE 8043 No. of Pages 10, Model 5G 29 April 2014 Please cite this article in press as: Pereira TMC et al. FT-ICR MS analysis of asphaltenes: Asphaltenes go in, fullerenes come out. Fuel (2014), http:// dx.doi.org/10.1016/j.fuel.2014.04.049
Transcript of FT-ICR MS analysis of asphaltenes: Asphaltenes go in, fullerenes come out

1
3
4
5
6
7 Q1
8
9
101112131415
1617
1 92021222324
25
2 7
2829303132
33343536373839
4 0
5657
58
59
60
61
Q2
Fuel xxx (2014) xxx–xxx
JFUE 8043 No. of Pages 10, Model 5G
29 April 2014
Contents lists available at ScienceDirect
Fuel
journal homepage: www.elsevier .com/locate / fuel
FT-ICR MS analysis of asphaltenes: Asphaltenes go in, fullerenes comeout
http://dx.doi.org/10.1016/j.fuel.2014.04.0490016-2361/� 2014 Elsevier Ltd. All rights reserved.
⇑ Corresponding authors at: Federal Institute of Education, Science and Technol-ogy of Espírito Santo, 29106-010 Vila Velha, ES, Brazil. Tel.: +55 27 3149 0833(W. Romão). Tel.: +55 62 3521 1016x261 (B.G. Vaz).
E-mail addresses: [email protected] (B.G. Vaz), [email protected](W. Romão).
Please cite this article in press as: Pereira TMC et al. FT-ICR MS analysis of asphaltenes: Asphaltenes go in, fullerenes come out. Fuel (2014),dx.doi.org/10.1016/j.fuel.2014.04.049
Thieres M.C. Pereira a, Gabriela Vanini a, Lílian V. Tose a, Felipe M.R. Cardoso b, Felipe P. Fleming b,Paulo T.V. Rosa c, Christopher J. Thompson d, Eustáquio V.R. Castro a, Boniek G. Vaz e,⇑,Wanderson Romão a,f,⇑a Petroleomic and Forensic Chemistry Laboratory, Department of Chemistry, Federal University of Espírito Santo, 29075-910 Vitória, ES, Brazilb Petróleo Brasileiro S/A – PETROBRAS, CENPES, Rio de Janeiro, RJ, Brazilc Chemistry Institute, University of Campinas, Campinas, Brazild Bruker Daltonics, 40 Manning Road, Billerica, MA 01821, United Statese Chemistry Institute, Federal University of Goiás, 74001-970 Goiânia, GO, Brazilf Federal Institute of Education, Science and Technology of Espírito Santo, 29106-010 Vila Velha, ES, Brazil
h i g h l i g h t s
�We describe FT-ICR MS analysis of asphaltene using different ionization sources.� LDI/MALDI facilitated clustering reactions to form characteristic fullerene ions.� The clusterization of asphaltenes showed a dependency on the laser power density.� APCI/APPI should be more suitable to access the chemical composition of asphaltene.
414243444546474849505152
a r t i c l e i n f o
Article history:Received 10 January 2014Received in revised form 13 April 2014Accepted 15 April 2014Available online xxxx
Keywords:PetroleomicsAsphaltenesIonization sourceFT-ICR MSFullerene clusters
5354
a b s t r a c t
Asphaltenes analysis still remains a challenge due to their unknown molecular structure and self-associa-tive behavior. FT-ICR MS analyses using five different ionization methods, ESI, APCI, APPI, LDI and MALDI,in both positive and negative mode were performed. A characteristic and typical behavior was observedfor the experiments using LDI(±) and MALDI(±)FT-ICR analyses: a broadband mass spectrum ranging fromm/z 500 to 3000 was observed with a 24 Da interval. This phenomenon was attributed to fullerene clusterformation. The most abundant allotropic form of fullerene, C60, was observed at m/z 719.99914. Thesespecies were not observed in APCI(+)/APPI(+) analyses. This last analysis of asphaltene samples dopedwith the C60 solution promptly reveals the typical fullerene ions. LDI(+) analyses of pure C60 showed con-densation products. These results indicate a clusterization of asphaltenes in the LDI/MALDI plume, whichshowed a highly dependency on the laser power density. The dispersion of LDI results on carbonaceussamples in the literature is associated with the lack of control of these parameters. However, to accessthe sample composition, APPI and APCI should be more suitable.
� 2014 Elsevier Ltd. All rights reserved.
55
62
63
64
65
66
67
1. Introduction
Asphaltenes are defined by their solubility in toluene and theirinsolubility in normal paraffinic solvents (e.g., n-heptane). Compo-sitionally, asphaltenes characteristically have a high heteroatomiccontent (N, O, S) and polar nature. Despite its importance, asphalt-
68
69
70
71
72
enes analysis is challenge majorly due to the difficulties imposed tothe analytical methods by its aggregation properties [1].
Asphaltenes are intimately related to several operational issuesin both upstream and downstream oil production, putting itsbehavior in the center of attention and attracting research invest-ments [1–5].
Spectrometric analysis of asphaltene fractions remains chal-lenging because their molecular properties cause limited solubilityand subsequent self-aggregation [6,7]. Fluorescence quenchingmeasurements indicated that the critical nanoaggregate concen-tration (CNAC) is around 60 mg/L in toluene [1].
http://

73
74
75
76
77
78
79
80
81
82
83
84
85
86
87
88
89
90
91
92
93
94
95
96
97
98
99
100
101
102
103
104
105
106
107
108
109
110
111
112
113
114
115
116
117
118
119
120
121
122
123
124
125
126
127
128
129
130
131
132
133
134
135
136
137
138
139
140
141
142
143
144
145
146
147
148
149
150
151
152
153
154
155
156
157
158
159
160
161
162
163
164
165
166
167
168
169
170
171
172
173
174
175
176
177
178
179
180
181
182
183
184
185
186
187
188
189
190
191
192
193
194
195
196
197
2 T.M.C. Pereira et al. / Fuel xxx (2014) xxx–xxx
JFUE 8043 No. of Pages 10, Model 5G
29 April 2014
Fourier transform ion cyclotron resonance mass spectrometry(FT-ICR MS) provides unsurpassed mass resolution and accuracy,enabling the complex petroleum mixtures and asphaltenes to beanalyzed on a molecular level for comparison with the bulk mea-surements [8,9]. Accurate mass measurements [10,11] define theunique elemental composition (CcHhNnOoSs) and DBEs (doublebond equivalent), facilitating material classification by heteroatomcontent and the degree of aromaticity [12–14].
Out of the several atmospheric pressure ionization (API)sources, electrospray ionization (ESI) is particularly efficient ingenerating acceptable data for polar constituents with high hetero-atom content. The combination of positive and negative ESI withFT-ICR MS analyses of asphaltenes was reported by Klein et al[9]. The authors identified the differences between asphaltenescollected from different geographic locations using C7 precipitationand live oil depressurization experiments [9]. Using 1 mg mL�1
samples, they detected constituents with DBE values up to 37.Although ESI generates abundant ions from several polar species,substituted hydrocarbon cycloalkanes and aromatic species remainundetectable. Another problem for asphaltene analysis by ESI is thecompatibility of the solvents required by solution preparation(methanol, acetonitrile, or water) with the solvents that solubilizethe asphaltenes (benzene and toluene). Modifying the solvent sys-tems to enable the ESI destabilizes the asphaltene solutions result-ing in precipitation.
Atmospheric pressure chemical ionization (APCI) and atmo-spheric pressure photoionization (APPI) are suitable to asphalt-enes and model-asphaltene compound analyzes, especiallyunder selected measurement conditions [15–17]. These methodsefficiently ionize polycyclic aromatic hydrocarbons (PAHs) withor without heteroatoms, producing radical cations, [M]+�, andprotonated molecules, [M + H]+ [18]. APCI has been used in com-bination with collision-activated dissociation (CAD) to describethe preferred fragmentation pathways for the island and archi-pelago models [19]. Furthermore, when analyzing asphaltenesamples, the loss of varying alkyl chain lengths (between oneand twelve carbon, mainly methyl groups followed by ethyl,propyl, butyl, etc.) was observed as the dominant pathway, sug-gesting the existence of ‘‘island’’-type structures [20,5]. Changesto hydrocarbon and sulfur compounds during deep hydrotreat-ment processes were observed using APPI and were successfullyapplied to identify and catalog several vanadyl porphyrin struc-tures [21].
Laser desorption/ionization (LDI) techniques were developed inthe early 1970s and were further developed throughout the 1980s,with the introduction of matrix-assisted laser desorption/ioniza-tion (MALDI) technique. MALDI became an established ionizationmethod for mass spectrometry analysis of macromolecular com-pounds. These techniques were applied to analyze asphaltenesand heavy crude oil fractions [22–25]. It is well known that param-eters such as the laser wavelength, pulse width, laser fluency,potential reactions between ions and molecules, and the chemicalcharacteristics of the analyte, influence desorption/ionizationmechanism [25].
Although ESI, APPI, APCI, MALDI and LDI ionization methodshave been applied to asphaltene characterization [26,27], each ion-ization method access a subset of the global asphaltene composi-tional and structural diversity and do not correspond to the bulkproperties of asphaltenes. Therefore, understanding the effectscaused by the ionization parameters during the asphaltenes analy-sis by different ionization methods is crucial. The analysis of oneBrazilian asphaltene sample using different ionization sources,such as ESI, APCI, APPI, LDI and MALDI was performed. The resultssuggest that asphaltene analysis through LDI or MALDI ionizationmethods can lead to molecular reactions and subsequent cluster-ization and formation of fullerenic species.
Please cite this article in press as: Pereira TMC et al. FT-ICR MS analysis ofdx.doi.org/10.1016/j.fuel.2014.04.049
2. Experimental
2.1. Reagents
Toluene, pentane, tetrahydrofuran (THF) and carbon disulfide(CS2) (analytical grades with purity higher than 99.5%) were sup-plied by Vetec Química Fina Ltda, Brazil. Methanol, ammoniumhydroxide (NH4OH), sodium trifluoroacetate (NaTFA), L-arginine,formic acid (HCOOH), 2,3-dihydroxybenzoic acid (DHB), sinapicacid, a-cyano-4-hydroxycinnamic acid (CHCA) and fullerene werepurchased from Sigma–Aldrich Chemicals, USA. All reagents wereused as received.
2.2. Sample characterization
One sample of crude oil was obtained and characterized accord-ing to the standards of the American Society for Testing and Mate-rials (ASTM) to determine the API degree (ASTM D1298-99) [28],the total acid number (ASTM D664-09) [29], the kinematic viscos-ity (ASTM D7042-04) [30], and the total sulfur (ASTM D4294) [31].The characterization data obtained for the crude oil are as follows:API degree = 27.6, TAN = 0.17 mg KOH g�1, viscosity = 24.96 mm2/sat 30 �C, and total sulfur = 0.51 wt%. The emulsified water and sed-iment fraction was ca. 1.21% v/v. Subsequently, the oil sample wasfractionated using the saturates, aromatics, resins, and asphaltenes(SARA) method (ASTM 6560-00) [32]. The weight percent recoveryfor each fraction was as follows: saturates, 48.9 wt%; aromatics,30.9 wt%; resins, 18.0 wt%; and asphaltenes, 2.2 wt%. The asphal-tene sample was characterized using ESI, APCI, APPI, LDI and MAL-DI(±)FT-ICR MS.
2.3. FT-ICR MS analysis
FT-ICR MS analysis was performed using a 9.4 T Q-FT-ICR MShybrid (Solarix, Bruker Daltonics Bremen, Germany) equipped withcommercially available ESI/APCI/APPI [33–35] and MALDI sourcesset to operate over m/z 200–1000 (for ESI, APCI and APPI sources;Bruker Daltonics) or m/z 200–3000 (for LDI and MALDI sources).The asphaltene sample was analyzed using positive and negativeionization modes.
The asphaltene sample was diluted to ca. 0.25 mg mL�1 forESI(+) and 1 mg mL�1 for ESI(�) in 50:50 (v/v) toluene/methanolcontaining 10% w/v of HCOOH for ESI(+) and NH4OH for ESI(�).The same concentrations were utilized in APCI(±) measurements,but the solvent was changed to pentane/carbon disulfide [36,37].For the APPI(±) measurements, the sample was dissolved in ca.0.10 mg mL�1 toluene for APPI(+) and 1 mg mL�1 toluene forAPPI(�). To dissolve the entire sample, the solution was sonicatedduring 5 min. The resulting solution was directly infused into theionization source at 4–10 ll min�1 for ESI(±), 10 ll min�1 forAPPI(±) and 15–20 ll min�1 for APCI(±) (see Table 1 for furtherdetails). A Krypton photoionization lamp (k = 124 nm and 10 eV)and a corona discharge (5000 nA) were used in the APPI(±) andAPCI(±) sources, respectively. The API sources conditions, such asthe capillary voltage, end plate offset, transfer capillary tempera-ture, vaporization temperature, nebulizer gas pressure and dryingflow, are described in Table 1.
For the LDI(±) analyses, the asphaltene sample was diluted toca. 1 mg mL�1 (for both ionization modes) in three different sol-vents: toluene, CS2, and THF. The asphaltene solution was spotted(1 lL) directly onto a LDI plate and dried. For the MALDI(±) analy-ses, three freshly prepared saturated DHB, CHCA and sinapinic acidmatrix solutions in methanol were subsequently added to thespots. The LDI/MALDI source conditions were as follows: the plateoffset was �100 V, the deflector plate was �220 V, the Nd:YAG
asphaltenes: Asphaltenes go in, fullerenes come out. Fuel (2014), http://

198
199
200
201
202
203
204
205
206
207
208
209
210
211
212
213
214
215
216
217
218
219
220
221
222
223
224
225
226
227
228
229
230
231
232
233
234
235
236
237
238
239
240242242
243
244
245
246
247
248
249
250
251
252
253
254
255
256
257
258
259
260
261
262
263
264
265
266
267
268
269
270
271
272
273
274
275
276
277
278
279
280
281
282
283
284
Table 1Ionization source parameters optimized for FT-ICR mass spectral (9.4 T) analysis of asphaltene samples.
ESI APPI APCI MALDI/LDI
+ � + � + � + �
Concentration (mg mL�1) 0.25 1.0 0.1 1.0 0.25 1.0 1.0 1.0Flow (lL min1) 4 10 10 10 20 15 – –Mass range (m/z) 200–1000 200–1000 200–1000 200–1000 200–1000 200–1000 200–3000 200–3000Capillary voltage (V) �3500 3500 �3000 2500 �2000 3000 – –End plate offset (V) �500 �500 �500 �500 �500 �500 �500 �500Transfer capillary Temperature (�C) 250 250 250 250 250 250 – –Vaporization Temperature (�C) – – 320 320 320 320 – –Nebulizer gas pressure (bar) 1 1 1.5 1.5 2 2 – –Drying Flow (L min�1) 4 4 4 4 2 2 – –Skimmer (V) 30 �50 60 �75 50 �75 15 15Collision voltage (V) �60 30 �50 50 �50 35 �0.5 �0.5Ion accumulation time (s) 0.8 0.5 0.3 0.3 0.3 0.8 0.5 0.5Time-of-flight (ms) 0.9 0.8 0.9 0.8 0.8 0.8 0.8 0.8
T.M.C. Pereira et al. / Fuel xxx (2014) xxx–xxx 3
JFUE 8043 No. of Pages 10, Model 5G
29 April 2014
laser had a 100 Hz frequency, wavelength of 355 nm (third har-monic that corresponds to 3.5 eV), the foci ranged from mediumto small (100–250 lm in a spot diameter of 800 lm), and the max-imum energy was 40% (full power corresponds to 250 lJ)respectively.
Generally, a 0.3–0.8 s ion accumulation time in the hexapolewas followed by ion transfer to the analyzer cell (ICR) throughthe multipole ion guide system (another hexapole). Each spectrumwas acquired using 200 scans of time-domain transient signals in 4mega-point time-domain data sets (Table 1). The front and backtrapping voltages in the ICR cell were �0.60 V and �0.65 V for neg-ative ionization mode and +0.80 V and +0.85 V for positive ioniza-tion mode. All mass spectra were externally calibrated using L-arginine and NaTFA solutions (m/z 200–1200) after internal recal-ibration using the most abundant homologous alkylated com-pounds in each sample.
The resolving power (m/Dm50% from 450,000 to 550,000 at m/z400, where Dm50% is the full peak width at half-maximum peakheight) and <1 ppm mass accuracy provided the unambiguousmolecular formula assignments for all singly charged molecularions. The mass spectra were acquired and processed with a customalgorithm specifically developed for petroleum data using Com-poser software (Sierra Analytics, Pasadena, CA, USA). For each spec-trum, an automated analysis was used to assign the formulas to thepeaks with a signal-to-noise ratio (S/N) greater than 3. The ele-ments allowed were 12C, 1H, 16O, 14N, 32S, and 13C. The maximumallowed formula error was 1 ppm, and the mass limit for empiri-cally assigning the elemental formulas was 500 Da. The formulaswith atomic masses greater than 500 Da were assigned throughthe detection of a homologous series. If no chemical formulamatched a m/z value within the allowed error, the peak was notincluded in the list of elemental formulas. For each elemental com-position, CcHhNnOoSs, the heteroatom class, the type [double bondequivalents (DBE) = the number of rings plus the double bondsinvolving carbon], and the carbon number, c, were tabulated togenerate the relative abundance distributions of the heteroatomclass, van Krevelen diagram and the graphical DBE versus the car-bon number images.
For the NC versus DBE plot, DBE was the number of rings addedto the number of double bonds in each molecular structure. Thearomaticity of a petroleum component can be deduced directlyfrom its DBE value according to Eq. (1):
285
286
DBE ¼ c � h=2þ n=2þ 1 ð1Þ 287288
289
290
where c, h, and n are the numbers of carbon, hydrogen, and nitrogenatoms, respectively, in the molecular formula.Please cite this article in press as: Pereira TMC et al. FT-ICR MS analysis ofdx.doi.org/10.1016/j.fuel.2014.04.049
3. Results and discussion
3.1. FT-ICR mass spectra for positive ionization mode
Fig. 1a–d display the spectra of a typical Brazilian asphalteneacquired using four different ionization sources: ESI(+), APCI(+),APPI(+), and LDI(+). In general, the ESI(+), APCI(+), and APPI(+)-FT-ICR mass spectra (Fig. 1a–c) show broadband profiles from m/z 200–800 with an average molar mass distribution centered atapproximately m/z 480, 448 and 460, respectively. Generally, FT-ICR mass spectrometers have an average resolution of 430,000 to520,000 at m/z values ranging from 400 to 490. The magnifiedregion near m/z 400 indicates that ESI(+) mostly detects hetero-atom-containing compounds (correspond to ions [C30H13NO + H]+,DBE = 25, and [C31H17N + H]+, DBE = 24, respectively). APCI(+) andAPPI(+) sources produced more ions than ESI(+) (14 for APCI(+)and 16 for APPI(+)) due to their ability to produce radical cations[M]+� and protonated molecules [M + H]+ simultaneously). Theyalso efficiently ionize polycyclic aromatic compounds ([C30H13-
NO + H]+, DBE = 25 or [C32H20]�+, DBE = 23) (Fig. 1b–d). Therefore,FT-ICR MS may distinguish different compounds by selecting dif-ferent ionization methods. Consequently, the different ionizationmethods available to analyze the selected asphaltene sampleshould be compared [39,40].
Gaspar et al. [39] investigated the chemical composition ofasphaltene fraction samples using five distinct atmospheric pres-sure ionization techniques (ESI, H-ESI, APCI, APPI and APLI). Similarto our work, higher number of assigned molecular formulas areobserved for APCI(+) and APPI(+) sources and a lowest number ofassignments for ESI(+).
Some works have also reported the characterization of asphal-tene fractions using only APPI(+) [13,18,40,41]. In 2011, Tachonet al. [40] isolated and characterized organic compounds fromSARA fractions using a hybrid mass spectrometer: APPI(+)QqTOF-MS. The fraction precipitated in heptane (ca. 13 wt%) had a500 Da Mw. In 2012, Cho et al. [41] also observed similar resultswhen analyzing heavy oil products using a 15 T APPI(+)-FT-ICRMS; Mw values >600 Da were observed. Romao et al. analyzedten Brazilian asphaltene fractions from crude oil samples withAPI degrees ranging from 13 to 31. In all cases, a <500 Da Mw
was observed.A characteristic behavior was observed during the LDI(+)-FT-ICR
MS experiments using toluene as a solvent (Figs. 1d and 2c). Sev-eral peaks with a broad Gaussian profile from m/z 500 to 2000and an m/z centered at 900 Da were observed with a 24 Da interval.These peaks can be associated with fullerenes allotropic forms,with the C60 peak appearing at m/z 720.0008. This fullereneappearance may be due to the presence and the preferential
asphaltenes: Asphaltenes go in, fullerenes come out. Fuel (2014), http://

291
292
293
294
295
296
297
298
299
300
301
302
303
304
305
306
307
308
309
310
311
312
313
314
315
316
317
318
319
320
321
322
323
324
325
326
327
328
329
330
331
332
333
334
Fig. 1. FT-ICR mass spectra of a typical asphaltene sample using (a) ESI(+), (b) APCI(+), (c) APPI(+), and LDI(+) at (d) m/z 200–2000, as well as an expanded region at (e) m/z200–550. For the LDI(+) experiments, toluene was used to prepare the asphaltene solution (1 mg mL�1) with a laser pulse energy of 40%.
4 T.M.C. Pereira et al. / Fuel xxx (2014) xxx–xxx
JFUE 8043 No. of Pages 10, Model 5G
29 April 2014
ionization of these compounds in the bulk asphaltenic matrix ordue to its cluster formation during the LDI and MALDI processes[42,43].
In an attempt to minimize and suppress fullerene ionizationand therefore increase the abundance of the asphaltene fraction,the type of solvent used to prepare the asphaltene solution(1 mg mL�1) was varied. Fig. 2a and b display the LDI(+)FT-ICRMS mass spectra from samples prepared in CS2 and THF. In bothcases, a distribution of compounds that corresponded to fullereneclusters (Cn molecules where n ranges from C44 (m/z 527.9996) toC234 (m/z 2808.0022) was observed. At this point, the range massprofile was broader, and the m/z shifted toward larger m/z values.Another alternative methodology, MALDI(+)FT-ICR MS, was evalu-ated. Essentially, three saturated matrices solutions (CHCA, DHBand sinapinic acid) were prepared and added to the spots contain-ing asphaltenes dissolved in toluene (1 mg mL�1). The MALDI(+)FT-ICR mass spectra are displayed in Fig. 2d and f. In the experimentswith all three matrices, the fullerene compounds were detected(most abundant ions appeared within the m/z 200–900 region).Both the matrices and the occurrence of fullerene cluster formationsuppressed the ionization of organic compounds present in theasphaltene fractions.
Fig. 2. LDI(+)FT-ICR mass spectra for asphaltene samples prepared in (a) CS2, (b) THF andICR mass spectra for the asphaltene sample using (d) CHCA, (e) DHB and (f) synaptic acidsample was dissolved in toluene. Laser pulse energy of 40% was also used in all the exp
Please cite this article in press as: Pereira TMC et al. FT-ICR MS analysis ofdx.doi.org/10.1016/j.fuel.2014.04.049
The fullerene cluster may be formed during the ionization pro-cesses performed in the LDI(+) and MALDI(+)FT-ICR analysis. It iswell known that polyaromatic hydrocarbons (PAH) readily aggre-gate after desorption under favorable conditions, includingreduced pressure (10�6 mbar) and high laser power [42]. These fac-tors may synergistically contribute to fullerene cluster formationwith an increasing number of fused rings in the original sample.However, the peaks with spacing of 12, 24 and 26 u were easilydistinguished above 500 Da due to the growth of PAH via the inser-tion of a CH2 bridge, followed by hydrogen elimination (spacing of12 Da), a sequential addition of C2 as an ethylene bridge (spacing of24 Da), or via sequential addition of C2H2 (mass increment of26 Da) [42]. Growth reactions may have occurred in the laserplume due to high concentrations of PAH present in the asphaltenefractions.
To better understand the mechanism behind the fullerene clus-ter formation during the LDI(+)/MALD(+) experiments, a typicalcommercial fullerene and asphaltenes doped with fullerene solu-tions (1 mg mL�1) were directly infused into APCI(+) (Fig. 3a andd), APPI(+) (Fig. 3b and e), and LDI(+) (Fig. 3c) sources. In theAPCI(+) and APPI(+)FT-ICR MS experiments, similar chemical pro-files were observed. For the pure commercial fullerene solution, a
(c) toluene. In all cases, the same concentration was used (1 mg mL�1). MALDI(+)FT-as the organic matrices. For the MALDI(+)FT-ICR mass experiments, the asphaltene
eriments.
asphaltenes: Asphaltenes go in, fullerenes come out. Fuel (2014), http://

335
336
337
338
339
340
341
342
343
344
345
346
347
348
349
350
351
352
353
354
355
356
357
358
359
360
361
362
363
364
365
366
367
368
369
370
Fig. 3. (a) APCI(+), (b) APPI(+) and (c) LDI(+)FT-ICR MS for the fullerene solution; and (d) APCI(+), (e) APPI(+)FT-ICR MS for the asphaltene sample doped with fullerene C60.
T.M.C. Pereira et al. / Fuel xxx (2014) xxx–xxx 5
JFUE 8043 No. of Pages 10, Model 5G
29 April 2014
parent peak at 720 Da (C60�+ at m/z 720), with the typical isotopic
pattern dominates the APCI(+) and APPI(+) spectra. In theLDI(+)FT-ICR MS of standard fullerene solution, in addition to thepeak at 720 Da, fullerene cluster in the range of m/z 720–2000and fragmentation (m/z 400–720) are observed in Fig. 3c. This isin agreement with results reported by Apicella and co-works[42], showing clustering and fragmentation phenomena in theLDI asphaltene analysis.
The laser applied in low vacuum LDI and MALDI conditionscould induce clusterization of large PAH from the samples. Thisphenomenon was reported [42,44], but only in asphaltene’s molec-ular models. In Fig. 4, it is showed that this interesting phenome-non also happens with crude oil sample.
The clusterization phenomenon takes place when the laserpower is set to 40% or higher. Using a laser power of 60%, all signalsof crude oil (m/z 200–1000) are suppressed. The LDI(+)FT-ICR spec-tra of the crude oil acquired with a laser power above 40% providesclear evidence of an extensive fullerene clusters formation (see the
Fig. 4. LDI(+)FT-ICR mass spectra of crude oil acquir
Please cite this article in press as: Pereira TMC et al. FT-ICR MS analysis ofdx.doi.org/10.1016/j.fuel.2014.04.049
typical peak of m/z 720) in desorption plume from the crude oilsample. These results are in good agreement when a pure commer-cial fullerene solution (1 mg mL�1) is also submitted to differentlaser pulse power (from 20 to 80%, see Fig. 1S, Supplementarymaterial). However, the fullerene clusters formation can be mini-mized when diluted solutions are analyzed, lower than0.5 mg mL�1, Fig. 2S).
In summary, these results indicate that pure and small alkyl-substituted poly-nuclear aromatics are easily ionized under LDIconditions. They start to polymerize at relatively low laser energiesand continue to polymerize at higher laser energies. The fragmen-tation profile observed on the spectra is related to the bridged aro-matics that ionize at low laser energy, but start to fragment atmoderate laser energy. Non-aromatics are difficult to ionize usinglaser desorption, except in the presence of an appropriate matrix,(MALDI conditions).
An alternative laser-based ionization technique is laser desorp-tion laser ionization mass spectrometry (L2MS). In this technique,
ed as function of different laser pulse energies.
asphaltenes: Asphaltenes go in, fullerenes come out. Fuel (2014), http://
371
372
373
374
375
376
377
378
379
380
381
382
383
384
385
386
387
388
389
390
391
392
393
394
395
396
397
398
399
400
401
402
403
404
405
406
407
408
409
410
411
412
413
414
415
416
417
418
419
420
421
422
423
424
425
426
6 T.M.C. Pereira et al. / Fuel xxx (2014) xxx–xxx
JFUE 8043 No. of Pages 10, Model 5G
29 April 2014
desorption and ionization are separated in time and in space andare performed with separate lasers [45,25]. In the desorption step,a pulsed infrared (IR) laser desorbs analytes from the surface ofsome substrate, such as glass or quartz. In the ionization step,gas-phase analytes are photoionized, typically by either resonantenhanced multiphoton ionization (REMPI) at 266 nm or single-photon ionization (SPI) at 157 nm.
Recently, Zare et al. [25] showed that mass spectra of asphalt-enes and PAHs model compounds acquired with L2MS contain nodetectable aggregate peaks. It is suggested that aggregation is min-imized in L2MS because the IR laser is sufficient only to break non-covalent bonds in the solid sample, resulting in desorption ofisolated neutral molecules. The plume of desorbed neutrals lacksions that cause ion-induced dipole attractive forces leading toaggregation in the gas phase. Fragmentation occurs occasionallyin REMPI-L2MS (two photon energy of 9.3 eV) and rarely in SPI-L2MS (single photon energy of 7.9 eV) due to the photon energyto be only slightly above the ionization potential of these mole-cules. The minimization of fragmentation and aggregation impliesthat L2MS may be an attractive ionization technique for analysis ofcomplex mixtures, where fragmentation and aggregation found intraditional ionization techniques, such as LDI and MALDI, result inmass spectra that evidence even the same phenomenon.
427
428
429
430
431
432
433
434
435
436
437
438
439
440
3.2. FT-ICR mass spectra for negative ionization mode
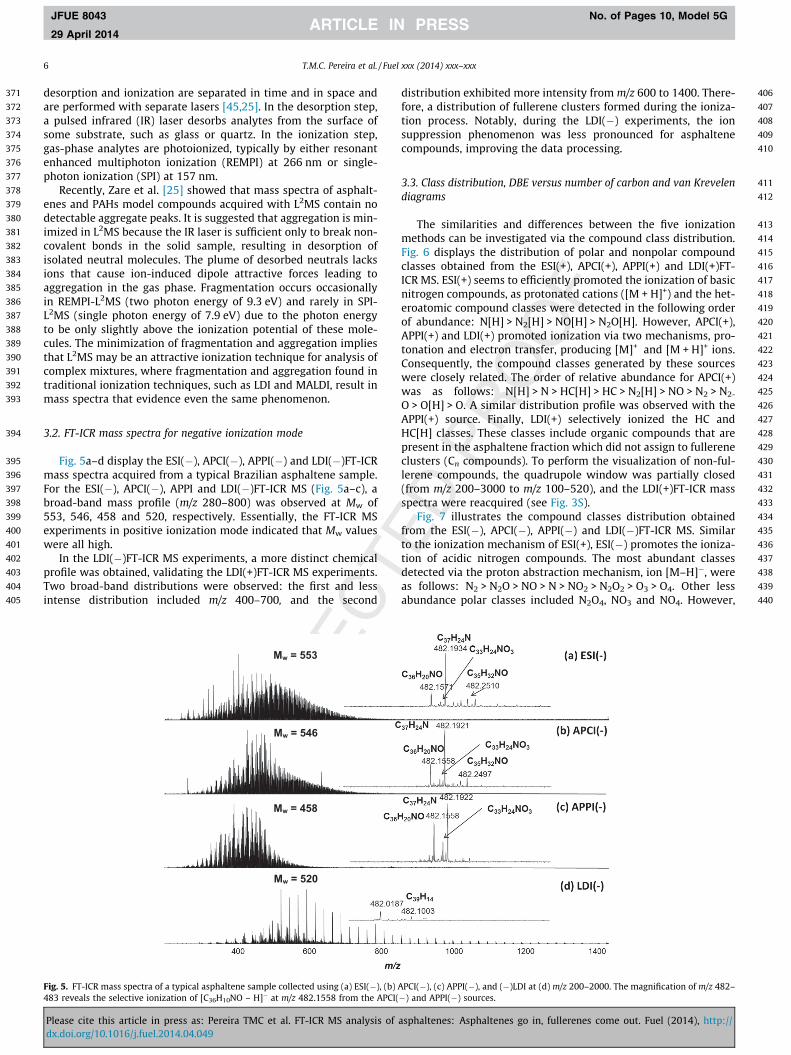
Fig. 5a–d display the ESI(�), APCI(�), APPI(�) and LDI(�)FT-ICRmass spectra acquired from a typical Brazilian asphaltene sample.For the ESI(�), APCI(�), APPI and LDI(�)FT-ICR MS (Fig. 5a–c), abroad-band mass profile (m/z 280–800) was observed at Mw of553, 546, 458 and 520, respectively. Essentially, the FT-ICR MSexperiments in positive ionization mode indicated that Mw valueswere all high.
In the LDI(�)FT-ICR MS experiments, a more distinct chemicalprofile was obtained, validating the LDI(+)FT-ICR MS experiments.Two broad-band distributions were observed: the first and lessintense distribution included m/z 400–700, and the second
Mw = 553
Mw = 546
Mw = 458
Mw = 520
Fig. 5. FT-ICR mass spectra of a typical asphaltene sample collected using (a) ESI(�), (b) A483 reveals the selective ionization of [C36H10NO – H]� at m/z 482.1558 from the APCI(
Please cite this article in press as: Pereira TMC et al. FT-ICR MS analysis ofdx.doi.org/10.1016/j.fuel.2014.04.049
distribution exhibited more intensity from m/z 600 to 1400. There-fore, a distribution of fullerene clusters formed during the ioniza-tion process. Notably, during the LDI(�) experiments, the ionsuppression phenomenon was less pronounced for asphaltenecompounds, improving the data processing.
3.3. Class distribution, DBE versus number of carbon and van Krevelendiagrams
The similarities and differences between the five ionizationmethods can be investigated via the compound class distribution.Fig. 6 displays the distribution of polar and nonpolar compoundclasses obtained from the ESI(+), APCI(+), APPI(+) and LDI(+)FT-ICR MS. ESI(+) seems to efficiently promoted the ionization of basicnitrogen compounds, as protonated cations ([M + H]+) and the het-eroatomic compound classes were detected in the following orderof abundance: N[H] > N2[H] > NO[H] > N2O[H]. However, APCI(+),APPI(+) and LDI(+) promoted ionization via two mechanisms, pro-tonation and electron transfer, producing [M]+� and [M + H]+ ions.Consequently, the compound classes generated by these sourceswere closely related. The order of relative abundance for APCI(+)was as follows: N[H] > N > HC[H] > HC > N2[H] > NO > N2 > N2-
O > O[H] > O. A similar distribution profile was observed with theAPPI(+) source. Finally, LDI(+) selectively ionized the HC andHC[H] classes. These classes include organic compounds that arepresent in the asphaltene fraction which did not assign to fullereneclusters (Cn compounds). To perform the visualization of non-ful-lerene compounds, the quadrupole window was partially closed(from m/z 200–3000 to m/z 100–520), and the LDI(+)FT-ICR massspectra were reacquired (see Fig. 3S).
Fig. 7 illustrates the compound classes distribution obtainedfrom the ESI(�), APCI(�), APPI(�) and LDI(�)FT-ICR MS. Similarto the ionization mechanism of ESI(+), ESI(�) promotes the ioniza-tion of acidic nitrogen compounds. The most abundant classesdetected via the proton abstraction mechanism, ion [M–H]�, wereas follows: N2 > N2O > NO > N > NO2 > N2O2 > O3 > O4. Other lessabundance polar classes included N2O4, NO3 and NO4. However,
PCI(�), (c) APPI(�), and (�)LDI at (d) m/z 200–2000. The magnification of m/z 482–�) and APPI(�) sources.
asphaltenes: Asphaltenes go in, fullerenes come out. Fuel (2014), http://

441
442
443
444
445
446
447
448
449
450
451
452
453
454
455
456
457
458
459
460
461
462
463
464
465
466
467
468
469
470
471
472
473
474
475
476
477
478
479
480
481
482
483
484
485
486
487
488
489
490
Fig. 6. Class distribution for a typical asphaltene fraction generated from ESI(+),APCI(+), APPI(+) and LDI(+)FT-ICR MS data.
T.M.C. Pereira et al. / Fuel xxx (2014) xxx–xxx 7
JFUE 8043 No. of Pages 10, Model 5G
29 April 2014
for the APCI(�), APPI(�) and LDI(�) sources, two ionization mech-anisms were observed: proton abstraction and electron transfergenerated [M–H]� and M��, respectively. Consequently, theobserved classes were duplicated. The class profiles obtained fromthe APCI(-) and APPI(-) data were very similar, displaying theextensive range of detected classes. The NO, NO[H], N2O[H] andN2O classes were the most abundant. The nonpolar species wereonly detected in the LDI(�) data because the generation of negativearomatic hydrocarbon ions with APCI(�) and APPI(�) was not pre-ferred [42].
Fig. 8a–d present the DBE versus the carbon number plots forthe N[H] class, which was the most abundant class of polar com-pounds detected in the ESI(+), APCI(+), APPI(+) and LDI(+)FT-ICRMS data for the asphaltene sample. ESI(+) (8a) reveals more nitro-gen-containing compounds when compared to the other ionizationsources (the carbon numbers ranged from C20 to C70, and the DBE
491
Fig. 7. Class distribution of a typical asphaltene fraction generat
Please cite this article in press as: Pereira TMC et al. FT-ICR MS analysis ofdx.doi.org/10.1016/j.fuel.2014.04.049
ranged from 10 to 40). The most abundant compounds display acarbon number of C50 and a DBE of 29. Therefore, ESI(+) may beemployed to selectively identify the polar components in theasphaltene sample, providing detailed data concerning nitrogen-containing compounds: pyridines, quinoline, and benzoquinoline,as well as their alkylated and hydrogenated derivatives. APCI(+)and APPI(+) (8b-c) display a similar profile, enabling the ionizationof compounds with narrow carbon numbers but with high DBE val-ues (C20–C45 and DBEs of 18–36). These two sources were the mostsuitable to ionize low polarity compounds. LDI(+) (8d) alsoimproved the compound ionization of molecules with a low carbonnumber and a high aromaticity (DBE = 6–36). For the HC[H] class,the DBE versus the carbon number were plotted for the APCI(+),APPI(+) and LDI(+) data showing similar results (Fig. 4S); the car-bon number ranged from C20 to C45, and the DBEs ranged from10 to 38. Additionally, the slopes of the lines determined by DBE/carbon number ratio were calculated by linear regression for pro-tonated basic nitrogen (N[H]) compounds classes. An increasingof the inclination of the DBE/carbon number line is observed inthe following order: LDI(+) > APPI(+) > APCI(+) > ESI(+), Fig. 8.Therefore, LDI(+) and APPI(+)-FT-ICR MS selectively identify highlyaromatic components in the asphaltene samples.
The van Krevelen diagram is another important graphical toolthat was first employed by Kim et al. [46] to distinguish condensedhydrocarbons from lipids and other components using FT-ICR massspectrometry. van Krevelen diagrams consist of iso-abundance sur-face as a function of (e.g.) the H/C ratio and O/C ratio for each com-pound containing the relevant atoms. In a van Krevelen diagram,the heteroatom classes were plotted separately on the x- (e.g., O/C ratio distinguished classes with different numbers of O atoms)and y-axes (the DBE difference was spread out along the H/C ratio).The homologous alkylation series were composed of compoundsthat contained the same number of rings plus double bonds, aswell as the same number of heteroatoms; but different numbersof CH2 groups. The van Krevelen plot facilitates the visual
ed from ESI(�), APCI(�), APPI(�) and LDI(�)FT-ICR MS data.
asphaltenes: Asphaltenes go in, fullerenes come out. Fuel (2014), http://

492
493
494
495
496
497
498
499
500
501
502
503
504
505
506
507
Fig. 8. DBE versus carbon number plots for nitrogen-containing compounds (N[H] class) generated from (a) ESI(+), (b) APCI(+), (c) APPI(+), and (d) LDI(+)FT-ICR MS data. Alaser pulse energy of 40% was used for LDI(+) experiments.
8 T.M.C. Pereira et al. / Fuel xxx (2014) xxx–xxx
JFUE 8043 No. of Pages 10, Model 5G
29 April 2014
separation of heteroatom classes, DBE types, and alkylationpatterns.
Fig. 9a–d compare the Nx profile classes detected during ESI(�),APCI(�), APPI(�) and LDI(�)FT-ICR MS analysis. The ESI(�) data(9a) revealed a larger magnitude of nitrogenous compounds incomparison with the other three ionization methods. The com-pounds with the largest relative abundance displayed an H/C of�0.7, indicating they were aromatic compounds. APPI(�) (9c)
Fig. 9. van Krevelen diagrams for Nx-containing species generated from
Please cite this article in press as: Pereira TMC et al. FT-ICR MS analysis ofdx.doi.org/10.1016/j.fuel.2014.04.049
detected fewer compounds than the APCI(�) (9b) and ESI(�)FT-ICR MS (9a). In contrast, LDI(�)FT-ICR MS (9d) providedcompounds with H/C �0.1, suggesting that only highly aromaticcompounds were ionized due to the ionization process in theLDI(�) source (9d), as previously discussed.
For the NxOy compounds in Fig. 10, the APCI(�) accessed a largerange of species (N2O or NO, NO2, NO3, NO4, 10b) except for theN2O class; which performed better in the ESI(�) source (10a).
(a) ESI(�), (b) APCI(�), (c) APPI(�) and (d) LDI(�)FT-ICR MS data.
asphaltenes: Asphaltenes go in, fullerenes come out. Fuel (2014), http://

508
509
510
511
512
513
514
515
516
517
518
519
520
521
522
523
524
525
526
527
528
529
530
531
532
533
534
535
536
537
538
539
540
541
542
543
544
545
546
547
548
549
550
551
552
553
554
555Q3
556
557Q4
558
559
560
561
562
563
564565566567
Fig. 10. van Krevelen diagrams for NxOy-containing species observed using (a) ESI(�), (b) APCI(�), (c) APPI(�) and (d) LDI(�)FT-ICR MS.
T.M.C. Pereira et al. / Fuel xxx (2014) xxx–xxx 9
JFUE 8043 No. of Pages 10, Model 5G
29 April 2014
Generally, the most abundant compounds were found in the H/Cregion of �0.7 (Fig. 10b). APPI(�) results show a similar profileto those from the APCI(�). No NxOy compounds were detectedusing LDI(�).
For Ox classes compounds (O1, O2, O3 and O4) (Fig. 5S), theAPCI(�) provided a greater abundance of detected species, inwhich the majority compounds showed an H/C of �0.7. However,in APPI(�), the most intense compounds had an H/C of �0.5, andthe LDI(�) only accessed O2 class compounds with an H/C of�0.3. Generally, due to its chemical ionization mechanisms in thegas phase, the APCI source ionizes both highly aromatic and non-aromatic species. However, the ESI source only favors the detectionof compounds with low hydrogen deficiencies, specificallycompounds containing few aromatic rings.
4. Conclusion
Different ionization methods for asphaltene analyses were com-pared and discussed. The molecules detected through the five dif-ferent ionization sources revealed substantial differences in thecontent and in the aromaticity of the detected classes. ESI ionizesnitrogenous and highly aromatic compounds. APCI and APPIdisplayed similar ionization profile, with similar amplitudes forthe carbon number and DBE. These last two techniques ionizelow-polarity compounds, such as hydrocarbons. However, for APPIand APCI, it was observed the formation of [M+H]+ and e [M]+�,which explain the complexity of the spectra obtained. All ionsources described a portion of the real sample, but each individualsource revealed specific singularities of the sample.
LDI displayed a characteristic chemical profile. It was due to thehigh density laser plume that favored clustering reactions to formfullerene ions, especially when condensed aromatic structures arepresent. In the positive mode, ionic suppression phenomenon wasmore pronounced than in the negative one. However, in both cases,a homologous series of compounds corresponding to fullerene
Please cite this article in press as: Pereira TMC et al. FT-ICR MS analysis ofdx.doi.org/10.1016/j.fuel.2014.04.049
clusters (Cn molecules where n ranges from C44 (m/z 528.0011)to C234 (m/z 2808.0022)) were observed. The ionization usingMALDI source also induced fullerene formation from the asphal-tene sample.
This study demonstrated that APCI and APPI are able to access awide range of compound classes, DBEs and carbon number distri-butions within the evaluated ionization sources. Although the APCIand APPI results were very informative, a multidimensional analyt-ical platform, including selective separation methods, might benecessary to analyze ultra-complex samples such as crude oil orits fractions. It demonstrates that none of the available ionizationtechniques fully assesses the content of complex samples, suchas asphaltenes from crude oil.
5. Uncited reference
[38].
Acknowledgments
We acknowledge FAPEG and PETROBRAS for their financial sup-port. GV acknowledges FAPES and CAPES for fellowships. EVRCacknowledges CNPq for fellowships.
Appendix A. Supplementary material
Supplementary data associated with this article can be found, inthe online version, at http://dx.doi.org/10.1016/j.fuel.2014.04.049.
References
[1] Groenzin H, Mullins OC. Asphaltene molecular size and structure. J Phys ChemA 1999;103:11237–45.
[2] Groenzin H, Mullins OC. Molecular size and structure of asphaltenes fromvarious sources. Energy Fuels 2000;14:677–84.
asphaltenes: Asphaltenes go in, fullerenes come out. Fuel (2014), http://

568569570571572573574575576577578579580581582583584585586587588589590591592593594595596597598599600601602603604605606607608609610611612613614615616617618619620621622623624625626627628629630631632633634635636637638
639640641642643644645646647648649650651652653654655656657658659660661662663664665666667668669670671672673674675676677678679680681682683684685686687688689690691692693694695696697698699700701702703704705706707708
709
10 T.M.C. Pereira et al. / Fuel xxx (2014) xxx–xxx
JFUE 8043 No. of Pages 10, Model 5G
29 April 2014
[3] Smith DF, Klein GC, Yen AT, Squicciarini MP, Rodgers RP, Marshall AG. Crude oilpolar chemical composition derived from FT-ICR mass spectrometry accountsfor asphaltene inhibitor specificity. Energy Fuels 2008;22(5):3112–7.
[4] Panda SK, Andersson JT, Schrader W. Characterization of supercomplex crudeoil mixtures: what is really in there? Angew Chem Int Ed2009;48(10):1788–91.
[5] Mullins OC. The modified Yen model. Energy Fuels 2010;24:2179–207.[6] Panda SK, Andersson JT, Schrader W. Mass-spectrometric analysis of complex
volatile and nonvolatile crude oil components: a challenge. Anal Bioanal Chem2007;389(5):1329–39.
[7] Groenzin H, Mullins OC. Molecular size and structure of asphaltenes. Pet SciTechnol 2001;19(1–2):219–30.
[8] Beens J, Brinkman UAT. The role of gas chromatography in compositionalanalyses in the petroleum industry. Trends Anal Chem 2000;19(4):260–75.
[9] Klein GC, Kim S, Rodgers RP, Marshall AG. Mass spectral analysis ofasphaltenes. II. Detailed compositional comparison of asphaltenes deposit toits crude oil counterpart for two geographically different crude oils byelectrospray ionization fourier transform ion cyclotron resonance massspectrometry. Energy Fuels 2006;20(5):1965–72.
[10] Hsu CS, Hendrickson CL, Rodgers RP, McKenna AM, Marshall AG. Petroleomics:advanced molecular probe for petroleum heavy ends. J Mass Spectrom2011;46(4):337–43.
[11] Savory JJ, Kaiser NK, McKenna AM, Xian F, Blakney GT, Rodgers RP, et al. Parts-per-billion Fourier transform ion cyclotron resonance mass measurementaccuracy with a ‘walking’ calibration equation. Anal Chem 2011;83(5):1732–6.
[12] Cunico RL, Sheu EY, Mullins OC. Molecular weight measurement of UG8asphaltene using APCI mass spectroscopy. Pet Sci Technol 2004;22(7-8):787–98.
[13] Purcell JM, Merdrignac I, Rodgers RP, Marshall AG, Gauthier T, Guibard I.Stepwise structural characterization of asphaltenes during deephydroconversion processes determined by atmospheric pressurephotoionization (APPI) fourier transform ion cyclotron fesonance (FT-ICR)mass spectrometry. Energy Fuels 2010;24:2257–65.
[14] Benassi M, Berisha A, Romão W, Babayev E, Rompp A, Spengler B. Petroleumcrude oil analysis using low-temperature plasma mass spectrometry. RapidCommun Mass Spectrom 2013;27:825–34.
[15] McKenna AM, Purcell JM, Rodgers RP, Marshall AG. Identification of vanadylporphyrins in a heavy crude oil and raw asphaltene by atmospheric pressurephotoionization FT-ICR mass spectrometry. Energy Fuels 2009;23:2122–8.
[16] Purcell JM, Rodgers RP, Hendrickson CL, Marshall AG. Speciation of nitrogencontaining aromatics by atmospheric pressure photoionization fouriertransform ion cyclotron resonance mass spectrometry for complex mixtureanalysis. Anal Chem 2006;78(16):5906–12.
[17] Panda SK, Brockmann K-J, Benter T, Schrader W. Atmospheric pressure laserionization (APLI) coupled with Fourier transform ion cyclotron resonance massspectrometry applied to petroleum samples analysis: comparison withelectrospray ionization and atmospheric pressure photoionization methods.Rapid Commun Mass Spectrom 2011;25(16):2317–26.
[18] Purcell JM, Hendrickson CL, Rodgers RP, Marshall AG. Atmospheric pressurephotoionization proton transfer for complex organic mixtures investigated byfourier transform ion cyclotron resonance mass spectrometry. J Am Soc MassSpectrom 2007;18(9):1682–9.
[19] Borton D, Pinkston D, Hurt M, Tan X, Azyat K, Scherer A, et al. Molecularstructures of asphaltenes based on the dissociation reactions of their ions inmass spectrometry. Energy Fuels 2010;24:5548–59.
[20] Sabbah H, Morrow AL, Pomerantz AE, Zare RN. Evidence for island structuresas the dominant architecture of asphaltenes. Energy Fuels 2011;25:1597–604.
[21] Qian K, Mennito AS, Edwards KE, Ferrughelli DT. Observation of vanadylporphyrins and sulfur-containing vanadyl porphyrins in a petroleumasphaltene by atmospheric pressure photonionization Fourier transform ioncyclotron resonance mass spectrometry. Rapid Commun Mass Spectrom2008;22(14):2153–60.
[22] Cho Y, Witt M, Kim YH, Kim S. Characterization of crude oils at the molecularlevel by use of laser desorption ionization fourier-transform ion cyclotronresonance mass spectrometry. Anal Chem 2012;84(20):8587–94.
[23] Pomerantz AE, Hammond MR, Morrow AL, Mullins OC, Zare RN. Two-step lasermass spectrometry of asphaltenes. J Am Chem Soc 2008;130:7216–7.
[24] Cho Y, Jin JM, Witt M, Birdwell JE, Na J, Roh N, et al. Comparing laser desorptionionization and atmospheric pressure photoionization coupled to fouriertransform ion cyclotron resonance mass spectrometry to characterize shaleoils at the molecular level. Energy Fuels 2013;27:1830–7.
Please cite this article in press as: Pereira TMC et al. FT-ICR MS analysis ofdx.doi.org/10.1016/j.fuel.2014.04.049
[25] Wu Q, Pomerantz AE, Mullins OC, Zare RN. Minimization of fragmentation andaggregation by laser desorption laser ionization mass spectrometry. J Am SocMass Spectrom 2013;24:1116–22.
[26] Kozlovski VI, Donald LJ, Collado VM, Spicer V, Loboda AV, Chernushevich IV,et al. A TOF mass spectrometer for the study of noncovalent complexes. Int JMass Spectrom 2011;308:18–125.
[27] Tanaka R, Sato S, Takanohashi T, Hunt JE, Winans RE. Analysis of the molecularweight distribution of petroleum asphaltenes using laser desorption-massspectrometry. Energy Fuels 2004;18(5):1405–13.
[28] ASTM D1298–99 Standard test method for API degree; 2005.[29] ASTM D664–09 Standard test method for acid number of petroleum products
by potentiometric titration.[30] ASTM D7042–04 Standard test method for dynamic viscosity and density of
liquids by Stabinger viscometer (and the calculation of kinematic viscosity);2004.
[31] ASTM D4294–10 Standard test method for sulfur in petroleum and petroleumproducts by energy dispersive X-ray fluorescence spectrometry; 2000.
[32] ASTM D6560–00 Standard test method for determination of asphaltenes(Heptane insolubles) in crude petroleum and petroleum products; 2005.
[33] Colati KAP, Dalmaschio GP, de Castro EVR, Gomes AO, Vaz BG, Romão W.Monitoring the liquid/liquid extraction of naphthenic acids in brazilian crudeoil using electrospray ionization FT-ICR mass spectrometry (ESI FT-ICR MS).Fuel 2013;108:647–55.
[34] Freitas S, Malacarne MM, Romão W, Dalmaschio GP, Castro EVR, Celante VG,et al. Analysis of the heavy oil distillation cuts corrosion by electrosprayionization FT-ICR mass spectrometry, electrochemical impedancespectroscopy, and scanning electron microscopy. Fuel 2013;104:656–63.
[35] Dalmaschio GP, Malacarne MM, de Almeida VMDL, Pereira TMC, Gomes AO, deCastro EVR, et al. Characterization of polar compounds in a true boiling pointdistillation system using electrospray ionization FT-ICR mass spectrometry.Fuel 2013. in press.
[36] Gao J, Owen BC, Borton DJ, Jin Z. HPLC/APCI mass spectrometry of saturatedand unsaturated hydrocarbons by using hydrocarbon solvents as the APCIreagent and HPLC mobile phase. J Am Soc Mass Spectrom 2012;23(5):816–22.
[37] Owen BC, Gao J, Borton DJ, Amundson LM, Archibold EF, Tan X, et al. Carbondisulfide reagent allows the characterization of nonpolar analytes byatmospheric pressure chemical ionization mass spectrometry. RapidCommun Mass Spectrom 2011;25(14):1924–8. 30.
[38] Qian K, Edwards KE, Mennito AS, Walters CC, Kushnerick JD. Enrichment,resolution, and identification of nickel porphyrins in petroleum asphaltene bycyclograph separation and atmospheric pressure photoionization fouriertransform ion cyclotron resonance mass spectrometry. Anal Chem2010;82(1):413–9.
[39] Gaspar A, Zellermann E, Labalid S, Reece J, Schrader W. Impact of differentionization methods on the molecular assignments of asphaltenes by FT-ICRmass spectrometry. Anal Chem 2012;84:5257–67.
[40] Tachon N, Jahouh F, Delmas M, Banou JH. Structural determination byatmospheric pressure photoionization tandem mass spectrometry of somecompounds isolated from the SARA fractions obtained from bitumen. RapidCommun Mass Spectrom 2011;25:2657–71.
[41] Cho Y, Na J-G, Nho N-S, Kim S, Kim S. Application of saturates, aromatics,resins, and asphaltenes crude oil fractionation for detailed chemicalcharacterization of heavy crude oils by Fourier transform ion cyclotronresonance mass spectrometry equipped with atmospheric pressurephotoionization. Energy Fuels 2012;26:2558–65.
[42] Apicella B, Alfe M, Amoresano A, Galano E, Ciajolo A. Advantages andlimitations of laser desorption/ionization mass spectrometric techniques inthe chemical characterization of complex carbonaceous materials. Int J MassSpectrom 2010;295:98–102.
[43] Hammond MR, Zare RN. Identifying the source of a strong fullerene envelopearising from laser desorption mass spectrometric analysis of meteoriticinsoluble organic matter. Geochim. Cosmochim. Acta 2008;72:5521–9.
[44] Hortal AR, Hurtado P, Martinez-Haya BM, Mullins OC. Molecular-weightdistributions of coal and petroleum asphaltenes from laser desorption/ionization experiments. Energy Fuels 2007;27:2863–8.
[45] Zare RN, Hahn JH, Zenobi R. Mass-spectrometry of molecular adsorbates usingdesorption laser multiphoton ionization. Bull Chem Soc Jpn 1988;61:87–92.
[46] Kim S, Kramer RW, Hatcher PG. Graphical method for analysis of ultrahigh-resolution broadband mass spectra of natural organic matter, the van Krevelendiagram. Anal Chem 2003;75(20):5336–44.
asphaltenes: Asphaltenes go in, fullerenes come out. Fuel (2014), http://


![00018892[2] asphaltenes](https://static.fdocuments.us/doc/165x107/546a85ccb4af9f59788b4746/000188922-asphaltenes.jpg)


