FT 3Q09 VA VDEF - orange.com · forex perimeter-1,138 9m08 actual ... traffic evolution, while...
31
3Q09 results October 29 th , 2009 France Telecom
Transcript of FT 3Q09 VA VDEF - orange.com · forex perimeter-1,138 9m08 actual ... traffic evolution, while...

3Q09 results
October 29th, 2009
France Telecom
2
cautionary statement
this presentation contains forward-looking statements about France Telecom’s business, in particular for 2009. Although France Telecom believes these statements are based on reasonable assumptions, these forward-looking statements are subject to numerous risks and uncertainties, including matters not yet known to us or not currently considered material by us, and there can be no assurance that anticipated events will occur or that the objectives set out will actually be achieved. Important factors that could cause actual results to differ materially from the results anticipated in the forward-looking statements include, among others, overall trends in the economy in general and in France Telecom’s markets, the effectiveness of the integrated operator strategy including the success and market acceptance of the Orange brand and other strategic, operating and financial initiatives, France Telecom’s ability to adapt to the ongoing transformation of the telecommunications industry, regulatory developments and constraints, as well as the outcome of legal proceedings and the risks and uncertainties related to international operations and exchange rate fluctuations.
more detailed information on the potential risks that could affect France Telecom's financial results can be found in the Registration Document filed with the French Autorité des Marchés Financiers and in the Form 20-F filed with the U.S. Securities and Exchange Commission. Except to the extent required by law, France Telecom does not undertake any obligation to update forward-looking statements.

3
3Q09 highlights
4
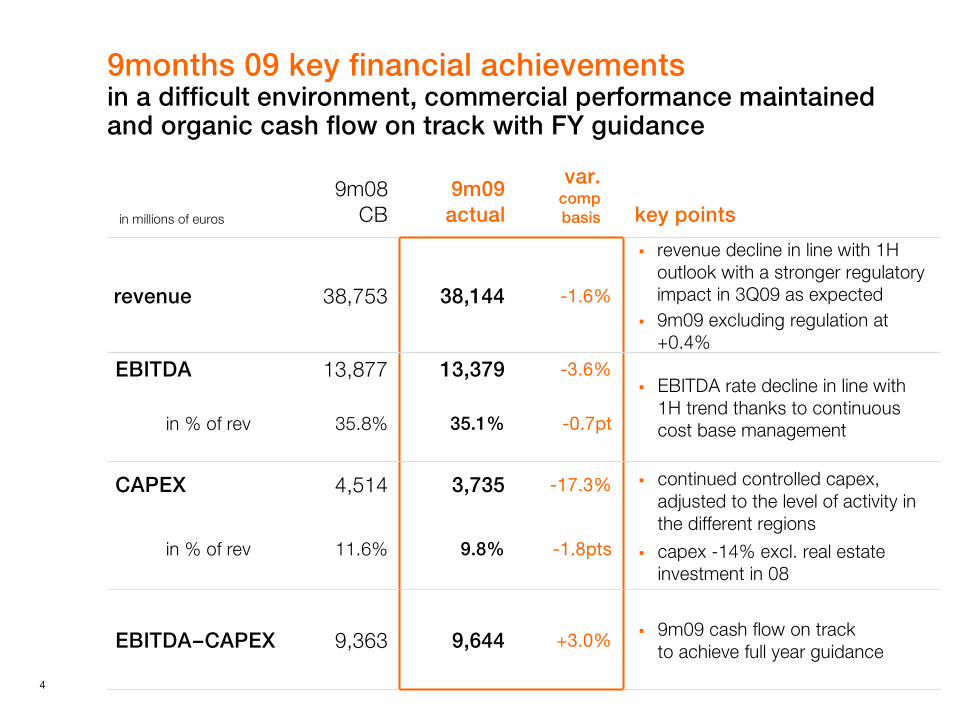
in millions of euros
9m08CB
9m09 actual
var.compbasis key points
revenue 38,753 38,144 -1.6%
revenue decline in line with 1H outlook with a stronger regulatory impact in 3Q09 as expected 9m09 excluding regulation at +0.4%
EBITDA 13,877 13,379 -3.6%EBITDA rate decline in line with 1H trend thanks to continuous cost base managementin % of rev 35.8% 35.1% -0.7pt
CAPEX 4,514 3,735 -17.3% continued controlled capex, adjusted to the level of activity in the different regions
capex -14% excl. real estate investment in 08
in % of rev 11.6% 9.8% -1.8pts
EBITDA–CAPEX 9,363 9,644 +3.0%9m09 cash flow on trackto achieve full year guidance
9months 09 key financial achievements in a difficult environment, commercial performance maintainedand organic cash flow on track with FY guidance
5
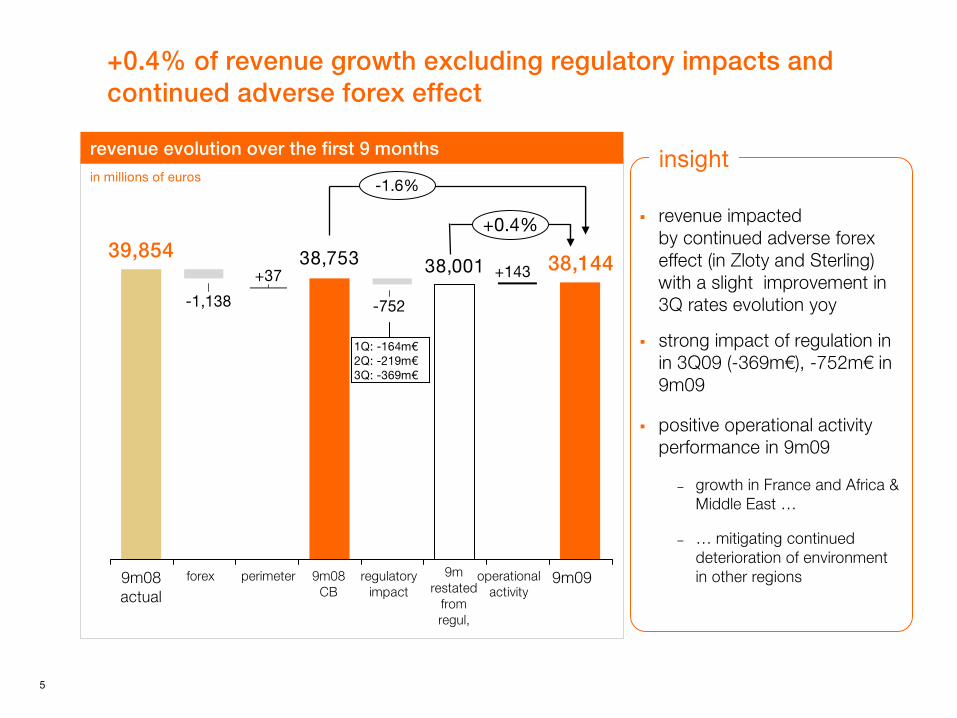
+0.4% of revenue growth excluding regulatory impacts andcontinued adverse forex effect
revenue evolution over the first 9 months
39,854 38,753 38,001 38,144
+0.4%
9m099m restated
from regul,
+143
operational activity
9m08CB
-752
+37
regulatory impact
forex perimeter
-1,138
9m08 actual
revenue impactedby continued adverse forexeffect (in Zloty and Sterling) with a slight improvement in 3Q rates evolution yoy
strong impact of regulation in in 3Q09 (-369m€), -752m€ in 9m09
positive operational activity performance in 9m09
– growth in France and Africa & Middle East …
– … mitigating continued deterioration of environmentin other regions
insight
1Q: -164m€2Q: -219m€3Q: -369m€
-1.6%in millions of euros
6
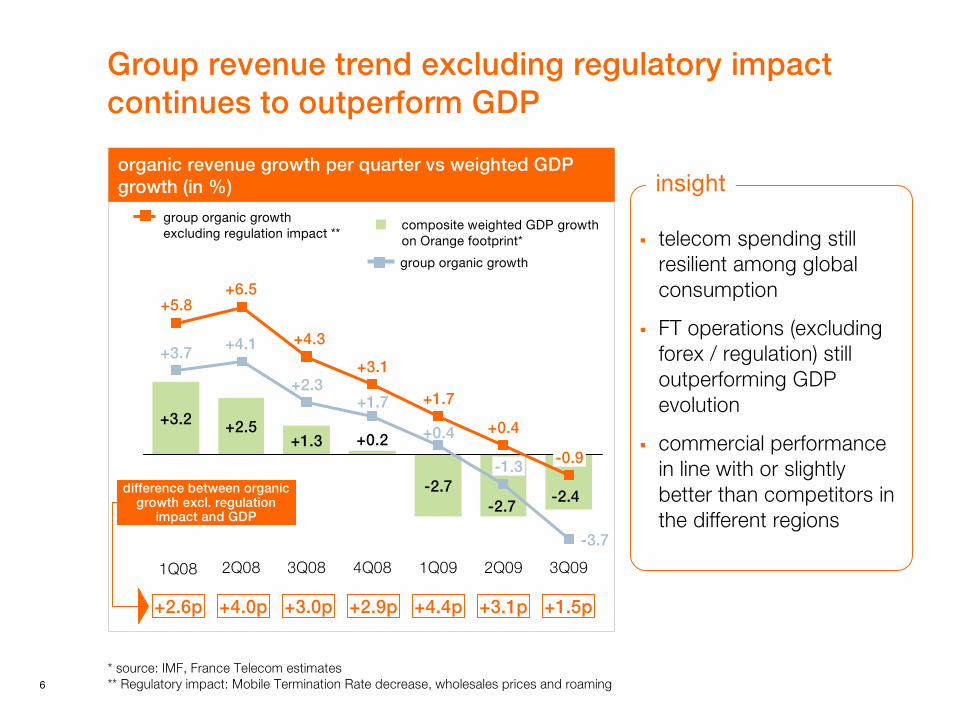
Group revenue trend excluding regulatory impact continues to outperform GDP
2,3%
3Q09
-3.7
-0.9
2Q09
-1.3
+0.4
1Q09
-2.7
+0.4
+1.7
4Q08
+0.2
+1.7
+3.1
3Q08
+1.3
+2.3
+4.3
2Q08
+2.5
+4.1
+6.5
+3.2
+3.7
+5.8
1Q08
* source: IMF, France Telecom estimates** Regulatory impact: Mobile Termination Rate decrease, wholesales prices and roaming
composite weighted GDP growthon Orange footprint*
group organic growthexcluding regulation impact **
group organic growth
organic revenue growth per quarter vs weighted GDP growth (in %)
-2.7-2.4
telecom spending still resilient among global consumption
FT operations (excluding forex / regulation) still outperforming GDP evolution
commercial performancein line with or slightly better than competitors in the different regions
difference between organic growth excl. regulation
impact and GDP
+2.6p +4.0p +3.0p +2.9p +4.4p +3.1p +1.5p
insight

7
resilience of the French operations and pressurein other European markets and Enterprise
France
UK
Spain
Poland
ROW
Enterprise
1Q09 2Q09 3Q09key messages
-5.0%
+1.1%
-2.4%
-0.2%
-4.3%
+4.8%
-5.0%
-2.6%
+1.7%
-0.5%
-1.4%
-1.8%
+7.0%
-3.8%
-1.0%
+3.0%
+0.3%
-0.6%
-1.0%
+4.5%
+0.4%
European markets impacted by a more tense competition and the economic environment
Africa & Middle East continued to grow
Poland highly impacted by price war in prepaid market and fixed to mobile substitution
slight improvement of Spanish telecom market, Orange still outperforming competitors for the 6th consecutive quarter
UK market more impacted in 3Q09 by consumption slowdown with lower out of bundle usage
delayed impact of recession on corporates, but Enterprise segment still outperforming competitors
French operations continued to be resilient with strong mobile dynamic and stable fixed trend
organic revenue growth excluding regulatory impact (yoy in %)
OtherEuropean
Africa & Middle East

8
Spain
Poland
ROW
operational KPIs point to sustained Orange commercial performance
51.7
28.5**
-23.2pt79
97
+22.8%
67.5%3Q08
69.3%3Q09
+1.8 pts
38.0%3Q08
41.2%3Q09
+3.2 pts
29.2
30.6
+4.7%
41.0%
47.2%
+6.2 pts
homequarterly ADSL ARPU (€)
57
283
x5
56.2%3Q08
56.1%3Q09
-0.1 ptpersonalshareof contract customers (%)
42.4%3Q08
47.4%3Q09
+5.0 ptspersonalshare of contract customers (%)
52,33Q08
62,43Q09
+19%personalsubscriber base, incl. MVNO (m)
homeADSL customer base (k)
199
301
+52%
Francehomeshare of ADSL net adds (%)
personalannual rolling data ARPU (€)
personalshareof contract customers (%)
UKhomeshare of base on ULL (%)
personalshareof contract customers (%)
homeiPTV & sat cust. base (k)
key operational KPIs for Orange main operations* areas of concern
273
261 -4%
personalblendedARPU (£)
271
295
-8%
personalblendedARPU (€)
588
551 -6%
personalblendedARPU (PLN)
homecopper & FTTH lines (m)
1,79
2,26
+26%
* ARPU incl. regul., ** company estimates
9
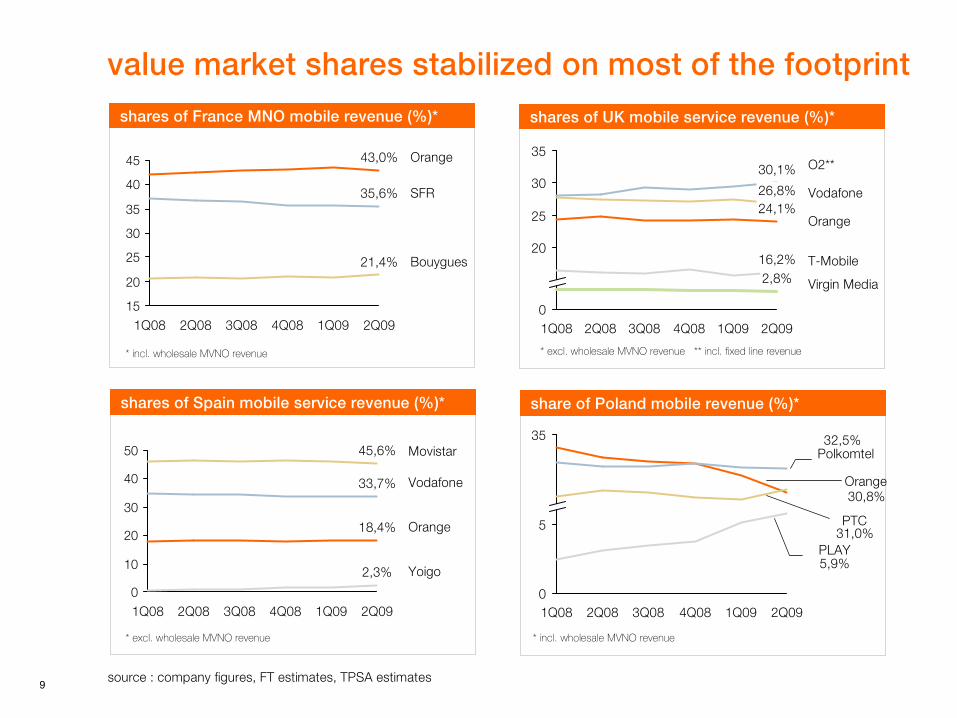
value market shares stabilized on most of the footprintshares of France MNO mobile revenue (%)* shares of UK mobile service revenue (%)*
shares of Spain mobile service revenue (%)* share of Poland mobile revenue (%)*
15
20
25
30
35
40
45
Bouygues
SFR
Orange
2Q09
21,4%
35,6%
43,0%
1Q094Q083Q082Q081Q08
35
30
25
20
0
Virgin Media
T-Mobile
Vodafone
O2**
Orange
2Q09
2,8%16,2%
26,8%
30,1%
24,1%
1Q094Q083Q082Q081Q08
source : company figures, FT estimates, TPSA estimates
0
10
20
30
40
50
Yoigo
Movistar
Vodafone
Orange
2Q09
2,3%
45,6%
33,7%
18,4%
1Q094Q083Q082Q081Q08
5
35
0
PLAY
PTC
Polkomtel
Orange
2Q09
5,9%
31,0%
32,5%
30,8%
1Q094Q083Q081Q08 2Q08
* incl. wholesale MVNO revenue * excl. wholesale MVNO revenue ** incl. fixed line revenue
* excl. wholesale MVNO revenue * incl. wholesale MVNO revenue
10
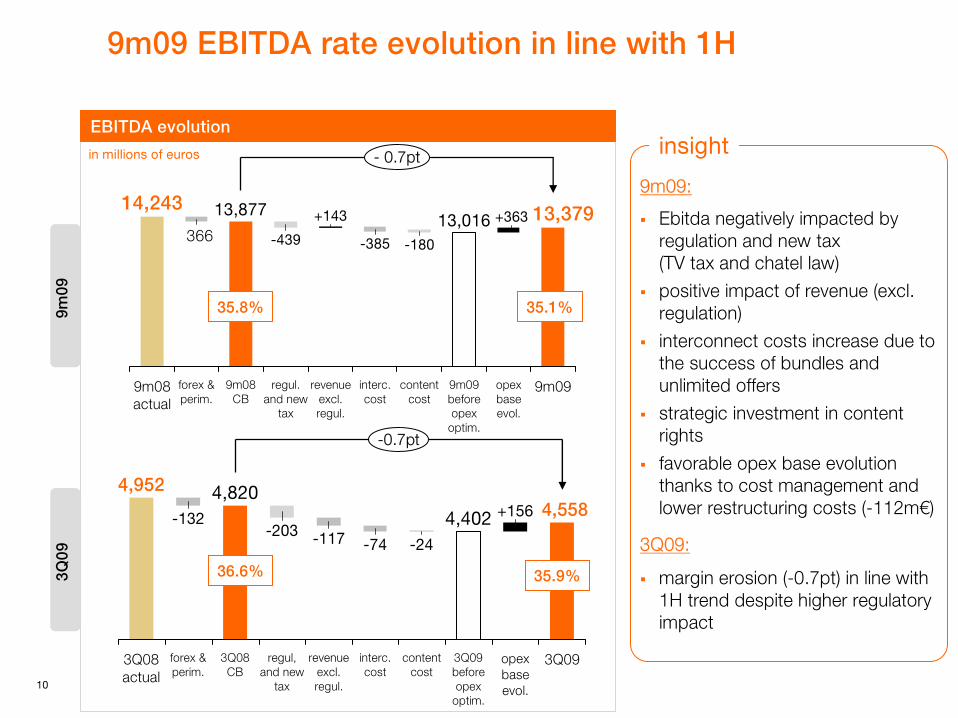
9m09 EBITDA rate evolution in line with 1H
36613,016
9m09 before opex
optim.
+363
opexbase evol.
13,379
9m09
- 0.7pt
13,877
9m08 CB
-439
regul. and new
tax
+143
revenue excl. regul.
-385
interc. cost
-180
14,243
9m08 actual
forex & perim.
content cost
9m09:
Ebitda negatively impacted by regulation and new tax(TV tax and chatel law)
positive impact of revenue (excl. regulation)
interconnect costs increase due to the success of bundles and unlimited offers
strategic investment in content rights
favorable opex base evolution thanks to cost management and lower restructuring costs (-112m€)
3Q09:
margin erosion (-0.7pt) in line with 1H trend despite higher regulatory impact
EBITDA evolution
in millions of euros
35.1%
insight
4,952
-0.7pt
3Q08 actual
-132
forex & perim.
4,820
3Q08CB
-203
regul, and new
tax
-117
revenueexcl. regul.
-74
interc. cost
-24
content cost
4,402
3Q09 before opex
optim.
+156
opexbase evol.
4,558
3Q09
9m09
3Q
09
35.8%
36.6% 35.9%

11
labour cost up due to one-off in September 08 (-32m€)
regulatory price decrease (+€442m) balanced the development of unlimited off-net offers
contingency plan on trackTV tax and Chatel law impact (-129m€)lower restructuring in France & ICSS (-87m€), end of restructuring in Spain (-37m€)
efficient management of life time value commercial expenses full effect in 3Q09 of content investmentsin cinema rights (-24m€)
o/w profit sharing & sharebase payments
(6,561)16.9%
interconnection(5,707)14.7%
9m09in m€ & % of revenues 9m08 CB
19,24350.4%
EBITDA pre com. & content 19,77951.0%
(6,605)17.3%
(278) (262)
(5,650)14.8%
other IT&N(2,108)
5.4%(2,116)
5.5%
(4,598)11.9%
(4,530)11.9%
o/w restructuringo/w disposal of assets and assoc.
commercial expenses & contentcosts
(5,902)15.2%
(5,864)15.4%
13,37935.1%
EBITDA 13,87735.8%
(258) (146)
dynamic cost allocation to preserve Ebitda and optimize market shares
general, properties, and others
labour costs
9m09 EBITDA decrease mainly due to global regulatory* impact of - 439m€
38,753 38,144revenueregulatory impact of -752m€ over 9 monthsand -369m€ in 3Q
increasing cost of new operationsin emerging marketscontinued pressure from higher energy prices in UK, Poland
* including MTR, roaming & wholesale price cuts, TV tax and Chatel law
6 (2)
12
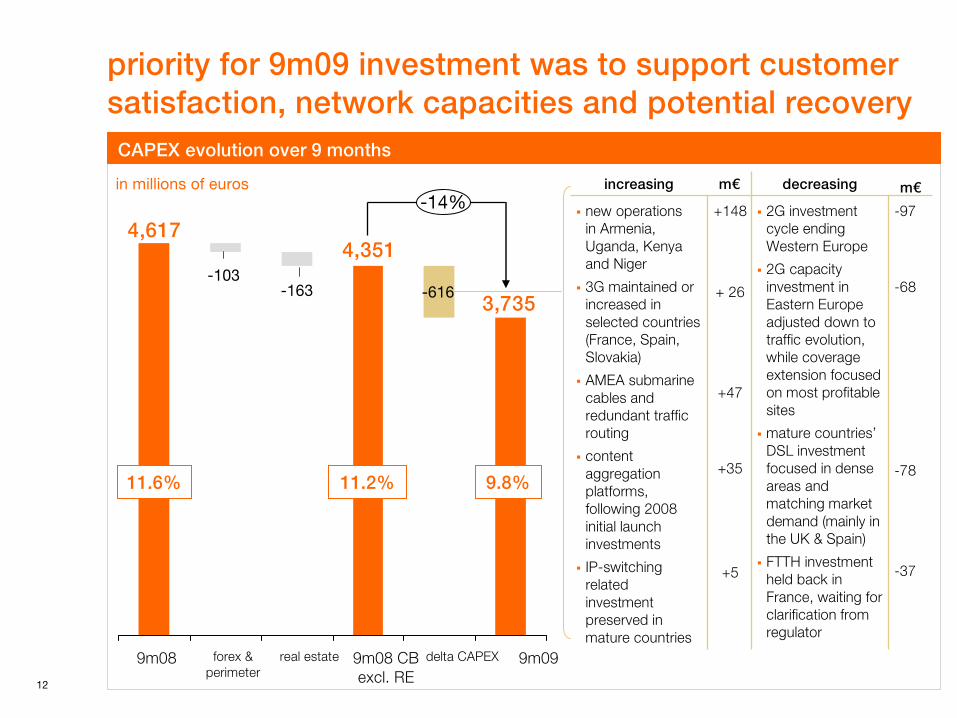
3,735
4,3514,617
-14%
9m09delta CAPEX
-616
9m08 CB excl. RE
real estate
-163
forex & perimeter
-103
9m08
CAPEX evolution over 9 months
-97
-68
-78
-37
m€
+148
+ 26
+47
+35
+5
m€
2G investment cycle ending Western Europe
2G capacity investment in Eastern Europe adjusted down to traffic evolution, while coverage extension focused on most profitable sites
mature countries’DSL investment focused in dense areas and matching market demand (mainly in the UK & Spain)
FTTH investment held back in France, waiting for clarification from regulator
new operationsin Armenia, Uganda, Kenya and Niger
3G maintained or increased in selected countries (France, Spain, Slovakia)
AMEA submarine cables and redundant traffic routing
content aggregation platforms, following 2008 initial launch investments
IP-switching related investment preserved in mature countries
decreasingincreasing
priority for 9m09 investment was to support customer satisfaction, network capacities and potential recovery
9.8%11.2%11.6%
in millions of euros

3Q09 business performance

14
3Q09 revenue evolution in line with 1H excluding regulation
– total France revenue: +1.1%*– personal revenue: +4.1%*– home revenue: stable*
personal revenue growth driven by customer base and non voice compensating for regulation and voice decline stable home revenue excluding regulationin a changing market dynamic
– lower broadband growth – stabilization of PSTN decline
FTTH: clarification in progress
insight
-1.2%
-0.7%
-1.2%
varin CB
-1.4%
+3.9%
+0.6%17,7205,880total France
in m€ 3Q09 9m09 varin CB
personal 2,680 8,053
home 3,496 10,569
eliminations -296 -902
9m09 France revenue*: +0.6% (+1.9% excl. regulatory impacts)
9m09
8,053
equipment& others
+46
non voice
+317
voice
-172
regulatoryimpact
-138
customerbase
+253
9m08 CB
7,747
in m€
9m09
10,569
wholesale& other
-101
internet
+391
PSTN
-435
9m08 CB
10,714
in m€
9m09 mobile revenue*: +3.9% (+5.8% excl. regulatory impacts)
9m09 home revenue*:-1.4% (–0.2% excl. regulatory impacts)
3Q09 France financials positive revenue trend excluding regulation, in line with 1H09
* yoy on CB

15
stable market share with 25% of MVNO customer base increase yoy at 2.1m at the end of September
better customer mix thanks to origami & iPhone– +233k contract net additions in 3Q09
non voice revenues: 26.2% of service revenues in 3Q09 driven by multimedia (mail, TV, music):– 6.9m mobile 3G customers (+64% yoy)
– 1.3m iPhone sold (+212k in 3Q vs +211k in 1Q)
– data ARPU growth offset voice ARPU decline
3Q09 France personalstable market share including MVNOs
insight
Orange market share evolution*
46.7%
43.6%
3Q08
46.9%
43.6%
4Q08
46.6%
43.3%
1Q09
46.6%
43.1%
2Q09
46.6%
42.9%
3Q09
market share excl MVNOmarket share incl MVNO
16,557
7,967
24,524
3Q08
17,560
7,794
25,354
3Q09
contract
prepaid
+3.4%
mobile customer base mix
+6%
31%33%
69%67%
* company estimates
annual rolling ARPU evolution
in thousands
en euros
301
4139
318
399
3Q 08 CB
5048
398
3Q09
data
sms
voice
stable and+ 1,3 % excl. regul.
+20%
+24%

16
stabilization of FT line losses
124k new ADSL customers in 3Q09 to 8.8m– new DSL offer “Surf” (€29.90/m) with TV over PC – dual and triple play 60€ repayment offer– limited promotion on “Net” offer (€34.90/m)
launched in October
quarterly broadband ARPU +5% yoy at €35.1:– IPTV base at 2.5m (x1.6 yoy) boosted by TV Sat & contents:
− success of pay TV packages with promotions− 2.1m paid of transactional VOD in 3Q09 (+71%)
3Q09 France home broadband ARPU continues to grow in a maturing market
insight
ADSL conquest share ADSL market share
49.4%
46.7%
4Q08
49.2%
42.8%
1Q09
48.7%
26.0%*
2Q09
48.3%*
28.5%*
3Q09
49.5%
51.7%
3Q08
ADSL market share & conquest share
nb: ARCEP figures for 2Q09 : 30.4%, * FT estimates
23,0 22,0 21,8 21,0
dec-08sept.-08dec-07
FT retail lines
wholesale lines
28,528,25,2 6,5 8,1
29,1
sept.-09
7,028,8
-1.0m -0.8m
+1.3m +1.2m
fixed line mass market
full ULLWLRnaked ADSL
950175190
1,0486954
9m08 9m09
total 1,315 1,171
wholesale net adds
pay TV subscriptions
819
48
711
759
3Q08
596
1,415
3Q09
Orange Sport & Cinema Series
other Orange & 3rd party packages
X 12
in thousands

17
already agreed measures review of working conditions:
– no reorganisation up to end of dec09– +380 headcounts (among short-term contracts &
apprentices in priority)– in sourcing for an equivalent of 1,000 employees
ongoing negotiations
ongoing negotiations on psychological risks (5 chapters: to review working conditions, rebuild a positive working environment, manpower planning, professional and private balance, communication improvement with employee’s representatives)
ongoing negotiations on part-time work for seniors
towards a new “social contract”*
* concerns all employess of France Télécom and French subsidiaries
18
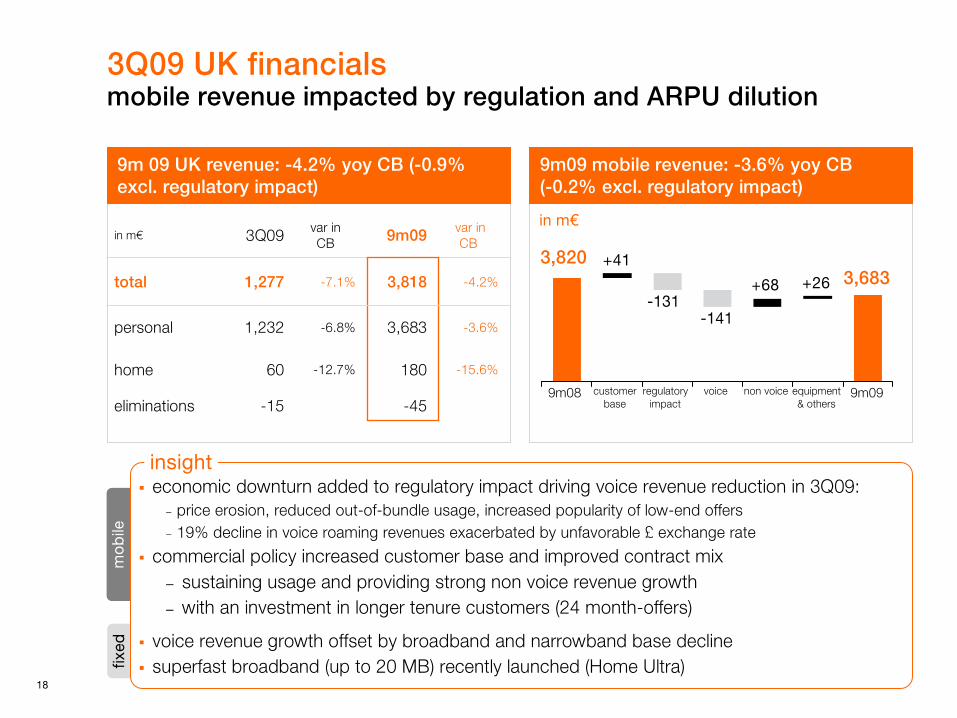
3Q09 UK financials mobile revenue impacted by regulation and ARPU dilution
+26 +68
+41
fixed
mob
ile
economic downturn added to regulatory impact driving voice revenue reduction in 3Q09:– price erosion, reduced out-of-bundle usage, increased popularity of low-end offers– 19% decline in voice roaming revenues exacerbated by unfavorable £ exchange rate
commercial policy increased customer base and improved contract mix– sustaining usage and providing strong non voice revenue growth – with an investment in longer tenure customers (24 month-offers)
voice revenue growth offset by broadband and narrowband base declinesuperfast broadband (up to 20 MB) recently launched (Home Ultra)
in millions of euros
insight
9m 09 UK revenue: -4.2% yoy CB (-0.9% excl. regulatory impact)
9m08 customer base
equipment & others
regulatory impact
voice 9m09non voice
9m09 mobile revenue: -3.6% yoy CB(-0.2% excl. regulatory impact)
in m€
3,8203,683
-131-141
-12.7%
-6.8%
-7.1%
var inCB
-15.6%
-3.6%
-4.2%3,8181,277total
in m€ 3Q09 9m09 var inCB
personal 1,232 3,683
home 60 180
eliminations -15 -45
19
mob
ile
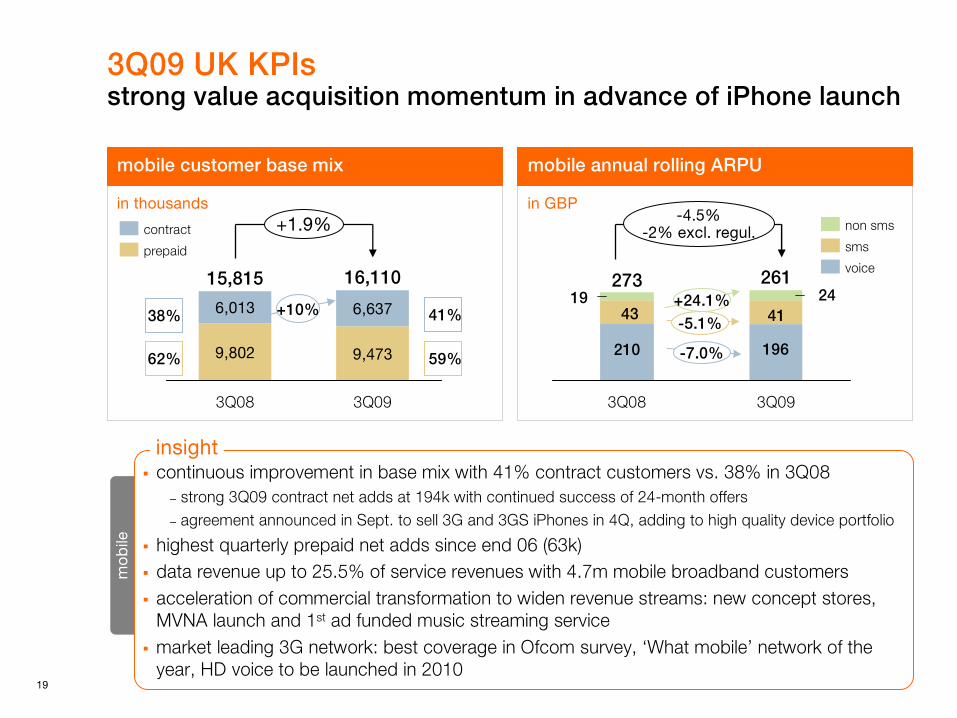
continuous improvement in base mix with 41% contract customers vs. 38% in 3Q08– strong 3Q09 contract net adds at 194k with continued success of 24-month offers– agreement announced in Sept. to sell 3G and 3GS iPhones in 4Q, adding to high quality device portfolio
highest quarterly prepaid net adds since end 06 (63k)data revenue up to 25.5% of service revenues with 4.7m mobile broadband customers acceleration of commercial transformation to widen revenue streams: new concept stores, MVNA launch and 1st ad funded music streaming servicemarket leading 3G network: best coverage in Ofcom survey, ‘What mobile’ network of the year, HD voice to be launched in 2010
3Q09 UK KPIsstrong value acquisition momentum in advance of iPhone launch
insight
6,013
9,802
15,815
3Q08
6,637
9,473
16,110
3Q09
contract
prepaid
+1.9%
mobile annual rolling ARPU
273
3Q08
261
3Q09
non sms
sms
voice
-4.5%-2% excl. regul.
mobile customer base mix
+10%
59%62%
41%38%
210 196
1943 41
24
-7.0%
-5.1%+24.1%
in GBPin thousands
20
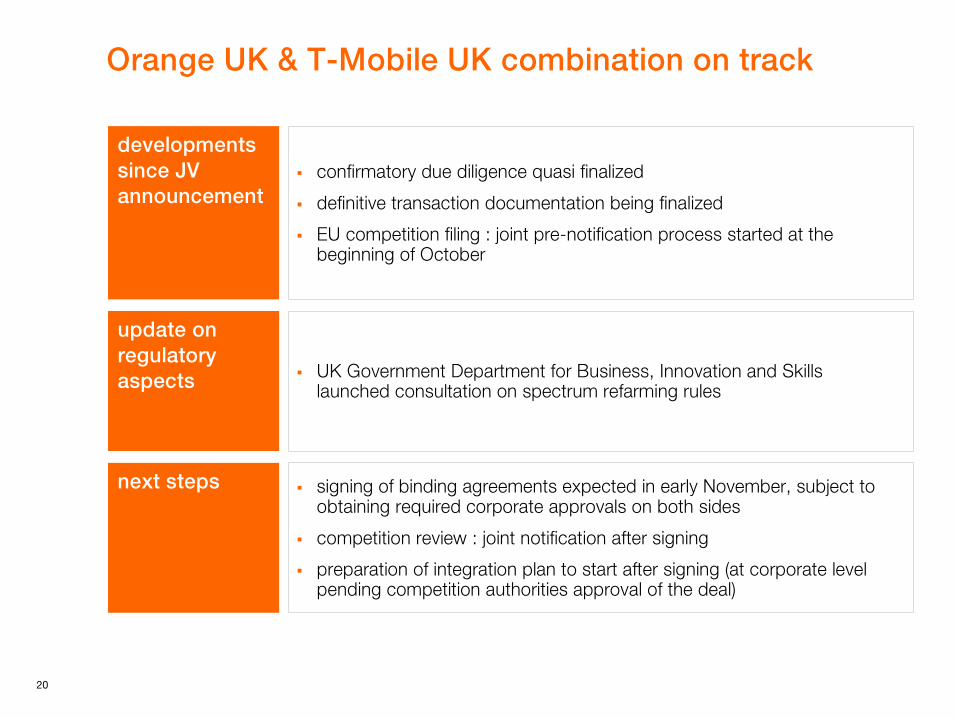
Orange UK & T-Mobile UK combination on track
developments since JV announcement
confirmatory due diligence quasi finalized
definitive transaction documentation being finalized
EU competition filing : joint pre-notification process started at the beginning of October
update on regulatory aspects UK Government Department for Business, Innovation and Skills
launched consultation on spectrum refarming rules
next steps signing of binding agreements expected in early November, subject to obtaining required corporate approvals on both sides
competition review : joint notification after signing
preparation of integration plan to start after signing (at corporate level pending competition authorities approval of the deal)
21
fixed
mob
ile
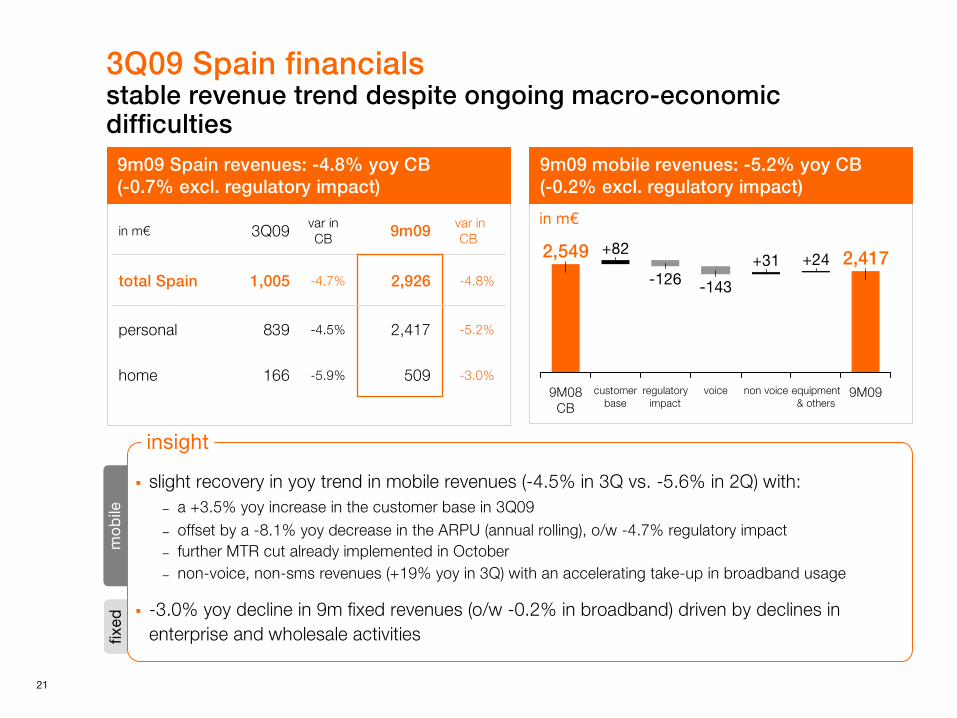
slight recovery in yoy trend in mobile revenues (-4.5% in 3Q vs. -5.6% in 2Q) with:– a +3.5% yoy increase in the customer base in 3Q09 – offset by a -8.1% yoy decrease in the ARPU (annual rolling), o/w -4.7% regulatory impact– further MTR cut already implemented in October– non-voice, non-sms revenues (+19% yoy in 3Q) with an accelerating take-up in broadband usage
-3.0% yoy decline in 9m fixed revenues (o/w -0.2% in broadband) driven by declines in enterprise and wholesale activities
in millions of euros
3Q09 Spain financials stable revenue trend despite ongoing macro-economic difficulties
insight
9m09 Spain revenues: -4.8% yoy CB(-0.7% excl. regulatory impact)
9M09
2,417
equipment & others
+24
non voice
+31
voice
-143
regulatory impact
-126
customer base
+82
9M08 CB
2,549
9m09 mobile revenues: -5.2% yoy CB(-0.2% excl. regulatory impact)
in m€
-5.9%
-4.5%
-4.7%
var in CB
-3.0%
-5.2%
-4.8%2,9261,005total Spain
in m€ 3Q09 9m09 var in CB
personal 839 2,417
home 166 509
22
fixed
mob
ile
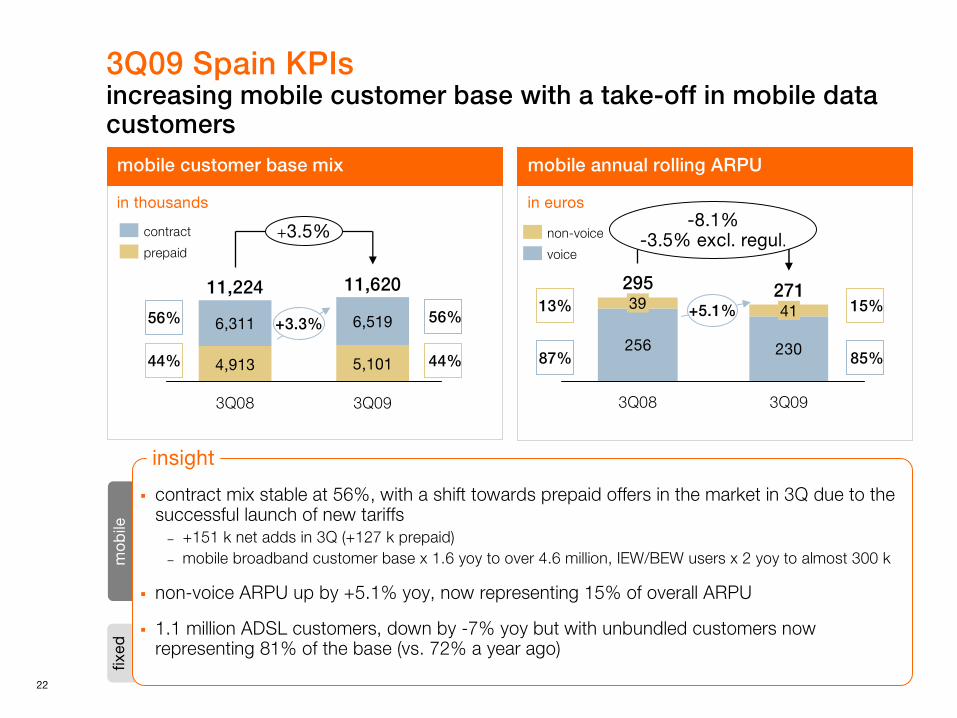
contract mix stable at 56%, with a shift towards prepaid offers in the market in 3Q due to the successful launch of new tariffs – +151 k net adds in 3Q (+127 k prepaid)– mobile broadband customer base x 1.6 yoy to over 4.6 million, IEW/BEW users x 2 yoy to almost 300 k
non-voice ARPU up by +5.1% yoy, now representing 15% of overall ARPU
1.1 million ADSL customers, down by -7% yoy but with unbundled customers now representing 81% of the base (vs. 72% a year ago)
3Q09 Spain KPIsincreasing mobile customer base with a take-off in mobile data customers
insight
+3.5%
3Q09
11,620
5,101
6,519
3Q08
11,224
4,913
6,311
prepaid
contract
mobile annual rolling ARPUmobile customer base mix
+3.3%
44%44%
56%56%15%
85%
13%
87%256 230
-8.1%-3.5% excl. regul.
3Q09
27141
3Q08
29539
voice
non-voice
+5.1%
in thousands in euros
23
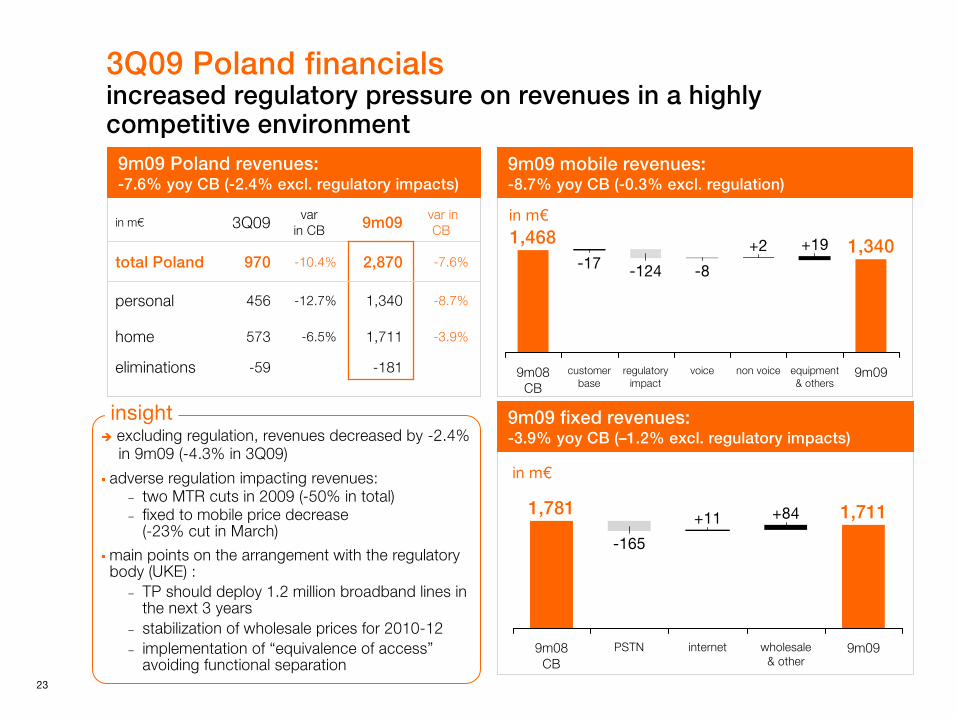
excluding regulation, revenues decreased by -2.4%in 9m09 (-4.3% in 3Q09)
adverse regulation impacting revenues:– two MTR cuts in 2009 (-50% in total)– fixed to mobile price decrease
(-23% cut in March)
main points on the arrangement with the regulatory body (UKE) :
– TP should deploy 1.2 million broadband lines in the next 3 years
– stabilization of wholesale prices for 2010-12– implementation of “equivalence of access”
avoiding functional separation
3Q09 Poland financialsincreased regulatory pressure on revenues in a highly competitive environment
insight
9m09 Poland revenues: -7.6% yoy CB (-2.4% excl. regulatory impacts)
9m09 mobile revenues: -8.7% yoy CB (-0.3% excl. regulation)
in m€
9m09
1,340
equipment & others
+19
non voice
+2
voice
-8
regulatory impact
-124
customer base
-17
9m08 CB
1,468
9m09
1,711
wholesale & other
+84
internet
+11
PSTN
-165
9m08CB
1,781
9m09 fixed revenues: -3.9% yoy CB (–1.2% excl. regulatory impacts)
-6.5%
-12.7%
-10.4%
varin CB
-3.9%
-8.7%
-7.6%2,870970total Poland
in m€ 3Q09 9m09 var in CB
personal 456 1,340
home 573 1,711
eliminations -59 -181
in m€
24
fixed
mob
ile
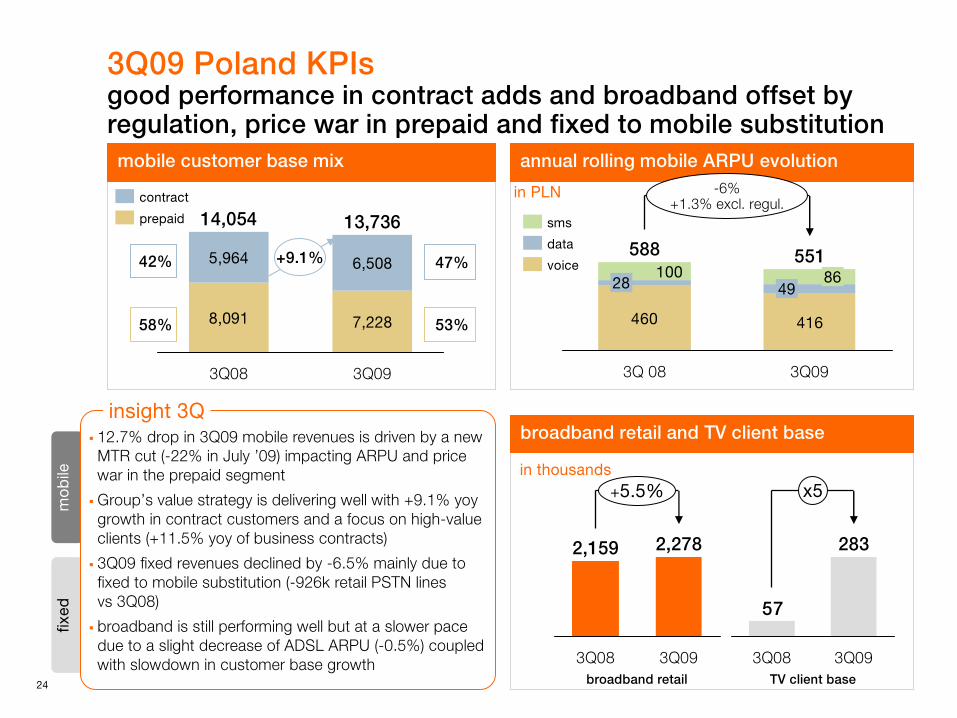
12.7% drop in 3Q09 mobile revenues is driven by a new MTR cut (-22% in July ’09) impacting ARPU and price war in the prepaid segment
Group’s value strategy is delivering well with +9.1% yoygrowth in contract customers and a focus on high-value clients (+11.5% yoy of business contracts)
3Q09 fixed revenues declined by -6.5% mainly due to fixed to mobile substitution (-926k retail PSTN linesvs 3Q08)
broadband is still performing well but at a slower pace due to a slight decrease of ADSL ARPU (-0.5%) coupled with slowdown in customer base growth
3Q09 Poland KPIsgood performance in contract adds and broadband offset by regulation, price war in prepaid and fixed to mobile substitution
insight 3Q
mobile customer base mix
5,964
8,091
14,054
3Q08
6,508
7,228
13,736
3Q09
prepaid
contract
+9.1%
53%58%
47%42%
broadband retail and TV client base
2,159
3Q08
2,278
3Q09
+5.5%
broadband retail
57
3Q08
283
3Q09
x5
TV client base
in thousands
in PLN
annual rolling mobile ARPU evolution
460 416
10028
588
3Q 08
8649
551
3Q09
sms
data
voice
-6%+1.3% excl. regul.
25
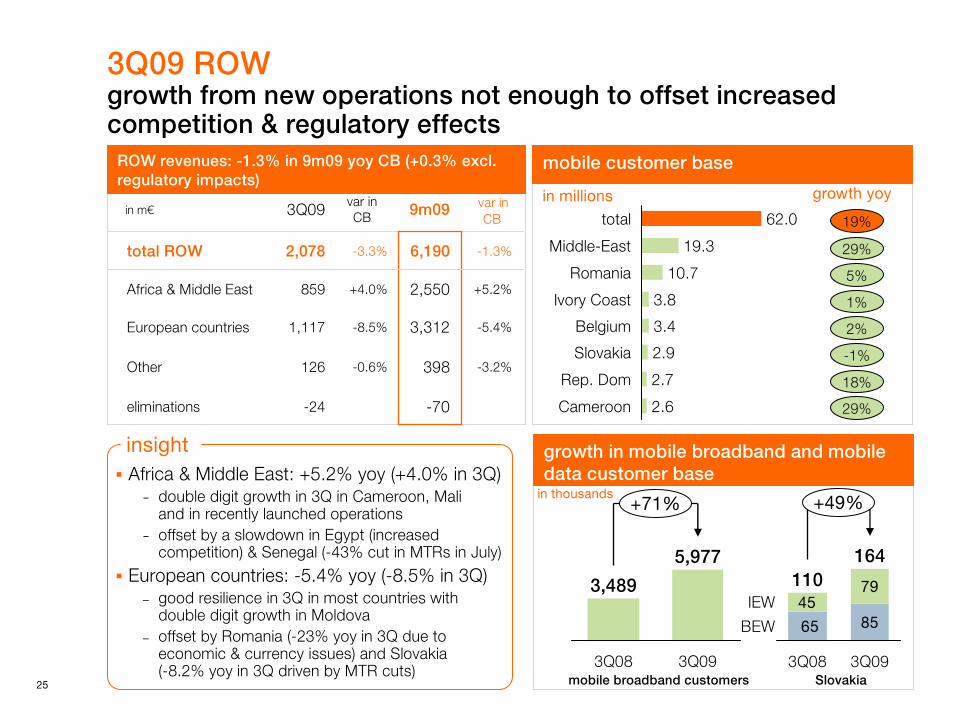
-24
126
1,117
859
2,078
3Q09
-3.2%398-0.6%Other
-5.4%3,312-8.5%European countries
-1.3%6,190-3.3%total ROW
in m€var in CB 9m09 var in
CB
Africa & Middle East +4.0% 2,550 +5.2%
eliminations -70
3Q09 ROWgrowth from new operations not enough to offset increased competition & regulatory effects
Africa & Middle East: +5.2% yoy (+4.0% in 3Q)− double digit growth in 3Q in Cameroon, Mali
and in recently launched operations − offset by a slowdown in Egypt (increased
competition) & Senegal (-43% cut in MTRs in July)
European countries: -5.4% yoy (-8.5% in 3Q)– good resilience in 3Q in most countries with
double digit growth in Moldova – offset by Romania (-23% yoy in 3Q due to
economic & currency issues) and Slovakia(-8.2% yoy in 3Q driven by MTR cuts)
ROW revenues: -1.3% in 9m09 yoy CB (+0.3% excl. regulatory impacts)
mobile customer base
in millions
Belgium 3.4
2.6
Ivory Coast
Rep. Dom
3.8
2.7
Romania
Slovakia 2.9
Cameroon
10.7
Middle-East 19.3
total 62.0
growth yoy
growth in mobile broadband and mobile data customer base
42.2% 41.4%
in thousands
19%
29%
5%
1%
2%
-1%
18%
29%
8545
79
65
+49%
BEW
IEW
3Q093Q08
110164
insight
3,489
+71%
3Q09
5,977
3Q08mobile broadband customers Slovakia

26
3Q09 enterprisebusiness activity impacted by intensifying pressureof the economic downturn
revenue decrease of -5.0% yoy in 3Q09(-3.9% exc. ERS) legacy: further decline of legacy in 3Q09 (-9.6%)due to customers’ behaviors in a still very challenging environment. advanced: still growing +1.9% in 3Q09 thanks to continued strong increase of high speed solutionand despite slower volume growth and price pressure in IPVPNextended: -0.9% in 3Q09 still slightly outperforming the market due to deals being put on hold by customers
insight
29
16
3Q08
+84%
3Q09
XoIP connections in France
in thousands
325318
3Q08
+2%
3Q09
IPVPN accesses world
in thousands
+3.6%1,007 -0.9%326extended businessservices
-10.1%
+1.9%
-9.6%
-5.0%
var inCB
-9.2%
+3.9%
-7.5%
-2.8%5,6591,823total enterprise
in m€ 3Q09 9m09 var in CB
business network legacy 761 2,403
advanced business network 537 1,620
others 199 629
9m09 revenue: -2.8% yoy CB(-1.6% excluding equipment resale)

outlook
28
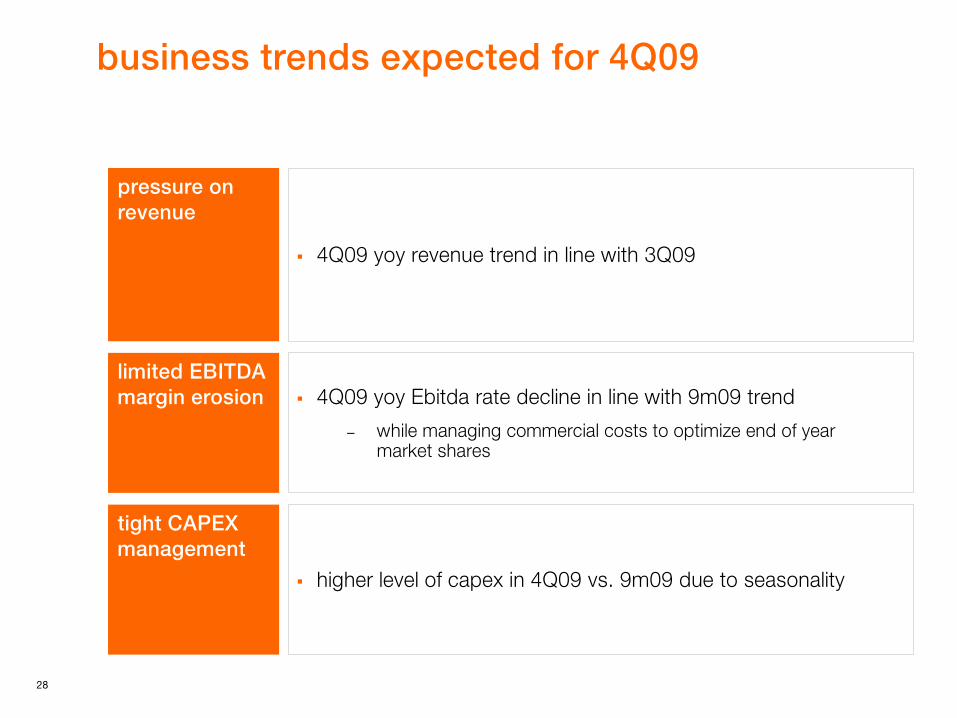
business trends expected for 4Q09
pressure on revenue
4Q09 yoy revenue trend in line with 3Q09
limited EBITDA margin erosion 4Q09 yoy Ebitda rate decline in line with 9m09 trend
– while managing commercial costs to optimize end of year market shares
tight CAPEX management
higher level of capex in 4Q09 vs. 9m09 due to seasonality
29
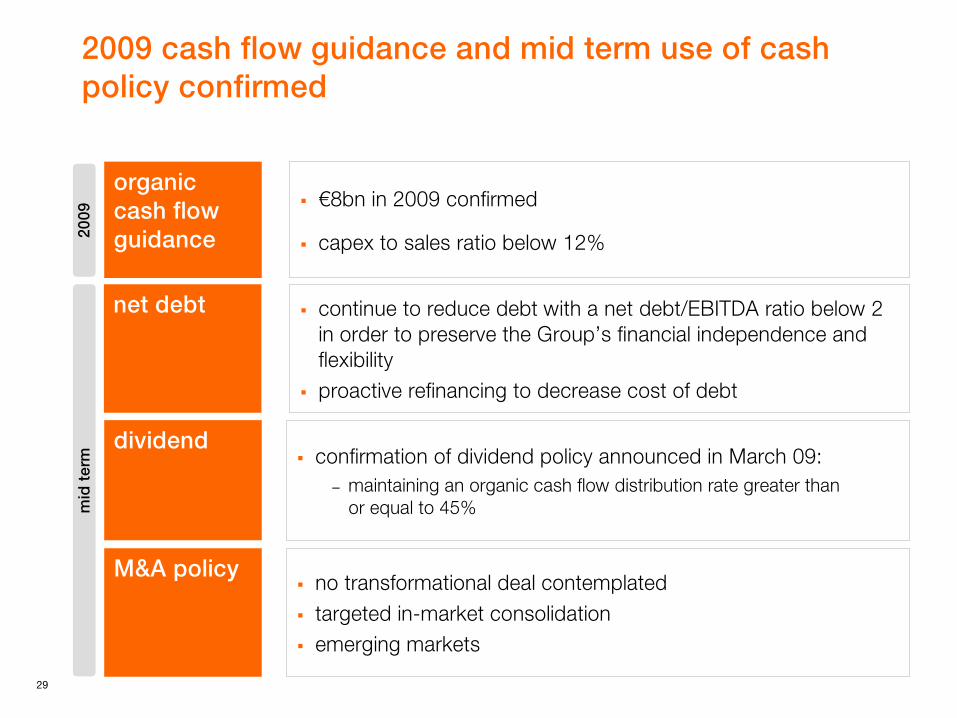
2009 cash flow guidance and mid term use of cash policy confirmed
organiccash flow guidance
€8bn in 2009 confirmed
capex to sales ratio below 12%
confirmation of dividend policy announced in March 09: – maintaining an organic cash flow distribution rate greater than
or equal to 45%
dividend
net debt continue to reduce debt with a net debt/EBITDA ratio below 2 in order to preserve the Group’s financial independence and flexibilityproactive refinancing to decrease cost of debt
M&A policyno transformational deal contemplatedtargeted in-market consolidationemerging markets
2009
mid
term

appendix
31
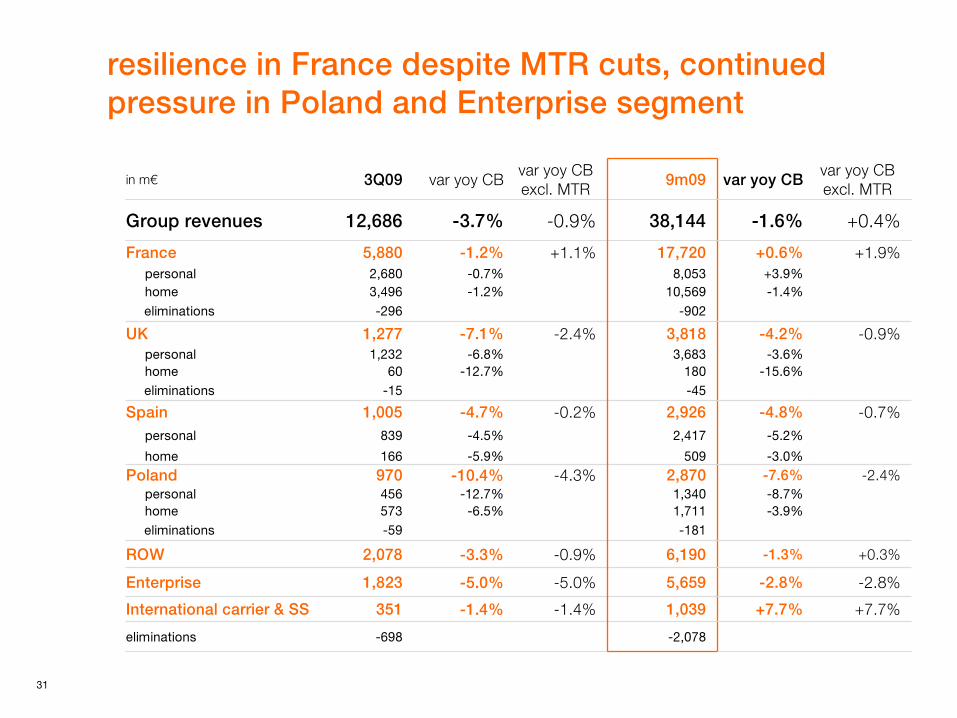
resilience in France despite MTR cuts, continued pressure in Poland and Enterprise segment
+7.7%
-2.8%
-1.3%
-3.9%-8.7%-7.6%-3.0%
-5.2%
-4.8%
-15.6%-3.6%
-4.2%
-1.4%+3.9%
+0.6%
-1.6%
var yoy CB
-181-59 eliminations
-45-15eliminations
-902-296eliminations
in m€ 3Q09 var yoy CBvar yoy CB excl. MTR
9m09var yoy CB excl. MTR
Group revenues 12,686 -3.7% -0.9% 38,144 +0.4%
France 5,880 -1.2% +1.1% 17,720 +1.9%personal 2,680 -0.7% 8,053home 3,496 -1.2% 10,569
UK 1,277 -7.1% -2.4% 3,818 -0.9%personal 1,232 -6.8% 3,683home 60 -12.7% 180
Spain 1,005 -4.7% -0.2% 2,926 -0.7%personal 839 -4.5% 2,417
home 166 -5.9% 509
Poland 970 -10.4% -4.3% 2,870 -2.4%personal 456 -12.7% 1,340home 573 -6.5% 1,711
ROW 2,078 -3.3% -0.9% 6,190 +0.3%
Enterprise 1,823 -5.0% -5.0% 5,659 -2.8%
International carrier & SS 351 -1.4% -1.4% 1,039 +7.7%
eliminations -698 -2,078