
FSR Mastercopy 19Dec07 final - Monetary Authority of .../media/MAS/Regulations and Financial...
58
]
-
Upload
truongxuyen -
Category
Documents
-
view
220 -
download
0
Transcript of FSR Mastercopy 19Dec07 final - Monetary Authority of .../media/MAS/Regulations and Financial...

]

December 2007
Macroeconomic Surveillance Department Monetary Authority of Singapore

ISSN 1793-3463 Published in December 2007 Macroeconomic Surveillance Department Monetary Authority of Singapore http://www.mas.gov.sg All rights reserved. No part of this publication may be reproduced, stored in a retrieval system or transmitted in any form or by any means, electronic, mechanised, photocopying, recording or otherwise, without the prior written permission of the copyright owner except in accordance with the provisions of the Copyright Act (Cap. 63). Application for the copyright owner's written permission to reproduce any part of this publication should be addressed to: Macroeconomic Surveillance Department Monetary Authority of Singapore 10 Shenton Way MAS Building Singapore 079117 Printed by Image Printers Pte Ltd
Financial Stability Review, December 2007
Monetary Authority of Singapore Macroeconomic Surveillance Department
CONTENTS PREFACE i OVERVIEW ii 1 MACRO ENVIRONMENT 1.1 Global Financial Markets 1 1.2 East Asian Financial System 8 1.3 Singapore Economy 14 2 NON-FINANCIAL SECTOR 2.1 Non-financial Corporate Sector 17 2.2 Household Sector 21 Box A: Firms’ Sources of Funding 24 3 FINANCIAL SECTOR 3.1 Banking Sector 27 3.2 Insurance Sector 32 4 FINANCIAL INFRASTRUCTURE 4.1 New MAS Electronic Payment System (MEPS+) 37 5 SPECIAL FEATURE 5.1 Diversification, Default Risk and Contagion in East Asian Banks 40 STATISTICAL APPENDIX 45

Financial Stability Review, December 2007
Monetary Authority of Singapore Macroeconomic Surveillance Department
LIST OF ABBREVIATIONS
ABCP Asset-Backed Commercial Paper ABS Asset-Backed Securities ACU Asian Currency Unit ASEAN Association of Southeast Asian Nations AV Annual Value BIS Bank of International Settlements B&C Building and Construction CAR Capital Adequacy Ratio CDO Collateralised Debt Obligations CDS Credit Default Swaps CLS Continuous Linked Settlement CPF Central Provident Fund CPI Consumer Price Index DBU Domestic Banking Unit EURIBOR Euro Interbank Offered Rate FSR Financial Stability Review GDP Gross Domestic Product GST Goods and Services Tax HDB Housing Development Board ILF Intra-day Liquidity Facilities IMF International Monetary Fund LBO Leveraged Buyout LIBOR London Interbank Offered Rate M-LEC Master Liquidity Enhancement Conduit MAS Monetary Authority of Singapore MBS Mortgage-Backed Securities MEPS+ MAS Electronic Payment System+ MPS Monetary Policy Statement MSD Macroeconomic Surveillance Department MTI Ministry of Trade and Industry NEER Nominal Effective Exchange Rate NIE Newly Industrialised Economies NPL Non-Performing Loans OCBC Overseas Chinese Banking Corporation OIF Offshore Insurance Fund q-o-q quarter-on-quarter ROA Return on Assets SAAR Seasonally Adjusted Annualised Rate SIBOR Singapore Interbank Offered Rate SIF Singapore Insurance Fund SIV Special Investment Vehicles SME Small and Medium-sized Enterprises SWIFT Society for Worldwide Interbank Financial Telecommunication TRR Total Risk Requirement UOB United Overseas Bank URA Urban Redevelopment Authority y-o-y year-on-year
Financial Stability Review, December 2007
Monetary Authority of Singapore Macroeconomic Surveillance Department
i
PREFACE The Monetary Authority of Singapore (MAS) conducts a regular assessment of Singapore’s financial system. Potential risks and vulnerabilities are identified, and the ability of the financial system to withstand potential shocks is reviewed. The analysis and results are contained in the Financial Stability Review (FSR), which is currently published once a year. The FSR aims to contribute to a better understanding among market participants, analysts and the public of issues affecting Singapore’s financial system. Section 1 of the FSR provides a discussion of the macroeconomic environment and financial markets both globally and in East Asia. This is followed by an overview of the Singapore economy. Against this backdrop, Section 2 analyses the non-financial sector. This includes both the corporate and household sectors. Section 3 focuses on the banking sector, given its dominant role in Singapore’s financial landscape. A review of the insurance sector is also provided. Section 4 highlights major developments in the financial infrastructure. Finally, Section 5 contains a special feature on the implications of income diversification for the default and contagion risks of East Asian banks. The production of the Review was coordinated by the Macroeconomic Surveillance Department (MSD) team which comprised Chan Lily, Foo Suan Yong, Cheo Yew-Juin James, Lim Ju Meng Aloysius, Kee Rui Xiong, Lye Yu Hua Carol, Puneet Gulati, Ji Gang and Ong Jia Wern under the general direction of Dr Khor Hoe Ee, Assistant Managing Director (Economics). Valuable statistical and charting support was provided by Alvin Jason John, Low Lie En Elys, Tan-Liew Bee Lan Connie and Tan Yian Gwek Felicia. The Review also incorporated contributions from the following departments: Banking Supervision Department, Capital Markets Department, Capital Markets Intermediaries Department, Complex Institutions Supervision Department, Economic Policy Department, Insurance Supervision Department, Prudential Policy Department, Reserve and Monetary Management Department, Risk and Technology Office, and Specialist Risk Supervision Department. The FSR reflects the views of the staff of the Macroeconomic Surveillance Department and the contributing departments. The FSR may be accessed in PDF format on the MAS website:
http://www.mas.gov.sg/publications/MAS_FSR.html
Financial Stability Review, December 2007
Monetary Authority of Singapore Macroeconomic Surveillance Department
ii
OVERVIEW Following the last FSR in Dec 2006, global financial markets saw a continuation of the search for yields amidst low financial market volatility and the strong macroeconomic environment in the first half of the year. The fairly sanguine environment was disrupted in February and March by equity market sell-offs, one of the initial signs that the rise in risk-taking activity could not continue indefinitely without some re-pricing. The second half of 2007 saw an even more serious disruption in financial marketsas the US subprime mortgage crisis unfolded. Almost all markets, especially structured credit markets, were disrupted. As a result, liquidity in global interbank markets seized up and the major central banks intervened to stabilise the markets. Reflecting the inter-connectedness of the global financial system, Singapore and the rest of the East Asian region saw a sharp sell-off in equities and currencies, and a widening of credit spreads in August, despite the region’s small exposures to US subprime assets and asset-backed securities (ABS). After a recovery in September and October, announcements of large losses by international banks and a further moderation in the US growth outlook triggered another round of sell-offs in November. Notwithstanding the turbulence in the financial markets, the Singapore economy has remained sound, with GDP growth averaging 8.1% in the first three quarters of the year and full-year GDP growth expected to be closer to the upper end of the 7.5-8.0% range. The unemployment rate reached a record low of 1.7% in Q3 2007, compared to 2.7% in 2006 and 3.1% in 2005. Profitability in the domestic non-financial corporate sector improved further for all sub-sectors in H1 2007 compared to a year ago. Returns on assets (ROA) have risen while leverage ratios have remained stable or decreased, reflected in rising interest coverage ratios. Household balance sheets have remained strong. Increasing investment assets as well as cash and deposits have driven asset growth, which has continued to
outpace liabilities growth. The health of Singapore’s banking sector has also remained sound, supported by strong domestic and overseas economic activity. Domestic Banking Unit (DBU) non-bank loans registered an average growth of around 10% in the first nine months of the year, driven mainly by the Building and Construction sector. Asian Currency Unit (ACU) loan activity has also been robust, with lending to banks in Europe and the US registering the highest growth. The local banks’ group performance held up in Q3 2007 as strong interest income offset writedowns on CDO assets. Although the local banks’ CDO exposures were small relative to their capital, their share prices fell and their CDS spreads widened sharply in recent months. Looking ahead, the vulnerabilities in the international financial system exposed by the recent turbulence have heightened the risks to the region’s growth outlook. The US economy could well experience a sharp slowdown due to the recent subprime crisis, in addition to the ongoing correction in its housing sector and recent high oil prices. Slower US growth would affect Asia, given the region’s high dependence on exports. Nevertheless, with the strong financial positions built up by both the financial and non-financial sectors in the past years, the domestic economy is well positioned to withstand these challenges. A key challenge for Asia remains the management of strong capital inflows. While having brought with them substantial benefits, these inflows have posed risks such as asset price inflation and volatile exchange rates.Recent high oil and food prices have also added to inflationary pressures, posing a further challenge to policymakers.
Macroeconomic Surveillance DepartmentMonetary Authority of Singapore
3 December 2007
Financial Stability Review, December 2007
Monetary Authority of Singapore Macroeconomic Surveillance Department
1
1 MACRO ENVIRONMENT 1.1 Global Financial Markets Following the last FSR in Dec 2006, growth in the G3 economies had moderated before picking up in recent quarters. Asia’s expansion, on the other hand, remained strong over the period. The recent financial market turmoil, however, has weakened the outlook for 2008. Strong economic growth, positive financial market conditions, high global savings and low returns on traditional savings products in the past few years have encouraged continued search for yields, at least until the recent financial market turmoil. An indication that the rise in risk-taking activity and leverage could not continue indefinitely without some re-pricing first came in late February. A sell-off in the Shanghai stock market on 27 February was quickly followed by sell-offs across equity markets in Asia and the US. While the sell-offs were partly attributed to expectations that the Chinese authorities would act to cool the stock market, a host of other factors including reports of a slowdown in US corporate earnings growth and emerging concerns over US subprime mortgage loans were lurking in the background. August saw the start of a more serious bout of general risk reappraisal, which continued well into November, after a temporary recovery in markets in September and October. A rise in the delinquency rates of US subprime mortgage loans led to losses for investors in mortgage-backed securities (MBS), some of whom were highly leveraged. A loss of confidence in these assets extended to the wider structured-credit market as concerns arose over the valuation of complex structured credit products in general. Markets seized up, risk premia rose sharply and liquidity conditions worsened. The contagion spread beyond the structured-credit market when investors sold off financial assets in other markets which had been stable and liquid. Equity, bond and currency markets including those in the East Asian region were affected.
Some unwinding of carry trades took place as the volatility in financial markets reduced the attractiveness of such trades. Interbank markets in the US and Europe were also disrupted when risk aversion and liquidity hoarding hit short-term money markets. This reflected concerns over not only banks’ direct exposures to US subprime mortgages and holdings of related securities, but also banks’ contingent liquidity lines to conduits and special investment vehicles (SIVs), which were facing difficulties rolling over asset-backed commercial papers (ABCPs) due to a deterioration of the underlying assets. As a result, central banks, notably the US Federal Reserve, Bank of England and the European Central Bank intervened to stabilise the interbank markets. East Asia’s resilience was demonstrated by its ability to weather the recent financial market turbulence relatively unscathed. However, its vulnerability due to linkages with the international financial system was also revealed. A key challenge for East Asia remains the management of strong capital inflows. These inflows have yielded significant benefits such as contributing to the region’s resilience to external shocks through the build-up of reserves. However, they have also posed risks, whereby central banks need to guard against excessive asset-price inflation and credit growth, as well as volatile and misaligned exchange rates. At the same time, the region faces a more uncertain growth outlook, although recent forecasts have remained fairly strong. The US continues to see the impact of the recent subprime crisis and housing market corrections. It has become difficult to predict the extent of the US’ anticipated growth moderation, and its impact on export-dependent Asia. In this context, several Asian countries’ monetary policy stances now reflect a difficult balance between downside risks to the real economy and upside risks of rising inflation, reflecting high oil and food prices.
Financial Stability Review, December 2007
Monetary Authority of Singapore Macroeconomic Surveillance Department
2
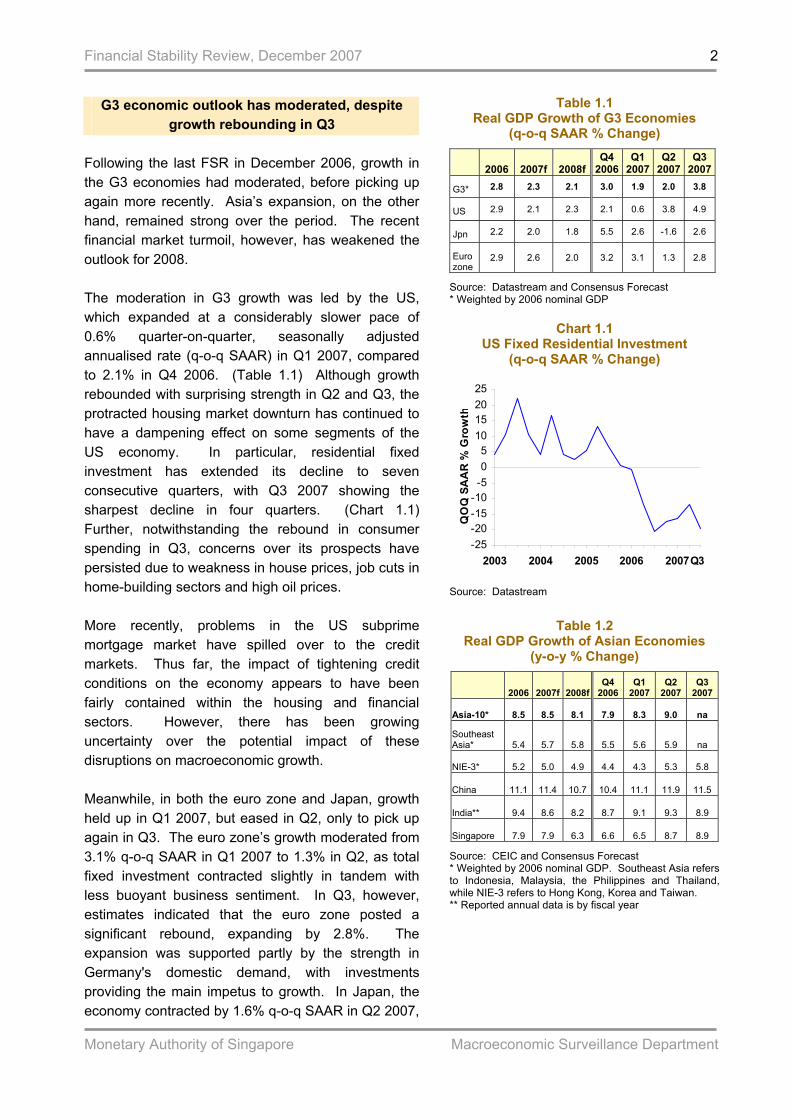
G3 economic outlook has moderated, despite growth rebounding in Q3
Following the last FSR in December 2006, growth in the G3 economies had moderated, before picking up again more recently. Asia’s expansion, on the other hand, remained strong over the period. The recent financial market turmoil, however, has weakened the outlook for 2008. The moderation in G3 growth was led by the US, which expanded at a considerably slower pace of 0.6% quarter-on-quarter, seasonally adjusted annualised rate (q-o-q SAAR) in Q1 2007, compared to 2.1% in Q4 2006. (Table 1.1) Although growth rebounded with surprising strength in Q2 and Q3, the protracted housing market downturn has continued to have a dampening effect on some segments of the US economy. In particular, residential fixed investment has extended its decline to seven consecutive quarters, with Q3 2007 showing the sharpest decline in four quarters. (Chart 1.1) Further, notwithstanding the rebound in consumer spending in Q3, concerns over its prospects have persisted due to weakness in house prices, job cuts in home-building sectors and high oil prices. More recently, problems in the US subprime mortgage market have spilled over to the credit markets. Thus far, the impact of tightening credit conditions on the economy appears to have been fairly contained within the housing and financial sectors. However, there has been growing uncertainty over the potential impact of these disruptions on macroeconomic growth. Meanwhile, in both the euro zone and Japan, growth held up in Q1 2007, but eased in Q2, only to pick up again in Q3. The euro zone’s growth moderated from 3.1% q-o-q SAAR in Q1 2007 to 1.3% in Q2, as total fixed investment contracted slightly in tandem with less buoyant business sentiment. In Q3, however, estimates indicated that the euro zone posted a significant rebound, expanding by 2.8%. The expansion was supported partly by the strength in Germany's domestic demand, with investments providing the main impetus to growth. In Japan, the economy contracted by 1.6% q-o-q SAAR in Q2 2007,
Table 1.1 Real GDP Growth of G3 Economies
(q-o-q SAAR % Change)
2006 2007f 2008f Q4
2006 Q1
2007 Q2
2007Q3
2007
G3* 2.8 2.3 2.1 3.0 1.9 2.0 3.8
US 2.9 2.1 2.3 2.1 0.6 3.8 4.9
Jpn 2.2 2.0 1.8 5.5 2.6 -1.6 2.6
Euro zone
2.9 2.6 2.0 3.2 3.1 1.3 2.8
Source: Datastream and Consensus Forecast * Weighted by 2006 nominal GDP
Chart 1.1
US Fixed Residential Investment (q-o-q SAAR % Change)
-25-20-15-10-505
10152025
2003 2004 2005 2006 2007
QO
Q S
AA
R %
Gro
wth
Q3
Source: Datastream
Table 1.2
Real GDP Growth of Asian Economies (y-o-y % Change)
2006 2007f 2008f
Q4 2006
Q1 2007
Q2 2007
Q3 2007
Asia-10* 8.5 8.5 8.1 7.9 8.3 9.0 na
Southeast Asia* 5.4 5.7 5.8 5.5 5.6 5.9 na
NIE-3* 5.2 5.0 4.9 4.4 4.3 5.3 5.8
China 11.1 11.4 10.7 10.4 11.1 11.9 11.5
India** 9.4 8.6 8.2 8.7 9.1 9.3 8.9
Singapore 7.9 7.9 6.3 6.6 6.5 8.7 8.9
Source: CEIC and Consensus Forecast * Weighted by 2006 nominal GDP. Southeast Asia refers to Indonesia, Malaysia, the Philippines and Thailand, while NIE-3 refers to Hong Kong, Korea and Taiwan. ** Reported annual data is by fiscal year

Financial Stability Review, December 2007
Monetary Authority of Singapore Macroeconomic Surveillance Department
3
after having grown 2.6% in Q1. The slowdown was both sharp and broad-based, as non-residential investments declined, while personal consumption and net exports contributed less to overall growth. In Q3, however, growth in Japan rebounded, driven primarily by exports and an upturn in private non-residential investments. Looking ahead, growth in the developed economies is projected to soften. Over the near term, the US economy is expected to post below-trend growth as the housing market correction continues to weigh on consumer expenditure and business sentiment. Nevertheless, the economy is expected to pick up in the second half of 2008, bringing the full-year growth to 2.3%. In the euro zone, the strong euro is expected to dampen exports. However, resilience in the labour market should provide some support for personal consumption. In Japan, business sentiment has turned more cautious. Nonetheless, firms are expected to continue to re-invest profits, while exports are likely to be supported by demand from emerging economies.
Robust growth in Asia was buttressed by domestic demand
Softer growth in the G3 economies in H1 2007 was offset to some extent by the sustained expansion in Asia. (Table 1.2) Economic activity in the Asia-10 economies (Southeast Asia, NIE-3, China, India and Singapore) accelerated in H1 2007, led by China and India. The consolidation of the global IT industry dampened Asian exports somewhat, but robust domestic demand helped to buttress overall growth. In particular, household consumption rose on the back of sustained growth in employment and disposable income, while fixed investments expanded in response to capacity shortages and infrastructure bottlenecks.
The outlook for Asia-10 is fairly robust, with growth in 2008 forecasted to reach 8.1%. Exports should be supported by a modest recovery in the IT sector, notwithstanding expected weaker demand in the US during H1 2008. Firm labour market conditions are expected to buttress personal consumption, while
efforts to ease infrastructure bottlenecks in some countries are expected to sustain fixed investment growth.
The potential impact of a sharp correction in the US housing market remains a concern for Asia. There are concerns that the US housing market downturn could lead to a sharp decline in US consumer spending and that business spending could be affected if lending conditions were to tighten significantly. As Asia’s exports remain reliant on final demand in the US, a sharp contraction in the US economy would likely affect the region’s growth considerably. Nevertheless, expectations are that US growth, while likely to slow in the first half of 2008, will see a recovery in the second half of 2008. At the same time, robust domestic demand in Asia is likely to provide some support over the coming year.
Strong economic and market conditions, high global savings and low interest rates had encouraged continuation of search for yields
Strong economic growth, positive financial market conditions, high global savings and low returns on traditional savings products in the past few years have encouraged the search for yields to continue, at least until the recent financial market turmoil.
For example, the securitisation of subprime mortgage loans into collateralised debt obligations (CDOs) had increased while loan underwriting standards had loosened. In the leveraged buyout (LBO) market, the number and value of deals had continued to rise sharply. In the foreign exchange market, carry trades had persisted, underlined by the continuation of large interest-rate differentials between different currencies, and by buoyant investor sentiment built on the basis of an extended period of low volatility in financial markets.
Financial Stability Review, December 2007
Monetary Authority of Singapore Macroeconomic Surveillance Department
4
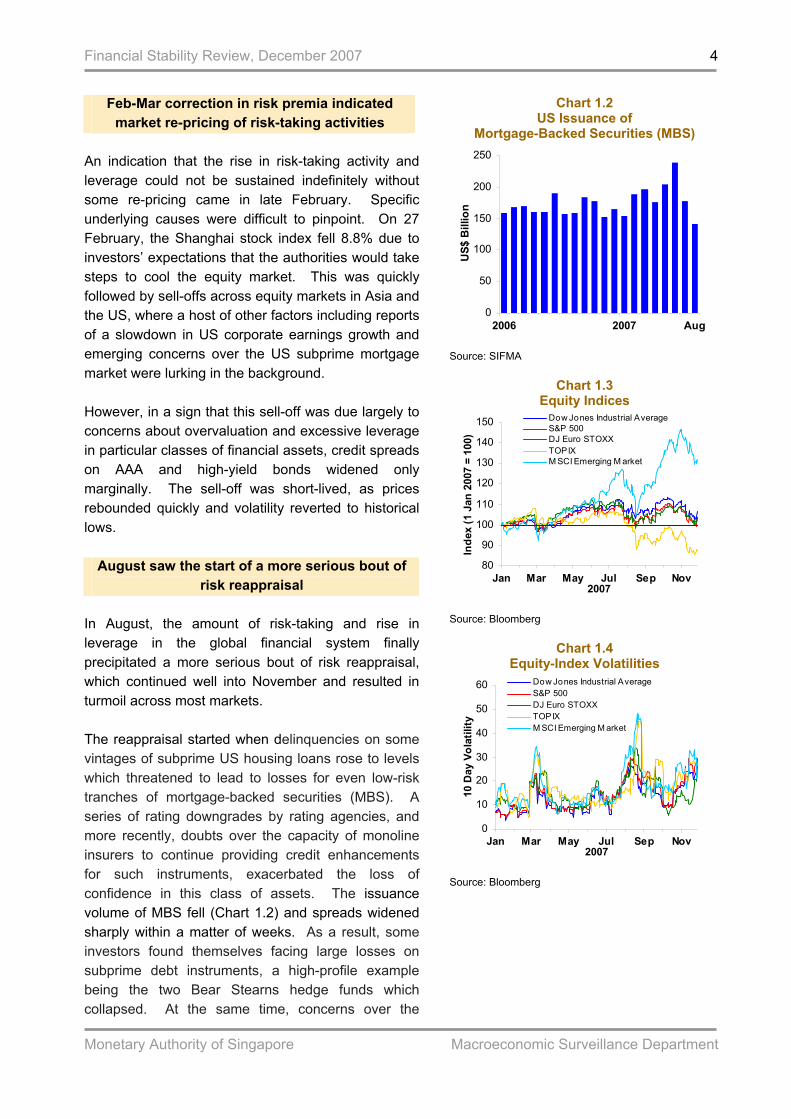
Feb-Mar correction in risk premia indicated market re-pricing of risk-taking activities
An indication that the rise in risk-taking activity and leverage could not be sustained indefinitely without some re-pricing came in late February. Specific underlying causes were difficult to pinpoint. On 27 February, the Shanghai stock index fell 8.8% due to investors’ expectations that the authorities would take steps to cool the equity market. This was quickly followed by sell-offs across equity markets in Asia and the US, where a host of other factors including reports of a slowdown in US corporate earnings growth and emerging concerns over the US subprime mortgage market were lurking in the background. However, in a sign that this sell-off was due largely to concerns about overvaluation and excessive leverage in particular classes of financial assets, credit spreads on AAA and high-yield bonds widened only marginally. The sell-off was short-lived, as prices rebounded quickly and volatility reverted to historical lows.
August saw the start of a more serious bout of risk reappraisal
In August, the amount of risk-taking and rise in leverage in the global financial system finally precipitated a more serious bout of risk reappraisal, which continued well into November and resulted in turmoil across most markets. The reappraisal started when delinquencies on some vintages of subprime US housing loans rose to levels which threatened to lead to losses for even low-risk tranches of mortgage-backed securities (MBS). A series of rating downgrades by rating agencies, and more recently, doubts over the capacity of monoline insurers to continue providing credit enhancements for such instruments, exacerbated the loss of confidence in this class of assets. The issuance volume of MBS fell (Chart 1.2) and spreads widened sharply within a matter of weeks. As a result, some investors found themselves facing large losses on subprime debt instruments, a high-profile example being the two Bear Stearns hedge funds which collapsed. At the same time, concerns over the
Chart 1.2 US Issuance of
Mortgage-Backed Securities (MBS)
0
50
100
150
200
250
2006 2007
US$
Bill
ion
Aug
Source: SIFMA
Chart 1.3 Equity Indices
80
90
100
110
120
130
140
150
Jan Mar May Jul Sep Nov2007
Inde
x (1
Jan
200
7 =
100)
Dow Jones Industrial AverageS&P 500DJ Euro STOXXTOPIXM SCI Emerging M arket
Source: Bloomberg
Chart 1.4 Equity-Index Volatilities
0
10
20
30
40
50
60
Jan Mar May Jul Sep Nov2007
10 D
ay V
olat
ility
Dow Jones Industrial AverageS&P 500DJ Euro STOXXTOPIXM SCI Emerging M arket
Source: Bloomberg
Financial Stability Review, December 2007
Monetary Authority of Singapore Macroeconomic Surveillance Department
5
valuation of complex structured credit products led to a sharp rise in risk premia and worsened liquidity conditions throughout structured-credit markets. In late November, some European banks in fact accepted the recommendation of the European Covered Bond Council to suspend trading in covered bonds, so as to avoid an undue acceleration in the widening of spreads.
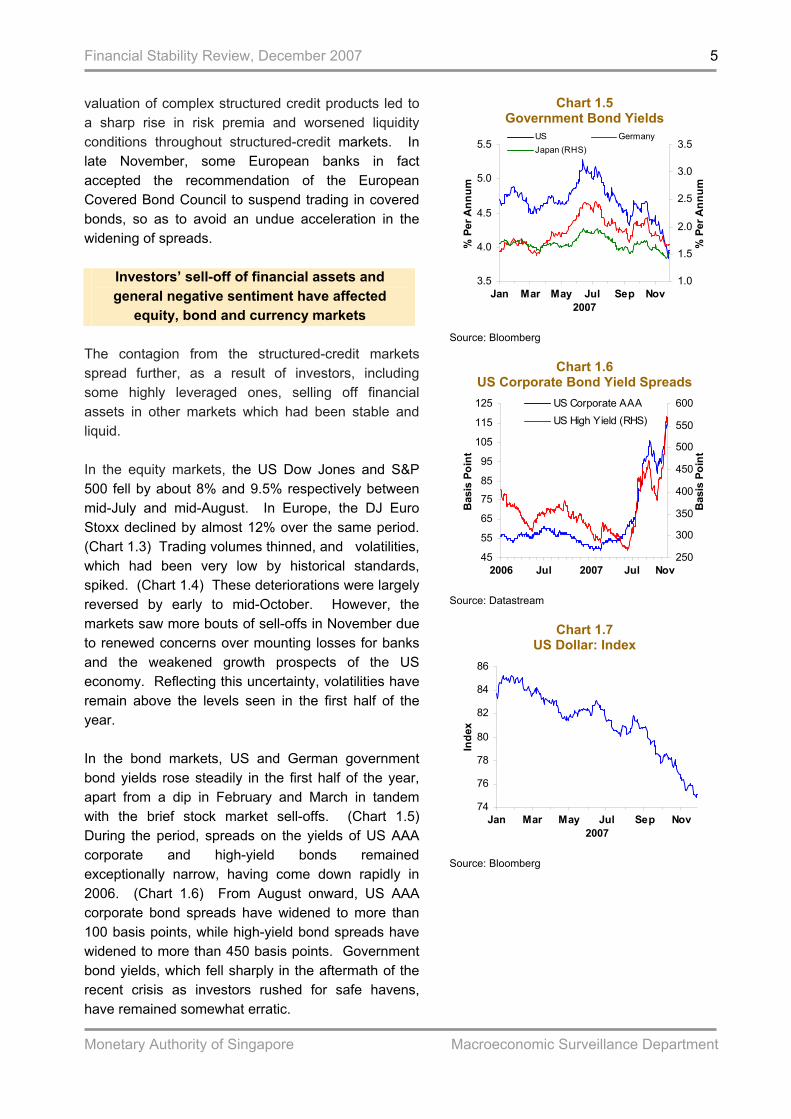
Investors’ sell-off of financial assets and general negative sentiment have affected
equity, bond and currency markets The contagion from the structured-credit markets spread further, as a result of investors, including some highly leveraged ones, selling off financial assets in other markets which had been stable and liquid. In the equity markets, the US Dow Jones and S&P 500 fell by about 8% and 9.5% respectively between mid-July and mid-August. In Europe, the DJ Euro Stoxx declined by almost 12% over the same period. (Chart 1.3) Trading volumes thinned, and volatilities, which had been very low by historical standards, spiked. (Chart 1.4) These deteriorations were largely reversed by early to mid-October. However, the markets saw more bouts of sell-offs in November due to renewed concerns over mounting losses for banks and the weakened growth prospects of the US economy. Reflecting this uncertainty, volatilities have remain above the levels seen in the first half of the year. In the bond markets, US and German government bond yields rose steadily in the first half of the year, apart from a dip in February and March in tandem with the brief stock market sell-offs. (Chart 1.5) During the period, spreads on the yields of US AAA corporate and high-yield bonds remained exceptionally narrow, having come down rapidly in 2006. (Chart 1.6) From August onward, US AAA corporate bond spreads have widened to more than 100 basis points, while high-yield bond spreads have widened to more than 450 basis points. Government bond yields, which fell sharply in the aftermath of the recent crisis as investors rushed for safe havens, have remained somewhat erratic.
Chart 1.5 Government Bond Yields
3.5
4.0
4.5
5.0
5.5
Jan Mar May Jul Sep Nov2007
% P
er A
nnum
1.0
1.5
2.0
2.5
3.0
3.5
% P
er A
nnum
US GermanyJapan (RHS)
Source: Bloomberg
Chart 1.6
US Corporate Bond Yield Spreads
45
55
65
75
85
95
105
115
125
Jan Jul Jan Jul
Bas
is P
oint
250
300
350
400
450
500
550
600
Bas
is P
oint
US Corporate AAAUS High Yield (RHS)
20072006 Nov
Source: Datastream
Chart 1.7 US Dollar: Index
74
76
78
80
82
84
86
Jan Mar May Jul Sep Nov2007
Inde
x
Source: Bloomberg
Financial Stability Review, December 2007
Monetary Authority of Singapore Macroeconomic Surveillance Department
6
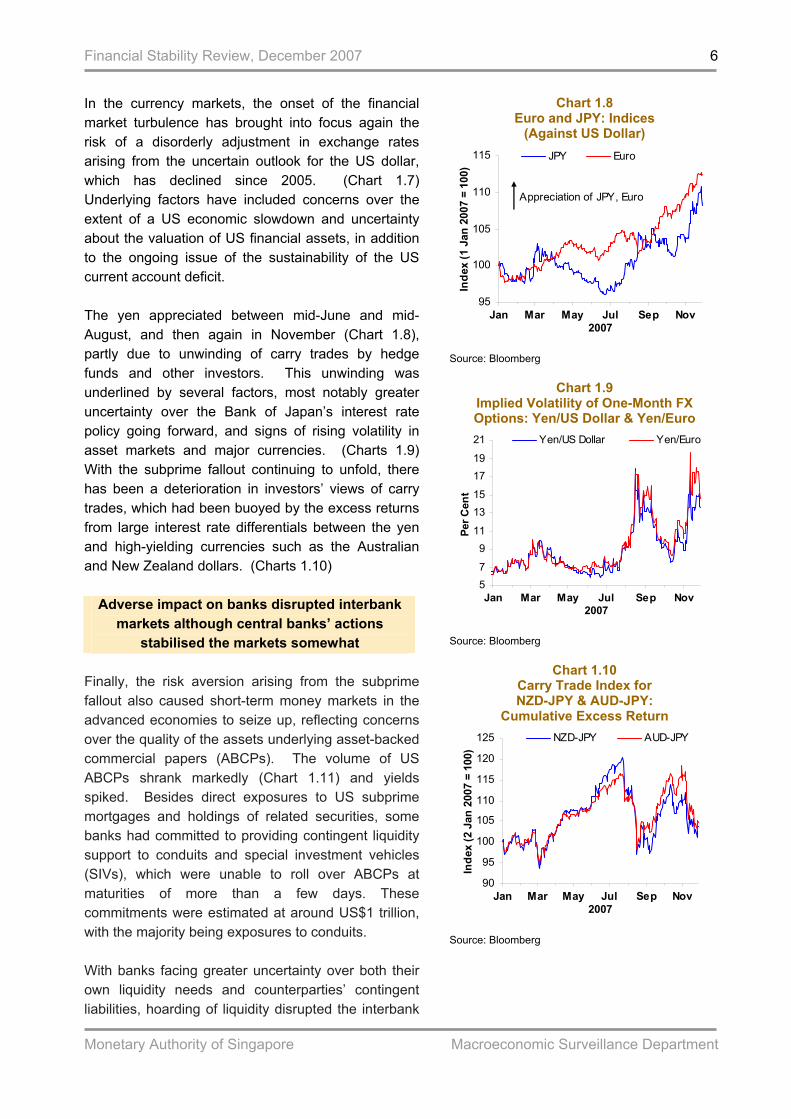
In the currency markets, the onset of the financial market turbulence has brought into focus again the risk of a disorderly adjustment in exchange rates arising from the uncertain outlook for the US dollar, which has declined since 2005. (Chart 1.7) Underlying factors have included concerns over the extent of a US economic slowdown and uncertainty about the valuation of US financial assets, in addition to the ongoing issue of the sustainability of the US current account deficit. The yen appreciated between mid-June and mid-August, and then again in November (Chart 1.8), partly due to unwinding of carry trades by hedge funds and other investors. This unwinding was underlined by several factors, most notably greater uncertainty over the Bank of Japan’s interest rate policy going forward, and signs of rising volatility in asset markets and major currencies. (Charts 1.9) With the subprime fallout continuing to unfold, there has been a deterioration in investors’ views of carry trades, which had been buoyed by the excess returns from large interest rate differentials between the yen and high-yielding currencies such as the Australian and New Zealand dollars. (Charts 1.10)
Adverse impact on banks disrupted interbank markets although central banks’ actions
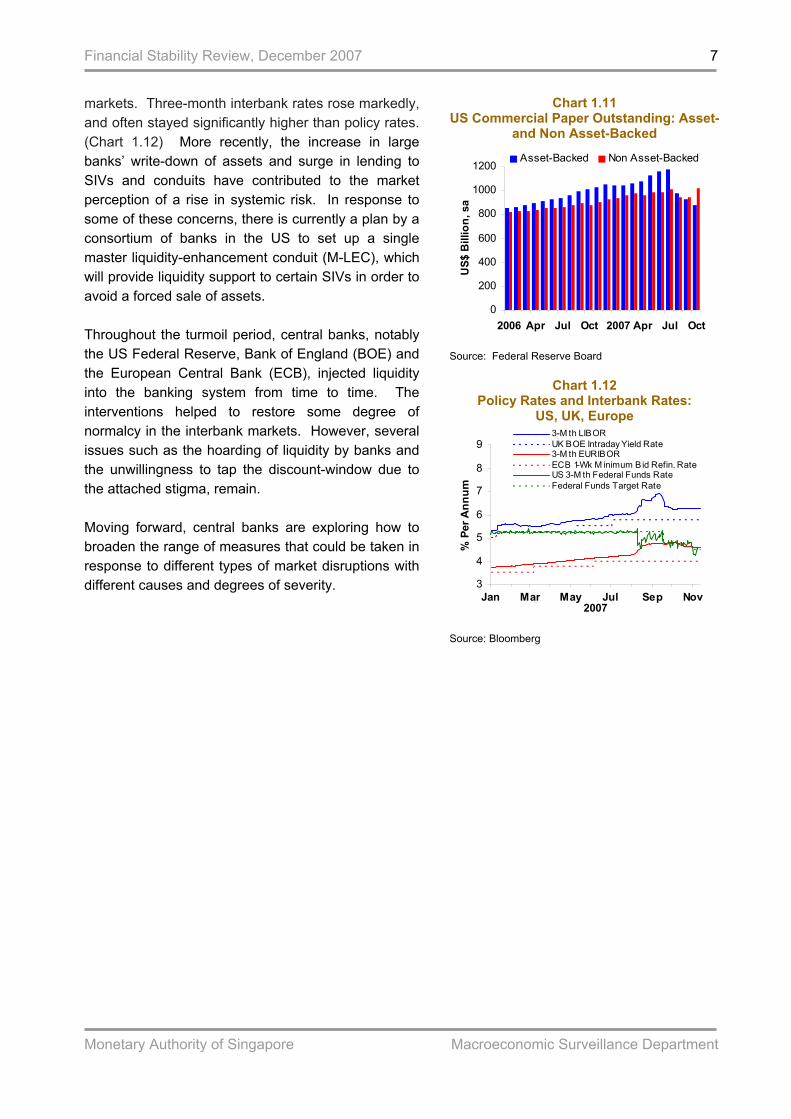
stabilised the markets somewhat Finally, the risk aversion arising from the subprime fallout also caused short-term money markets in the advanced economies to seize up, reflecting concerns over the quality of the assets underlying asset-backed commercial papers (ABCPs). The volume of US ABCPs shrank markedly (Chart 1.11) and yields spiked. Besides direct exposures to US subprime mortgages and holdings of related securities, some banks had committed to providing contingent liquidity support to conduits and special investment vehicles (SIVs), which were unable to roll over ABCPs at maturities of more than a few days. These commitments were estimated at around US$1 trillion, with the majority being exposures to conduits. With banks facing greater uncertainty over both their own liquidity needs and counterparties’ contingent liabilities, hoarding of liquidity disrupted the interbank
Chart 1.8 Euro and JPY: Indices
(Against US Dollar)
95
100
105
110
115
Jan Mar May Jul Sep Nov2007
Inde
x (1
Jan
200
7 =
100)
JPY Euro
Appreciation of JPY, Euro
Source: Bloomberg
Chart 1.9
Implied Volatility of One-Month FX Options: Yen/US Dollar & Yen/Euro
57
911
1315
1719
21
Jan Mar May Jul Sep Nov2007
Per C
ent
Yen/US Dollar Yen/Euro
Source: Bloomberg
Chart 1.10 Carry Trade Index for NZD-JPY & AUD-JPY:
Cumulative Excess Return
90
95
100
105
110
115
120
125
Jan Mar May Jul Sep Nov2007
Inde
x (2
Jan
200
7 =
100)
NZD-JPY AUD-JPY
Source: Bloomberg
Financial Stability Review, December 2007
Monetary Authority of Singapore Macroeconomic Surveillance Department
7
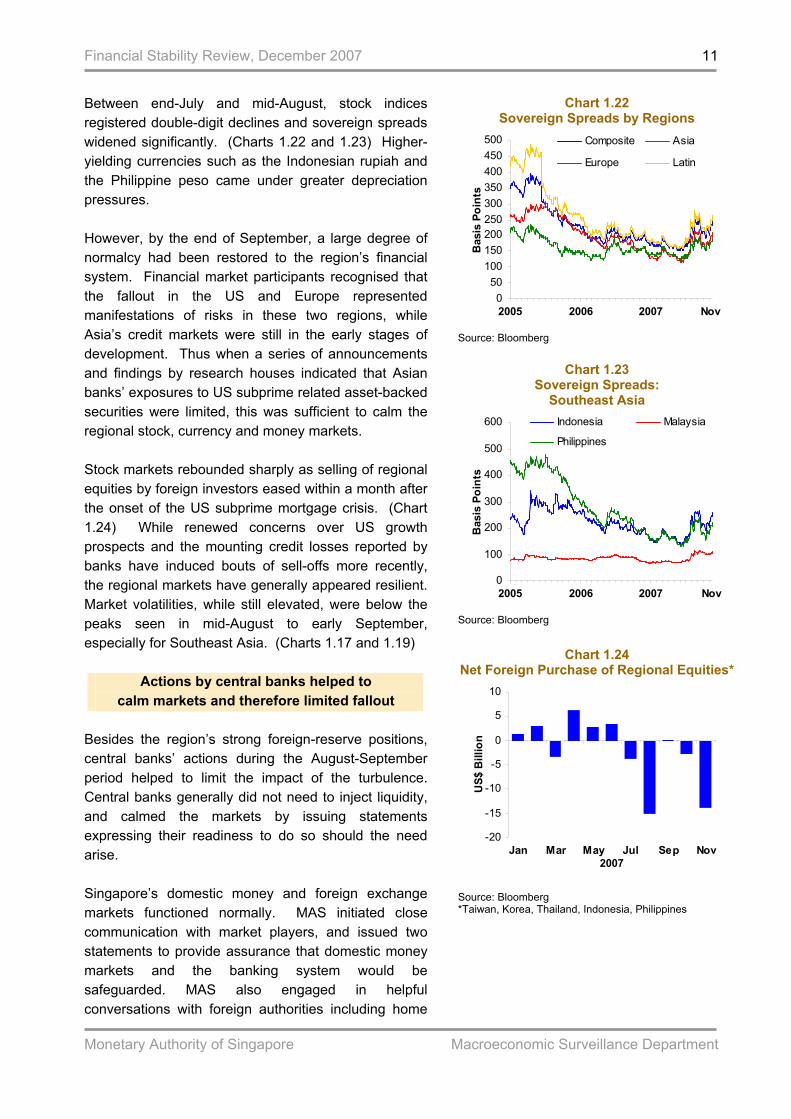
markets. Three-month interbank rates rose markedly, and often stayed significantly higher than policy rates. (Chart 1.12) More recently, the increase in large banks’ write-down of assets and surge in lending to SIVs and conduits have contributed to the market perception of a rise in systemic risk. In response to some of these concerns, there is currently a plan by a consortium of banks in the US to set up a single master liquidity-enhancement conduit (M-LEC), which will provide liquidity support to certain SIVs in order to avoid a forced sale of assets. Throughout the turmoil period, central banks, notably the US Federal Reserve, Bank of England (BOE) and the European Central Bank (ECB), injected liquidity into the banking system from time to time. The interventions helped to restore some degree of normalcy in the interbank markets. However, several issues such as the hoarding of liquidity by banks and the unwillingness to tap the discount-window due to the attached stigma, remain. Moving forward, central banks are exploring how to broaden the range of measures that could be taken in response to different types of market disruptions with different causes and degrees of severity.
Chart 1.11 US Commercial Paper Outstanding: Asset-
and Non Asset-Backed
0
200
400
600
800
1000
1200
Jan Apr Jul Oct Jan Apr Jul Oct
US$
Bill
ion,
sa
Asset-Backed Non Asset-Backed
2006 2007
Source: Federal Reserve Board
Chart 1.12 Policy Rates and Interbank Rates:
US, UK, Europe
3
4
5
6
7
8
9
Jan Mar May Jul Sep Nov2007
% P
er A
nnum
3-M th LIBORUK BOE Intraday Yield Rate3-M th EURIBORECB 1-Wk M inimum Bid Refin. RateUS 3-M th Federal Funds RateFederal Funds Target Rate
Source: Bloomberg

Financial Stability Review, December 2007
Monetary Authority of Singapore Macroeconomic Surveillance Department
8
1.2 East Asian Financial System
Robust growth in East Asian economies has underlined the strength of the corporate and
household sectors Turning to East Asia, the region has seen robust economic growth for the year to date, and the outlook has remained positive, underlined by the strength of the corporate and household sectors. (Table 1.3) East Asian non-financial firms saw return-on-asset (ROA) ratios rise markedly in Q2 07, while continuing efforts by corporations not to over-leverage themselves saw debt-to-equity ratios remaining stable. (Table 1.4) Correspondingly, interest coverage ratios, which measure firms’ ability to use earnings to service debt, have remained high. (Chart 1.13) All in all, the signs are that firms are less vulnerable to debt-servicing problems than during the Asian Financial Crisis ten years ago. As for households, growth in private consumption has continued to be outpaced by GDP growth in many economies. At the same time, anti-speculation measures by governments have helped to cap housing market booms. Consequently, household indebtedness in terms of the ratio of both mortgage and non-mortgage loans to GDP remained broadly unchanged over the first half of 2007. (Table 1.5)
Strong capital inflows have further improved the region’s resilience and encouraged financial
liberalisation and deepening of markets Against this backdrop of strong economic growth and healthy corporate and household sectors, in addition to the global search for yields, both Northeast Asia and Southeast Asia have continued to receive strong capital inflows. (Charts 1.14 and 1.15) These inflows have yielded substantial benefits. Some inflows have been channelled to productive investments in the real economy, while others have contributed to the deepening of the region’s financial markets. The inflows have also added to official reserves and therefore strengthened the external
Table 1.3 Real GDP Growth of Asian Countries
(y-o-y % Change)
2006 2007f 2008f Q1
2007Q2
2007Q3
2007NEA 9.0 9.1 8.7 8.7 9.6 9.5
China 11.1 11.4 10.7 11.1 11.9 11.5Hong Kong 6.8 6.0 5.1 5.6 6.6 6.2 Korea 5.0 4.9 5.0 4.0 5.0 5.2 Taiwan 4.9 4.6 4.6 4.2 5.2 6.9
SEA 5.4 5.7 5.8 5.6 5.9 na Indonesia 5.5 6.2 6.3 6.0 6.3 6.5 Malaysia 5.9 5.7 5.9 5.5 5.8 6.7 Philippines 5.4 6.5 5.9 7.1 7.5 6.6 Thailand 5.0 4.3 4.8 4.2 4.4 na
India* 9.4 8.6 8.2 9.1 9.3 8.9
Source: CEIC and Asia Pacific Consensus Forecast *Reported annual data is by fiscal year
Table 1.4 Financial Ratios of Non-Financial
Corporations (Median)
Financial year 2002 2003 2004 2005 2006
Q2 2007
Return-on-Assets (%) NEA 4.3 4.6 5.0 4.6 4.7 5.5 SEA 3.9 4.2 4.7 4.5 4.6 5.3
Debt-to-Equity Ratio (%) NEA 40.0 43.1 43.0 41.3 39.9 42.0 SEA 24.9 29.1 30.3 31.5 31.9 29.5
Source: Thomson Financial
Chart 1.13 Interest Coverage Ratios* (Median)
0
1
2
3
4
5
6
7
1995 1998 2001 2004 2007Q3
Rat
io
Southeast Asia Northeast Asia
Source: Thomson Financial *Earnings before interest expense & tax divided by interest paid

Financial Stability Review, December 2007
Monetary Authority of Singapore Macroeconomic Surveillance Department
9
positions of East Asian countries. Accordingly, risk premia and domestic interest rates have fallen, and credit ratings have improved. In addition, there is now greater scope for even more flexible exchange rates. These strengths have encouraged countries in the region to liberalise current and capital accounts, and develop financial markets.
But these inflows have posed risks, whereby central banks need to guard against excessive asset-price inflation and credit growth, as well
as volatile or misaligned exchange rates However these capital inflows have also posed substantial risks. Firstly, since much of the inflow has been channelled to property, equity and other financial assets, the region has become more vulnerable to asset-price inflation. At the same time, an expansion of the broad money base has increased the risk of excessive credit growth fuelling an unsustainable boom in consumption or investment. There is a risk of the resulting higher domestic costs driving up the real effective exchange rate, thus undermining export competitiveness. Secondly, as a key factor driving this capital flow is the region’s positive economic prospect, any event inducing spikes in risk aversion could cause a sudden and sharp reversal of these flows. Given the size of the flows, the adverse effects on financial asset prices and exchange rates could be large. Financial institutions with seemingly strong balance sheets could suddenly look weaker. The corporate sector, having performed strongly thus far, could face more restrictive financing conditions.
East Asia has weathered the contagion from the recent crisis relatively unscathed
In this context, events associated with the spike in risk aversion in August demonstrated the region’s resilience to external shocks but also its vulnerability to international shocks arising from its growing linkages with the global financial system. Despite Asian-based financial institutions’ limited subprime related exposures and the maintenance of
Table 1.5 Household Indebtedness*
(Percentage of GDP)
2005Q1
2006Q2
2006 Q3
2006 Q4
2006Q1
2007Q2
2007 Mortgage
NEA1/ 29.0 28.0 28.8 29.4 30.4 29.7 29.9 SEA2/ 10.5 na 10.1 10.3 10.6 10.1 10.3
Non-mortgage NEA 16.2 15.4 15.5 15.5 15.8 15.3 15.5 SEA 13.1 na 11.8 12.1 12.5 11.6 12.0
Total NEA 45.1 43.4 44.3 44.9 46.2 45.0 45.4 SEA 23.7 na 21.8 22.4 23.0 21.7 22.3
Source: CEIC 1/ NEA comprises Hong Kong, Korea, Taiwan & China 2/ SEA comprises Indonesia, Malaysia, Philippines & Thailand
*Definitions may vary across countries
Chart 1.14 Capital Inflows to Northeast Asia
-150-100-50
050
100150200250
1999 2001 2003 2005
US$
Bill
ion
FDI Inf lowNet Errors & OmmissionsOther Investment Inf lowPortfolio Investment Inf low
2006
Source: CEIC
Chart 1.15 Capital Inflows to Southeast Asia
-40
-20
0
20
40
60
80
100
120
1995 1998 2001 2004
US$
Bill
ion
FDI Inf lowNet Errors & OmmissionsOther Investment Inf lowPortfolio Investment Inf low
2006
Source: CEIC

Financial Stability Review, December 2007
Monetary Authority of Singapore Macroeconomic Surveillance Department
10
their credit ratings, regional bourses and currencies experienced sharp declines and higher volatilities. (Charts 1.16 – 1.21)
Chart 1.16
Equity Indices: Northeast Asia
80100
120140160
180200
220240
Jan Mar May Jul Sep Nov2007
Inde
x (1
Jan
200
7 =
100)
Shanghai CompositeHSIKOSPITWSE
Source: Bloomberg
Chart 1.18 Equity Indices: Southeast Asia
8090
100110120
130140150160
Jan Mar May Jul Sep Nov2007
Inde
x (1
Jan
200
7 =
100)
JCI KLCI PSE
SET STI
Source: Bloomberg
Chart 1.20 Currency Indices (Against US Dollar): Northeast Asia
979899
100101102103104105106107
Jan Mar May Jul Sep Nov2007
Inde
x (1
Jan
200
7 =
100)
CNY HKDKRW TWD
Appreciation of NEA currencies
Source: Bloomberg
Chart 1.17 Equity-Index Volatilities: Northeast Asia
0102030405060708090
Jan Mar May Jul Sep Nov2007
10 D
ay V
olat
ility
Shanghai CompositeHSIKOSPITWSE
Source: Bloomberg
Chart 1.19 Equity-Index Volatilities: Southeast Asia
0
20
40
60
80
100
120
Jan Mar May Jul Sep Nov2007
10 D
ay V
olat
ility
JCI KLCI PSE
SET STI
Source: Bloomberg
Chart 1.21 Currency Indices (Against US Dollar):
Southeast Asia
90
95
100
105
110
115
120
Jan Mar May Jul Sep Nov2007
Inde
x (1
Jan
200
7 =
100)
THB IDR SGDPHP MYR
Appreciation of SEA currencies
Source: Bloomberg
Financial Stability Review, December 2007
Monetary Authority of Singapore Macroeconomic Surveillance Department
11
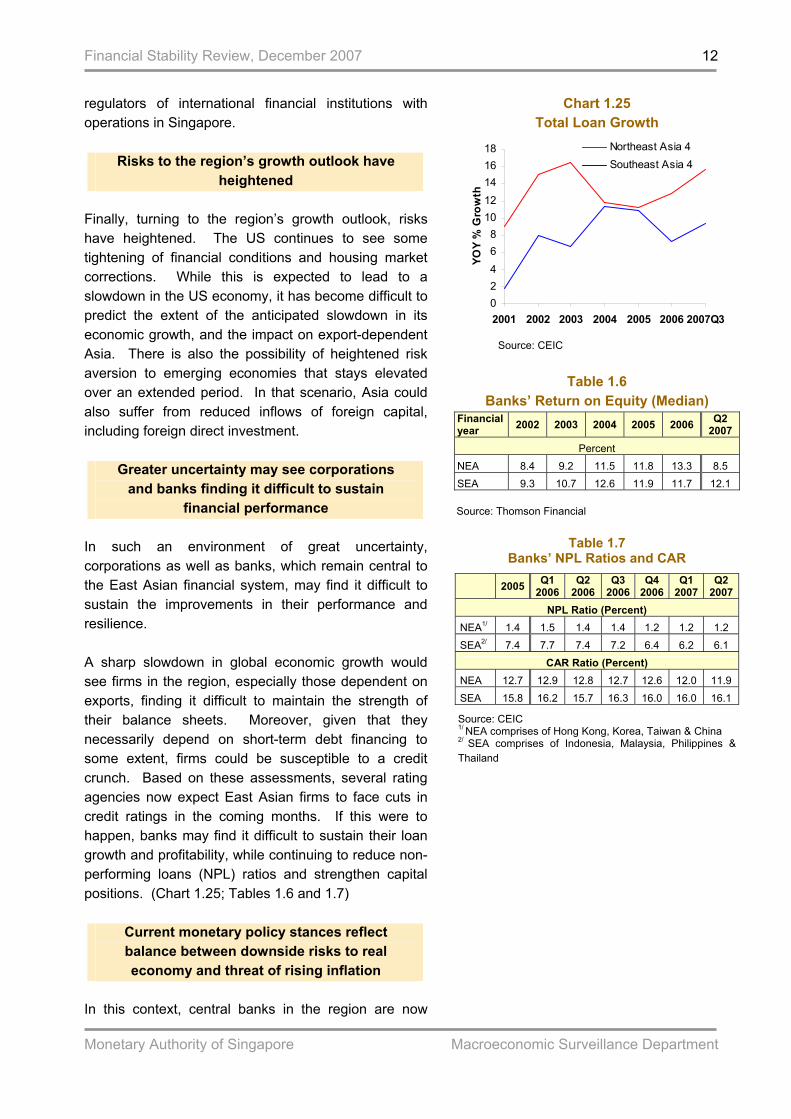
Between end-July and mid-August, stock indices registered double-digit declines and sovereign spreads widened significantly. (Charts 1.22 and 1.23) Higher-yielding currencies such as the Indonesian rupiah and the Philippine peso came under greater depreciation pressures. However, by the end of September, a large degree of normalcy had been restored to the region’s financial system. Financial market participants recognised that the fallout in the US and Europe represented manifestations of risks in these two regions, while Asia’s credit markets were still in the early stages of development. Thus when a series of announcements and findings by research houses indicated that Asian banks’ exposures to US subprime related asset-backed securities were limited, this was sufficient to calm the regional stock, currency and money markets. Stock markets rebounded sharply as selling of regional equities by foreign investors eased within a month after the onset of the US subprime mortgage crisis. (Chart 1.24) While renewed concerns over US growth prospects and the mounting credit losses reported by banks have induced bouts of sell-offs more recently, the regional markets have generally appeared resilient. Market volatilities, while still elevated, were below the peaks seen in mid-August to early September, especially for Southeast Asia. (Charts 1.17 and 1.19)
Actions by central banks helped to calm markets and therefore limited fallout
Besides the region’s strong foreign-reserve positions, central banks’ actions during the August-September period helped to limit the impact of the turbulence. Central banks generally did not need to inject liquidity, and calmed the markets by issuing statements expressing their readiness to do so should the need arise. Singapore’s domestic money and foreign exchange markets functioned normally. MAS initiated close communication with market players, and issued two statements to provide assurance that domestic money markets and the banking system would be safeguarded. MAS also engaged in helpful conversations with foreign authorities including home
Chart 1.22 Sovereign Spreads by Regions
050
100150200250300350400450500
2005 2006 2007
Bas
is P
oint
s
Composite Asia
Europe Latin
Nov
Source: Bloomberg
Chart 1.23 Sovereign Spreads:
Southeast Asia
0
100
200
300
400
500
600
2005 2006 2007
Bas
is P
oint
s
Indonesia Malaysia
Philippines
Nov
Source: Bloomberg
Chart 1.24 Net Foreign Purchase of Regional Equities*
-20
-15
-10
-5
0
5
10
Jan Mar May Jul Sep Nov2007
US$
Bill
ion
Source: Bloomberg *Taiwan, Korea, Thailand, Indonesia, Philippines
Financial Stability Review, December 2007
Monetary Authority of Singapore Macroeconomic Surveillance Department
12
regulators of international financial institutions with operations in Singapore.
Risks to the region’s growth outlook have heightened
Finally, turning to the region’s growth outlook, risks have heightened. The US continues to see some tightening of financial conditions and housing market corrections. While this is expected to lead to a slowdown in the US economy, it has become difficult to predict the extent of the anticipated slowdown in its economic growth, and the impact on export-dependent Asia. There is also the possibility of heightened risk aversion to emerging economies that stays elevated over an extended period. In that scenario, Asia could also suffer from reduced inflows of foreign capital, including foreign direct investment.
Greater uncertainty may see corporations and banks finding it difficult to sustain
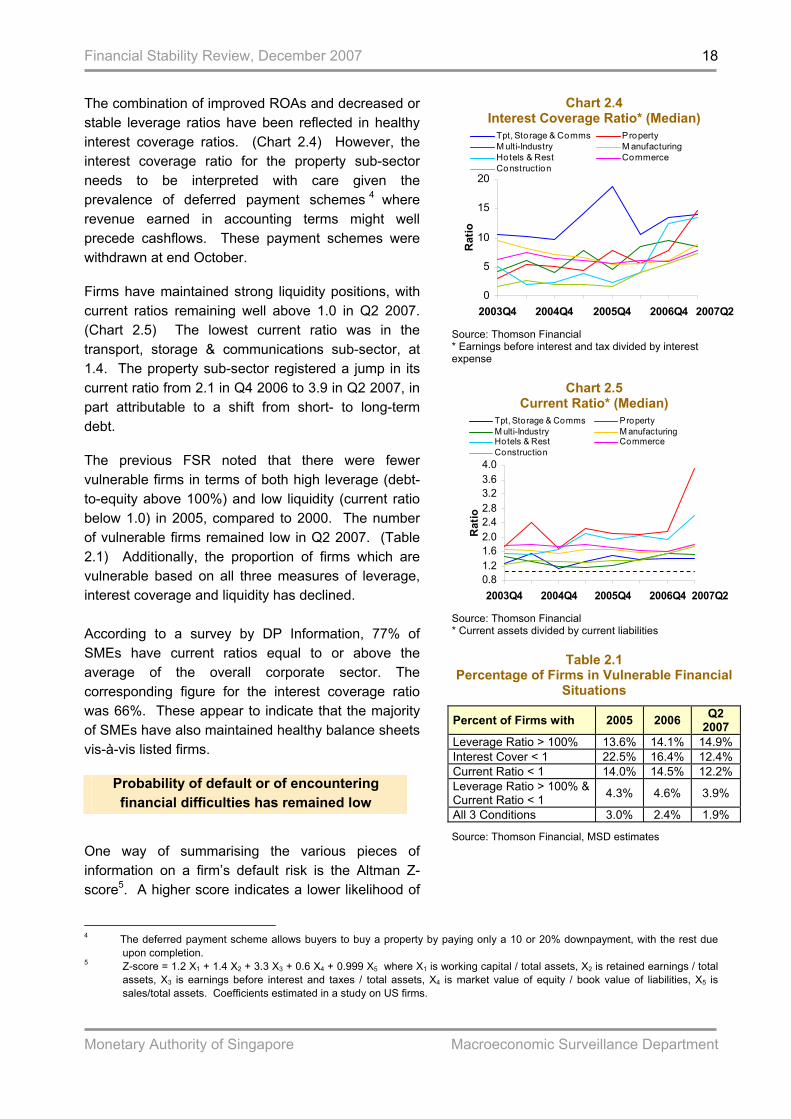
financial performance In such an environment of great uncertainty, corporations as well as banks, which remain central to the East Asian financial system, may find it difficult to sustain the improvements in their performance and resilience. A sharp slowdown in global economic growth would see firms in the region, especially those dependent on exports, finding it difficult to maintain the strength of their balance sheets. Moreover, given that they necessarily depend on short-term debt financing to some extent, firms could be susceptible to a credit crunch. Based on these assessments, several rating agencies now expect East Asian firms to face cuts in credit ratings in the coming months. If this were to happen, banks may find it difficult to sustain their loan growth and profitability, while continuing to reduce non-performing loans (NPL) ratios and strengthen capital positions. (Chart 1.25; Tables 1.6 and 1.7)
Current monetary policy stances reflect balance between downside risks to real economy and threat of rising inflation
In this context, central banks in the region are now
Chart 1.25 Total Loan Growth
02468
1012141618
2001 2002 2003 2004 2005 2006 2007Q3
YOY
% G
row
th
Northeast Asia 4Southeast Asia 4
Source: CEIC
Table 1.6
Banks’ Return on Equity (Median) Financial year 2002 2003 2004 2005 2006 Q2
2007 Percent
NEA 8.4 9.2 11.5 11.8 13.3 8.5 SEA 9.3 10.7 12.6 11.9 11.7 12.1 Source: Thomson Financial
Table 1.7 Banks’ NPL Ratios and CAR
2005 Q1 2006
Q2 2006
Q3 2006
Q4 2006
Q1 2007
Q2 2007
NPL Ratio (Percent) NEA1/ 1.4 1.5 1.4 1.4 1.2 1.2 1.2 SEA2/ 7.4 7.7 7.4 7.2 6.4 6.2 6.1
CAR Ratio (Percent) NEA 12.7 12.9 12.8 12.7 12.6 12.0 11.9 SEA 15.8 16.2 15.7 16.3 16.0 16.0 16.1
Source: CEIC 1/ NEA comprises of Hong Kong, Korea, Taiwan & China 2/ SEA comprises of Indonesia, Malaysia, Philippines & Thailand

Financial Stability Review, December 2007
Monetary Authority of Singapore Macroeconomic Surveillance Department
13
striking a difficult balance between downside risks to the real economy and upside risks of rising inflation. Even as the growth outlook has become more uncertain, inflationary pressures have also grown. (Chart 1.26 and 1.27) Some economies in the region, by virtue of their stronger growth momentum, are experiencing tightening capacity and cost pressures in resource markets. Others have felt the effects of oil and food prices trending upward. Balancing these considerations has been at the core of monetary policy decisions since August, reflecting a cautiously optimistic outlook for growth and inflation. (Charts 1.28 and 1.29)
Chart 1.27 CPI Inflation: Southeast Asia
02468
101214161820
2006 2007
YOY
% G
row
th
Indonesia MalaysiaPhilippines Thailand
Oct
Source: CEIC
Chart 1.29 Policy Rates:
Selected Central Banks in Southeast Asia
3
4
5
6
7
8
9
10
Jan Apr Jul Oct2007
% P
er A
nnum
Indonesia MalaysiaPhilippines Thailand
Source: CEIC *Policy rates of central banks in Asia: China: base interest rate; Hong Kong: base rate for overnight lending; Taiwan: discount rate; Korea: overnight call rate; Indonesia: rate used as a reference for sale of bills; Malaysia: overnight policy rate; Philippines: overnight borrowing or reverse repurchase rate; Thailand: one-day repurchase rate
Chart 1.26 CPI Inflation: Northeast Asia
-2-101234567
2006 2007
YOY
% G
row
th
Hong Kong Taiw anKorea China
Oct
Source: CEIC
Chart 1.28 Policy Rates:
Selected Central Banks in Northeast Asia
2
3
4
5
6
7
8
Jan Mar May Jul Sep Nov2007
% P
er A
nnum
Hong Kong Taiw anKorea China
Source: CEIC

Financial Stability Review, December 2007
Monetary Authority of Singapore Macroeconomic Surveillance Department
14
1.3 Singapore Economy
Singapore’s underlying economic conditions have remained supported despite headwinds
from the external environment The Singapore economy was in a strong position at the half-year mark, expanding by 7.6% compared to the same period last year. (Chart 1.30) The expansion was broad-based, with particularly rapid growth in “asset market-related” activities. Wealth advisory and capital market activities benefited from the buoyant investment climate in the Asian region, while property-related activities were boosted by the upturn in the domestic property market. These asset market-related activities alone contributed almost 30% to GDP growth in H1, up from 16% last year. Growth in the Singapore economy slowed to 4.3% on a sequential basis in Q3, according to the Ministry of Trade and Industry’s (MTI’s) preliminary estimates. Asset market-related activities saw a pullback, reflecting in part the adverse impact of the global financial market turmoil, which was triggered by problems in the US subprime mortgage sector. At the same time, there was some slowing in domestic consumption due to the latest hike in the Goods and Services Tax (GST). However, other drivers of growth such as the marine engineering and pharmaceutical industries provided firm support to the economy. More recently, despite the continuing volatility in global financial markets, underlying activity in the domestic economy has remained generally resilient. MTI has narrowed its full-year GDP growth forecast for 2007 from 7.0-8.0% to 7.5-8.0% with growth likely to be closer to the upper end of this range. The external outlook for 2008 is more uncertain. The housing sector-induced weakening of the US economy will weigh somewhat on the global and hence Singapore’s growth outlook. There will also be lingering caution arising from further bouts of volatility in the global financial markets as well as from higher oil prices. Against this backdrop, the Singapore economy is expected to ease to a growth rate of 4.5-
Chart 1.30 Singapore’s GDP Growth
-15
-10
-5
0
5
10
15
20
25
2000 2002 2004 2006
Per C
ent
YOY % Grow th QOQ SAAR
2007Q3
Source: Department of Statistics

Financial Stability Review, December 2007
Monetary Authority of Singapore Macroeconomic Surveillance Department
15
6.5% in 2008. The slower growth largely reflects the anticipated short-term weakness in external demand, particularly in the first half of the year. With the impact from the US housing sector slowdown expected to be moderate and temporary, the rest of the world economy should remain generally healthy. The global IT industry is also beginning to see firmer signs of a turnaround. GDP growth is thus expected to pick up in H2 2008. Alongside the strong economic expansion, employment gains in the first nine months of 2007 hit 171,500, already close to the all-time high of 176,000 for the whole of 2006. (Chart 1.31) As a consequence, the headline (seasonally-adjusted) unemployment rate fell to 1.7% in Q3, the lowest in almost 10 years.
Chart 1.31 Total Employment and Employment
Changes
-50
0
50
100
150
200
1995 1998 2001 2004 2007
Thou
sand
1400
1600
1800
2000
2200
2400
2600
2800
Thou
sand
Employment ChangesEmployment (RHS)
Q1-Q3
Source: Ministry of Manpower
Domestic CPI inflation was benign in H1 2007
but picked up after the GST hike in July On the inflation front, the consumer price index (CPI) rose by an average of 2.7% in Q3 2007, compared to 1.0% in 2006. (Chart 1.32) This can be attributed to three factors: the one-off impact of the GST hike, the rise in global food and oil prices, and domestic cost pressures especially wage and rental increases, against strong growth in the economy. The sources of price pressures are likely to persist in 2008. In addition, the continued impact of the GST and the revision in the Annual Value (AV) of HDB flats will affect the inflation number next year.1 Accordingly, headline CPI inflation is projected to come in at around 2% in 2007, and 3.5-4.5% in 2008. The MAS underlying inflation measure, which excludes accommodation and private road transport components of the CPI, is forecast to come in at 1.5-2.5% in 2008.
MAS continued its policy of a modest and gradual appreciation of the S$NEER band, but
with a slightly steeper slope MAS announced in its Monetary Policy Statement (MPS) of 10 October 2007 that it would continue with
Chart 1.32
CPI Inflation
-1.5-1.0-0.50.00.51.01.52.02.53.0
2000 2002 2004 2006
YOY
% G
row
th
2007Q3
Source: Department of Statistics
Chart 1.33 Movement in S$NEER
99.099.5
100.0100.5101.0101.5102.0102.5103.0103.5
Apr Jul Nov Mar Jun
Inde
x (7
Apr
200
6 =
100) Appreciation
Depreciation
Oct2006 2007
Source: MAS Note: -- indicates release of Monetary Policy Statement
1 The AV of HDB flats refers to the expected annual rental to be paid for renting public housing.

Financial Stability Review, December 2007
Monetary Authority of Singapore Macroeconomic Surveillance Department
16
the policy of a modest and gradual appreciation of the S$NEER policy band, but the slope of the band would be increased slightly. (Chart 1.33) There was no re-centring of the policy band, or any change in its width. This recommendation took into account the emergence of a positive output gap in the economy and attendant pick-up in inflationary pressures.

Financial Stability Review, December 2007
Monetary Authority of Singapore Macroeconomic Surveillance Department
17
2 NON-FINANCIAL SECTOR 2.1 Non-financial Corporate Sector2 Lending to non-financial firms forms an important component of the Singapore banking sector’s balance sheet, accounting for about half of domestic non-bank loans. Strong economic growth has translated into healthy liquidity and profit positions for Singapore firms. Their sources of revenue have widened, with more firms expanding overseas and into new markets. Firms have also achieved a diversified funding base, as discussed in Box Item A.
Singapore firms have broadened sources of revenue over the years
The pace of growth in firms’ overseas investment had slowed during the 2002-2003 period. However, improving economic conditions since then have reversed this trend, with direct investment abroad as a proportion of local firms’ assets increasing since 2002. Overseas revenue has also grown strongly vis-à-vis domestic revenue (Chart 2.1), including in non-traditional markets such as the Middle East, which was the fourth fastest-growing overseas revenue market in 20063.
Benefits of strong economic growth have been diffused within and across sub-sectors, lifting
all boats Profitability has continued to improve for all sub-sectors. Construction firms, which have the lowest profitability historically, saw their return on assets (ROA) rise sharply to 5.1% in Q2 2007 from 1.4% in Q2 2006. (Chart 2.2) Leverage in most sub-sectors has remained stable, with property firms maintaining the highest debt-to-equity ratio in Q2 2007, at 71%. Hotels and restaurants have reduced leverage significantly compared to a year earlier. (Chart 2.3)
Chart 2.1 Sources of Revenue of Top-50 Singapore-
Listed Firms
020406080
100120140160180
2004 2005 2006
S$ B
illio
n
Singapore Overseas
Source: Bloomberg
Chart 2.2
Return on Assets (Median)
0
2
4
6
8
10
12
2003Q4 2004Q4 2005Q4 2006Q4
Per C
ent
Tpt, Storage & Comms PropertyM ulti-Industry M anufacturingHotels & Rest CommerceConstruction
2007Q2
Source: Thomson Financial
Chart 2.3 Leverage Ratio* (Median)
01020304050607080
2003Q4 2004Q4 2005Q4 2006Q4
Per C
ent
Tpt, Storage & Comms PropertyM ulti-Industry M anufacturingHotels & Rest CommerceConstruction
2007Q2
Source: Thomson Financial * Debt-to-Equity
2 All corporate data cover listed companies only. The latest data point provided is Q2 2007 as most of the companies that are
not required to do quarterly reporting tend to report in Q2 and Q4 of each year only. 3 “Singapore International 100 Ranking – Latest Results Unveiled”, press release by IE Singapore on 10 July 2007, on the top
100 overseas revenue earners among Singaporean firms.
Financial Stability Review, December 2007
Monetary Authority of Singapore Macroeconomic Surveillance Department
18
The combination of improved ROAs and decreased or stable leverage ratios have been reflected in healthy interest coverage ratios. (Chart 2.4) However, the interest coverage ratio for the property sub-sector needs to be interpreted with care given the prevalence of deferred payment schemes 4 where revenue earned in accounting terms might well precede cashflows. These payment schemes were withdrawn at end October.
Firms have maintained strong liquidity positions, with current ratios remaining well above 1.0 in Q2 2007. (Chart 2.5) The lowest current ratio was in the transport, storage & communications sub-sector, at 1.4. The property sub-sector registered a jump in its current ratio from 2.1 in Q4 2006 to 3.9 in Q2 2007, in part attributable to a shift from short- to long-term debt.
The previous FSR noted that there were fewer vulnerable firms in terms of both high leverage (debt-to-equity above 100%) and low liquidity (current ratio below 1.0) in 2005, compared to 2000. The number of vulnerable firms remained low in Q2 2007. (Table 2.1) Additionally, the proportion of firms which are vulnerable based on all three measures of leverage, interest coverage and liquidity has declined. According to a survey by DP Information, 77% of SMEs have current ratios equal to or above the average of the overall corporate sector. The corresponding figure for the interest coverage ratio was 66%. These appear to indicate that the majority of SMEs have also maintained healthy balance sheets vis-à-vis listed firms.
Probability of default or of encountering financial difficulties has remained low
Chart 2.4 Interest Coverage Ratio* (Median)
0
5
10
15
20
2003Q4 2004Q4 2005Q4 2006Q4
Rat
io
Tpt, Storage & Comms PropertyM ulti-Industry M anufacturingHotels & Rest CommerceConstruction
2007Q2
Source: Thomson Financial * Earnings before interest and tax divided by interest expense
Chart 2.5
Current Ratio* (Median)
0.81.21.62.02.42.83.23.64.0
2003Q4 2004Q4 2005Q4 2006Q4
Rat
io
Tpt, Storage & Comms PropertyM ulti-Industry M anufacturingHotels & Rest CommerceConstruction
2007Q2
Source: Thomson Financial * Current assets divided by current liabilities
Table 2.1
Percentage of Firms in Vulnerable Financial Situations
Percent of Firms with 2005 2006 Q2 2007
Leverage Ratio > 100% 13.6% 14.1% 14.9% Interest Cover < 1 22.5% 16.4% 12.4% Current Ratio < 1 14.0% 14.5% 12.2% Leverage Ratio > 100% & Current Ratio < 1 4.3% 4.6% 3.9%
All 3 Conditions 3.0% 2.4% 1.9%
Source: Thomson Financial, MSD estimates One way of summarising the various pieces of information on a firm’s default risk is the Altman Z-score5. A higher score indicates a lower likelihood of
4 The deferred payment scheme allows buyers to buy a property by paying only a 10 or 20% downpayment, with the rest due
upon completion. 5 Z-score = 1.2 X1 + 1.4 X2 + 3.3 X3 + 0.6 X4 + 0.999 X5 where X1 is working capital / total assets, X2 is retained earnings / total
assets, X3 is earnings before interest and taxes / total assets, X4 is market value of equity / book value of liabilities, X5 is sales/total assets. Coefficients estimated in a study on US firms.
Financial Stability Review, December 2007
Monetary Authority of Singapore Macroeconomic Surveillance Department
19
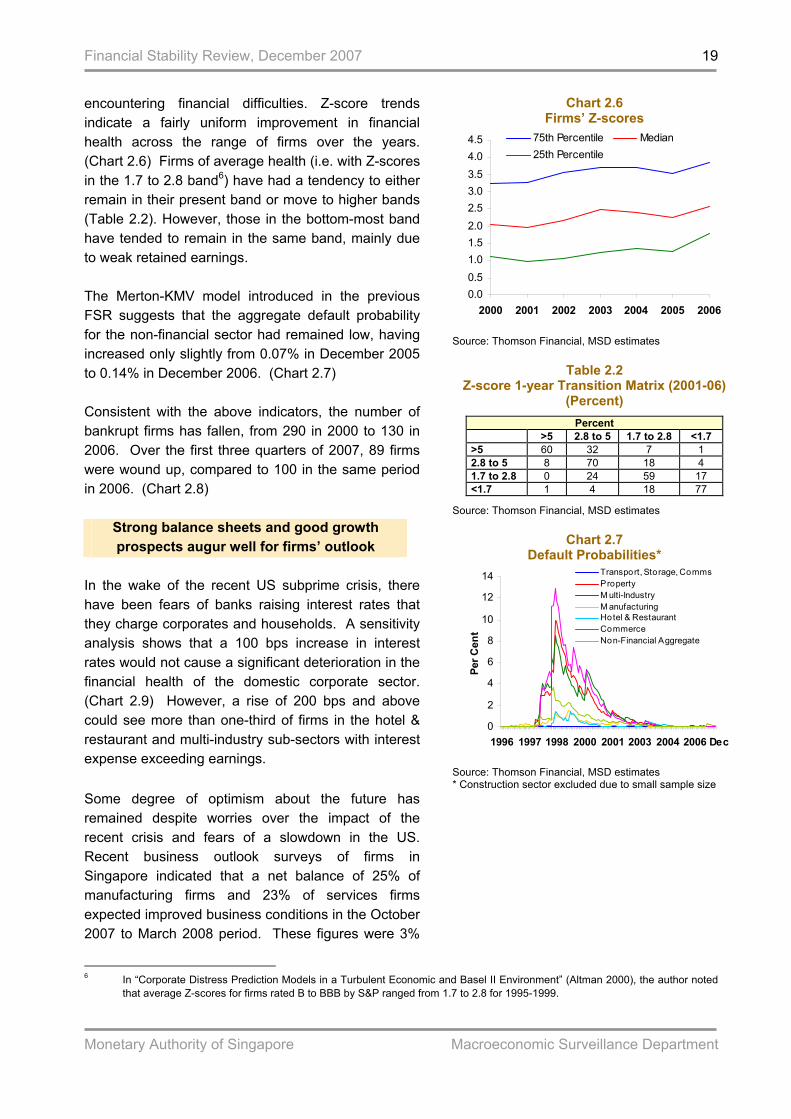
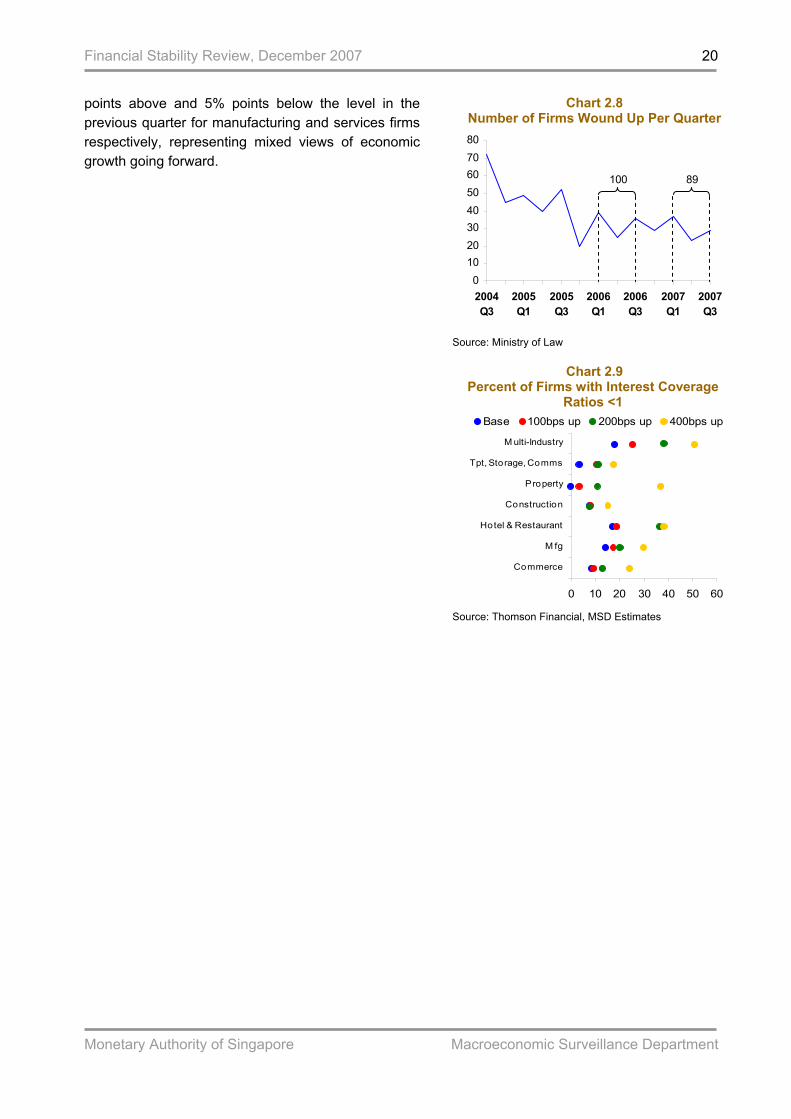
encountering financial difficulties. Z-score trends indicate a fairly uniform improvement in financial health across the range of firms over the years. (Chart 2.6) Firms of average health (i.e. with Z-scores in the 1.7 to 2.8 band6) have had a tendency to either remain in their present band or move to higher bands (Table 2.2). However, those in the bottom-most band have tended to remain in the same band, mainly due to weak retained earnings. The Merton-KMV model introduced in the previous FSR suggests that the aggregate default probability for the non-financial sector had remained low, having increased only slightly from 0.07% in December 2005 to 0.14% in December 2006. (Chart 2.7) Consistent with the above indicators, the number of bankrupt firms has fallen, from 290 in 2000 to 130 in 2006. Over the first three quarters of 2007, 89 firms were wound up, compared to 100 in the same period in 2006. (Chart 2.8)
Strong balance sheets and good growth prospects augur well for firms’ outlook
In the wake of the recent US subprime crisis, there have been fears of banks raising interest rates that they charge corporates and households. A sensitivity analysis shows that a 100 bps increase in interest rates would not cause a significant deterioration in the financial health of the domestic corporate sector. (Chart 2.9) However, a rise of 200 bps and above could see more than one-third of firms in the hotel & restaurant and multi-industry sub-sectors with interest expense exceeding earnings.
Chart 2.6 Firms’ Z-scores
0.00.51.01.52.02.53.03.54.04.5
2000 2001 2002 2003 2004 2005 2006
75th Percentile Median25th Percentile
Source: Thomson Financial, MSD estimates
Table 2.2
Z-score 1-year Transition Matrix (2001-06) (Percent)
Percent >5 2.8 to 5 1.7 to 2.8 <1.7 >5 60 32 7 1 2.8 to 5 8 70 18 4 1.7 to 2.8 0 24 59 17 <1.7 1 4 18 77
Source: Thomson Financial, MSD estimates
Chart 2.7 Default Probabilities*
0
2
4
6
8
10
12
14
1996 1997 1998 2000 2001 2003 2004 2005
Per C
ent
Transport, Storage, CommsPropertyM ulti-IndustryM anufacturingHotel & RestaurantCommerceNon-Financial Aggregate
2006 Dec
Source: Thomson Financial, MSD estimates * Construction sector excluded due to small sample size
Some degree of optimism about the future has remained despite worries over the impact of the recent crisis and fears of a slowdown in the US. Recent business outlook surveys of firms in Singapore indicated that a net balance of 25% of manufacturing firms and 23% of services firms expected improved business conditions in the October 2007 to March 2008 period. These figures were 3%
6 In “Corporate Distress Prediction Models in a Turbulent Economic and Basel II Environment” (Altman 2000), the author noted
that average Z-scores for firms rated B to BBB by S&P ranged from 1.7 to 2.8 for 1995-1999.
Financial Stability Review, December 2007
Monetary Authority of Singapore Macroeconomic Surveillance Department
20
points above and 5% points below the level in the previous quarter for manufacturing and services firms respectively, representing mixed views of economic growth going forward.
Chart 2.8 Number of Firms Wound Up Per Quarter
01020304050607080
2004Q3
2005Q1
2005Q3
2006Q1
2006Q3
2007Q1
2007Q3
100 89
Source: Ministry of Law
Chart 2.9 Percent of Firms with Interest Coverage
Ratios <1
0 10 20 30 40 50 60
Commerce
M fg
Hotel & Restaurant
Construction
Property
Tpt, Storage, Comms
M ulti-Industry
Base 100bps up 200bps up 400bps up
Source: Thomson Financial, MSD Estimates
Financial Stability Review, December 2007
Monetary Authority of Singapore Macroeconomic Surveillance Department
21
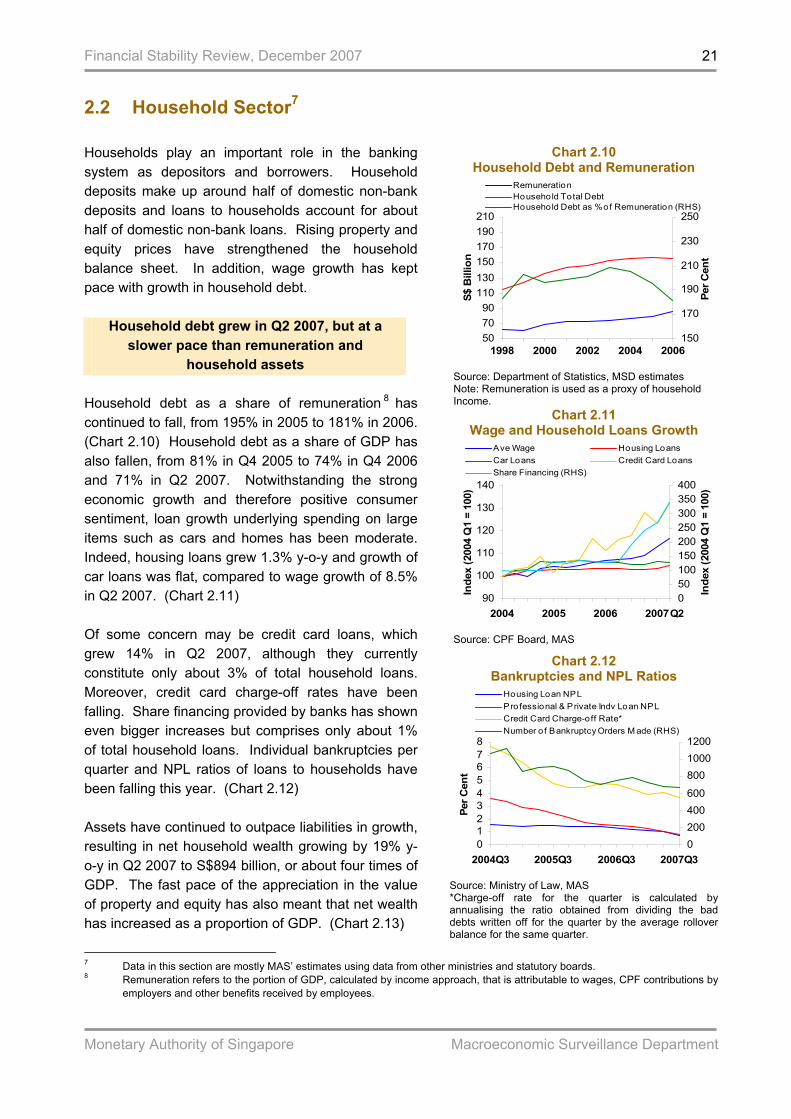
2.2 Household Sector7 Households play an important role in the banking system as depositors and borrowers. Household deposits make up around half of domestic non-bank deposits and loans to households account for about half of domestic non-bank loans. Rising property and equity prices have strengthened the household balance sheet. In addition, wage growth has kept pace with growth in household debt.
Household debt grew in Q2 2007, but at a slower pace than remuneration and
household assets Household debt as a share of remuneration 8 has continued to fall, from 195% in 2005 to 181% in 2006. (Chart 2.10) Household debt as a share of GDP has also fallen, from 81% in Q4 2005 to 74% in Q4 2006 and 71% in Q2 2007. Notwithstanding the strong economic growth and therefore positive consumer sentiment, loan growth underlying spending on large items such as cars and homes has been moderate. Indeed, housing loans grew 1.3% y-o-y and growth of car loans was flat, compared to wage growth of 8.5% in Q2 2007. (Chart 2.11) Of some concern may be credit card loans, which grew 14% in Q2 2007, although they currently constitute only about 3% of total household loans. Moreover, credit card charge-off rates have been falling. Share financing provided by banks has shown even bigger increases but comprises only about 1% of total household loans. Individual bankruptcies per quarter and NPL ratios of loans to households have been falling this year. (Chart 2.12) Assets have continued to outpace liabilities in growth, resulting in net household wealth growing by 19% y-o-y in Q2 2007 to S$894 billion, or about four times of GDP. The fast pace of the appreciation in the value of property and equity has also meant that net wealth has increased as a proportion of GDP. (Chart 2.13)
Chart 2.10 Household Debt and Remuneration
507090
110130150170190210
1998 2000 2002 2004 2006
S$ B
illio
n
150
170
190
210
230
250
Per C
ent
RemunerationHousehold Total DebtHousehold Debt as % of Remuneration (RHS)
Source: Department of Statistics, MSD estimates Note: Remuneration is used as a proxy of household Income.
Chart 2.11 Wage and Household Loans Growth
90
100
110
120
130
140
2004 2005 2006 2007
Inde
x (2
004
Q1
= 10
0)
050100150200250300350400
Inde
x (2
004
Q1
= 10
0)
Ave Wage Housing LoansCar Loans Credit Card LoansShare Financing (RHS)
Q2
Source: CPF Board, MAS
Chart 2.12 Bankruptcies and NPL Ratios
012345678
2004Q3 2005Q3 2006Q3 2007Q3
Per C
ent
0200400600
80010001200
Housing Loan NPLProfessional & Private Indv Loan NPLCredit Card Charge-off Rate*Number o f Bankruptcy Orders M ade (RHS)
Source: Ministry of Law, MAS *Charge-off rate for the quarter is calculated by annualising the ratio obtained from dividing the bad debts written off for the quarter by the average rollover balance for the same quarter.
7 Data in this section are mostly MAS’ estimates using data from other ministries and statutory boards. 8 Remuneration refers to the portion of GDP, calculated by income approach, that is attributable to wages, CPF contributions by
employers and other benefits received by employees.
Financial Stability Review, December 2007
Monetary Authority of Singapore Macroeconomic Surveillance Department
22
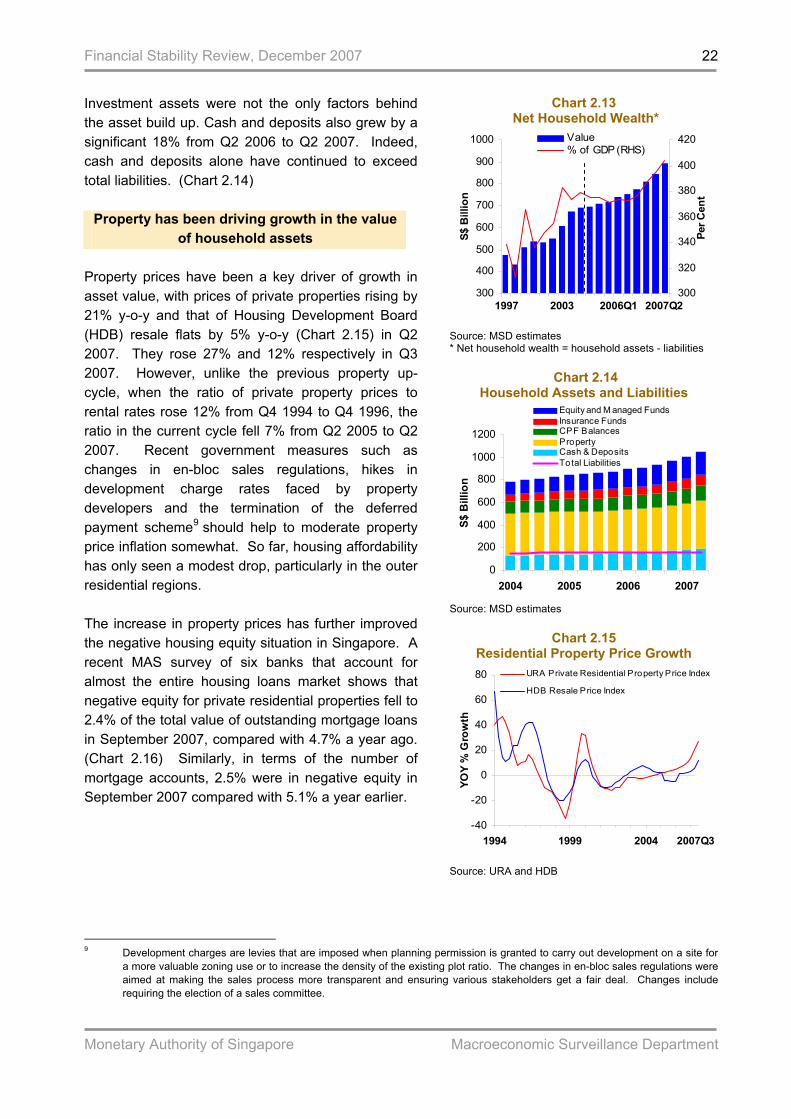
Investment assets were not the only factors behind the asset build up. Cash and deposits also grew by a significant 18% from Q2 2006 to Q2 2007. Indeed, cash and deposits alone have continued to exceed total liabilities. (Chart 2.14)
Property has been driving growth in the value of household assets
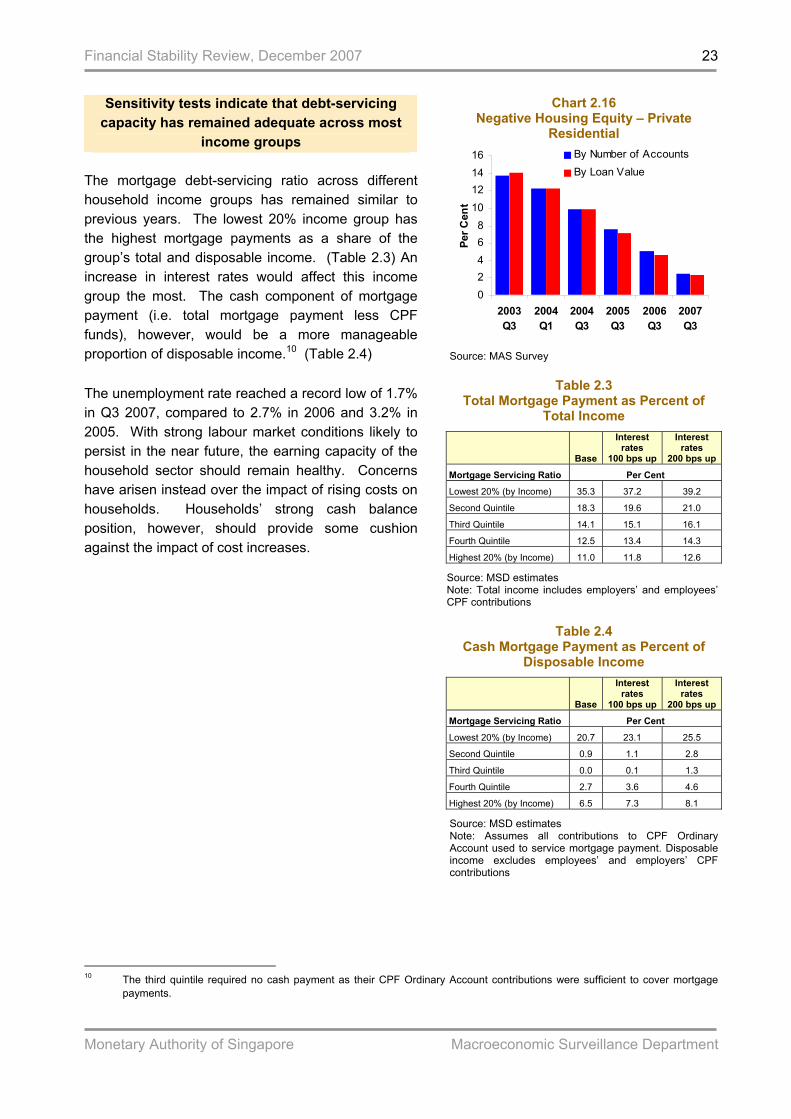
Property prices have been a key driver of growth in asset value, with prices of private properties rising by 21% y-o-y and that of Housing Development Board (HDB) resale flats by 5% y-o-y (Chart 2.15) in Q2 2007. They rose 27% and 12% respectively in Q3 2007. However, unlike the previous property up-cycle, when the ratio of private property prices to rental rates rose 12% from Q4 1994 to Q4 1996, the ratio in the current cycle fell 7% from Q2 2005 to Q2 2007. Recent government measures such as changes in en-bloc sales regulations, hikes in development charge rates faced by property developers and the termination of the deferred payment scheme9 should help to moderate property price inflation somewhat. So far, housing affordability has only seen a modest drop, particularly in the outer residential regions. The increase in property prices has further improved the negative housing equity situation in Singapore. A recent MAS survey of six banks that account for almost the entire housing loans market shows that negative equity for private residential properties fell to 2.4% of the total value of outstanding mortgage loans in September 2007, compared with 4.7% a year ago. (Chart 2.16) Similarly, in terms of the number of mortgage accounts, 2.5% were in negative equity in September 2007 compared with 5.1% a year earlier.
Chart 2.13 Net Household Wealth*
300
400
500
600
700
800
900
1000
1997 2003 2006Q1
S$ B
illio
n
300
320
340
360
380
400
420
Per C
ent
Value% of GDP (RHS)
2007Q2
Source: MSD estimates * Net household wealth = household assets - liabilities
Chart 2.14
Household Assets and Liabilities
0
200
400
600
800
1000
1200
2004 2005 2006 2007
S$ B
illio
n
Equity and M anaged FundsInsurance FundsCPF BalancesPropertyCash & DepositsTotal Liabilities
Source: MSD estimates
Chart 2.15 Residential Property Price Growth
-40
-20
0
20
40
60
80
1994 1999 2004
YOY
% G
row
th
URA Private Residential Property Price Index
HDB Resale Price Index
2007Q3
Source: URA and HDB
9 Development charges are levies that are imposed when planning permission is granted to carry out development on a site for
a more valuable zoning use or to increase the density of the existing plot ratio. The changes in en-bloc sales regulations were aimed at making the sales process more transparent and ensuring various stakeholders get a fair deal. Changes include requiring the election of a sales committee.
Financial Stability Review, December 2007
Monetary Authority of Singapore Macroeconomic Surveillance Department
23
Sensitivity tests indicate that debt-servicing capacity has remained adequate across most
income groups The mortgage debt-servicing ratio across different household income groups has remained similar to previous years. The lowest 20% income group has the highest mortgage payments as a share of the group’s total and disposable income. (Table 2.3) An increase in interest rates would affect this income group the most. The cash component of mortgage payment (i.e. total mortgage payment less CPF funds), however, would be a more manageable proportion of disposable income.10 (Table 2.4) The unemployment rate reached a record low of 1.7% in Q3 2007, compared to 2.7% in 2006 and 3.2% in 2005. With strong labour market conditions likely to persist in the near future, the earning capacity of the household sector should remain healthy. Concerns have arisen instead over the impact of rising costs on households. Households’ strong cash balance position, however, should provide some cushion against the impact of cost increases.
Chart 2.16 Negative Housing Equity – Private
Residential
02468
10121416
2003Q3
2004Q1
2004Q3
2005Q3
2006Q3
2007Q3
Per C
ent
By Number of AccountsBy Loan Value
Source: MAS Survey
Table 2.3 Total Mortgage Payment as Percent of
Total Income
Base
Interest rates
100 bps up
Interest rates
200 bps up
Mortgage Servicing Ratio Per Cent
Lowest 20% (by Income) 35.3 37.2 39.2
Second Quintile 18.3 19.6 21.0
Third Quintile 14.1 15.1 16.1
Fourth Quintile 12.5 13.4 14.3
Highest 20% (by Income) 11.0 11.8 12.6
Source: MSD estimates Note: Total income includes employers’ and employees’ CPF contributions
Table 2.4
Cash Mortgage Payment as Percent of Disposable Income
Base
Interest rates
100 bps up
Interest rates
200 bps up
Mortgage Servicing Ratio Per Cent
Lowest 20% (by Income) 20.7 23.1 25.5
Second Quintile 0.9 1.1 2.8
Third Quintile 0.0 0.1 1.3
Fourth Quintile 2.7 3.6 4.6
Highest 20% (by Income) 6.5 7.3 8.1
Source: MSD estimates Note: Assumes all contributions to CPF Ordinary Account used to service mortgage payment. Disposable income excludes employees’ and employers’ CPF contributions
10 The third quintile required no cash payment as their CPF Ordinary Account contributions were sufficient to cover mortgage
payments.
Financial Stability Review, December 2007
Monetary Authority of Singapore Macroeconomic Surveillance Department
24
Box A Firms’ Sources of Funding
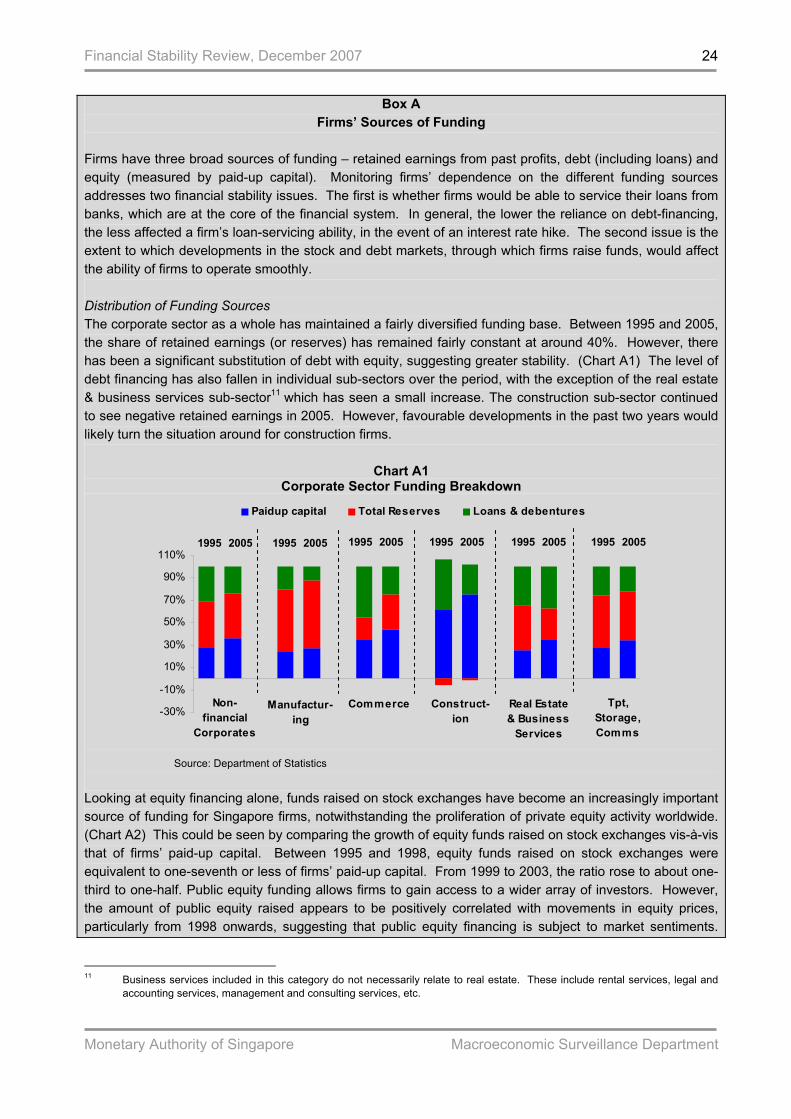
Firms have three broad sources of funding – retained earnings from past profits, debt (including loans) and equity (measured by paid-up capital). Monitoring firms’ dependence on the different funding sources addresses two financial stability issues. The first is whether firms would be able to service their loans from banks, which are at the core of the financial system. In general, the lower the reliance on debt-financing, the less affected a firm’s loan-servicing ability, in the event of an interest rate hike. The second issue is the extent to which developments in the stock and debt markets, through which firms raise funds, would affect the ability of firms to operate smoothly. Distribution of Funding Sources The corporate sector as a whole has maintained a fairly diversified funding base. Between 1995 and 2005, the share of retained earnings (or reserves) has remained fairly constant at around 40%. However, there has been a significant substitution of debt with equity, suggesting greater stability. (Chart A1) The level of debt financing has also fallen in individual sub-sectors over the period, with the exception of the real estate & business services sub-sector11 which has seen a small increase. The construction sub-sector continued to see negative retained earnings in 2005. However, favourable developments in the past two years would likely turn the situation around for construction firms.
Chart A1 Corporate Sector Funding Breakdown
-30%
-10%
10%
30%
50%
70%
90%
110%
Paidup capital Total Reserves Loans & debentures
Manufactur-ing
CommerceNon-financial
Corporates
Construct-ion
Real Estate & Business
Services
Tpt, Storage, Comms
1995 2005 1995 2005 1995 2005 1995 20051995 20051995 2005
Source: Department of Statistics
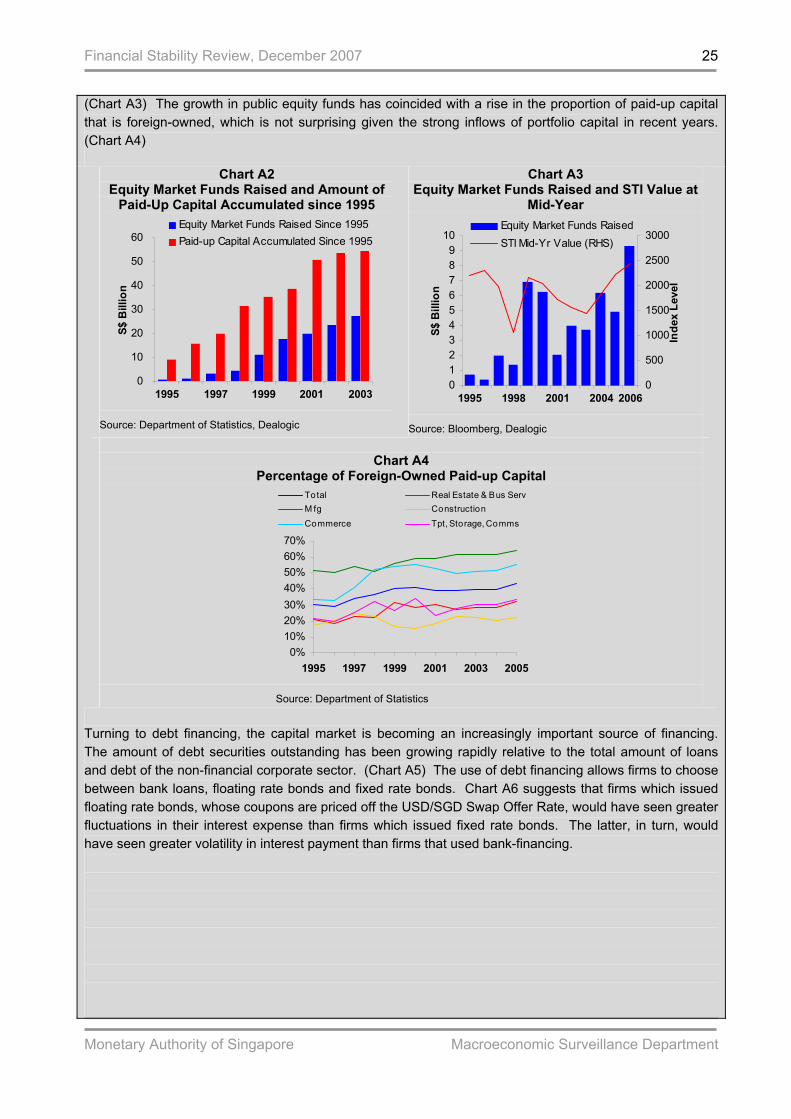
Looking at equity financing alone, funds raised on stock exchanges have become an increasingly important source of funding for Singapore firms, notwithstanding the proliferation of private equity activity worldwide. (Chart A2) This could be seen by comparing the growth of equity funds raised on stock exchanges vis-à-vis that of firms’ paid-up capital. Between 1995 and 1998, equity funds raised on stock exchanges were equivalent to one-seventh or less of firms’ paid-up capital. From 1999 to 2003, the ratio rose to about one-third to one-half. Public equity funding allows firms to gain access to a wider array of investors. However, the amount of public equity raised appears to be positively correlated with movements in equity prices, particularly from 1998 onwards, suggesting that public equity financing is subject to market sentiments.
11 Business services included in this category do not necessarily relate to real estate. These include rental services, legal and
accounting services, management and consulting services, etc.
Financial Stability Review, December 2007
Monetary Authority of Singapore Macroeconomic Surveillance Department
25
(Chart A3) The growth in public equity funds has coincided with a rise in the proportion of paid-up capital that is foreign-owned, which is not surprising given the strong inflows of portfolio capital in recent years. (Chart A4)
Chart A2 Equity Market Funds Raised and Amount of
Paid-Up Capital Accumulated since 1995
0
10
20
30
40
50
60
1995 1997 1999 2001 2003
S$ B
illio
n
Equity Market Funds Raised Since 1995Paid-up Capital Accumulated Since 1995
Source: Department of Statistics, Dealogic
Chart A3 Equity Market Funds Raised and STI Value at
Mid-Year
0123456789
10
1995 1998 2001 2004
S$ B
illio
n
0
500
1000
1500
2000
2500
3000
Inde
x Le
vel
Equity Market Funds RaisedSTI Mid-Yr Value (RHS)
2006
Source: Bloomberg, Dealogic
Chart A4 Percentage of Foreign-Owned Paid-up Capital
0%10%20%30%40%50%60%70%
1995 1997 1999 2001 2003 2005
Total Real Estate & Bus ServM fg ConstructionCommerce Tpt, Storage, Comms
Source: Department of Statistics
Turning to debt financing, the capital market is becoming an increasingly important source of financing. The amount of debt securities outstanding has been growing rapidly relative to the total amount of loans and debt of the non-financial corporate sector. (Chart A5) The use of debt financing allows firms to choose between bank loans, floating rate bonds and fixed rate bonds. Chart A6 suggests that firms which issued floating rate bonds, whose coupons are priced off the USD/SGD Swap Offer Rate, would have seen greater fluctuations in their interest expense than firms which issued fixed rate bonds. The latter, in turn, would have seen greater volatility in interest payment than firms that used bank-financing.

Financial Stability Review, December 2007
Monetary Authority of Singapore Macroeconomic Surveillance Department
26
Chart A5
Debt Securities Outstanding and Total Loans and Debt
0
30
60
90
1995 1997 1999 2001 2003
S$ B
illio
n
Debt Securities OutstandingTotal Loans & Debt
Source: Department of Statistics, Thomson Financial, MSD Estimates
Chart A6 Borrowing Costs
0
1
2
3
4
5
6
7
2000 2001 2002 2003 2004 2005
Per C
ent
Ave Prime Lending Rate6 mo USD/SGD Swap Offer Rate
Ave Yields on Issued SGD Debt > 3yr M aturity
Source: Bloomberg, CEIC, Thomson Financial, MSD Estimates
Funding Duration Short term loans as a share of total debt has decreased for the non-financial corporate sector, from 58% in 1995 to 40% in 2005, suggesting less liquidity risk. (Chart A7) The construction sub-sector has remained an outlier, with short-tem loans accounting for around 70% of total debt. Nevertheless, this is offset by a sufficient level of short-term assets, as evident from the sub-sector’s current ratio of around one. (Chart A8)
Chart A7 Short Term Loans as a Percentage of Total
Loans and Debentures
0%
20%
40%
60%
80%
100%
1995 1997 1999 2001 2003 2005
Total M fgConstruction Commerce
Real Estate & Bus Serv Tpt, Storage, Comms
Source: Department of Statistics
Chart A8 Current Ratio*
0.4
0.6
0.8
1.0
1.2
1.4
1.6
1995 1997 1999 2001 2003 2005
Cur
rent
Rat
io (x
)
Total M fg
Construction Commerce
Real Estate & Bus Serv Tpt, Storage, Comms
Source: Department of Statistics * Current assets divided by current liabilities

Financial Stability Review, December 2007
Monetary Authority of Singapore Macroeconomic Surveillance Department
27
3 FINANCIAL SECTOR 3.1 Banking Sector Banking sector assets account for over 90% of Singapore’s financial sector assets. The commercial banking sector is made up of Domestic Banking Units (DBUs) and Asian Currency Units (ACUs). Reflecting Singapore’s position as an international financial centre, the ACU component has continued to dominate the banking system. (Table 3.1) In particular, the interbank segment of ACU accounts for more than half of banking assets, as many foreign banks in Singapore play the role of funding centre for their banking groups. Notwithstanding turbulent financial markets in H2 2007, growth of DBU non-bank loans remained strong and continued to outpace GDP growth. (Chart 3.1) Concomitantly, DBU interbank lending expanded strongly, and together with ACU non-bank loans, contributed 7.8% points to overall loans growth of 13% in January-September this year. (Chart 3.2) August 2007 marked the unravelling of the US subprime mortgage problems, with volatility in global financial markets and liquidity crunches in the US and Europe interbank markets. Despite the small US subprime and ABS exposures, Singapore and the rest of Asia saw a sharp sell off in equities and currencies, and a widening of credit spreads during the period. The local banks’ share prices recovered in October before plunging again in November. In recent weeks, their CDS spreads hovered between 20-80 bps above the pre-turmoil levels. For the year to date, the local banks have reported additional provisioning and mark-to-market losses of S$434 million for their CDO portfolios. A renewal of risk aversion could have a further impact on the local banks’ profitability via trading losses, further write-downs on CDO assets or reduced fee income as customer trading activity diminishes. In addition, interest income may decline should a US recession
Table 3.1 Banking System: Domestic Banking
Units (DBUs) and Asian Currency Units (ACUs)
Sep 1997 Sep 2007 Interbank Loans (S$ billion)
ACU 428 623 DBU 75 130
Non-Bank Loans (S$ billion) ACU 257 239 DBU 139 219
- Of which Household Loans 45 102 Corporate Loans 94 117
Source: MAS
Chart 3.1 DBU Non-Bank Loan and GDP Growth
-4-202468
101214
2003 2004 2005 2006 2007
YOY
% G
row
thSingapore GDPDBU Non-Bank Loan
Q3
Source: MAS, Department of Statistics
Chart 3.2 Components of Loan Growth*
-202468
1012141618
Sep2005
Jan2006
May2006
Sep2006
Jan2007
May2007
Sep2007
% P
oint
Con
trib
utio
n
DBU Nonbank DBU InterbankACU Nonbank ACU Interbank
Source: MAS * Interbank components consist of net lending (loans minus deposits) to residents and gross lending to non-resident banks

Financial Stability Review, December 2007
Monetary Authority of Singapore Macroeconomic Surveillance Department
28
materialise and dampen loan demand.
Robust domestic and overseas economic activity has supported ACU lending
The robust pace of economic activity at home and abroad since the start of the year has supported the growth of overall ACU lending, which reached a peak of 14% in September 2007. Contributing to the growth in ACU non-bank loans in January-September 2007 was the pick up in lending to the non-bank sectors in Europe and the “Others” region, but non-bank lending to East Asia and Americas generally saw slower growth. (Chart 3.3) The slower growth in non-bank lending to Americas was due mainly to some banks shifting from interbank lending to lending to non-bank intermediaries in 2006, the effect of which washed out in 2007. ACU interbank lending saw the highest growth to banks in Europe and the US. On the whole, Singapore banks have remained largely a net lender in the ACU interbank market but a net borrower in the ACU non-bank market. (Chart 3.4)
On the domestic front, loans to corporates registered the sixteenth consecutive month of double digit growth in September, driven mainly by the Building & Construction (B&C) sector. Loans to corporates contributed 7.3% points to growth of DBU non-bank loans for the first nine months of the year. (Chart 3.5) Loans to households grew significantly in Q3. As the property boom spreads to the mass market, the banking system’s overall property exposure has increased further. While the rise in banks’ property exposure has been driven mainly by loans to property-related firms, loans to individuals for investment purposes have also increased of late. (Chart 3.6) However, the ratio of banks’ property exposure as computed in accordance with Section 35 of the Banking Act has remained below the
Loans to corporates have been growing strongly for more than a year while loans to
households grew significantly in Q3
Chart 3.3 ACU Non-Bank Loans by Region
-505
101520253035
Sep2005
Jan2006
May2006
Sep2006
Jan2007
May2007
Sep2007
% P
oint
Con
trib
utio
n
Others EuropeEast Asia Americas
Source: MAS
Chart 3.4 ACU Lending to / Deposits from Non-
Residents
800600400200
0200400600800
1000
Sep2005
Jan2006
May2006
Sep2006
Jan2007
May2007
Sep2007
S$ B
illio
n
Interbank Lending Non-Bank LendingInterbank Deposits Non-Bank Deposits
Source: MAS
Chart 3.5 DBU Non-Bank Loans by Sector
-202468
1012
Sep2005
Jan2006
May2006
Sep2006
Jan2007
May2007
Sep2007
% P
oint
Con
tribu
tion
Manufacturing Building&ConstGeneral Commerce Trans,Stor&CommBusiness Services Non-Bank FIHousing & Prof & Priv Individuals Others
Source: MAS
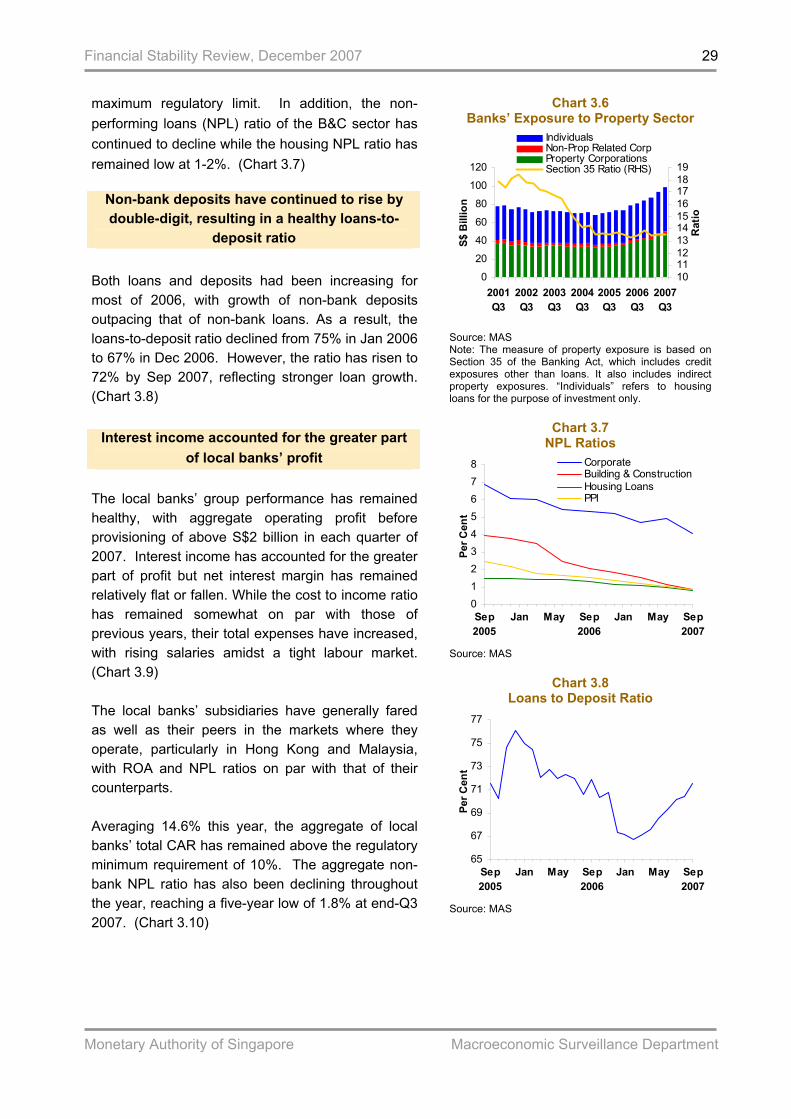
Financial Stability Review, December 2007
Monetary Authority of Singapore Macroeconomic Surveillance Department
29
maximum regulatory limit. In addition, the non-performing loans (NPL) ratio of the B&C sector has continued to decline while the housing NPL ratio has remained low at 1-2%. (Chart 3.7)
Both loans and deposits had been increasing for most of 2006, with growth of non-bank deposits outpacing that of non-bank loans. As a result, the loans-to-deposit ratio declined from 75% in Jan 2006 to 67% in Dec 2006. However, the ratio has risen to 72% by Sep 2007, reflecting stronger loan growth. (Chart 3.8)
The local banks’ group performance has remained healthy, with aggregate operating profit before provisioning of above S$2 billion in each quarter of 2007. Interest income has accounted for the greater part of profit but net interest margin has remained relatively flat or fallen. While the cost to income ratio has remained somewhat on par with those of previous years, their total expenses have increased, with rising salaries amidst a tight labour market. (Chart 3.9) The local banks’ subsidiaries have generally fared as well as their peers in the markets where they operate, particularly in Hong Kong and Malaysia, with ROA and NPL ratios on par with that of their counterparts. Averaging 14.6% this year, the aggregate of local banks’ total CAR has remained above the regulatory minimum requirement of 10%. The aggregate non-bank NPL ratio has also been declining throughout the year, reaching a five-year low of 1.8% at end-Q3 2007. (Chart 3.10)
Non-bank deposits have continued to rise by double-digit, resulting in a healthy loans-to-
deposit ratio
Interest income accounted for the greater part of local banks’ profit
Chart 3.6 Banks’ Exposure to Property Sector
0
20
40
60
80
100
120
2001Q3
2002Q3
2003Q3
2004Q3
2005Q3
2006Q3
2007Q3
S$ B
illio
n
10111213141516171819
Rat
io
IndividualsNon-Prop Related CorpProperty CorporationsSection 35 Ratio (RHS)
Source: MAS Note: The measure of property exposure is based on Section 35 of the Banking Act, which includes credit exposures other than loans. It also includes indirect property exposures. “Individuals” refers to housing loans for the purpose of investment only.
Chart 3.7
NPL Ratios
012345678
Sep2005
Jan2006
May2006
Sep2006
Jan2007
May2007
Sep2007
Per C
ent
CorporateBuilding & ConstructionHousing LoansPPI
Source: MAS
Chart 3.8 Loans to Deposit Ratio
65
67
69
71
73
75
77
Sep2005
Jan2006
May2006
Sep2006
Jan2007
May2007
Sep2007
Per C
ent
Source: MAS
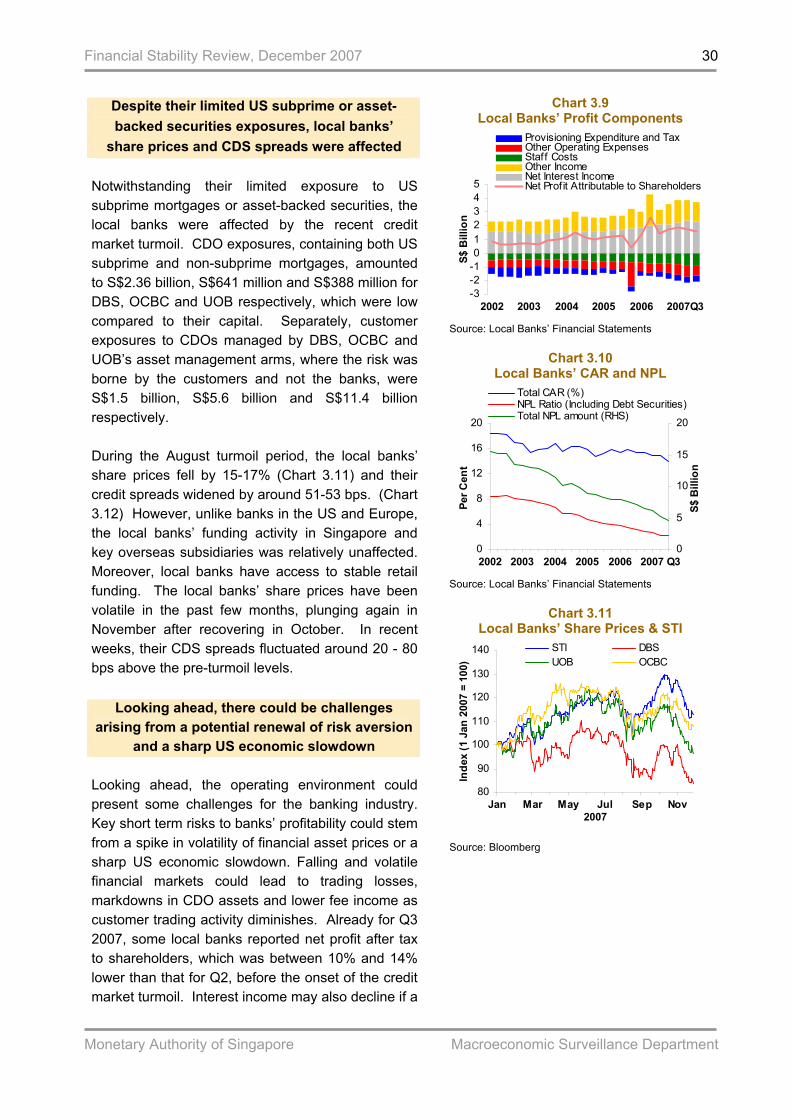
Financial Stability Review, December 2007
Monetary Authority of Singapore Macroeconomic Surveillance Department
30
Notwithstanding their limited exposure to US subprime mortgages or asset-backed securities, the local banks were affected by the recent credit market turmoil. CDO exposures, containing both US subprime and non-subprime mortgages, amounted to S$2.36 billion, S$641 million and S$388 million for DBS, OCBC and UOB respectively, which were low compared to their capital. Separately, customer exposures to CDOs managed by DBS, OCBC and UOB’s asset management arms, where the risk was borne by the customers and not the banks, were S$1.5 billion, S$5.6 billion and S$11.4 billion respectively. During the August turmoil period, the local banks’ share prices fell by 15-17% (Chart 3.11) and their credit spreads widened by around 51-53 bps. (Chart 3.12) However, unlike banks in the US and Europe, the local banks’ funding activity in Singapore and key overseas subsidiaries was relatively unaffected. Moreover, local banks have access to stable retail funding. The local banks’ share prices have been volatile in the past few months, plunging again in November after recovering in October. In recent weeks, their CDS spreads fluctuated around 20 - 80 bps above the pre-turmoil levels.
Looking ahead, the operating environment could present some challenges for the banking industry. Key short term risks to banks’ profitability could stem from a spike in volatility of financial asset prices or a sharp US economic slowdown. Falling and volatile financial markets could lead to trading losses, markdowns in CDO assets and lower fee income as customer trading activity diminishes. Already for Q3 2007, some local banks reported net profit after tax to shareholders, which was between 10% and 14% lower than that for Q2, before the onset of the credit market turmoil. Interest income may also decline if a
Despite their limited US subprime or asset-backed securities exposures, local banks’
share prices and CDS spreads were affected
Looking ahead, there could be challenges arising from a potential renewal of risk aversion
and a sharp US economic slowdown
Chart 3.9 Local Banks’ Profit Components
-3-2-1012345
2002 2003 2004 2005 2006 2007
S$ B
illio
n
Provisioning Expenditure and TaxOther Operating ExpensesStaff CostsOther IncomeNet Interest IncomeNet Profit Attributable to Shareholders
Q3
Source: Local Banks’ Financial Statements
Chart 3.10 Local Banks’ CAR and NPL
0
4
8
12
16
20
2002 2003 2004 2005 2006 2007
Per C
ent
0
5
10
15
20
S$ B
illio
n
Total CAR (%)NPL Ratio (Including Debt Securities)Total NPL amount (RHS)
Q3
Source: Local Banks’ Financial Statements
Chart 3.11 Local Banks’ Share Prices & STI
80
90
100
110
120
130
140
Jan Mar May Jul Sep Nov2007
Inde
x (1
Jan
200
7 =
100)
STI DBSUOB OCBC
Source: Bloomberg
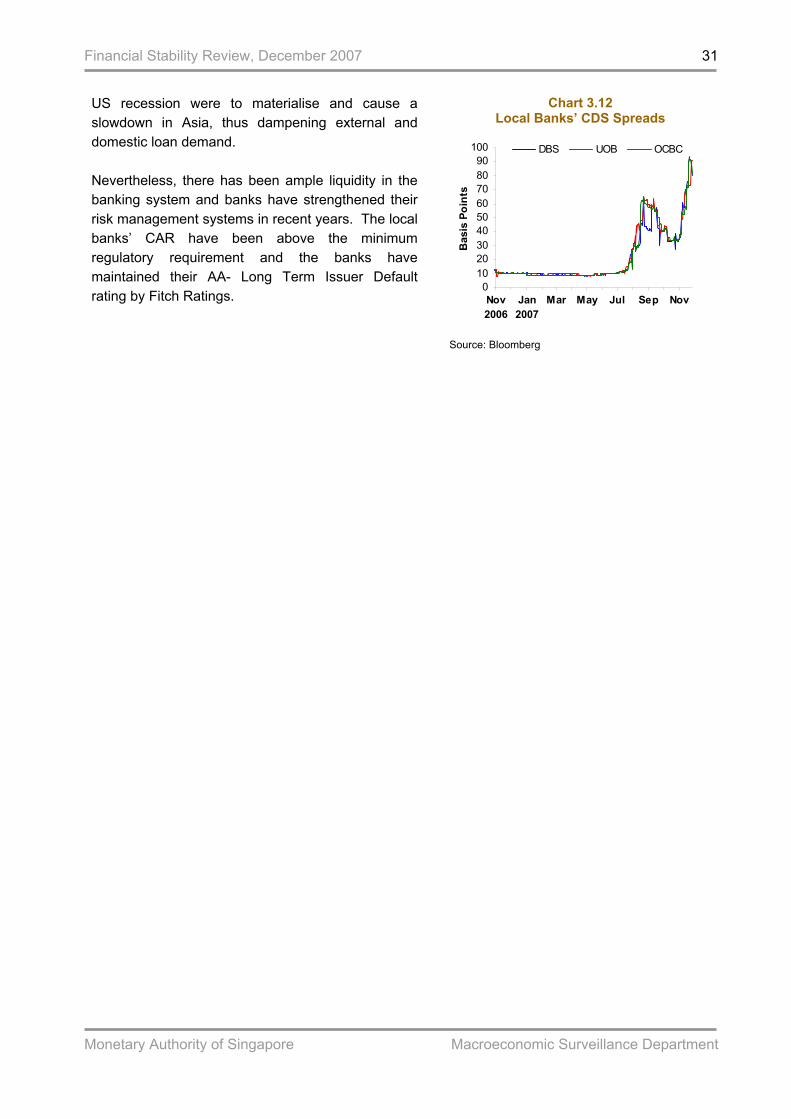
Financial Stability Review, December 2007
Monetary Authority of Singapore Macroeconomic Surveillance Department
31
US recession were to materialise and cause a slowdown in Asia, thus dampening external and domestic loan demand. Nevertheless, there has been ample liquidity in the banking system and banks have strengthened their risk management systems in recent years. The local banks’ CAR have been above the minimum regulatory requirement and the banks have maintained their AA- Long Term Issuer Default rating by Fitch Ratings.
Chart 3.12 Local Banks’ CDS Spreads
0102030405060708090
100
Nov2006
Jan2007
Mar2007
May2007
Jul2007
Sep2007
Nov2007
Bas
is P
oint
s
DBS UOB OCBC
Source: Bloomberg

Financial Stability Review, December 2007
Monetary Authority of Singapore Macroeconomic Surveillance Department
32
3.2 Insurance Sector The insurance industry accounts for about 6% of Singapore’s financial sector assets and about 13% of its value-added. The industry has grown rapidly in recent years. For the year 2006, general direct insurance premiums amounted to S$2.85 billion and general reinsurance premiums amounted to S$2.15 billion, while life insurance premiums (new business) amounted to S$8.11 billion. (Table 3.2) There are 85 insurers in Singapore, excluding captive insurers. Each insurer in Singapore conducts its domestic business through the Singapore Insurance Fund (SIF), and its overseas business through the Offshore Insurance Fund (OIF). Of the two, the SIF is the dominant fund in terms of asset size for both life and general direct insurers. Hence, the performance of the SIF has greater significance for the health of the domestic financial sector. Both life and general insurance industries have remained well-capitalised and saw good growth in premiums throughout 2007. Strong balance sheets, adequate risk-based reserving, limited exposure to the US subprime market and prudent investments have helped the insurance industry to weather the recent US subprime-related turmoil. Investment income has contributed significantly to the overall profits of life and general insurers. However, volatility in the financial markets poses downside risks to investment income. Therefore, underwriting new insurance business, without compromising on underwriting standards, would be important to the industry’s ability to sustain its profitability, especially for general insurance companies.
Table 3.2 Insurance Industry Premiums:
Singapore Insurance Fund (SIF) and Offshore Insurance Fund (OIF)
2006 SIF OIF (S$ million) General Direct Insurance 2,385.9 464.6 General Reinsurance 248.8 1,897.0 Life Insurance (New Premiums) 8,006.1 103.4
Source: MAS
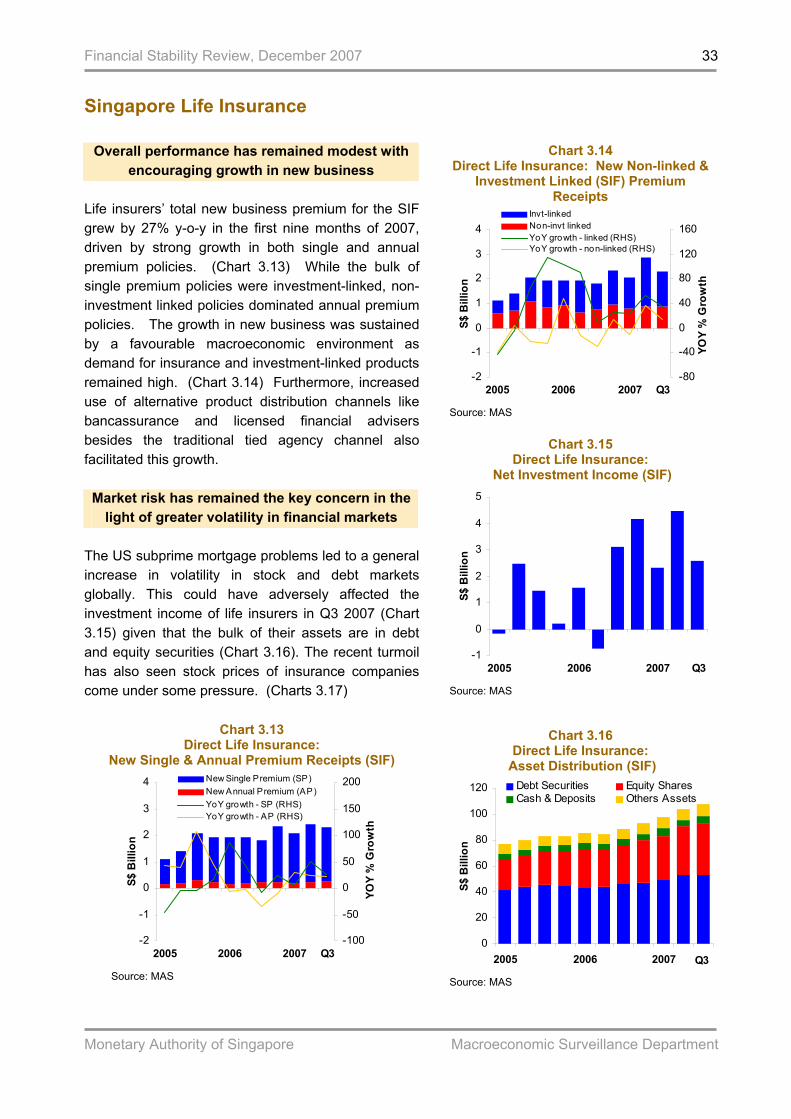
Financial Stability Review, December 2007
Monetary Authority of Singapore Macroeconomic Surveillance Department
33
Singapore Life Insurance
Life insurers’ total new business premium for the SIF grew by 27% y-o-y in the first nine months of 2007, driven by strong growth in both single and annual premium policies. (Chart 3.13) While the bulk of single premium policies were investment-linked, non-investment linked policies dominated annual premium policies. The growth in new business was sustained by a favourable macroeconomic environment as demand for insurance and investment-linked products remained high. (Chart 3.14) Furthermore, increased use of alternative product distribution channels like bancassurance and licensed financial advisers besides the traditional tied agency channel also facilitated this growth. Market risk has remained the key concern in the
light of greater volatility in financial markets The US subprime mortgage problems led to a general increase in volatility in stock and debt markets globally. This could have adversely affected the investment income of life insurers in Q3 2007 (Chart 3.15) given that the bulk of their assets are in debt and equity securities (Chart 3.16). The recent turmoil has also seen stock prices of insurance companies come under some pressure. (Charts 3.17)
Chart 3.13 Direct Life Insurance:
New Single & Annual Premium Receipts (SIF)
-2
-1
0
1
2
3
4
2005 2006 2007
S$ B
illio
n
-100
-50
0
50
100
150
200
YOY
% G
row
th
New Single Premium (SP)New Annual Premium (AP)YoY growth - SP (RHS)YoY growth - AP (RHS)
Q3
Source: MAS
Overall performance has remained modest with encouraging growth in new business
Chart 3.14 Direct Life Insurance: New Non-linked &
Investment Linked (SIF) Premium Receipts
-2
-1
0
1
2
3
4
2005 2006 2007
S$ B
illio
n
-80
-40
0
40
80
120
160
YOY
% G
row
th
Invt-linkedNon-invt linkedYoY growth - linked (RHS)YoY growth - non-linked (RHS)
Q3
Source: MAS
Chart 3.15 Direct Life Insurance:
Net Investment Income (SIF)
-1
0
1
2
3
4
5
2005 2006 2007
S$ B
illio
n
Q3
Source: MAS
Chart 3.16 Direct Life Insurance:
Asset Distribution (SIF)
0
20
40
60
80
100
120
2005 2006 2007
S$ B
illio
n
Debt Securities Equity SharesCash & Deposits Others Assets
Q3
Source: MAS
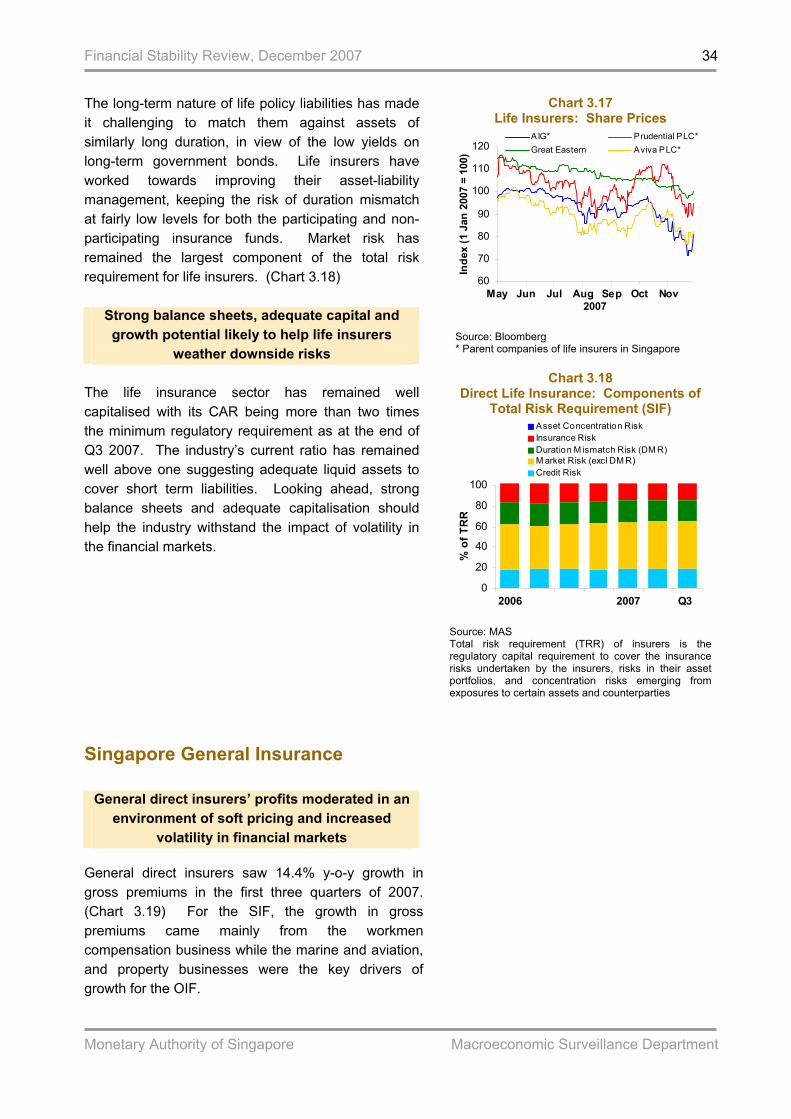
Financial Stability Review, December 2007
Monetary Authority of Singapore Macroeconomic Surveillance Department
34
The long-term nature of life policy liabilities has made it challenging to match them against assets of similarly long duration, in view of the low yields on long-term government bonds. Life insurers have worked towards improving their asset-liability management, keeping the risk of duration mismatch at fairly low levels for both the participating and non-participating insurance funds. Market risk has remained the largest component of the total risk requirement for life insurers. (Chart 3.18)
Strong balance sheets, adequate capital and growth potential likely to help life insurers
weather downside risks The life insurance sector has remained well capitalised with its CAR being more than two times the minimum regulatory requirement as at the end of Q3 2007. The industry’s current ratio has remained well above one suggesting adequate liquid assets to cover short term liabilities. Looking ahead, strong balance sheets and adequate capitalisation should help the industry withstand the impact of volatility in the financial markets.
Chart 3.17 Life Insurers: Share Prices
60
70
80
90
100
110
120
May Jun Jul Aug Sep Oct Nov2007
Inde
x (1
Jan
200
7 =
100)
AIG* Prudential PLC*Great Eastern Aviva PLC*
Source: Bloomberg * Parent companies of life insurers in Singapore
Chart 3.18
Direct Life Insurance: Components of Total Risk Requirement (SIF)
0
20
40
60
80
100
2006 2007
% o
f TR
R
Asset Concentration RiskInsurance RiskDuration M ismatch Risk (DM R)M arket Risk (excl DM R)Credit Risk
Q3
Source: MAS Total risk requirement (TRR) of insurers is the regulatory capital requirement to cover the insurance risks undertaken by the insurers, risks in their asset portfolios, and concentration risks emerging from exposures to certain assets and counterparties
Singapore General Insurance
General direct insurers saw 14.4% y-o-y growth in gross premiums in the first three quarters of 2007.(Chart 3.19) For the SIF, the growth in gross premiums came mainly from the workmen compensation business while the marine and aviation, and property businesses were the key drivers of growth for the OIF.
General direct insurers’ profits moderated in an environment of soft pricing and increased
volatility in financial markets

Financial Stability Review, December 2007
Monetary Authority of Singapore Macroeconomic Surveillance Department
35
However, underwriting profits for the first three quarters were 16.6% lower than a year ago (Chart 3.20), affected by a soft pricing trend across theindustry. While earned premiums grew by about 11% in the first nine months of 2007, incurred claims rose by over 20%, leading to higher incurred loss ratios across the industry. The deterioration in the industry’s overall incurred loss ratio was mainly attributable to the motor business. (Chart 3.21) Despite the weak underwriting results this year, overall profits grew at a modest 3% y-o-y in Jan-Sep 2007,reflecting strong growth in investment income in the first half of the year. (Chart 3.20) The prevailing volatility in the financial markets could adversely affect general insurers’ investment income in the coming quarters.
Maintaining underwriting discipline amid soft market conditions is likely to remain the key
challenge Managing the current down cycle of soft pricing remains the key challenge for general direct insurers. The industry has been bearing a significant proportion of underwriting risks, as reflected in the overall retention ratio (SIF) of close to 70%. Soft pricing requires the insurers to exercise greater discipline and place greater emphasis on underwriting profitability. While market risk remains, general insurers’ adequate capitalisation and low exposure to alternative investments should mitigate the adverse impact of volatility in the financial markets on insurers’ balance sheets. General direct insurers’ investment portfolios have been relatively conservative, dominated by cash, deposits and government securities. (Chart 3.22)They also have adequate liquid assets to cover short-term claim liabilities (Chart 3.23) besides maintaining a CAR of over 200% on average, well above the regulatory minimum of 120%.
Global reinsurance sector enjoys stable outlook General insurers in Singapore reinsure about 30% of their insurance risks, of which about 40% are ceded out to reinsurers in Singapore. The majority of reinsurers in Singapore are subsidiaries or branches of global reinsurers. Rating agencies such as Fitch
Chart 3.19 General Direct Insurance: Gross Premiums
(SIF & OIF)
-200
0
200
400
600
800
1000
2005 2006 2007
S$ M
illio
n
-20
0
20
40
60
80
100
YOY
% G
row
th
OIFSIFYoY growth (%) - OIF (RHS)YoY growth (%) - SIF (RHS)
Q3
Source: MAS
Chart 3.20 General Direct Insurance: Underwriting Results & Investment Income (SIF & OIF)
-100
0
100
200
300
400
2005 2006 2007
S$ M
illio
n
-100
0
100
200
300
400
YOY
% G
row
th
Underwriting (UW)Net Invt Income (NII)YoY growth (%) - UW (RHS)YoY growth (%) - NII (RHS)
Q3Source: MAS
Chart 3.21
General Direct Insurance: Incurred Loss Ratios (SIF)
(incurred claims / earned premiums)
0
20
40
60
80
100
120
2005 2006 2007
Per C
ent
M ar & Av - Cargo M ar & Av - H&LFire M otorWorkman Com Total
Q3
Source: MAS

Financial Stability Review, December 2007
Monetary Authority of Singapore Macroeconomic Surveillance Department
36
are not expecting significant rating changes for the major global reinsurers for the rest of this year and early 2008. Year-to-date rating changes have seen more upgrades than downgrades, reflecting the global reinsurance industry’s strong balance sheets and good performance. (Chart 3.24) Reinsurers have recapitalised themselves after the losses incurred in 2005 due to natural catastrophes and this year’s catastrophic losses have remained contained so far. This stable outlook, however, is subject to downside risks of sudden catastrophic losses, significant investment losses due to a sharp fall in asset prices, or prolonged soft pricing affecting underwriting results.
Chart 3.22 General Direct Insurance:
Asset Distribution (SIF+OIF)
0123456789
2005 2006 2007
S$ B
illio
n
Debt Securities Equity Securities
Cash & Deposits Others
Q3
Source: MAS
Chart 3.23 General Direct Insurance:
Claims Liquidity Ratio (liquid assets / short-term claims liabilities)
150
200
250
300
2006 2007
Per C
ent
SIF+OIF SIF OIF
Q3
Source: MAS
Chart 3.24 Changes in Fitch Ratings of Global
Reinsurers
01020304050607080
2003 2004 2005 2006 2007(ytd)
Per C
ent
Dow ngrades Upgrades Aff irmations
Source: Fitch Ratings
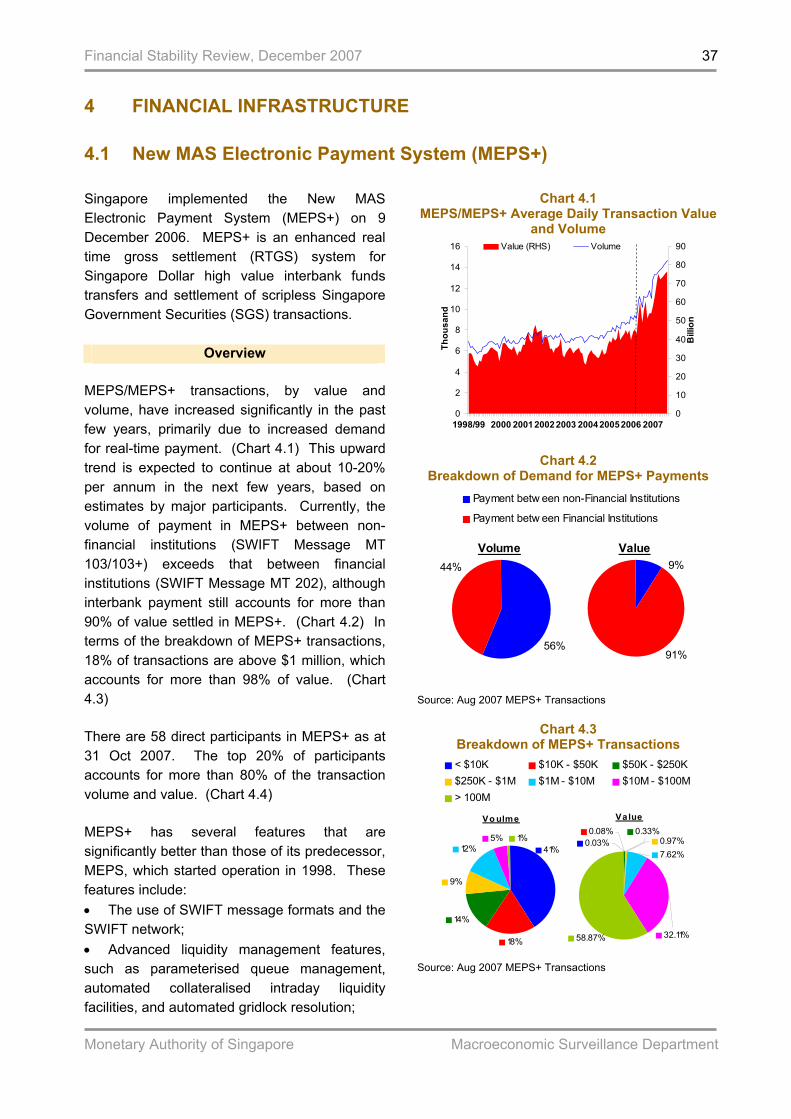
Financial Stability Review, December 2007
Monetary Authority of Singapore Macroeconomic Surveillance Department
37
4 FINANCIAL INFRASTRUCTURE 4.1 New MAS Electronic Payment System (MEPS+) Singapore implemented the New MAS Electronic Payment System (MEPS+) on 9 December 2006. MEPS+ is an enhanced real time gross settlement (RTGS) system for Singapore Dollar high value interbank funds transfers and settlement of scripless Singapore Government Securities (SGS) transactions.
Overview MEPS/MEPS+ transactions, by value and volume, have increased significantly in the past few years, primarily due to increased demand for real-time payment. (Chart 4.1) This upward trend is expected to continue at about 10-20% per annum in the next few years, based on estimates by major participants. Currently, the volume of payment in MEPS+ between non-financial institutions (SWIFT Message MT 103/103+) exceeds that between financial institutions (SWIFT Message MT 202), although interbank payment still accounts for more than 90% of value settled in MEPS+. (Chart 4.2) In terms of the breakdown of MEPS+ transactions, 18% of transactions are above $1 million, which accounts for more than 98% of value. (Chart 4.3) There are 58 direct participants in MEPS+ as at 31 Oct 2007. The top 20% of participants accounts for more than 80% of the transaction volume and value. (Chart 4.4) MEPS+ has several features that are significantly better than those of its predecessor, MEPS, which started operation in 1998. These features include: • The use of SWIFT message formats and the SWIFT network; • Advanced liquidity management features, such as parameterised queue management, automated collateralised intraday liquidity facilities, and automated gridlock resolution;
Chart 4.1 MEPS/MEPS+ Average Daily Transaction Value
and Volume
0
2
4
6
8
10
12
14
16
1998/99 2000 200120022003 200420052006 2007
Thou
sand
0
10
20
30
40
50
60
70
80
90
Bill
ion
Value (RHS) Volume
Chart 4.2 Breakdown of Demand for MEPS+ Payments
44%
56%
Payment betw een non-Financial Institutions
Payment betw een Financial Institutions
9%
91%
Volume Value
Source: Aug 2007 MEPS+ Transactions
Chart 4.3
Breakdown of MEPS+ Transactions
18%
14%
9%
12%5% 1%
41%
< $10K $10K - $50K $50K - $250K$250K - $1M $1M - $10M $10M - $100M> 100M
0.08% 0.33%0.97%7.62%
0.03%
58.87% 32.11%
Vo ulme Value
Source: Aug 2007 MEPS+ Transactions
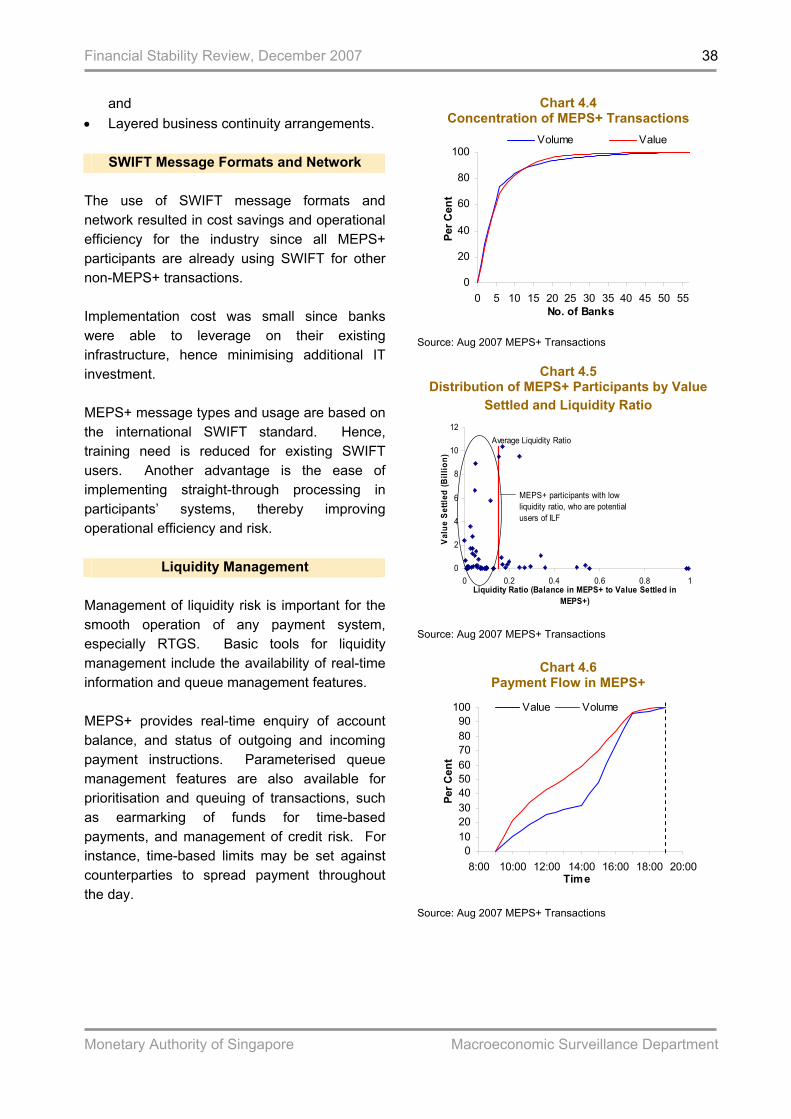
Financial Stability Review, December 2007
Monetary Authority of Singapore Macroeconomic Surveillance Department
38
and • Layered business continuity arrangements.
SWIFT Message Formats and Network The use of SWIFT message formats and network resulted in cost savings and operational efficiency for the industry since all MEPS+ participants are already using SWIFT for other non-MEPS+ transactions. Implementation cost was small since banks were able to leverage on their existing infrastructure, hence minimising additional IT investment. MEPS+ message types and usage are based on the international SWIFT standard. Hence, training need is reduced for existing SWIFT users. Another advantage is the ease of implementing straight-through processing in participants’ systems, thereby improving operational efficiency and risk.
Liquidity Management Management of liquidity risk is important for the smooth operation of any payment system, especially RTGS. Basic tools for liquidity management include the availability of real-time information and queue management features. MEPS+ provides real-time enquiry of account balance, and status of outgoing and incoming payment instructions. Parameterised queue management features are also available for prioritisation and queuing of transactions, such as earmarking of funds for time-based payments, and management of credit risk. For instance, time-based limits may be set against counterparties to spread payment throughout the day.
Chart 4.4 Concentration of MEPS+ Transactions
0
20
40
60
80
100
0 5 10 15 20 25 30 35 40 45 50 55No. of Banks
Per C
ent
Volume Value
Source: Aug 2007 MEPS+ Transactions
Chart 4.5
Distribution of MEPS+ Participants by Value Settled and Liquidity Ratio
0
2
4
6
8
10
12
0 0.2 0.4 0.6 0.8 1Liquidity Ratio (Balance in MEPS+ to Value Settled in
MEPS+)
Val
ue S
ettle
d (B
illio
n)Average Liquidity Ratio
MEPS+ participants with low liquidity ratio, who are potential users of ILF
Source: Aug 2007 MEPS+ Transactions
Chart 4.6 Payment Flow in MEPS+
0102030405060708090
100
8:00 10:00 12:00 14:00 16:00 18:00 20:00Time
Per C
ent
Value Volume
Source: Aug 2007 MEPS+ Transactions
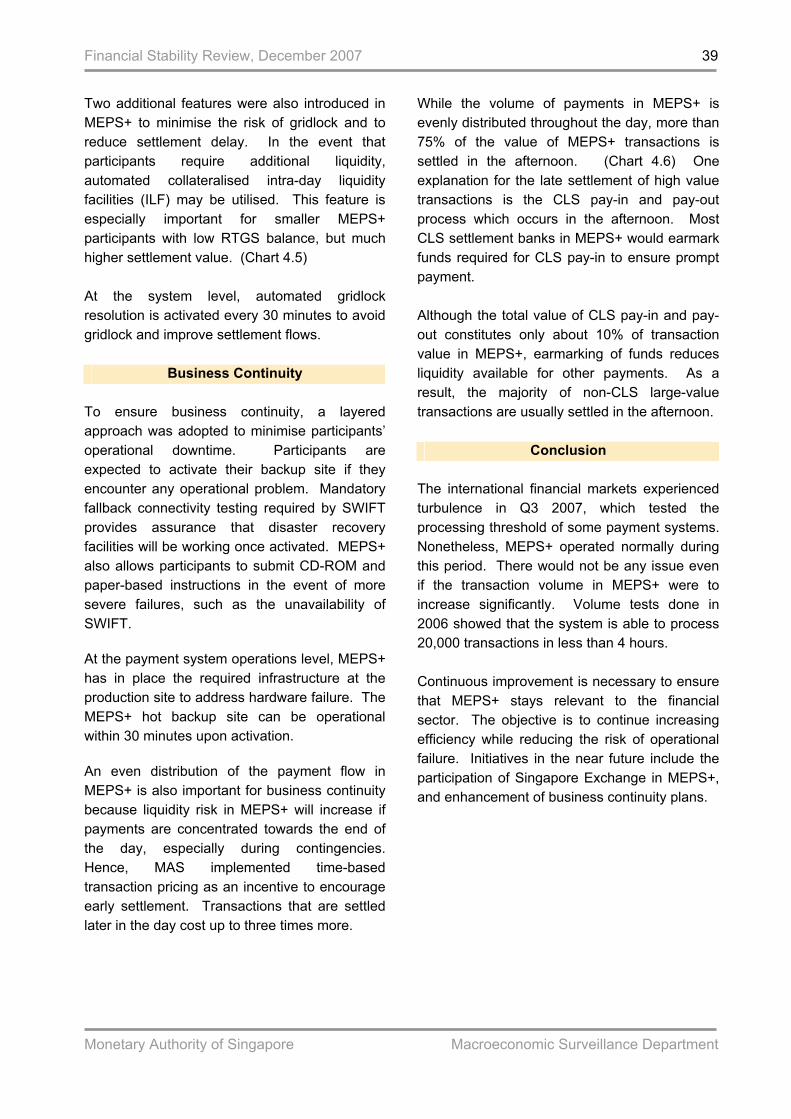
Financial Stability Review, December 2007
Monetary Authority of Singapore Macroeconomic Surveillance Department
39
Two additional features were also introduced in MEPS+ to minimise the risk of gridlock and to reduce settlement delay. In the event that participants require additional liquidity, automated collateralised intra-day liquidity facilities (ILF) may be utilised. This feature is especially important for smaller MEPS+ participants with low RTGS balance, but much higher settlement value. (Chart 4.5) At the system level, automated gridlock resolution is activated every 30 minutes to avoid gridlock and improve settlement flows.
Business Continuity To ensure business continuity, a layered approach was adopted to minimise participants’ operational downtime. Participants are expected to activate their backup site if they encounter any operational problem. Mandatory fallback connectivity testing required by SWIFT provides assurance that disaster recovery facilities will be working once activated. MEPS+ also allows participants to submit CD-ROM and paper-based instructions in the event of more severe failures, such as the unavailability of SWIFT.
At the payment system operations level, MEPS+ has in place the required infrastructure at the production site to address hardware failure. The MEPS+ hot backup site can be operational within 30 minutes upon activation.
An even distribution of the payment flow in MEPS+ is also important for business continuity because liquidity risk in MEPS+ will increase if payments are concentrated towards the end of the day, especially during contingencies. Hence, MAS implemented time-based transaction pricing as an incentive to encourage early settlement. Transactions that are settled later in the day cost up to three times more.
While the volume of payments in MEPS+ is evenly distributed throughout the day, more than 75% of the value of MEPS+ transactions is settled in the afternoon. (Chart 4.6) One explanation for the late settlement of high value transactions is the CLS pay-in and pay-out process which occurs in the afternoon. Most CLS settlement banks in MEPS+ would earmark funds required for CLS pay-in to ensure prompt payment. Although the total value of CLS pay-in and pay-out constitutes only about 10% of transaction value in MEPS+, earmarking of funds reduces liquidity available for other payments. As a result, the majority of non-CLS large-value transactions are usually settled in the afternoon.
Conclusion The international financial markets experienced turbulence in Q3 2007, which tested the processing threshold of some payment systems. Nonetheless, MEPS+ operated normally during this period. There would not be any issue even if the transaction volume in MEPS+ were to increase significantly. Volume tests done in 2006 showed that the system is able to process 20,000 transactions in less than 4 hours. Continuous improvement is necessary to ensure that MEPS+ stays relevant to the financial sector. The objective is to continue increasing efficiency while reducing the risk of operational failure. Initiatives in the near future include the participation of Singapore Exchange in MEPS+, and enhancement of business continuity plans.
Financial Stability Review, December 2007
Monetary Authority of Singapore Macroeconomic Surveillance Department
40
5 SPECIAL FEATURE 5.1 Diversification, Default Risk and Contagion in East Asian Banks
Introduction Major structural changes have taken place in East Asia’s banking systems since the Asian Financial Crisis in 1997-98. Deregulation in financial services has become firmly entrenched through privatisation, consolidation, and foreign participation (Mihaljek, 2006). The benefits of embarking on these changes are best reflected in the diversification of risks at the individual bank level. An important source of diversification has been the increased involvement of banks in non-traditional banking activities, which could lead to a reduction in the bankruptcy probability of banks (Laderman, 2000). Nonetheless, empirical findings have remained divided over whether banks could actually garner benefits by expanding to a wider range of activities, essentially shifting away from their traditional intermediation role. Based on a survey of 43 countries around the world, Laeven and Levine (2005) found a diversification discount, with the market having a lower valuation of financial conglomerates that engaged in multiple activities. Similarly, Stiroh and Rumble (2006) showed that the shift to non-interest income activities was associated with higher risks in U.S. banks, which they referred as “the dark side of diversification”. In contrast, Baele et al (2006) who focussed on the European banking sector, found a non-linear negative relationship between diversification and bank-specific risk, suggesting that most European banks were able to reduce their risks through increased diversification.
Few studies have been done for developing economies. This special feature is an attempt to examine the hypothesis of diversification contributing to stronger banking systems in East Asia. With a panel dataset that comprises 73 publicly listed banks in eight East Asian countries, this study finds marked improvement in many East Asian banks, manifested in their lower default risk after the Asian Financial Crisis. More importantly, contagion among banks has decreased significantly in recent years. Subsequent empirical analysis confirms that income diversification has indeed contributed to lower default risk in individual banks. However, diversification does not appear to have reduced the occurrence of extreme shocks to individual banks and contagion among banks.
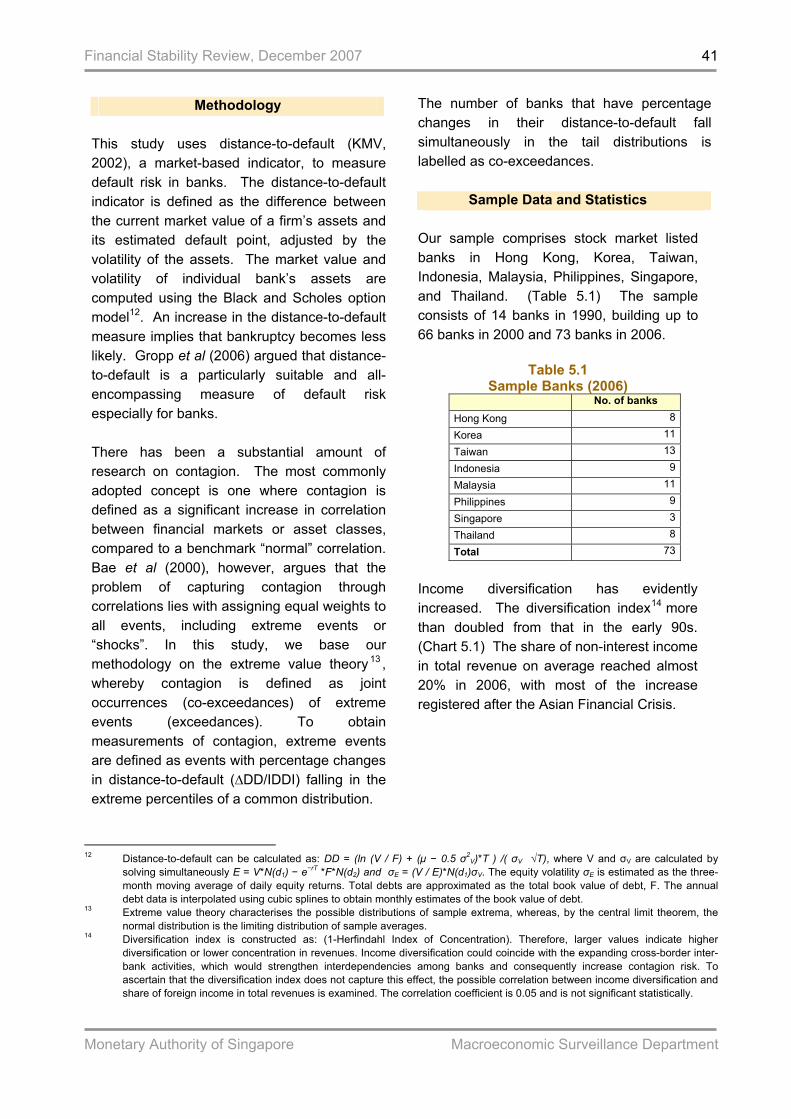
Financial Stability Review, December 2007
Monetary Authority of Singapore Macroeconomic Surveillance Department
41
Methodology This study uses distance-to-default (KMV, 2002), a market-based indicator, to measure default risk in banks. The distance-to-default indicator is defined as the difference between the current market value of a firm’s assets and its estimated default point, adjusted by the volatility of the assets. The market value and volatility of individual bank’s assets are computed using the Black and Scholes option model12. An increase in the distance-to-default measure implies that bankruptcy becomes less likely. Gropp et al (2006) argued that distance-to-default is a particularly suitable and all-encompassing measure of default risk especially for banks. There has been a substantial amount of research on contagion. The most commonly adopted concept is one where contagion is defined as a significant increase in correlation between financial markets or asset classes, compared to a benchmark “normal” correlation. Bae et al (2000), however, argues that the problem of capturing contagion through correlations lies with assigning equal weights to all events, including extreme events or “shocks”. In this study, we base our methodology on the extreme value theory 13 , whereby contagion is defined as joint occurrences (co-exceedances) of extreme events (exceedances). To obtain measurements of contagion, extreme events are defined as events with percentage changes in distance-to-default (∆DD/IDDI) falling in the extreme percentiles of a common distribution.
The number of banks that have percentage changes in their distance-to-default fall simultaneously in the tail distributions is labelled as co-exceedances.
Sample Data and Statistics
Our sample comprises stock market listed banks in Hong Kong, Korea, Taiwan, Indonesia, Malaysia, Philippines, Singapore, and Thailand. (Table 5.1) The sample consists of 14 banks in 1990, building up to 66 banks in 2000 and 73 banks in 2006.
Table 5.1
Sample Banks (2006) No. of banks
Hong Kong 8
Korea 11
Taiwan 13
Indonesia 9
Malaysia 11
Philippines 9
Singapore 3
Thailand 8
Total 73
Income diversification has evidently increased. The diversification index14 more than doubled from that in the early 90s. (Chart 5.1) The share of non-interest income in total revenue on average reached almost 20% in 2006, with most of the increase registered after the Asian Financial Crisis.
12 Distance-to-default can be calculated as: DD = (ln (V / F) + (µ − 0.5 σ2
V)*T ) /( σV √T), where V and σV are calculated by solving simultaneously E = V*N(d1) − e−rT *F*N(d2) and σE = (V / E)*N(d1)σV. The equity volatility σE is estimated as the three-month moving average of daily equity returns. Total debts are approximated as the total book value of debt, F. The annual debt data is interpolated using cubic splines to obtain monthly estimates of the book value of debt.
13 Extreme value theory characterises the possible distributions of sample extrema, whereas, by the central limit theorem, the normal distribution is the limiting distribution of sample averages.
14 Diversification index is constructed as: (1-Herfindahl Index of Concentration). Therefore, larger values indicate higher diversification or lower concentration in revenues. Income diversification could coincide with the expanding cross-border inter-bank activities, which would strengthen interdependencies among banks and consequently increase contagion risk. To ascertain that the diversification index does not capture this effect, the possible correlation between income diversification and share of foreign income in total revenues is examined. The correlation coefficient is 0.05 and is not significant statistically.

Financial Stability Review, December 2007
Monetary Authority of Singapore Macroeconomic Surveillance Department
42
Chart 5.1 Diversification Index (Median)
0.00
0.05
0.10
0.15
0.20
0.25
0.30
0.35
1990 1994 1998 2002 2006
The average distance-to-default has increased or the default risk has receded significantly, even though banking systems suffered another large negative shock in 2000 associated with the burst of the technology “bubble”. (Chart 5.2) The distance-to-default has continued to improve in the past two years, albeit modestly. In general, these developments are consistent with the experiences of the US and Europe (Duggar and Mitra, 2007).
Chart 5.2
Distance-to-Default (Median)
0
5
10
15
20
25
30
35
2000 2001 2002 2003 2004 2005 2006
To examine contagion risk, large shocks are identified as the bottom 15th percentile of the change in monthly distance-to-defaults, from January 2002 to December 2006 15 . Co-exceedances or contagion is defined as the number of banks experiencing a large shock simultaneously in a particular month. The distribution of co-exceedances demonstrates that most occurrences of contagion involve
eight to twelve banks. The same exercise is replicated using the bottom 5th percentile of the distribution, giving much more severe shocks. However, this more severe set of shocks shows that most occurrences of co-exceedances involve only two banks, thus rendering it less meaningful for a study on contagion. The bottom 15th percentile is used in order to have a sufficient sample size. (Chart 5.3)
Chart 5.3
Distribution of Co-exceedances
15%
0123456789
0 4 8 12 16 20 24 28 32Bank
Mon
th
5%
0
5
10
15
20
25
0 4 8 12 16 20 24 28 32Bank
Mon
th
A considerable decline in contagion risk among banks was witnessed over the past three years. The incidence of more than 10 banks experiencing shocks simultaneously has almost halved. (Table 5.2) Corroborating earlier studies, the significant reduction in co-exceedances points to a generally stronger East Asian banking system (Turner, 2007).
15 Since coexceedances must be computed from a balanced panel dataset, they are only available from 2002.
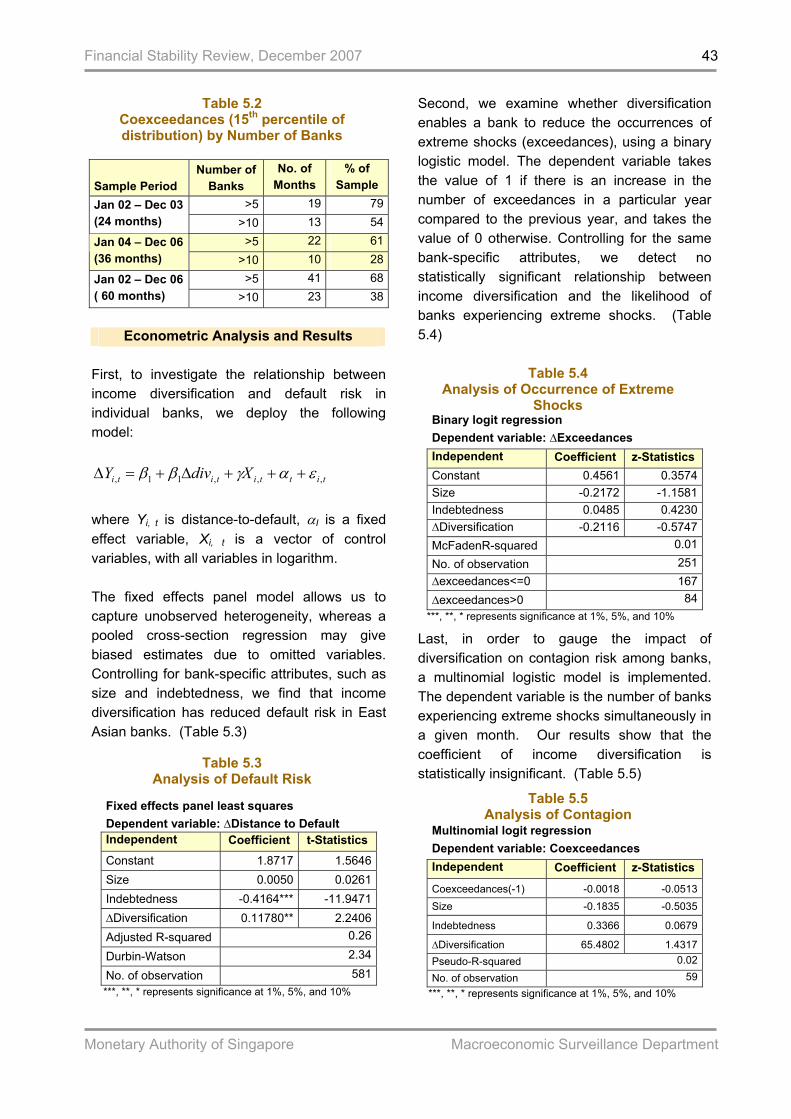
Financial Stability Review, December 2007
Monetary Authority of Singapore Macroeconomic Surveillance Department
43
Table 5.2 Coexceedances (15th percentile of distribution) by Number of Banks
Sample Period Number of
Banks No. of
Months % of
Sample >5 19 79Jan 02 – Dec 03
(24 months) >10 13 54>5 22 61Jan 04 – Dec 06
(36 months) >10 10 28>5 41 68Jan 02 – Dec 06
( 60 months) >10 23 38
Econometric Analysis and Results
First, to investigate the relationship between income diversification and default risk in individual banks, we deploy the following model:
tittititi XdivY ,,,11, εαγββ +++∆+=∆
where Yi, t is distance-to-default, αI is a fixed effect variable, Xi, t is a vector of control variables, with all variables in logarithm. The fixed effects panel model allows us to capture unobserved heterogeneity, whereas a pooled cross-section regression may give biased estimates due to omitted variables. Controlling for bank-specific attributes, such as size and indebtedness, we find that income diversification has reduced default risk in East Asian banks. (Table 5.3)
Table 5.3 Analysis of Default Risk
Fixed effects panel least squares Dependent variable: ∆Distance to Default Independent Coefficient t-Statistics Constant 1.8717 1.5646Size 0.0050 0.0261Indebtedness -0.4164*** -11.9471∆Diversification 0.11780** 2.2406Adjusted R-squared 0.26
Durbin-Watson 2.34
No. of observation 581 ***, **, * represents significance at 1%, 5%, and 10%
Second, we examine whether diversification enables a bank to reduce the occurrences of extreme shocks (exceedances), using a binary logistic model. The dependent variable takes the value of 1 if there is an increase in the number of exceedances in a particular year compared to the previous year, and takes the value of 0 otherwise. Controlling for the same bank-specific attributes, we detect no statistically significant relationship between income diversification and the likelihood of banks experiencing extreme shocks. (Table 5.4)
Table 5.4
Analysis of Occurrence of Extreme Shocks
Binary logit regression Dependent variable: ∆Exceedances Independent Coefficient z-Statistics Constant 0.4561 0.3574Size -0.2172 -1.1581Indebtedness 0.0485 0.4230∆Diversification -0.2116 -0.5747McFadenR-squared 0.01No. of observation 251∆exceedances<=0 167∆exceedances>0 84
***, **, * represents significance at 1%, 5%, and 10%
Last, in order to gauge the impact of diversification on contagion risk among banks, a multinomial logistic model is implemented. The dependent variable is the number of banks experiencing extreme shocks simultaneously in a given month. Our results show that the coefficient of income diversification is statistically insignificant. (Table 5.5)
Table 5.5 Analysis of Contagion
Multinomial logit regression Dependent variable: Coexceedances Independent Coefficient z-Statistics
Coexceedances(-1) -0.0018 -0.0513Size -0.1835 -0.5035
Indebtedness 0.3366 0.0679
∆Diversification 65.4802 1.4317Pseudo-R-squared 0.02
No. of observation 59 ***, **, * represents significance at 1%, 5%, and 10%

Financial Stability Review, December 2007
Monetary Authority of Singapore Macroeconomic Surveillance Department
44
Conclusions This special feature examines the implications of recent financial service deregulation on East Asian banks. More specifically, it explores the linkages between a generally rising trend of income diversification and the overall risk in banking systems. Risks are measured by both distance-to-default in individual banks and contagion among banks. We find that the default risk has declined for East Asian banks since 2000. Also, more recently, contagion risk among regional banks
has receded significantly, as shown in the fewer occurrences of multiple banks experiencing shocks simultaneously. The evidence supports the assessment that East Asian banking system has indeed become more resilient. Furthermore, empirical analysis suggests that income diversification is positively correlated with the lower default risk in many East Asian banks, controlling for bank-specific heterogeneity. However, income diversification does not appear to have exerted any influence on the reduced contagion risk among banks.
References Bae, Kee-Hong., G. Andrew Karolyi, Rene M. Stulz. “A New Approach to Measuring Financial Contagion.” NBER Working Paper No 7913, 2000 Baele, Lieven., Olivier De Jonghe, Rudi Vander Vennet. “Does the Stock Market Value Bank Diversification?” Universiteit Gent Faculteit Economie En Bedrijfskunde Working paper 2006/402, 2006 Baur, Dirk., Niels Schulze. “Coexceedances in Financial Markets – A Quantile Regression Analysis of Contagion.” University of Tuebingen Economics Discussion Paper No. 253, 2003 Chan-Lau, Jorge A., Amadou N. R. Sy. “Distance-to-Default in Banking: A Bridge Too Far?” IMF WP/06/215, 2006 Duggar, Elena., Srobona Mitra. “External Linkages and Contagion Risk in Irish Banks.” IMF WP/07/44, 2007 Gropp, Reint., Marco Lo Duca, Jukka Vesala. “Cross-Border Bank Contagion in Europe.” ECB Working Paper No 662, July 2006 Laderman, Elizabeth S. “The Potential Diversification and Failure Reduction Benefits of Bank Expansion into Nonbanking Activities”. Federal Reserve Bank of San Francisco Working Paper No 2000-01, 2000 Laeven, Luc., Ross Levine. “Is There A Diversification Discount in Financial Conglomerates?” NBER Working Paper No 11499, 2005 Mihaljek, Dubravko. “Privatisation, Consolidation and the Increased Role of Foreign Banks.” BIS Paper No 28, 2006 Stiroh, Kevin J., Adrienne Rumble. “The Dark Side of Diversification: The Case of US Financial Holding Companies.” Journal of Banking and Finance, 2006, Vol. 30, pp 2131-2161 Turner, Philip. “Are Banking Systems in East Asia Stronger?” Asian Economic Policy Review, Vol. 2, No. 1, pp. 75-95, June 2007
Financial Stability Review, December 2007
Monetary Authority of Singapore Macroeconomic Surveillance Department
45
Statistical Appendix SINGAPORE NON-FINANCIAL SECTOR Table A.1: Corporate Sector’s Financial Ratios Table A.2: Household Sector’s Financial Indicators SINGAPORE FINANCIAL INSTITUTIONS Table B.1: Banking Sector’s Financial Soundness Indicators Table B.2: Local Banks’ Selected Financial Soundness Indicators Table B.3: Life Direct Insurers: Total New Business Gross Premiums Table B.4: Life Direct Insurers: Assets Distribution of Singapore Insurance Fund (Non- Linked Assets) Table B.5: General Direct Insurers: Gross Premiums Table B.6: General Direct Insurers: Composition of Net Premiums of Singapore Insurance
Fund Table B.7: General Direct Insurers: Incurred Loss Ratio of Singapore Insurance Fund
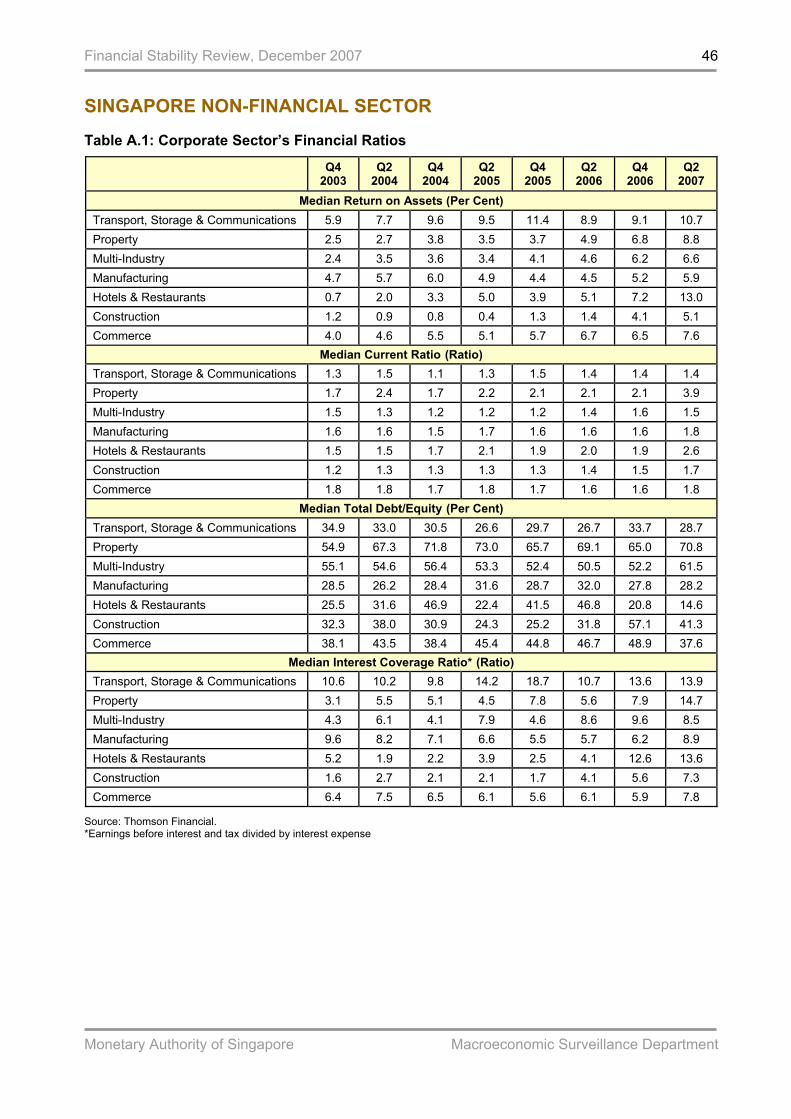
Financial Stability Review, December 2007
Monetary Authority of Singapore Macroeconomic Surveillance Department
46
SINGAPORE NON-FINANCIAL SECTOR Table A.1: Corporate Sector’s Financial Ratios
Q4 2003
Q2 2004
Q4 2004
Q2 2005
Q4 2005
Q2 2006
Q4 2006
Q2 2007
Median Return on Assets (Per Cent) Transport, Storage & Communications 5.9 7.7 9.6 9.5 11.4 8.9 9.1 10.7 Property 2.5 2.7 3.8 3.5 3.7 4.9 6.8 8.8 Multi-Industry 2.4 3.5 3.6 3.4 4.1 4.6 6.2 6.6 Manufacturing 4.7 5.7 6.0 4.9 4.4 4.5 5.2 5.9 Hotels & Restaurants 0.7 2.0 3.3 5.0 3.9 5.1 7.2 13.0 Construction 1.2 0.9 0.8 0.4 1.3 1.4 4.1 5.1 Commerce 4.0 4.6 5.5 5.1 5.7 6.7 6.5 7.6
Median Current Ratio (Ratio) Transport, Storage & Communications 1.3 1.5 1.1 1.3 1.5 1.4 1.4 1.4 Property 1.7 2.4 1.7 2.2 2.1 2.1 2.1 3.9 Multi-Industry 1.5 1.3 1.2 1.2 1.2 1.4 1.6 1.5 Manufacturing 1.6 1.6 1.5 1.7 1.6 1.6 1.6 1.8 Hotels & Restaurants 1.5 1.5 1.7 2.1 1.9 2.0 1.9 2.6 Construction 1.2 1.3 1.3 1.3 1.3 1.4 1.5 1.7 Commerce 1.8 1.8 1.7 1.8 1.7 1.6 1.6 1.8
Median Total Debt/Equity (Per Cent) Transport, Storage & Communications 34.9 33.0 30.5 26.6 29.7 26.7 33.7 28.7 Property 54.9 67.3 71.8 73.0 65.7 69.1 65.0 70.8 Multi-Industry 55.1 54.6 56.4 53.3 52.4 50.5 52.2 61.5 Manufacturing 28.5 26.2 28.4 31.6 28.7 32.0 27.8 28.2 Hotels & Restaurants 25.5 31.6 46.9 22.4 41.5 46.8 20.8 14.6 Construction 32.3 38.0 30.9 24.3 25.2 31.8 57.1 41.3 Commerce 38.1 43.5 38.4 45.4 44.8 46.7 48.9 37.6
Median Interest Coverage Ratio* (Ratio) Transport, Storage & Communications 10.6 10.2 9.8 14.2 18.7 10.7 13.6 13.9 Property 3.1 5.5 5.1 4.5 7.8 5.6 7.9 14.7 Multi-Industry 4.3 6.1 4.1 7.9 4.6 8.6 9.6 8.5 Manufacturing 9.6 8.2 7.1 6.6 5.5 5.7 6.2 8.9 Hotels & Restaurants 5.2 1.9 2.2 3.9 2.5 4.1 12.6 13.6 Construction 1.6 2.7 2.1 2.1 1.7 4.1 5.6 7.3 Commerce 6.4 7.5 6.5 6.1 5.6 6.1 5.9 7.8
Source: Thomson Financial. *Earnings before interest and tax divided by interest expense
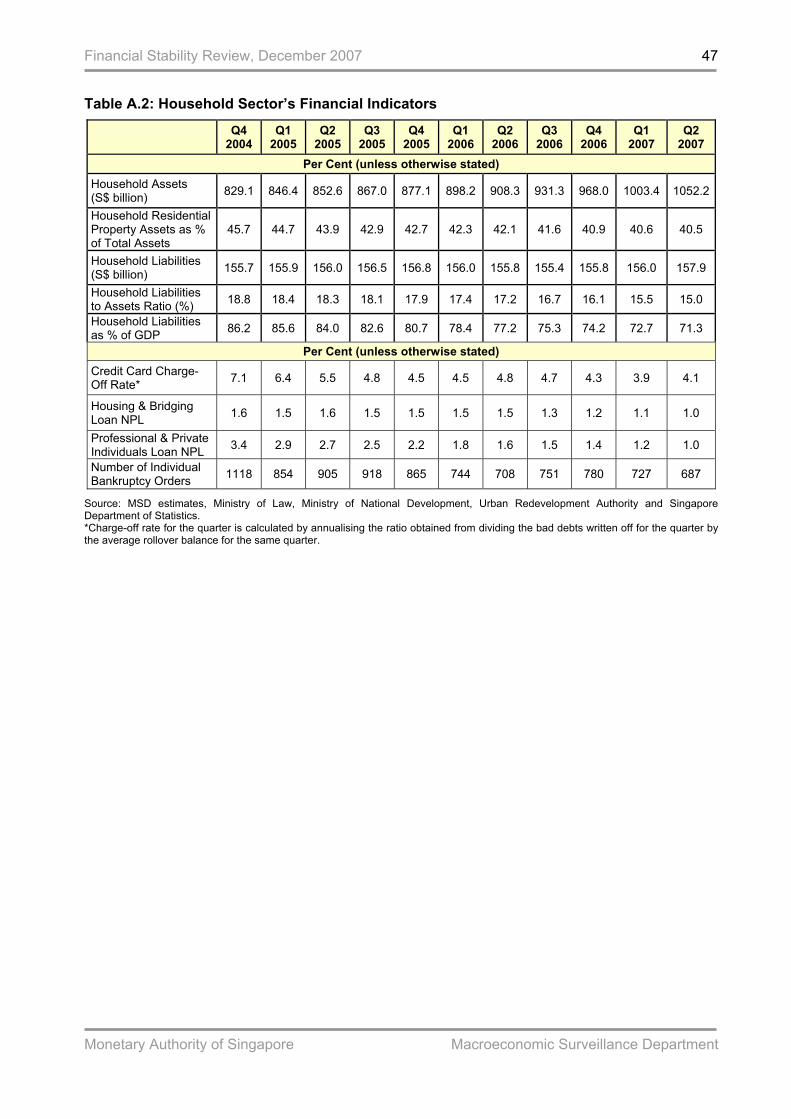
Financial Stability Review, December 2007
Monetary Authority of Singapore Macroeconomic Surveillance Department
47
Table A.2: Household Sector’s Financial Indicators
Q4 2004
Q1 2005
Q2 2005
Q3 2005
Q4 2005
Q1 2006
Q2 2006
Q3 2006
Q4 2006
Q1 2007
Q2 2007
Per Cent (unless otherwise stated) Household Assets (S$ billion) 829.1 846.4 852.6 867.0 877.1 898.2 908.3 931.3 968.0 1003.4 1052.2
Household Residential Property Assets as % of Total Assets
45.7 44.7 43.9 42.9 42.7 42.3 42.1 41.6 40.9 40.6 40.5
Household Liabilities (S$ billion) 155.7 155.9 156.0 156.5 156.8 156.0 155.8 155.4 155.8 156.0 157.9
Household Liabilities to Assets Ratio (%) 18.8 18.4 18.3 18.1 17.9 17.4 17.2 16.7 16.1 15.5 15.0
Household Liabilities as % of GDP 86.2 85.6 84.0 82.6 80.7 78.4 77.2 75.3 74.2 72.7 71.3
Per Cent (unless otherwise stated) Credit Card Charge-Off Rate* 7.1 6.4 5.5 4.8 4.5 4.5 4.8 4.7 4.3 3.9 4.1
Housing & Bridging Loan NPL 1.6 1.5 1.6 1.5 1.5 1.5 1.5 1.3 1.2 1.1 1.0
Professional & Private Individuals Loan NPL 3.4 2.9 2.7 2.5 2.2 1.8 1.6 1.5 1.4 1.2 1.0
Number of Individual Bankruptcy Orders 1118 854 905 918 865 744 708 751 780 727 687
Source: MSD estimates, Ministry of Law, Ministry of National Development, Urban Redevelopment Authority and Singapore Department of Statistics. *Charge-off rate for the quarter is calculated by annualising the ratio obtained from dividing the bad debts written off for the quarter by the average rollover balance for the same quarter.
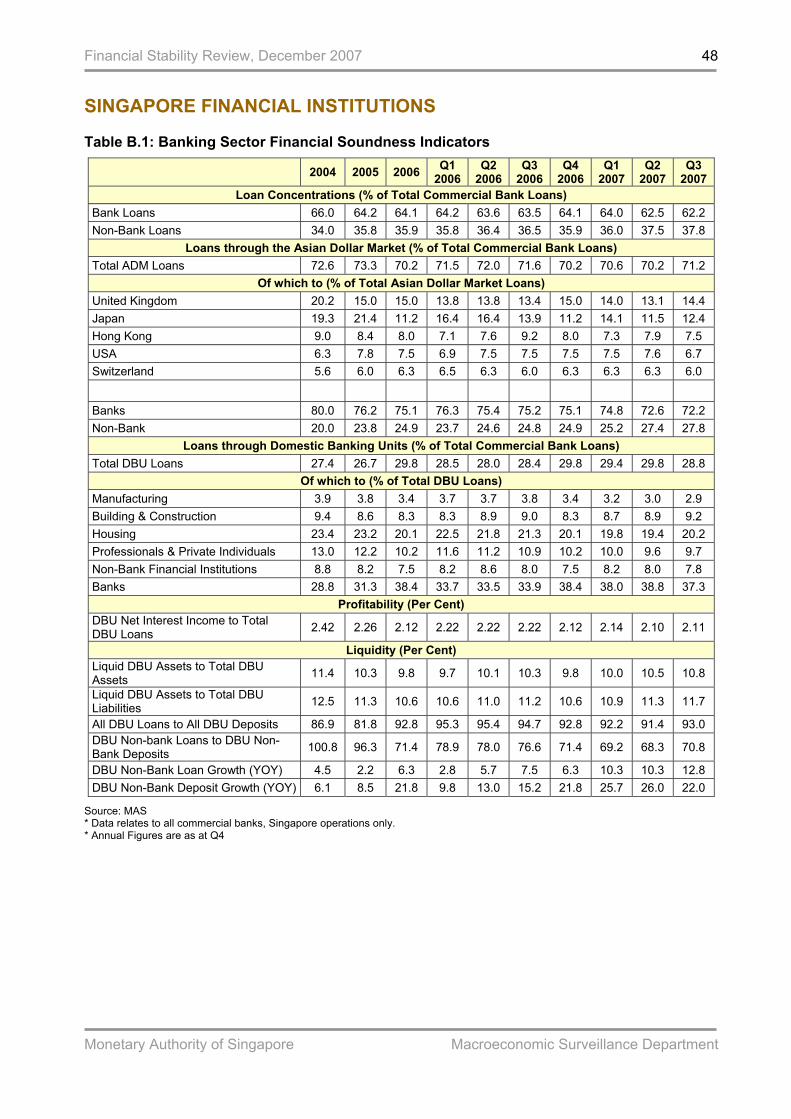
Financial Stability Review, December 2007
Monetary Authority of Singapore Macroeconomic Surveillance Department
48
SINGAPORE FINANCIAL INSTITUTIONS Table B.1: Banking Sector Financial Soundness Indicators
2004 2005 2006 Q1 2006
Q2 2006
Q3 2006
Q4 2006
Q1 2007
Q2 2007
Q3 2007
Loan Concentrations (% of Total Commercial Bank Loans) Bank Loans 66.0 64.2 64.1 64.2 63.6 63.5 64.1 64.0 62.5 62.2 Non-Bank Loans 34.0 35.8 35.9 35.8 36.4 36.5 35.9 36.0 37.5 37.8
Loans through the Asian Dollar Market (% of Total Commercial Bank Loans) Total ADM Loans 72.6 73.3 70.2 71.5 72.0 71.6 70.2 70.6 70.2 71.2
Of which to (% of Total Asian Dollar Market Loans) United Kingdom 20.2 15.0 15.0 13.8 13.8 13.4 15.0 14.0 13.1 14.4 Japan 19.3 21.4 11.2 16.4 16.4 13.9 11.2 14.1 11.5 12.4 Hong Kong 9.0 8.4 8.0 7.1 7.6 9.2 8.0 7.3 7.9 7.5 USA 6.3 7.8 7.5 6.9 7.5 7.5 7.5 7.5 7.6 6.7 Switzerland 5.6 6.0 6.3 6.5 6.3 6.0 6.3 6.3 6.3 6.0
Banks 80.0 76.2 75.1 76.3 75.4 75.2 75.1 74.8 72.6 72.2 Non-Bank 20.0 23.8 24.9 23.7 24.6 24.8 24.9 25.2 27.4 27.8
Loans through Domestic Banking Units (% of Total Commercial Bank Loans) Total DBU Loans 27.4 26.7 29.8 28.5 28.0 28.4 29.8 29.4 29.8 28.8
Of which to (% of Total DBU Loans) Manufacturing 3.9 3.8 3.4 3.7 3.7 3.8 3.4 3.2 3.0 2.9 Building & Construction 9.4 8.6 8.3 8.3 8.9 9.0 8.3 8.7 8.9 9.2 Housing 23.4 23.2 20.1 22.5 21.8 21.3 20.1 19.8 19.4 20.2 Professionals & Private Individuals 13.0 12.2 10.2 11.6 11.2 10.9 10.2 10.0 9.6 9.7 Non-Bank Financial Institutions 8.8 8.2 7.5 8.2 8.6 8.0 7.5 8.2 8.0 7.8 Banks 28.8 31.3 38.4 33.7 33.5 33.9 38.4 38.0 38.8 37.3
Profitability (Per Cent) DBU Net Interest Income to Total DBU Loans 2.42 2.26 2.12 2.22 2.22 2.22 2.12 2.14 2.10 2.11
Liquidity (Per Cent) Liquid DBU Assets to Total DBU Assets 11.4 10.3 9.8 9.7 10.1 10.3 9.8 10.0 10.5 10.8
Liquid DBU Assets to Total DBU Liabilities 12.5 11.3 10.6 10.6 11.0 11.2 10.6 10.9 11.3 11.7
All DBU Loans to All DBU Deposits 86.9 81.8 92.8 95.3 95.4 94.7 92.8 92.2 91.4 93.0 DBU Non-bank Loans to DBU Non-Bank Deposits 100.8 96.3 71.4 78.9 78.0 76.6 71.4 69.2 68.3 70.8
DBU Non-Bank Loan Growth (YOY) 4.5 2.2 6.3 2.8 5.7 7.5 6.3 10.3 10.3 12.8 DBU Non-Bank Deposit Growth (YOY) 6.1 8.5 21.8 9.8 13.0 15.2 21.8 25.7 26.0 22.0
Source: MAS * Data relates to all commercial banks, Singapore operations only. * Annual Figures are as at Q4
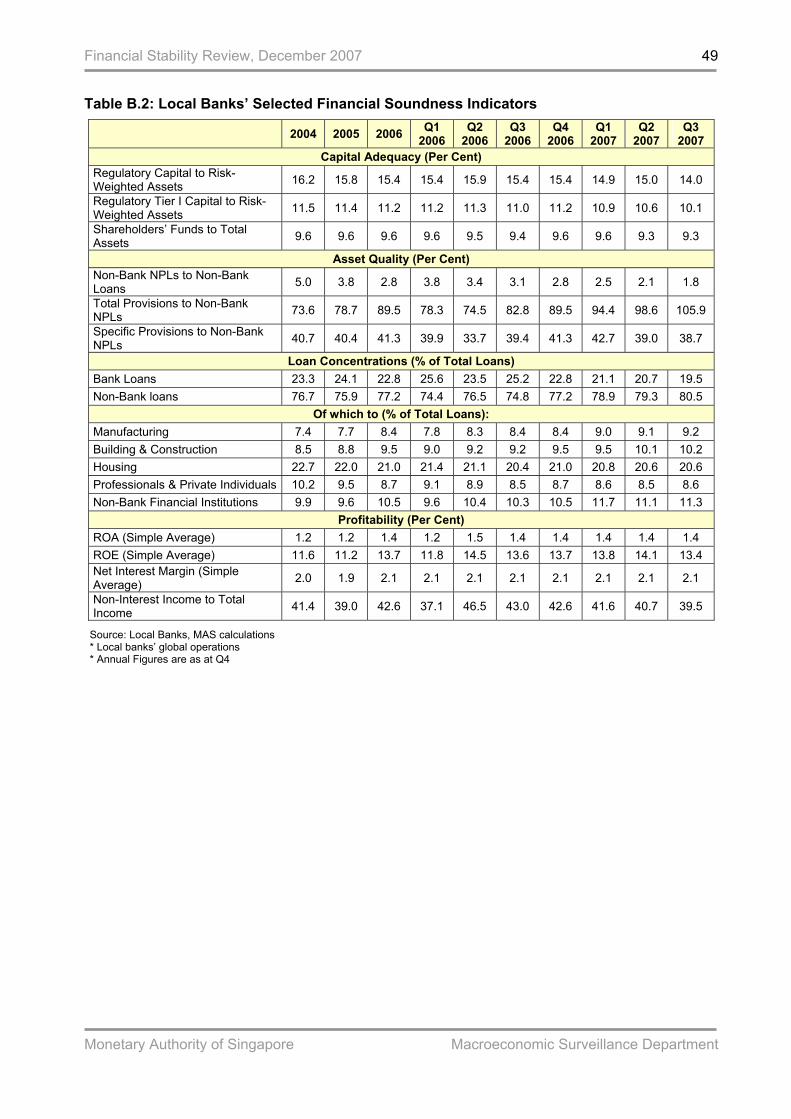
Financial Stability Review, December 2007
Monetary Authority of Singapore Macroeconomic Surveillance Department
49
Table B.2: Local Banks’ Selected Financial Soundness Indicators
2004 2005 2006 Q1 2006
Q2 2006
Q3 2006
Q4 2006
Q1 2007
Q2 2007
Q3 2007
Capital Adequacy (Per Cent) Regulatory Capital to Risk-Weighted Assets 16.2 15.8 15.4 15.4 15.9 15.4 15.4 14.9 15.0 14.0
Regulatory Tier I Capital to Risk-Weighted Assets 11.5 11.4 11.2 11.2 11.3 11.0 11.2 10.9 10.6 10.1
Shareholders’ Funds to Total Assets 9.6 9.6 9.6 9.6 9.5 9.4 9.6 9.6 9.3 9.3
Asset Quality (Per Cent) Non-Bank NPLs to Non-Bank Loans 5.0 3.8 2.8 3.8 3.4 3.1 2.8 2.5 2.1 1.8
Total Provisions to Non-Bank NPLs 73.6 78.7 89.5 78.3 74.5 82.8 89.5 94.4 98.6 105.9
Specific Provisions to Non-Bank NPLs 40.7 40.4 41.3 39.9 33.7 39.4 41.3 42.7 39.0 38.7
Loan Concentrations (% of Total Loans) Bank Loans 23.3 24.1 22.8 25.6 23.5 25.2 22.8 21.1 20.7 19.5 Non-Bank loans 76.7 75.9 77.2 74.4 76.5 74.8 77.2 78.9 79.3 80.5
Of which to (% of Total Loans): Manufacturing 7.4 7.7 8.4 7.8 8.3 8.4 8.4 9.0 9.1 9.2 Building & Construction 8.5 8.8 9.5 9.0 9.2 9.2 9.5 9.5 10.1 10.2 Housing 22.7 22.0 21.0 21.4 21.1 20.4 21.0 20.8 20.6 20.6 Professionals & Private Individuals 10.2 9.5 8.7 9.1 8.9 8.5 8.7 8.6 8.5 8.6 Non-Bank Financial Institutions 9.9 9.6 10.5 9.6 10.4 10.3 10.5 11.7 11.1 11.3
Profitability (Per Cent) ROA (Simple Average) 1.2 1.2 1.4 1.2 1.5 1.4 1.4 1.4 1.4 1.4 ROE (Simple Average) 11.6 11.2 13.7 11.8 14.5 13.6 13.7 13.8 14.1 13.4 Net Interest Margin (Simple Average) 2.0 1.9 2.1 2.1 2.1 2.1 2.1 2.1 2.1 2.1
Non-Interest Income to Total Income 41.4 39.0 42.6 37.1 46.5 43.0 42.6 41.6 40.7 39.5
Source: Local Banks, MAS calculations * Local banks’ global operations * Annual Figures are as at Q4
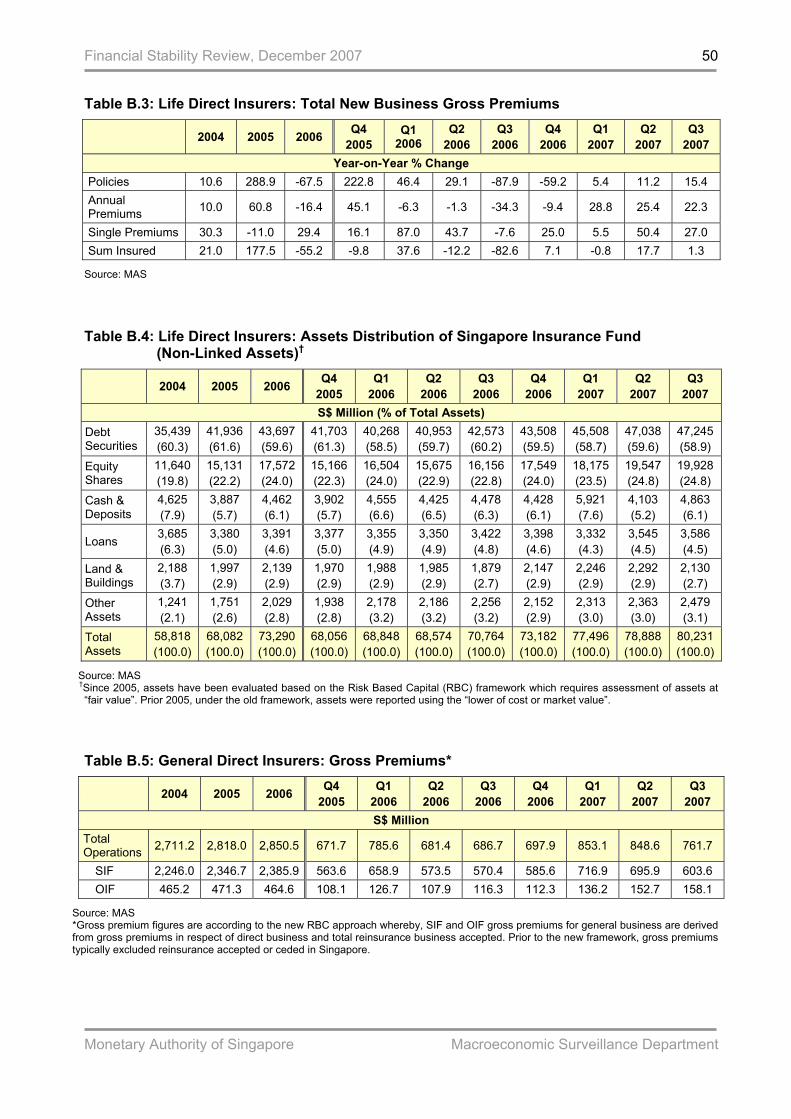
Financial Stability Review, December 2007
Monetary Authority of Singapore Macroeconomic Surveillance Department
50
Table B.3: Life Direct Insurers: Total New Business Gross Premiums
2004 2005 2006 Q4 2005
Q1 2006
Q2 2006
Q3 2006
Q4 2006
Q1 2007
Q2 2007
Q3 2007
Year-on-Year % Change Policies 10.6 288.9 -67.5 222.8 46.4 29.1 -87.9 -59.2 5.4 11.2 15.4 Annual Premiums 10.0 60.8 -16.4 45.1 -6.3 -1.3 -34.3 -9.4 28.8 25.4 22.3
Single Premiums 30.3 -11.0 29.4 16.1 87.0 43.7 -7.6 25.0 5.5 50.4 27.0 Sum Insured 21.0 177.5 -55.2 -9.8 37.6 -12.2 -82.6 7.1 -0.8 17.7 1.3
Source: MAS Table B.4: Life Direct Insurers: Assets Distribution of Singapore Insurance Fund
(Non-Linked Assets)†
2004 2005 2006 Q4 2005
Q1 2006
Q2 2006
Q3 2006
Q4 2006
Q1 2007
Q2 2007
Q3 2007
S$ Million (% of Total Assets) Debt Securities
35,439 (60.3)
41,936 (61.6)
43,697 (59.6)
41,703 (61.3)
40,268 (58.5)
40,953 (59.7)
42,573 (60.2)
43,508 (59.5)
45,508 (58.7)
47,038 (59.6)
47,245 (58.9)
Equity Shares
11,640 (19.8)
15,131 (22.2)
17,572 (24.0)
15,166 (22.3)
16,504 (24.0)
15,675 (22.9)
16,156 (22.8)
17,549 (24.0)
18,175 (23.5)
19,547 (24.8)
19,928 (24.8)
Cash & Deposits
4,625 (7.9)
3,887 (5.7)
4,462 (6.1)
3,902 (5.7)
4,555 (6.6)
4,425 (6.5)
4,478 (6.3)
4,428 (6.1)
5,921 (7.6)
4,103 (5.2)
4,863 (6.1)
Loans 3,685 (6.3)
3,380 (5.0)
3,391 (4.6)
3,377 (5.0)
3,355 (4.9)
3,350 (4.9)
3,422 (4.8)
3,398 (4.6)
3,332 (4.3)
3,545 (4.5)
3,586 (4.5)
Land & Buildings
2,188 (3.7)
1,997 (2.9)
2,139 (2.9)
1,970 (2.9)
1,988 (2.9)
1,985 (2.9)
1,879 (2.7)
2,147 (2.9)
2,246 (2.9)
2,292 (2.9)
2,130 (2.7)
Other Assets
1,241 (2.1)
1,751 (2.6)
2,029 (2.8)
1,938 (2.8)
2,178 (3.2)
2,186 (3.2)
2,256 (3.2)
2,152 (2.9)
2,313 (3.0)
2,363 (3.0)
2,479 (3.1)
Total Assets
58,818 (100.0)
68,082 (100.0)
73,290 (100.0)
68,056 (100.0)
68,848 (100.0)
68,574 (100.0)
70,764 (100.0)
73,182 (100.0)
77,496 (100.0)
78,888 (100.0)
80,231 (100.0)
Source: MAS †Since 2005, assets have been evaluated based on the Risk Based Capital (RBC) framework which requires assessment of assets at
“fair value”. Prior 2005, under the old framework, assets were reported using the “lower of cost or market value”. Table B.5: General Direct Insurers: Gross Premiums*
2004 2005 2006 Q4 2005
Q1 2006
Q2 2006
Q3 2006
Q4 2006
Q1 2007
Q2 2007
Q3 2007
S$ Million Total Operations 2,711.2 2,818.0 2,850.5 671.7 785.6 681.4 686.7 697.9 853.1 848.6 761.7
SIF 2,246.0 2,346.7 2,385.9 563.6 658.9 573.5 570.4 585.6 716.9 695.9 603.6 OIF 465.2 471.3 464.6 108.1 126.7 107.9 116.3 112.3 136.2 152.7 158.1
Source: MAS *Gross premium figures are according to the new RBC approach whereby, SIF and OIF gross premiums for general business are derived from gross premiums in respect of direct business and total reinsurance business accepted. Prior to the new framework, gross premiums typically excluded reinsurance accepted or ceded in Singapore.
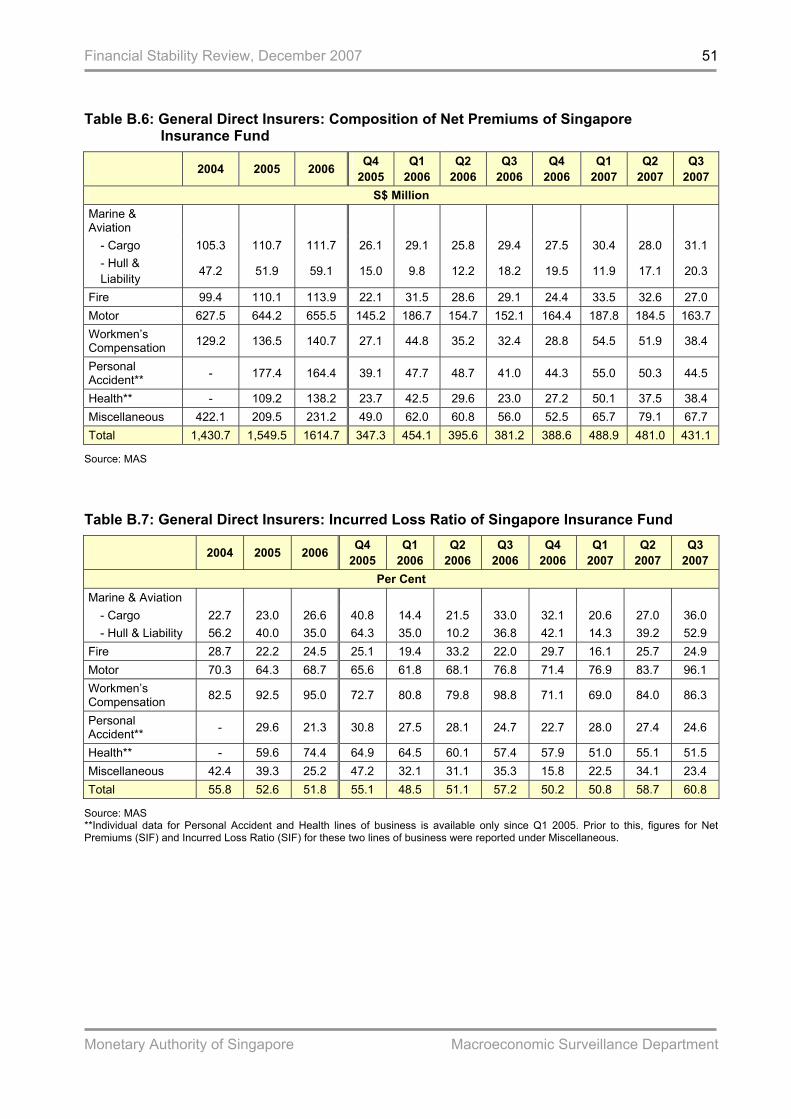
Financial Stability Review, December 2007
Monetary Authority of Singapore Macroeconomic Surveillance Department
51
Table B.6: General Direct Insurers: Composition of Net Premiums of Singapore
Insurance Fund
2004 2005 2006 Q4 2005
Q1 2006
Q2 2006
Q3 2006
Q4 2006
Q1 2007
Q2 2007
Q3 2007
S$ Million Marine & Aviation
- Cargo 105.3 110.7 111.7 26.1 29.1 25.8 29.4 27.5 30.4 28.0 31.1 - Hull & Liability 47.2 51.9 59.1 15.0 9.8 12.2 18.2 19.5 11.9 17.1 20.3
Fire 99.4 110.1 113.9 22.1 31.5 28.6 29.1 24.4 33.5 32.6 27.0 Motor 627.5 644.2 655.5 145.2 186.7 154.7 152.1 164.4 187.8 184.5 163.7 Workmen’s Compensation 129.2 136.5 140.7 27.1 44.8 35.2 32.4 28.8 54.5 51.9 38.4
Personal Accident** - 177.4 164.4 39.1 47.7 48.7 41.0 44.3 55.0 50.3 44.5
Health** - 109.2 138.2 23.7 42.5 29.6 23.0 27.2 50.1 37.5 38.4 Miscellaneous 422.1 209.5 231.2 49.0 62.0 60.8 56.0 52.5 65.7 79.1 67.7 Total 1,430.7 1,549.5 1614.7 347.3 454.1 395.6 381.2 388.6 488.9 481.0 431.1
Source: MAS Table B.7: General Direct Insurers: Incurred Loss Ratio of Singapore Insurance Fund
2004 2005 2006 Q4 2005
Q1 2006
Q2 2006
Q3 2006
Q4 2006
Q1 2007
Q2 2007
Q3 2007
Per Cent Marine & Aviation
- Cargo 22.7 23.0 26.6 40.8 14.4 21.5 33.0 32.1 20.6 27.0 36.0 - Hull & Liability 56.2 40.0 35.0 64.3 35.0 10.2 36.8 42.1 14.3 39.2 52.9
Fire 28.7 22.2 24.5 25.1 19.4 33.2 22.0 29.7 16.1 25.7 24.9 Motor 70.3 64.3 68.7 65.6 61.8 68.1 76.8 71.4 76.9 83.7 96.1 Workmen’s Compensation 82.5 92.5 95.0 72.7 80.8 79.8 98.8 71.1 69.0 84.0 86.3
Personal Accident** - 29.6 21.3 30.8 27.5 28.1 24.7 22.7 28.0 27.4 24.6
Health** - 59.6 74.4 64.9 64.5 60.1 57.4 57.9 51.0 55.1 51.5 Miscellaneous 42.4 39.3 25.2 47.2 32.1 31.1 35.3 15.8 22.5 34.1 23.4 Total 55.8 52.6 51.8 55.1 48.5 51.1 57.2 50.2 50.8 58.7 60.8
Source: MAS **Individual data for Personal Accident and Health lines of business is available only since Q1 2005. Prior to this, figures for Net Premiums (SIF) and Incurred Loss Ratio (SIF) for these two lines of business were reported under Miscellaneous.