FSM - DEVELOPMENTS FOR MONITORING OF STRESS … · ... and to determine the minimum crack sizes...
13
FSM - DEVELOPMENTS FOR MONITORING OF STRESS CORROSION CRACKING IN STORAGE TANKS Per Olav Gartland, Harald Horn, Kjell R. Wold CorrOcean as, Trondheim, Norway, and Tom Hallan, Norsk Hydro, Porsgrunn, Norway. ABSTRACT FSM - the Field Signature Method - is a relatively new method for continuous monitoring of corrosion attacks and cracking of pipes, pressurized vessels and storages tanks. The method is now beeing developed for monitoring of stress corrosion cracking of welds in ammonia storage tanks. Laboratory tests and computer modeling have been utilized to establish a basis for interpretation of the measured signals in terms of crack sizes and, and to determine the minimum crack sizes detectable for a given tank wall thickness and type of weld. INTRODUCTION The storage of anhydrous ammonia is of fundamental importance for an integrated fertiliser producer, such as Norsk Hydro (1). Low temperature storage in large volume flat bottom tanks has shown to be the most economical storage facility for ammonia. Previously, ammonia stress corrosion cracking (NH 3 -SCC) was assumed to be related to storage facilities at ambient temperature. During the last years it has been shown that also low temperature storage tanks are susceptible to NH 3 -SCC. Indications from internal inspection of low temperature tanks has shown that the opening and recomissioning of a tank is the most critical period due to crack initiation. Therefore, in-service inspection is of great interest. With the development of the Field Signature Method (FSM) a system for in-service, continuous crack monitoring
Transcript of FSM - DEVELOPMENTS FOR MONITORING OF STRESS … · ... and to determine the minimum crack sizes...

FSM - DEVELOPMENTS FOR MONITORING OF STRESS CORROSION CRACKING IN STORAGE TANKS
Per Olav Gartland, Harald Horn, Kjell R. Wold CorrOcean as, Trondheim, Norway,
and
Tom Hallan,
Norsk Hydro, Porsgrunn, Norway.
ABSTRACT
FSM - the Field Signature Method - is a relatively new method for continuous monitoring of corrosion attacks and cracking of pipes, pressurized vessels and storages tanks. The method is now beeing developed for monitoring of stress corrosion cracking of welds in ammonia storage tanks. Laboratory tests and computer modeling have been utilized to establish a basis for interpretation of the measured signals in terms of crack sizes and, and to determine the minimum crack sizes detectable for a given tank wall thickness and type of weld.
INTRODUCTION
The storage of anhydrous ammonia is of fundamental importance for an integrated fertiliser producer, such as Norsk Hydro (1). Low temperature storage in large volume flat bottom tanks has shown to be the most economical storage facility for ammonia.
Previously, ammonia stress corrosion cracking (NH3-SCC) was assumed to be related to storage facilities at ambient temperature. During the last years it has been shown that also low temperature storage tanks are susceptible to NH3-SCC.
Indications from internal inspection of low temperature tanks has shown that the opening and recomissioning of a tank is the most critical period due to crack initiation. Therefore, in-service inspection is of great interest.
With the development of the Field Signature Method (FSM) a system for in-service, continuous crack monitoring

has become available. The present paper summarizes some of the results obtained from laboratory tests and computer modeling performed in order to establish a basis for interpretation of the FSM signal pattern in terms of crack sizes and crack densities.
AMMONIA STRESS CORROSION CRACKING
The phenomenon NH3-SCC has previously been described from both practical experience (2) and laboratory test results (3), and will therefore not be discussed in detail. Only a few aspects will be highlighted.
• NH3-SCC is a corrosion mechanism consisting of an anode (metal dissolving) and a cathode (oxygen reduction) reaction. This reaction is not the same as hydrogen cracking.
• Initiation and propagation of NH3-SCC requires liquid ammonia, oxygen and tensile stress.
• The most sensitive areas are welds and heat affected zones.
. • Crack initiation is very rare at low temperatures.
• The crack growth rate is approximately 3 times higher at 18°C (64°F) than at -33°C(-27°F) (4).
NH3-SCC has only been reported in a few storage tanks for refrigerated ammonia. Most of the cracks
found in these tanks were small, typically 10-20 mm long and 1-2 mm deep. Crack size is dependent on weld configuration and size.
A large number of the cracks found in these tanks are reported to be in the bottom, and in the weld between the bottom and wall (2,5). When a tank is in service at -33°C (-27°F), the stress level in the welds in the bottom is consistently low. When the tank is cooled down during recommissioning, thermal shrinkage causes a high and increasing stress level, the oxygen level is high compared to normal operating conditions, and liquid ammonia is present. Stress calculations have shown that the stress level caused by thermal shrinkage can exceed the yield point of the material in the bottom of the tank.
Typical oxygen content in liquid ammonia during operating conditions is 0.5 ppm. In laboratory tests NH3-SCC has been initiated in ammonia containing approximately 3 ppm oxygen at -33°C (-27°F). The oxygen level during recommissioning is high for two reasons:
1. It is almost impossible to remove all air before ammonia is filled into the tank. 2. Oxygen is adsorbed on the rusty steel surface.
Laboratory tests have shown that NH3-SCC initiates more rapidly on a rusted steel surface than on a pure metallic surface.
An important conclusion from research on NH3-SCC and practical experience with ammonia storage at low temperatures, is that the opening of these tanks can increase the risk of initiating NH3-SCC. Therefore, we are convinced that the most critical period for crack initiation is during recommissioning, and that opening should be avoided.
NH3-SCC cracks are usually transverse, but cracks which cause fracture are normally longitudinal. The longitudinal cracks are most important for the tank's integrity, and the transverse cracks are most important in order to tell whether or not the service conditions can cause NH3-SCC.
Longitudinal cracks in the vertical welds, especially in first course, can in the worst case cause a brittle fracture which can open up the tank from bottom to top.
Experience has shown that transverse cracks develop first, and when these are sufficiently large and
numerous, longitudinal cracks may then develop between the transverse cracks. It is important that both transverse and longitudinal cracks are detected.
THE FIELD SIGNATURE METHOD, FSM
The FSM technique is based on a patent from 1984 (6), which the norwegian company CorrOcean a.s has the rights to utilise world-wide. Today, the name Electrical Fingerprint Method is also being used.
The principle is to measure alterations in the electrical field between electrode pairs when a direct current is applied to the structure, see figure 1 (7). All measured potentials are compared with initial potentials.
A pair of reference electrodes, mounted in an area where corrosion or cracking cannot occur, is located in the vicinity of the monitoring electrode configuration (figure 1). This is necessary in order to achieve effective compensation for fluctuations in temperature and background noise. Various practical arrangements have been developed for ensuring sufficiently small temperature gradients between reference and monitoring electrodes.
Using a computer model, the FC values (Fingerprint Coefficient values), are converted to crack size or reduction in wall thickness. The computer model is based on either a database or formulas, depending on the type of system being monitored. The FC value is the parts per thousand (ppt) change in the resistance between two electrodes.
The electrode pairs are mounted on the outside on the steel surface to form a grid over the area to be monitored, see figure 2. The position and number of the electrodes must be selected with care, particularly for crack detection. The number of electrodes can vary from 24 to 64 for one FSM unit. In order to obtain a good sensitivity it is important that the direction of the local electric field deviates at most only a few degrees from the direction of the pin pairs. By use of repeated measurements and statistical filtering techniques a very high sensitivity is obtained. The noise level can then be lowered to below 0.5 ppt (FC=0.5).
The main operational advantages compared to conventional NDE methods are: No components are exposed to the corrosive environment. There are no consumables. Outer insulation does not have to be removed. Therefore, FSM can be applied to storage tanks
operating at very low temperatures.
In the oil & gas industry, FSM has been used for internal corrosion monitoring of process pipelines. The method has been used on critical pipe components and welds. The oil companies Shell (UK and USA), Conoco (USA) and Statoil (Norway) have used FSM for internal corrosion monitoring, with promising results.
ADAPTATION OF FSM TO LOW TEMPERATURE AMMONIA STORAGE
The main advantage of using FSM compared to ultrasonic mearsurements (P-scan) is that monitoring does not require any manual operations on the outer tank surface. This means that insulations does not have to be removed, and that FSM monitoring can be carried out during all weather conditions. An illustration of a FSM instrumentet storage tank is shown in figure 3.
In order to improve the basis for the interpretation of the FSM signals from cracks a series of studies has been completed. These studies includes: 1. A comparison of the sensitivity of FSM and automated ultrasonic techniques for the inspection of
laboratory specimens containing NH3-SCC. 2. FSM laboratory tests on a welded steel structure with artificial cracks made by spark erosion or
machining. 3. Computer simulations of the FSM signal variation with cracks of different sizes and geometries.
We shall here present some of the most important observations from the FSM laboratory studies and the computer simulations.
CRACK DETECTION IN LABORATORY TESTS
The laboratory tests were carried out with a steel structure representing a section of a tank wall welded to the bottom plate. Both full penetration welds and double fillet welds were applied. The dimensions and the welds of the structure is shown in figure 4, and the positions of the measuring pins and the current input and output positions are indicated in figure 5. Measurements were carried out at both ambient temperature and at -25o C. Both transverse and longitudinal cracks were made in the bottom weld, with depths from 2 to 10 mm.
The results showed that the temperature had very little influence on the results. With the current feed positions used in these experiments the longitudinal cracks had also very little influence on the FSM signals, as expected.
In most of the measurements the typical pin pair distance was 50 mm. Under such conditions the pin pairs that made up the horizontal pin row above or below the bottom weld would detect transverse cracks in the weld as a strong peak for the pin pair most opposit to the crack. The cracks were made on the "inside" of the model while the pins were attached to the "outer" side as would be the case for a real tank installation. Figure 6 shows the pin pair readings from two cracks, A and B, that were 125 mm apart along the weld. Crack A, which is in the middle of a pin pair yields a sharply peaked signal, while crack B shows a broader maximum due to the fact that the crack was located just opposit to a pin. Thus, the effect of the crack disturbance was picked up more evenly by two pin pairs.
From similar measurements under increasing crack depth it has been possible to find a correlation between the depth of a single crack and the FSM signal, represented by the FC value. Examples of correlation curves are shown in figure 7.
COMPUTER MODELING
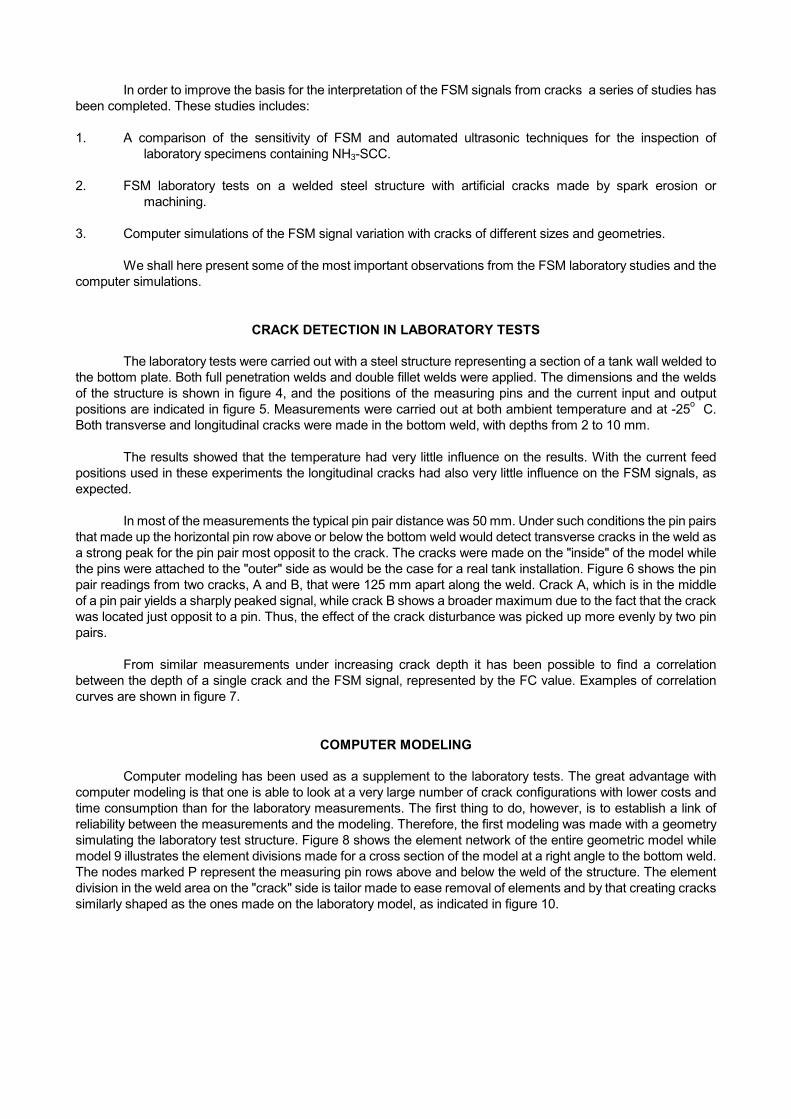
Computer modeling has been used as a supplement to the laboratory tests. The great advantage with computer modeling is that one is able to look at a very large number of crack configurations with lower costs and time consumption than for the laboratory measurements. The first thing to do, however, is to establish a link of reliability between the measurements and the modeling. Therefore, the first modeling was made with a geometry simulating the laboratory test structure. Figure 8 shows the element network of the entire geometric model while model 9 illustrates the element divisions made for a cross section of the model at a right angle to the bottom weld. The nodes marked P represent the measuring pin rows above and below the weld of the structure. The element division in the weld area on the "crack" side is tailor made to ease removal of elements and by that creating cracks similarly shaped as the ones made on the laboratory model, as indicated in figure 10.

The modeling was accomplished with the pre- and postprocessor and the heat transfer module of the NISA program family. Because of the similarity in the basic equations for heat and electric current transfer the heat transfer module can be used to calculate potential variations under electric current flow in an electric conducting medium. The temperature then becomes synonymus with the potential and the heat flux synonymus with the the electric current.
Computer modeling with this program was quite successful in terms of correlation with the experiments, provided the matematical model was constructed very similar to the real structure. Figure 11 and figure 12 show an example of such a correlation. In this case there were two 10 mm deep transverse cracks 150 mm apart. Figure 11 shows the correlation using so-called cross pin pairs, that is a pin pair made of one pin from the upper horizontal row and one from the lower row, but shifted 50 mm along the weld. The data in figure 12 are with horizontal pin pairs, in this case with 100 mm pin distance.
The good correlation obtained between modeling and measurements was a strong stimulation to go on with modeling. Figure 13 shows the results of an interference study. Here one 10 mm crack is kept steady in the middle between two pins, at the Pin pair 1 position, while another 10 mm crack is moved stepwise from position Pin pair 2 (50 mm avay) to position Pin pair 3 (100 mm avay). We observe that these two cracks cannot be observed as two cracks until the distance is about 77 mm, i.e. about 1.5 times the pin pair distance.
A more typical crack configuration in welds of ammonia tanks than large, well separated cracks, is a rather frequent occurence of relatively shallow cracks. The typical distance between these cracks is of the order 5 - 10 mm, and the depth up to about 2 mm. With such a crack configuration the pin pair signals will all increase and no peaks are observed. The pin pair signals will also increase in strenght with reduced distance between the cracks. From a modeling study with 2 mm deep cracks with shorter and shorter separation the results in figure 14 have become evident. This figure shows that as long as the cracks can be separated in the data, the maximum readings are little affected. With crack distances below the distance of separation the FC signals increase strongly with reduced distance, and at a distance of about 10 mm the FC value is 4-5 times larger than for well separated cracks of the same depth.
Some modeling has also been made to study FSM signals from an X-weld in flat plates of different thicknesses. The result is shown in figure 15. As expected, the FSM signal strength gets larger on a thinner plate with the same crack depth.
CONCLUSIONS
FSM - the Field Signature Method - offers the possibility of continuous crack monitoring of ammonia storage tanks without any manual operations or insulation removal which may interfere with the service conditions of the tank.
With a proper design of the monitoring system it is possible to detect single cracks with a depth of 2-3 mm in a 30 mm thick wall and a depth of 1-2 mm in a 13 mm thick wall.
There are no significant differences in the signal strength or signal pattern for measurements at room temperature versus measurements at -25 °C.
Cracks can be identified as single cracks when the separation between cracks is larger than 1.5 times the pin distance of a pin pair, i.e. about 75 mm for a typical 50 mm pin distance on a 30 mm thick wall.
When the typical distance between cracks is reduced to below 1.5 times the pin distance cracks cannot be observed as separate cracks. The presence of cracks is, however, observed as a uniform increase in the measured signals in the same way as for e.g. uniform corrosion. The signal strength increases with the reduction of the typical distance beween cracks.
Matematical modeling with commercially available finite element programs can be used to establish correlation curves between the geometry of the cracks and the strength and variation of the FSM signals.

REFERENCES
1. G. Schulstok, "Norsk Hydro Agriculture Division standards on safe operating practice in storage and handling of ammonia", AIChE Symposium on safety in ammonia plant and related facilities, San Antonio, 1992.
2. M. Appl, K. Fäßler, D. Fromm, H. Gebhard and H. Portl, "New cases of stress corrosion cracking in large
atmospheric ammonia storage tanks", AIChE Symposium on safety in ammonia plant and related facilities, paper no. 237 d, San Francisco, 1989.
3. L. Lunde and R. Nyborg, "SCC of Carbon Steels in Ammonia - Crack Growth Studies and Means to
Prevent Cracking", NACE Corrosion '89, paper no. 98, New Orleans, USA. 4. R. Nyborg and L. Lunde, "SCC of welded carbon steel in liquid ammonia at ambient and low temperature",
12th Scandinavian Corrosion Congress & Eurocorr '92, Espoo, Finland 1992. 5 S. B. Ali and R. E. Smallwood, "Inspection of an anhydrous ammonia atmospheric pressure storage tank",
AIChE Ammonia symposium, paper no. 98g, 1990. 6. H. Hognestad, "A method and a device for monitoring large metal structures", European patent
specification EP 0 105 893 B1, 25.04.84. 7. R. D. Strømmen, H. Horn and K. R. Wold, "FSM - a unique method for monitoring corrosion, pitting,
erosion and cracking", NACE Corrosion paper no. 7, 1992. 8. Y. Dror, "Aboveground Atmospheric Storage Tank Inspection Management and Certification Program",
paper no. 9, NACE/MTI International Symposium on Aboveground Storage Tanks, Houston TX, 1990.
9. C. von Feilitzen, K. Högberg and L. Dahlberg, "Structural integrity assessment of ammonia storage tank
Supra AB Landskrona" (In Swedish), SA, Stockholm, 1988.

FCAi = (Bs/As * Ai/Bi - 1) * 1000 (ppt)
FCAi = FC value for electrode pair A at time i. As = Voltage for electrode pair A at start-up. Bs = Voltage for electrode pair B (reference) at start-up. Ai = Voltage for electrode pair A at time i. Bi = Voltage for electrode pair B (reference) at time i.
TR = Temperature measurement
Figure 1. FSM principles
Figure 2. FSM principles. Schematics of an ideal electric field pattern (top) and distortion of field lines at a surface failure (bottom).

Figure 3. FSM installation on an ammonia tank.
Figure 4. The tank section model used for the labarotory FSM tests.
Figure 5. Location of single transverse cracks A and B, measuring pins and current feed positions on the tank section model.

Figure 6. Experimental FC-pattern for crack A and crack B at their maximum depths. Pin pairs parallel to the weld with a pin distance of 50 mm.
Figure 7. Experimental correlation between the maximum FC-value and the crack depth for cracks A and B.
Figure 8. Geometric model representing the tank section model.
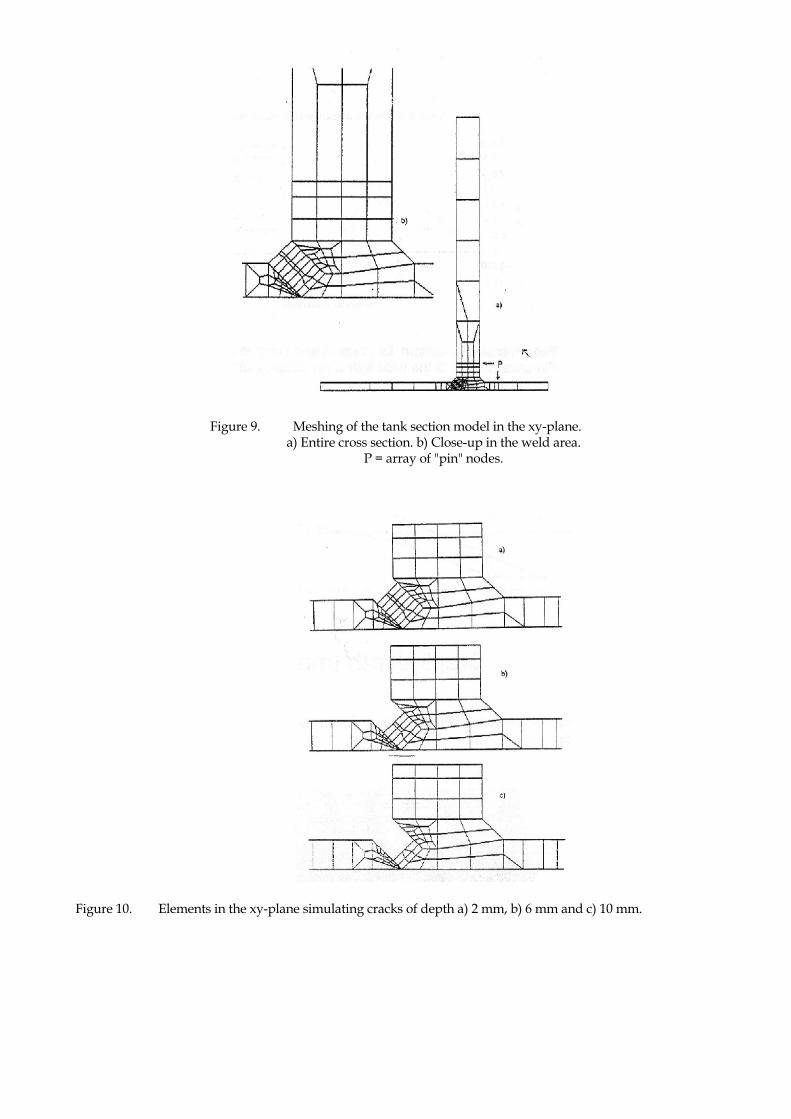
Figure 9. Meshing of the tank section model in the xy-plane. a) Entire cross section. b) Close-up in the weld area.
P = array of "pin" nodes.
Figure 10. Elements in the xy-plane simulating cracks of depth a) 2 mm, b) 6 mm and c) 10 mm.

Figure 11. A comparison of experimental and calculated FC - signals along the weld with transverse cracks at the positions 40 and 55 cm. Cross pin pairs.
Figure 12. A comparison of experimental and calculated FC - signals along the weld with transverse cracks at the positions 40 and 55 cm. Pin pairs parallel to the weld with pin distance 100 mm.

Figure 13. Calculated FC - signal pattern with two 10 mm deep transverse cracks at distances from 50 to 100 mm. Pin pairs parallel to the weld with a pin distance of 50 mm.
Figure 14. Calculated FC - values for single or multiple cracks in dependence of the average distance between the cracks. Pin pairs parallel to the weld with a pin distance of 50 mm.

Figure 15. Calculated FC -values for transverse cracks in an X-weld on plates with different thicknesses. Pin pairs parallel to the weld with a pin distance proportional to the plate thicknesses (50 mm pin distance for the 30 mm thick plate).