FS Viewpoint: Why becoming a “top provider” is an all or nothing game with your top clients
48
January 2013 fs viewpoint www.pwc.com/fsi 02 15 23 38 43 Point of view Competitive intelligence A framework for response How PwC can help Appendix Love them or lose them: Why becoming a “top provider” is an all or nothing game with your top clients
-
Upload
pwc -
Category
Economy & Finance
-
view
790 -
download
0
Transcript of FS Viewpoint: Why becoming a “top provider” is an all or nothing game with your top clients

January 2013
fs viewpointwww.pwc.com/fsi
02 15 23 38 43
Point of viewCompetitive intelligence
A framework for response How PwC can help Appendix
Love them or lose them: Why becoming a “top provider” is an all or nothing game with your top clients

Point of view
3Point of view
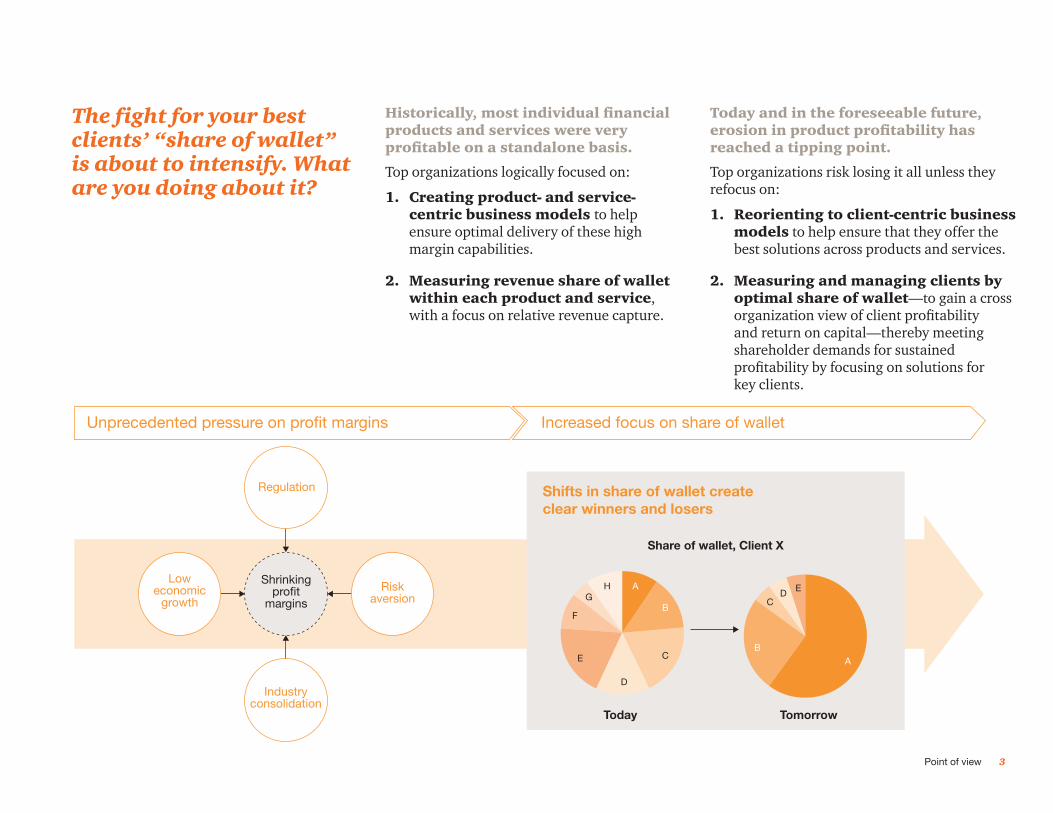
Historically, most individual financial products and services were very profitable on a standalone basis.
Top organizations logically focused on:
1. Creating product- and service-centric business models to help ensure optimal delivery of these high margin capabilities.
2. Measuring revenue share of wallet within each product and service, with a focus on relative revenue capture.
Today and in the foreseeable future, erosion in product profitability has reached a tipping point.
Top organizations risk losing it all unless they refocus on:
1. Reorienting to client-centric business models to help ensure that they offer the best solutions across products and services.
2. Measuring and managing clients by optimal share of wallet—to gain a cross organization view of client profitability and return on capital—thereby meeting shareholder demands for sustained profitability by focusing on solutions for key clients.
The fight for your best clients’ “share of wallet” is about to intensify. What are you doing about it?
Unprecedented pressure on profit margins Increased focus on share of wallet
Shifts in share of wallet createclear winners and losers
Share of wallet, Client X
Today Tomorrow
A
A
B
BC
C
D
D
E
E
F
GH
Shrinkingprofit
margins
Regulation
Industryconsolidation
Riskaversion
Loweconomic
growth

4 FS Viewpoint
Regulation, particularly the Dodd-Frank Act and Basel III, has significantly reduced banks’ and insurers’ profitability while heightening know-your-customer requirements. Business practices, reporting standards in areas such as consumer protections, and potentially new insurance standards for enterprise risk and capital management, have also increased client acquisition and maintenance costs.
Some examples include:
1 “Global Financial Industry Leaders Support Constructive Dialogue to Secure Financial Sector Stability and Economic Growth,” www.iif.com, June 10, 2010.
2 “Dodd-Frank Act: Eleven Agencies’ Estimates of Resources for Implementing Regulatory Reform,” www.gao.gov, July 14, 2011.
3 PwC, “Preparing for the US ORSA: Considerations in advance of the new US insurance regulatory requirement,” www.pwc.com, May 2011.
4 “Day of Reckoning? New Regulations and its Impact on Capital-Markets Business,” McKinsey & Company, September 2011.
5 Ibid.
Regulatory focus area
Description
New capital requirements
The clearing of OTC derivatives could have significant effects on return on equity (ROE) and alter the businesses in which a bank is willing to invest.
The Institute of International Finance warned that new capital rules designed to prevent another financial crisis would lead to credit tightening, higher interest rates, lost growth, and 9.7 million job losses.¹
Implementing emerging regulation
Altering business processes and practices will demand considerable investments of capital, as well as increased man-hours, thereby creating costs that will require improved performance from industry leaders.
The Government Accountability Office has stated that implementing Dodd-Frank could cost $1 billion, with six agencies affected by these costs being partly or fully funded by industry assessments.²
NAIC’s ORSA The proposed ORSA process will require insurers to regularly assess the adequacy of their risk management framework and processes and solvency positions on a current and prospective basis.
A recent PwC poll indicated that only a small proportion of respondents were prepared for the ORSA requirement. Many insurers face a significant investment to enhance the capital management and enterprise risk and governance processes.³
The Volcker Rule As noted in the PwC publication A Closer Look, “The Volcker Rule Proposal: A focus on proprietary trading,” available at www.pwcregulatory.com, the Volcker Rule prohibits banking entities that benefit from government protections (such as FDIC insurance or access to the Federal Reserve discount window) from proprietary trading or from having certain relationships with hedge funds and private equity funds; this could erase a historically lucrative Wall Street business.
Large banks reported at the end of 2009 that trading accounted for 77% of their net operating revenues, meaning a potential loss to banks in billions in annual revenue, not to mention the additional costs of implementation.4
Caps on interchange fees
Under Dodd-Frank, caps on interchange fees are another example of reduced revenue sources in the new regulatory environment.
Total receipts from interchange fees in 2009 were estimated to be approximately $16 billion.5

5Point of view
Industry consolidation, which has accelerated as a result of the financial crisis, has caused a greater concentration of financial institutions across the board.
Industry consolidation, as shown in the chart,1 has “concentrated the wallet,” particularly in institutionally oriented businesses that are serving other financial institutions. Consolidation not only increases the demand for more services from fewer players but creates the opportunity to capture more “profit points.”
Clients, also challenged with profit reductions, will demand top-tier services to run their businesses such as cash management, collateral
management, and global clearing capabilities. Only banks that are able to capture profit percentages spread throughout products and services and across lines of business will thrive in the new competitive landscape.
Historically, siloed structures in many banks have proven difficult when attempting to implement new cross-selling programs and integrated business models. Organizations will be challenged to re-conceptualize traditional approaches to client service.
1 SNL Financial, June 2012.
Buyer Target 2000 20012000 20032002 20052004 20072006 20092008 2011 20122010
American International Group, Inc.HSB Group, Inc.American General CorporationExcess, Inc.GE Edison Life/GE’s US auto and home businessMatrix Direct, Inc.Substantially all assets of SRO Napa
Bank of AmericaFleetboston FinancialMBNAUS TrustCountrywide FinancialMerrill Lynch
CitigroupEuropean American BankBanamex
JPMorgan ChaseChase ManhattanBank OneWashington MutualBear Stearns
MetLife, Inc.Travelers Life & Annuity Co./CitiInsurance International HldgsSafeGuard Health Enterprises, Inc.American Life Insurance Company/Delaware American Life Insurance Company
Wells FargoWachovia

6 FS Viewpoint
10-year Treasury note yield at constant maturity KBW Insurance: one year index value performance
Source: Federal Reserve Board/Haver Analytics Source: KBW Insurance Index
Low economic growth, especially in the developed world, has negatively impacted future growth prospects and as a result, share prices. The prolonged low interest rate environment has placed significant pressure on traditional revenue sources in the insurance sector.
This has restricted acquisitions and put further focus on taking market share from established competitors as a way to grow revenues.
While the drivers are slightly different, the outcomes for the insurance sector are similar in that insurers are searching for operational efficiencies and greater market share in the face of declining revenues. The sustained low interest rate environment has depressed investment income, placing more pressure on operating income.
GDP growth: recent history and forecasts KBW Bank: one year index value performance
Source: PwC forecasts Source: SNL Financial, January 2012
Forecast
0%
-2%
-1%
-3%
1%
2%
3%
4%
5%
6%
2005 2006 2007 2008 2009 2010e 2011f 2012f
Ann
ual G
DP
gro
wth
(%)
GDP growth: recent history and forecasts
Global (market exchange rates)
Global (PPP exchange rates)
Source: PwC forecasts
Ind
ex v
alue
KBW Bank—One Year Index Value Performance
Source: SNL Financial, January 2012
30
35
40
45
50
55
60
KBW Bank
Jan 2011
Feb 2011
Apr 2011
May 2011
Jun 2011
Jul 2011
Sep 2011
Oct 2011
Aug 2011
Mar 2011
Nov 2011
Dec 2011
Jan 2012
% p
.a.
0%
1%
2%
3%
4%
5%
Jan 2012Jul 2011Jan 2011Jul 2010Jan 2010Jul 2009Jan 2009
Ind
ex v
alue
KBW Insurance
$40
$60
$80
$100
$120
$140
$160
Jan 2012Jul 2011Jan 2011Jul 2010Jan 2010Jul 2009Jan 2009
Faced with changing market dynamics and funding difficulties, organizations are forced to discover new revenue streams or improve traditional approaches to re-capture profitability.
The KBW Bank Index, a closely followed index of 24 global banks, is trading at the lowest level in 15 years.

7Point of view
Risk aversion is compelling clients to reevaluate the right balance among price, service quality, and safety.
This is particularly true in situations where the product/service creates a significant credit, market, or operational exposure to the company. As a result, clients are increasingly aligning themselves with leading, stable providers of service. They are also limiting their business relationships to counterparties, thus aggressively consolidating providers to drive greater volumes through fewer relationships at better pricing.
Europeandebt crisis
“OperationTwist”
• This crisis could force banks to write down assets as hard-to-quantify credit default swap (CDS) exposure, which is exacerbating already-shrinking profit margins.
• The European bank index has lost a third of its value this year, and many European banks would not survive having to revalue sovereign debt held on the banking book at market levels.1
• Under this program, the Federal Reserve is attempting to lower long-term interest rates, which will create difficulty for banks’ basic lending structures. This will also depress insurers’ profitability from investments.
• Banks make money by borrowing over the short term and lending over the long term. This mechanism is one of the basic principles of banking profitability, and any reduction in this spread will reduce revenue.2
• Similarly, for insurers who offer annuity products, the prolonged low interest rate environment has given rise to negative spreads.
Volatility has spiked above its historic range Number of banks on FDIC problem list
Source: “New Methodology: Vix data for 2004 to present” and “New Methodology: Vix data for 1990-2003,” CBOE
Source: “Troubled Banks: Why Don’t They All Fail?,” FDIC
1 “Deutsche Bank says Europe crisis could kill off the weakest lenders,” global.factiva.com, accessed January 2012.
2 “Federal Reserve launches Operation Twist,” www.cnn.com, September 22, 2011, accessed December 2011.
Volatility Has Spiked Above Its Historic Range
Source: “New Methodology: Vix data for 2004 to present” & “1990—2003,” CBOE
Vix Index (VIX) VIX Long-Term Avg.
0
20
40
60
80
100
1/2/91
1/2/92
1/2/93
1/2/94
1/2/95
1/2/96
1/2/97
1/2/98
1/2/99
1/2/00
1/2/01
1/2/02
1/2/03
1/2/04
1/2/05
1/2/06
1/2/07
1/2/08
1/2/09
Number of Banks on FDIC Problem List
Source: “Troubled Banks: Why Don't They All Fail?,” FDIC
2008 Jan 2009 Sept0
100
200
300
400
500
600
700
800
2009 Jan Present

8 FS Viewpoint
The market is already moving in a direction where institutions will need to be “top providers” in terms of wallet share of top clients or risk losing it all.
Being a top provider means different things depending on what market the financial institution is serving. In some areas, such as custody, being a top provider means being in the #1 or #2 position. On the other hand, in the area of cash equities execution, there is a larger group of top-tier providers.
Market evidence Description
Lost business to solution-oriented competitors
One of the leading equities franchises found that it had lost all execution business of a certain class of clients over the last several years to competitors that had bundled execution, clearing, and financing. The company was offering execution only, having lost sight of both its clients’ needs for additional services and the activities of its competitors to present a different value proposition.
Quantitative evidence of cross-selling
The profitability of financial institutions is increasingly correlated with a higher number of products per client. Banks with more client-centric models tend to be gaining more market share than their product-centric competitors.
Concentration of broker relationships
Many buy-side clients are concentrating their business volumes in a smaller number of prime brokers, even while expanding the number of prime brokerage relationships for risk diversification reasons.
Consolidation of asset servicing relationships
A number of the largest asset owners and prime brokers have been consolidating their asset servicing relationships and eliminating smaller providers where possible. This, together with regulatory changes and overall pricing pressure, has led to a new wave of industry consolidation that clearly favors only the largest institutions in the industry.
Flight to quality hedge funds Sovereign wealth funds are allocating their assets increasingly to top hedge funds as global risk aversion continues. This also provides for improved economics and greater control over portfolio selection, and it reduces the over-diversification inherent in fund-to-fund portfolios.
Revamping of business models and risk controls
Money managers seasoned by the crisis of 2008 and aware of marketplace risks are apprehensive about potential mismanagement of their assets. Hence, we have seen the explosive growth of such services as prime custody and a significant increase in demands for transparency and access.

9Point of view
Leading institutions are taking drastic action and revamping their product offerings, business models, and client relationship strategies to gain “trusted advisor” status with their targeted clients.
While devoting time and resources to headline regulatory changes, leading institutions are also using this as an opportunity to make drastic changes in their business, including:
Reorganizing individual product groups into either clusters of products (for example, merging equities and fixed income businesses) or client-driven teams (such as creating special relationship and product teams around particular industries such as healthcare, energy, or logistics).
Adding new products and services to core offerings to capture greater portions of the client value chain and wallet. Examples of this include asset servicers adding middle office outsourcing services to product portfolios and the bundling of derivatives structuring and execution with clearing, collateral management, and financing capabilities.
Re-segmenting clients and corresponding changes in client coverage models. Several institutions have created new senior relationship teams outside of product areas for key clients and developed new training and compensation systems for those individuals. In one firm, these teams succeeded by creating a unique customer experience by delivering “one-stop shop” type value propositions in areas where competitors offered more fragmented solutions and products.
Moving existing relationship team members from product sales to providing solutions. One firm started to develop more substantial issues-based thought leadership versus the classic product and pricing sheets. This helped the firm gain mindshare with its top clients and engage in more strategic discussions and propositions at a higher executive level than in the past.
Redesigning the business model in response to changes in client preferences. One example related to shifting client assets from multiple prime brokers into custodial “prime custody” models in order to manage client risk exposure and protect assets from being commingled or re-hypothecated. Similar issues are being discussed in the context of better protecting client margin.
1 3
1-2-32
?
?
?
Client Client
Product Solutions
Rel. Mgr
PB
Custody
PB PB
PBPB PB

10 FS Viewpoint
Voice of the customer (VOC) is a process by which interviews, surveys, and focus groups are used to inform—and, in some cases, to co-develop a new enterprise-wide program of vision, goals, and execution related to the customer experience. A detailed VOC analysis typically yields significant and sometimes surprising insights.
Voice of the customer analyses are increasingly being used as a tool to best determine the types of business changes needed to better attain “top provider” status.
What is our strategic goal?
How can we leverage VOCto inform business decisions?
How and where can welisten to customers?
How can we analyzeand interpret data?
“We have a dedicated relationship manager from your competitor that can bring the full breadth of product and service offerings to us in a holistic manner.”
“We think you are a great firm, but we only use you in one area. All of our other needs are handled by someone else.”
“Even though your product’s great, we like that your competitor bundles a similar product with other products you don’t offer.”
“We think your products are great, but we are uncomfortable with the legal structure and business model under which you operate.”
Set
ting
stra
tegic goals VOC capture
Data inte
rpre
tatio
n
Imp
lementation & governance

11Point of view
Observations Insights gained
Most financial institutions and/or business units, while clearly dependent on a handful of clients, have much lower share of wallet at their clients than expected.
New knowledge of this alone was enough to drive urgency and innovation in some cases.
Relationship managers (RMs) are less costly to leverage for analyses, but frequent contact and established norms make it less likely that they will reveal new insight.
Having senior management conduct interviews often yielded more insight and sent the message that the firm was truly committed to really understanding the clients’ issues.
In almost every case, competitors were positioning themselves in new ways to take market share away from the firm’s largest and most important clients.
Specifically, many clients pointed out that they reacted negatively to product sales or were looking for a trusted partner or service provider that brought solutions and ideas.
Most financial institutions obtained significant insights regarding their quality of products/services, the depth and breadth of their relationships, and their level of service.
All firms conducting VOC obtained knowledge of activities of their competitors, often including areas such as new product offerings, innovation activities, technology, and pricing.
VOC has been used consistently by a number of firms to obtain important insights into their clients that enable them to competitively position products and services. This analysis is leading to the development of more complex value propositions, the creation of innovative cross-selling strategies, and more seamless delivery and execution. Some examples of insights gained through the use of VOC include:
Beyond the products and services themselves, which tend to be fairly similar among competitors, voice of the customer tends to focus on the main differentiator of market success—the quality of the customer experience.

12 FS Viewpoint
Customer experience must address the significant gaps policyholders and producers face throughout their respective decision-making lifecycles to address pain points and enhance experience.
There has been a significant shift in the definition of “customer” in the insurance industry. Traditionally, insurers have viewed their intermediaries (producers) as their customers. However, more recently, the focus has shifted to both the end customer (policy holder) and the intermediary producers.
Consumer lifecycle
Awareness
Consideration,education, and
advice
Purchase
Service
Ongoingrelation-
ship
Consumer challenges
Recognition gap“What do I need?”
Confidence gap“Who do I trust?”
Reach gap“Where do I go?”
Understanding gap“Is this right for me?”
Value gap“Was that worth it?”
Agent lifecycle
Presence
Recruit and placebusiness
Train
Service
Retention
Brand gap“Are you well known?”
Confidence gap“Do I join you or consider
you as one of the top three?”
Simplicity gap“What is my learning curve
to sell your products?”
Ease-of-doing-business gap“Are you easy to deal with?”
Value gap“Is it worth sellingyour products?”
Agent challenges

13Point of view
In our experience, many institutions have experienced significant difficulty designing and implementing effective VOC programs. Avoiding these common pitfalls is a key to success.
Common pitfalls Solutions
VO
C s
trat
egy • Unsolicited data is often overlooked. • Listen to a wide variety of client feedback.
• Programs become siloed and non-insightful; a small portion of employees have a partial picture of client feedback.
• Establish and orchestrate multiple listening posts.
• VOC is seen as a “quick fix” rather than a process. • Treat VOC programs as a long-term investment.
VO
C d
ata
man
agem
ent • Unstructured feedback is not utilized and not linked
to the same database as other data.• Recognize the value of unstructured feedback,
and incorporate it in the same manner as structured feedback.
• Business owners can tell how key metrics changed but they do not know why they have changed.
• Create a set of metrics to provide business owners with actionable information.
• Data from multiple sources do not “talk” with each other, leaving business owners with only a partial view of the problem (such as operations vs. sales).
• Create a unified database to store all customer data from multiple sources.
Imp
lem
enta
tion
and
gov
erna
nce • Data is collected but not distilled into an actionable
plan to inform training or strategic planning.• Do not allow data to sit unused, and create a process
around how data will be interpreted and incorporated into planning.
• VOC programs cut across the organization, bringing to light misalignments within the firm.
• Align the organization behind VOC programs.
• VOC programs can be viewed as a local effort and lose steam before they yield fruit.
• Help ensure strong executive support.
14 FS Viewpoint
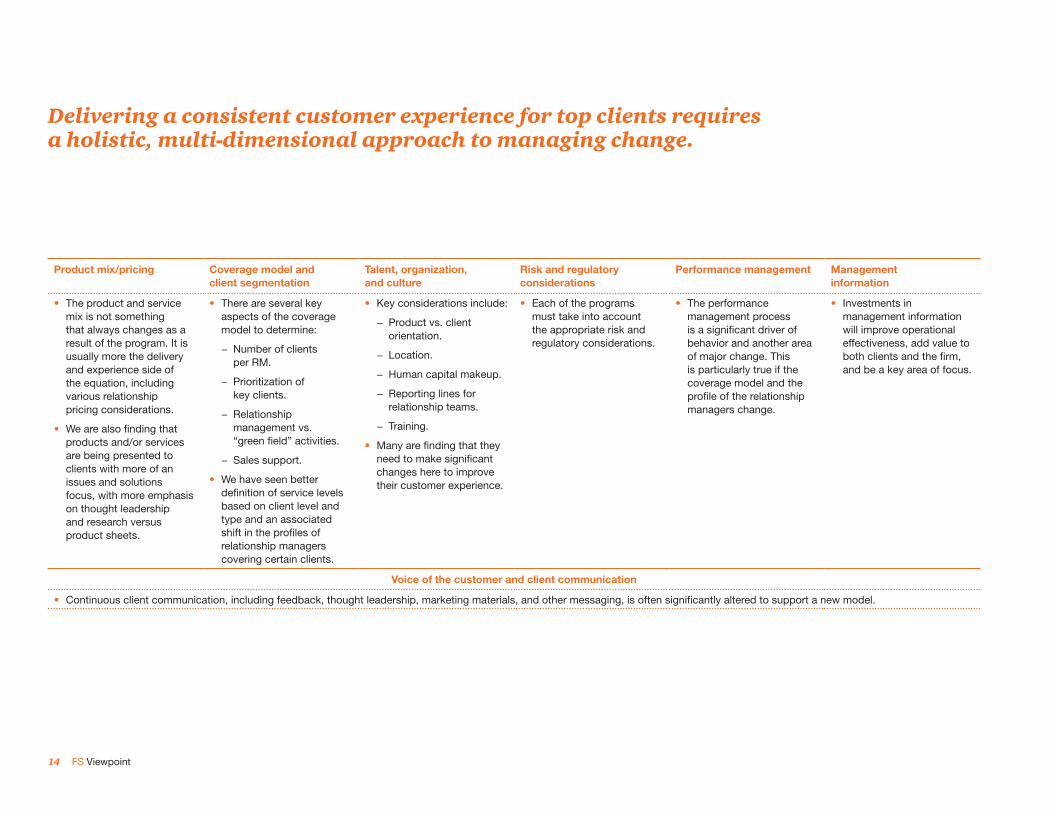
Delivering a consistent customer experience for top clients requires a holistic, multi-dimensional approach to managing change.
Product mix/pricing Coverage model and client segmentation
Talent, organization, and culture
Risk and regulatory considerations
Performance management Management information
• The product and service mix is not something that always changes as a result of the program. It is usually more the delivery and experience side of the equation, including various relationship pricing considerations.
• We are also finding that products and/or services are being presented to clients with more of an issues and solutions focus, with more emphasis on thought leadership and research versus product sheets.
• There are several key aspects of the coverage model to determine:
− Number of clients per RM.
− Prioritization of key clients.
− Relationship management vs. “green field” activities.
− Sales support.
• We have seen better definition of service levels based on client level and type and an associated shift in the profiles of relationship managers covering certain clients.
• Key considerations include:
− Product vs. client orientation.
− Location.
− Human capital makeup.
− Reporting lines for relationship teams.
− Training.
• Many are finding that they need to make significant changes here to improve their customer experience.
• Each of the programs must take into account the appropriate risk and regulatory considerations.
• The performance management process is a significant driver of behavior and another area of major change. This is particularly true if the coverage model and the profile of the relationship managers change.
• Investments in management information will improve operational effectiveness, add value to both clients and the firm, and be a key area of focus.
Voice of the customer and client communication
• Continuous client communication, including feedback, thought leadership, marketing materials, and other messaging, is often significantly altered to support a new model.

Competitive intelligence
Our observations of industry practices.Our observations of industry practices.

16 FS Viewpoint
What we observe in the industry.
Organizational profile Financial institution A Financial institution B Financial institution C
Large global banking and financial services group with a commercial banking organization.
Major international bank with retail banking operations in more than 150 countries. Offers insurance, credit cards, and investment products.
One of the largest financial services firms globally, with more than 5,100 branches.
Large and diversified client base. Provides wide range of products and services to the retail market and is a leading provider of banking, finance, and risk management services to the corporate sector.
Holds over 100 million client accounts and offers deposits, loans, investment banking, brokerage, wealth management, and other financial services.
Among the top mortgage lenders and credit card issuers. Active in some 60 countries, it has formidable investment banking division.
Provides an extensive range of debt and equity financing, risk management, and investment services. Business lines include money markets; rates flow trading; currencies and commodities; equities; credit markets; and portfolio management and origination.
Owns stakes in several international regional banks, and has more than 30 million credit cards in circulation.
Includes private banking, institutional investment, and asset management, with more than $1 trillion in assets under supervision.

17Competitive intelligenceCompetitive intelligence
Leading On par Lagging
What we observe in the industry (continued).
Area of focus Financial institution A Financial institution B Financial institution C
Product mix/pricing Provider of an extensive range of debt and equity financing, risk management, and investment services. Business lines include money markets; rates flow trading; currencies and commodities; equities; credit markets; and portfolio management and origination.
Major provider of clearing, custody, cash management, securities lending, and treasury services.
Top industry organization participating in all aspects of the capital markets—including transaction banking, prime brokerage, commercial banking, and asset management.
Historically, concentrated mostly on product profitability, and tends not to bundle products and services into structured solutions.
Concentrates on relationship management and has in-depth knowledge of individual client profitability in all banking areas.
Successful in offering its clients structured products that are tailored to meet their investment goals and strategies.
Limited information regarding overall client profitability; practices limited relationship pricing, but offers discounts to its largest clients.
Due to detailed knowledge of its client base, this institution is able to offer tailored pricing subsidies to its top-tier clients.
Highly articulated understanding of individual client profitability allows the company to offer directly related pricing discounts that reflect that profitability. Able to construct complex products across business lines and asset classes. Pays careful attention to client feedback and has a regimented approach to managing information.

18 FS Viewpoint
Leading On par Lagging
What we observe in the industry (continued).
Area of focus Financial institution A Financial institution B Financial institution C
Client segmentation/coverage model Employs client tiering and articulates this approach across business areas. Top-tier clients are offered more complete coverage and dedication based on rank. Designations, however, differ depending on product area and, therefore, hamper an over-arching client-based strategy for coverage.
Three-tier approach to client segmentation, which runs across global, regional, and local lines. Coverage models and client services are dictated by the tier of the client and differ vastly according to that tier.
Uses an extensive tiering matrix for all of its client accounts. Approach to client segmentation is clearly articulated and outlined, and considers a series of indicators.
Tiering practice is based on existing business as opposed to the overall potential wallet of the client, which prevents the company from strategically originating new, potentially lucrative business and limits its sales to a product response effort.
Client segmentation is based on existing business as opposed to considering the overall business and/or holdings of individual clients, which does not allow properly for growth targets or sales goals.
Takes into consideration the financial overview of key clients, and sets specific sales and revenue targets. Coverage models are actively reviewed to help ensure that important opportunities are uncovered and strategically realized.
Assigns relationship managers, aided by some product support, to service key accounts.
Invests heavily in relationship management for its top-tier clients.

19Competitive intelligenceCompetitive intelligence
Leading On par Lagging
What we observe in the industry (continued).
Area of focus Financial institution A Financial institution B Financial institution C
Talent, organization, and culture Sales force is staffed predominantly with product-oriented professionals not trained in nor knowledgeable about products outside of their immediate business area.
Sales organization differs regionally. North American sales are focused on products.
Embraces a solution-oriented sales strategy globally.
Culture is one of individual performance, which focuses primarily on product profitability by region, as opposed to a holistic client approach.
Coverage teams in Asia and Europe cross-sell all products and approach clients on a holistic scale, taking into account clients’ individual needs and business potential.
Enlists full-time relationship managers to handle all aspects of interaction with key clients. Each relationship manager is supported by product specialists, who work in tandem to structure complex and highly individualized solutions for their clients.
Currently attempting to implement account focus and the culture of cross-selling in the US. Moving to more teaming efforts across the product groups and in the prime brokerage business.
Clearly articulates and delivers strong incentives that reward teamwork and seamless client coverage.

20 FS Viewpoint
Leading On par Lagging
What we observe in the industry (continued).
Area of focus Financial institution A Financial institution B Financial institution C
Performance management All performance management decisions are made within highly siloed business areas defined by product.
Performance management practices implemented on both an individual and a team basis.
Businesses are run with a clearly designed and carefully planned set of team-oriented metrics.
Compensation is based solely on individual performance and is dictated by “desk” or “product” heads who run the given business area.
Goals for both the individual and the team are clearly articulated along several cross-business lines of criteria annually.
Client teams come together across lines of business to service key clients and to reach growth and sales goals globally.
No overall business or client objectives are articulated, nor are goals rewarded.
Executives are given responsibility for business success by region, and regional goals are compensated for at year end.
Compensation is based on the successes of the overall team and client coverage.

21Competitive intelligenceCompetitive intelligence
Leading On par Lagging
What we observe in the industry (continued).
Area of focus Financial institution A Financial institution B Financial institution C
Voice of the customer (VOC) Relies on its existing sales force and relationships to understand the VOC.
Possesses a solid understanding of client needs, and considers a client’s business with a holistic approach.
Has an extremely deep understanding and knowledge of client needs and business requirements.
Management has extremely limited insight into the depth of potential for clients on an individual level, and opportunities across business lines.
Made concerted effort to ensure strong management interaction with key clients.
Invests in dynamic research to clearly understand clients, and is keenly aware of its competitors’ activities at key clients.
Considered VOC analysis on several occasions, but budget restraints have limited investment in this area.
Conducted selected VOC engagements to gain additional perspective into prime areas of concern for top-tier clients.
Has a highly organized approach to capture client feedback, which allows design of individual client strategies and highlights new opportunities. VOC considerations drive client planning.

22 FS Viewpoint
Leading On par Lagging
What we observe in the industry (continued).
Area of focus Financial institution A Financial institution B Financial institution C
Management information Has limited information regarding revenues and transaction volumes per product. Inconsistent reporting and data quality across various products. Limited historical information. Not able to produce client-level profitability.
Has both detailed and summary information regarding revenues and transaction volumes per products. Recent improvements regarding reporting and data quality across various products as a result of systems consolidation and improvements in data management. Limited historical information. Is producing overall client revenues, but has yet to include costs to calculate client-level profitability.
Has both detailed and summary information regarding revenues and transaction volumes per products. Data quality across various products as a result of systems consolidation and investments in data management is high. Can support various breakdowns of client segments and scenarios, including reasonable client profitability. Has good historical information.
Client reporting at various levels of quality, largely driven by one-off requests.
Client reporting is improving, with the deployment of self-service tools to better support ad hoc requests.
Client reporting is solid and constantly improving, with the continued deployment of self-service tools to better support ad hoc requests. Extensive provision of analytics and other tools to clients to support their “what if” scenarios.

A framework for response
Our recommended approach to the issue.Our recommended approach to the issue.

24 FS Viewpoint
Building a top-provider program requires a comprehensive approach that looks not only at clients’ needs but also at the organization, talent, processes, and tools required to support new initiatives.
Product mix/pricing Client segmentation/coverage
Organization and talent Risk and regulatory environment
Performance management
Management information
Act
iviti
es • Develop a strategy and business case for cross-selling solutions.
• Assess current product adequacy and pricing mix.
• Conduct external scan of competitor product and pricing.
• Identify pain points and required remediation.
• Design and prioritize remediation actions.
• Define implementation roadmap.
• Assess current client segmentation and coverage model.
• Define segmentation and coverage criteria.
• Develop target client segmentation and coverage model.
• Refine business case.
• Define client segmentation operating model, including:
− Refine/design.
− Organization structure and headcount.
− Relationship manager and “support” functions, roles, and responsibilities.
− Governance and decision rights.
• Develop job descriptions.
• Analyze jobs to determine required level and compensation range.
• Develop competency model.
• Assess current employee competencies.
• Identify competency gaps and develop talent strategy remediation (build, buy, rent).
• Define target culture, values, and behaviors.
• Build and launch leadership development programs.
• Conduct internal selection and/or external hiring.
• Define and roll out training program.
• Launch internal communications plan.
• Identify and evaluate risk/regulatory impacts of new client segmentation program.
• Design and implement required risk/regulatory solutions.
• Clarify interaction model and decision-making accountabilities among risk, compliance, legal, and sales and marketing functions.
• Design and launch ongoing risk and regulatory monitoring programs.
• Develop incentive and rewards strategy.
• Define team versus individual goals.
• Develop base and incentive compensation.
• Develop relationship manager performance scorecard (objectives, metrics, behaviors).
• Define changes in incentives and rewards for support roles.
• Refine current performance management programs as required.
• Launch, monitor, and evolve rewards strategy to incent desired behaviors.
• Define required client reporting metrics and data sources.
• Analyze current technology and reporting tools to determine reporting gaps.
• Remediate gaps as required.
• Develop client-specific reports for account teams.
• Develop aggregated dashboard.
• Develop external client reporting as required.
• Track and evolve reporting as required.
Del
iver
able
s • Strategy and business case.
• Current state product/pricing diagnostic.
• External market/client analysis.
• Implementation roadmap.
• Client segmentation and coverage model.
• Operating model design.
• Refined business case.
• Job descriptions.
• Competency model.
• Talent assessment and strategy.
• Leadership development and training programs.
• Communications plan.
• Risk and regulatory assessment.
• Implementation solutions.
• Interaction model.
• Ongoing monitoring programs.
• Rewards strategy.
• Performance scorecards.
• Incentive plan changes.
• Ongoing monitoring.
• Program metrics.
• Analysis/remediation of technology reporting gaps.
• Client and aggregated dashboard.
Voice of the customer and client communications
• Develop strategy for capturing client data, needs, and feedback.
• Collect and analyze voice of the customer (VOC) data.
• Develop and launch proactive “high touch” client marketing and communications.

25A framework for response
Client segmentation/coverage— Segmenting clients in a way that allows for the most coverage and differentiated service will enhance their experience.
Sample deliverables
Account prioritization Client profile Account service strategy
Gold Global priority accounts with high revenue giving our organization bulk of share of wallet. Can also include strategic partners and high-loyalty accounts.
Retain
• Dedicated relationship manager and leadership team liaison.
• Master service agreements required, with up to 20% discounting.
Silver Accounts with medium revenue but high growth potential. Can include emerging high-loyalty accounts.
Grow and cross-sell
• Dedicated relationship manager and sales partner.
• Master service agreements, with up to 10% discounting potential after reaching target revenue threshold.
Bronze Accounts with medium revenue and low growth potential. Serve
• Focus on cost-efficient service and retention by account service team.
Client
1 11 Gold
2 7 Silver
3 10 Gold
4 5 Bronze
5 8 Silver
Dom
estic
Inte
rnat
iona
l
<$25
0mn
$250
mn
< x
< $7
50m
n
>$75
0mn
Clie
nt te
nure
Gro
wth
pot
entia
l
Seg
men
t
Indi
vidu
al to
tal
# of
pro
duct
s
Targ
et in
dust
ry

26 FS Viewpoint
Organization and talent—Ensure that organizational structure, talent, and culture are all focused on holistic client needs rather than on individual goals.
Each customer’s goals should be aligned with the execution of the business strategy. The culture and vision for the customer experience define how an individual should achieve his or her goals.
Structure Culture Talent
• Define organizational structure.
• Launch internal communications plan.
• Help ensure that changes are focused on both the relationship managers and support functions (such as marketing, finance, HR, IT) that are required to drive a holistic approach.
• Define target culture, values, and behaviors.
• Clearly define and reinforce cultural and behavioral expectations (such as collaboration, solutions focus, relationship management).
• Define roles and competencies needed to support a solutions-focused business model.
• Analyze the roles to determine the required level and compensation range.
• Develop competency model, and assess current employee competencies.
• Conduct skills gap analysis for target operating model. Identify competency gaps.
• Develop talent strategy remediation; determine the need to “build,” “buy,” or “rent” talent.
• Conduct internal selection and/or external hiring.
• Build and launch ongoing leadership development programs.

27A framework for response
Relationship manager role description Relationship manager performance development plan Relationship manager talent development program
Organization and talent—Sample framework/overall approach.
Personal responsibility
Brand/client experience
Performance goals
Our culture
Businessmodel/profit
Lead thenetwork
Revenue
Our vision
Sample deliverables
Relationship manager talent development program
Years 1 to 3Sales associate
Years 4 to 7Sales manager
Years 8 to 20Relationship manager
Years 21 and beyondSales executive
Relationship manger development lifecycle
Development that spans each relationship manager’s career
Join the company
• Develop product knowledge.
• Develop sales skills.
• Develop relationships.
Build a client base
• Develop client relationships.
• Generate profi table growth.
• Hone sales skills.
Expand client relationships
• Increase cross-selling.
• Lead account teams.
• Increase client loyalty.
Demonstrate Ieadership
• Lead a business.
• Develop the team.
• Identify and build growth opportunities.
Development opportunities
Matched to career stage
• Sales skill development.
• Sales rotation program.
• Relationship management.
• Advanced sales skills.
• Advanced team building.
• Relationship management 1&2.
• Executive development programs.
Development levers
Growth through new opportunities
Institutional support
• Technical training.
• Skills training, formal curricula.
• Role-based programs.
Work assignments
• Client assignments.
• Rotational opportunities.
• Special programs.
Mentoring
• Mentorship programs.
• Informal relationships.
• Business unit leaders.
• Executive coaching.
Self-directed development
• Owning your plan.
• Keeping current on products.
• Self-improvement.
Role-based development
Development tailored to specifi c roles
Client focus
• Building profi table relationships.
• Leadership development program for relationship manager.
• Knowledge/expertise leader development.
• Understanding the client’s strategic agenda.
Leadership focus
• Executive development series.
• Leading a business unit program.
Please describe your primary responsibilities
• Describe increased responsibilities or specifi c role you aspire to over the next 3–5 years.
• Describe a specifi c experience or exposure you believe is important to achieve your goals.
Business priorities
• List 3–5 strategic goals for your business unit, with the metrics to be used to measure progress toward the goals.
Teamwork
• Base expectations are pre-populated.
• Relationship management-specifi c metrics:
− Build key internal relationships.
− Cross-sell population.
− Introduce other resources to client.
Client Revenue goal Your actions 2–3 Year fi nancial goal
Clients
• Base expectations are pre-populated.
• Relationship management-specifi c metrics:
− Build key client relationships.
− Client satisfaction feedback.
− New relationships with clients.
Client Annual goal vs. relationship Your actions 2–3 Year goals
Profi table growth
• Base expectations are pre-populated.
• Relationship management-specifi c metrics.
Role expectations FY12 FY13 FY14 Mid-year
Revenue
Margin
28 FS Viewpoint
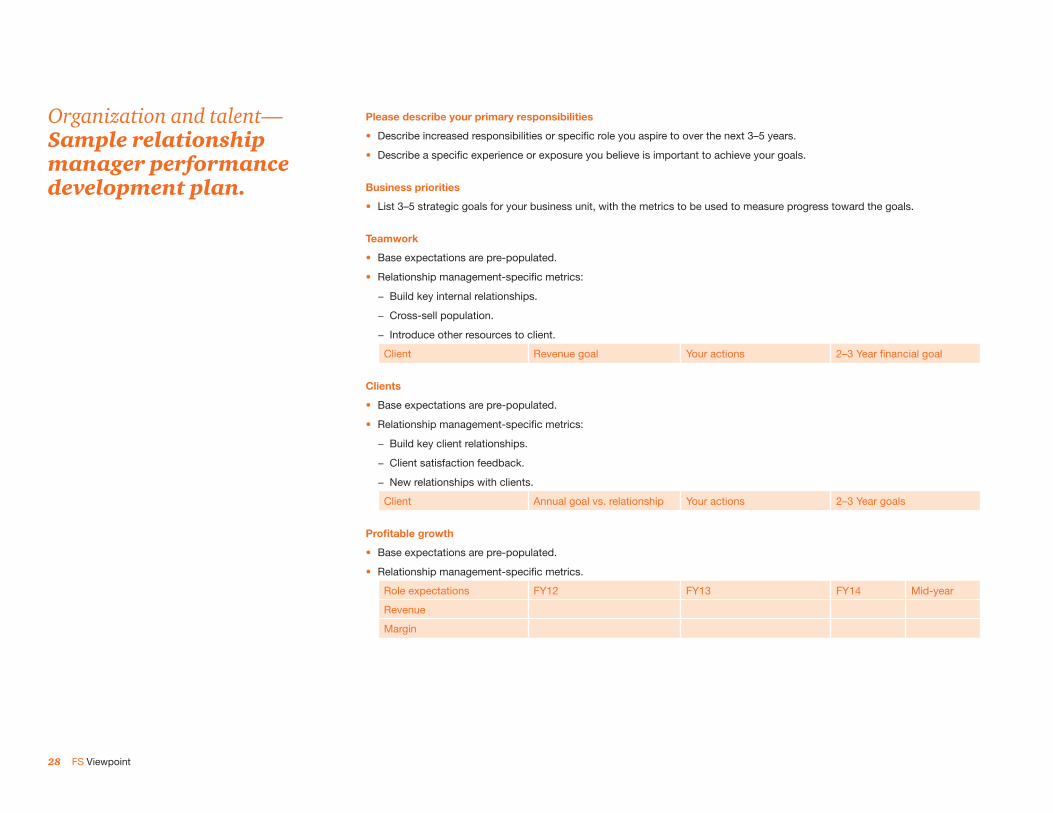
Organization and talent— Sample relationship manager performance development plan.
Please describe your primary responsibilities
• Describe increased responsibilities or specific role you aspire to over the next 3–5 years.
• Describe a specific experience or exposure you believe is important to achieve your goals.
Business priorities
• List 3–5 strategic goals for your business unit, with the metrics to be used to measure progress toward the goals.
Teamwork
• Base expectations are pre-populated.
• Relationship management-specific metrics:
− Build key internal relationships.
− Cross-sell population.
− Introduce other resources to client.
Client Revenue goal Your actions 2–3 Year financial goal
Clients
• Base expectations are pre-populated.
• Relationship management-specific metrics:
− Build key client relationships.
− Client satisfaction feedback.
− New relationships with clients.
Client Annual goal vs. relationship Your actions 2–3 Year goals
Profitable growth
• Base expectations are pre-populated.
• Relationship management-specific metrics.
Role expectations FY12 FY13 FY14 Mid-year
Revenue
Margin

29A framework for response
Organization and talent— Sample relationship manager talent development program.
Relationship manager talent development program
Years 1 to 3 Sales associate
Years 4 to 7 Sales manager
Years 8 to 20 Relationship manager
Years 21 and beyond Sales executive
Relationship manager development lifecycle
Development that spans each relationship manager’s career
Join the company
• Develop product knowledge.
• Develop sales skills.
• Develop relationships.
Build a client base
• Develop client relationships.
• Generate profitable growth.
• Hone sales skills.
Expand client relationships
• Increase cross-selling.
• Lead account teams.
• Increase client loyalty.
Demonstrate Ieadership
• Lead a business.
• Develop the team.
• Identify and build growth opportunities.
Development opportunities
Matched to career stage
• Sales skill development.
• Sales rotation program.
• Relationship management.
• Advanced sales skills.
• Advanced team building.
• Relationship management 1&2.
• Executive development programs.
Development levers
Growth through new opportunities
Institutional support
• Technical training.
• Skills training, formal curricula.
• Role-based programs.
Work assignments
• Client assignments.
• Rotational opportunities.
• Special programs.
Mentoring
• Mentorship programs.
• Informal relationships.
• Business unit leaders.
• Executive coaching.
Self-directed development
• Owning your plan.
• Keeping current on products.
• Self-improvement.
Role-based development
Development tailored to specific roles
Client focus
• Building profitable relationships.
• Leadership development program for relationship manager.
• Knowledge/expertise leader development.
• Understanding the client’s strategic agenda.
Leadership focus
• Executive development series.
• Leading a business unit program.

30 FS Viewpoint
A customer experience program should not only look at clients’ needs but also consider the organization, talent, processes, and tools required to support new initiatives.
Risk and regulatory environment/performance management/management information— Building a customer experience program requires a comprehensive approach.
Risk and regulatory environment
Performance management
Management information
Activities • Identify and evaluate risk/regulatory impacts of new client segmentation program.
• Design and implement required risk/regulatory solutions.
• Clarify interaction model and decision-making accountabilities among risk, compliance, legal, and sales and marketing functions.
• Design and launch ongoing risk and regulatory monitoring programs.
• Develop incentive and rewards strategy.
• Define team versus individual goals.
• Determine base and incentive compensation.
• Develop relationship manager performance scorecard (objectives, metrics, behaviors).
• Define changes in incentives and rewards for support roles.
• Refine current performance management programs as required.
• Launch, monitor, and evolve rewards strategy to incent desired behaviors.
• Define required client reporting metrics and data sources.
• Analyze current technology and reporting tools to determine reporting gaps.
• Remediate gaps as required.
• Develop client-specific reports for account teams.
• Develop aggregated dashboard.
• Develop external client reporting as required.
• Track and evolve reporting as required.
Deliverables • Risk and regulatory assessment.
• Implementation solutions.
• Interaction model.
• Ongoing monitoring programs.
• Rewards strategy.
• Performance scorecards.
• Incentive plan changes.
• Ongoing monitoring.
• Program metrics.
• Analysis/remediation of technology reporting gaps.
• Client and aggregated dashboard.

31A framework for response
Voice of the customer—Understanding the voice of your customers and how well you are meeting their needs is a critical input in continuously improving your program.
Key considerations
• Assess current client feedback programs.
• Understand client feedback best practices.
• Develop VOC strategy, feedback measures, processes, metrics, and follow-up strategy.
• Consider metrics approach, tools, and dashboard.
• Develop communications infrastructure to help ensure appropriate response to data.
• Collect and analyze data.
• Publish initial results.
• Follow up with individual clients as appropriate.
• Adjust program based on feedback; assess impact.
• Develop and launch proactive “high touch” client marketing and communications.
• Develop strategy for capturing client data, needs, and feedback.
• Collect and analyze VOC data.
There are various measures to assess feedback, such as Net Promoter Score, which measures:
• Value and health of client relationships.
• Segment performance.
• Competitor analysis.
• Product comparison.
• Internal operations management (transactional focus).
• Direct and variable compensation.
Response category history: global and national accounts Revenue growth for non-audit clients by client type
Doing well Needs improvement
Doing well
Committedand responsive
teams
Expertiseand
experience
Businessjudgmentand pointof view
Breadth ofservices
Insights andopportunities
Businessimpact
0
20
40
60
80
100
120
140
160
Pro
mot
ers
Needs improvement
Committedand responsive
teams
Expertiseand
experience
Businessjudgmentand pointof view
Breadth ofservices
Insights andopportunities
Businessimpact
0
20
40
60
80
100
120
140
160
Neu
tral
s an
d d
etra
ctor
s
Response category history: global and national accounts
Promoters Neutrals Detractors0%
10%
20%
30%
40%
50%
60%
70%
41%
51%
59%60%63%
43%39%
33%34%30%
18%
9%7% 6% 7%
Revenue growth for non-audit clients by client type
Promoters Neutrals Detractors-25%
-20%
-15%
-10%
-5%
0%
5%4%
-4%
-14%
32 FS Viewpoint
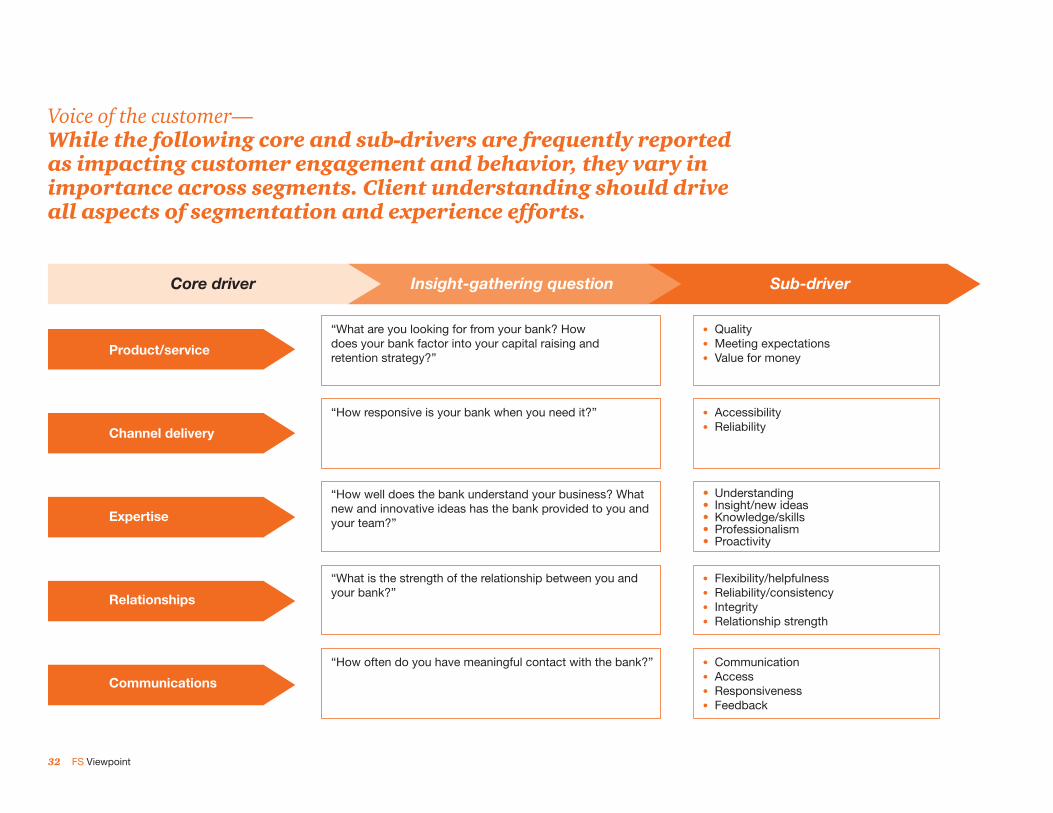
Voice of the customer— While the following core and sub-drivers are frequently reported as impacting customer engagement and behavior, they vary in importance across segments. Client understanding should drive all aspects of segmentation and experience efforts.
Core driver Insight-gathering question Sub-driver
Product/service
Channel delivery
Expertise
Relationships
Communications
“What are you looking for from your bank? How does your bank factor into your capital raising and retention strategy?”
“How responsive is your bank when you need it?”
“How well does the bank understand your business? What new and innovative ideas has the bank provided to you and your team?”
“What is the strength of the relationship between you and your bank?”
“How often do you have meaningful contact with the bank?”
• Quality• Meeting expectations• Value for money
• Understanding• Insight/new ideas• Knowledge/skills• Professionalism• Proactivity
• Flexibility/helpfulness• Reliability/consistency• Integrity• Relationship strength
• Communication• Access• Responsiveness• Feedback
• Accessibility• Reliability

33A framework for response
Voice of the customer— Identifying the drivers of customer engagement drives the tailoring of our approach and the management of project outputs.
Strategic
Obtain feedback
Web
Calls
Economic/technical
Operational
Stakeholder
Satisfaction
Value
Trust
Loyalty
Rapport
Advocacy
Emotion
Drivers of engagement (variable/ dependent on role)
Market/brand (variable/dependent on role)
Brand awareness
Brand reputation
Brand usage
Share of wallet
Competitor
Product/service
Channel delivery
Expertise
Relationships
Communications
BU 2BU 1
(1) Prepare (2) Listen and engage
(4) & (5) React and monitor (3) Interpret and analyze
A) WHO: Understand stakeholders in various customer groups
D) HOW: Segmentation of customer base/roles will determine channel treatment
D) HOW: Obtain feedback leveraging appropriate channel
B) WHAT: Align stakeholder type(s) to questionnaire matrix to determine relevant questions
C) WHAT: Tailored set of questionnaires for each relevant stakeholder
BU 1- Large corp- FI- NBFIs
BU 2- Corp
* NB: Initial solution will be annual feedback. Transition to event driven will be possible using the same approach and methodology,
D*) WHEN: Identify opportunities for event driven feedback across the customer journey, examples include: Event significant flow: Key events (e.g., bonds issuance) Significant flow/flow: PIR (FX, Trxn banking), key bids All: Key interactions with operationsCustomer journey
SOW
Drivers
Brand
Cust. eng score
Are
as o
f mea
sure
men
t
Two types:• Alignment of customer segments to channel treatment strategy
• Segmentation of roles across segments to channel treatment (e.g., operations get tele/ online feedback\)
E) HOW: Capture feedback leveraging flexible measurement framework
Customer engagement score: Consistently applied across all feedback
Leadership behaviors: Client input into required actions
Relationship managers: Pragmatic client planning/actions
Portfolio decisions/priorities
Client-specific feedback will enable the leadership teams (across all levels) to engage with teams to deliver the target attitudes and behaviors.
Client-specific reports that provide clear feedback to the relationship manager on:• Status of overall account• Individual relationship status by role• Areas for improvement
Based on the insights provided, the business can make decisions on development of customer value propositions, project priorities to address gaps, alignment of resources/capital to market opportunities, etc.
F) SO WHAT: Suite of actionable insight and analytics to meet the needs of the different stakeholders
Country heads(overall balanced scorecard/ benchmarks, trend analysis)
Product heads(specialist sales performance, competitors, product, SOW)
Channel owners(touch point experience/ opportunities for improvement)
Marketing/brand(market share)
Marketing/brand(share of wallet/competitive positioning)
Relationship managers(client specific relationship dashboards, competitor, SOW, specific areas for improvement)
Operations(process heat maps identifying opportunities for improvement)
Customer groups(value proposition feedback/ competitor profile/SOW)
Marketing/brand(brand health tracking)
Marketing/brand(statistical analysis to provide insight into the drivers of engagement

34 FS Viewpoint
Country heads(Overall balanced scorecard/trend analysis)
Product heads(Overall balanced scorecard/trend analysis)
Channel owners(Touch point improvement opportunities)
Marketing/brand(Market share)
Marketing/brand(Share of wallet/competitive positioning)
Marketing/brand(Drivers of engagement)
Marketing/brand(Brand health tracking)
Customer groups(Value proposition feedback)
Operations(Process heat maps/improvement opportunities)
Relationship managers(Client-specific relationship dashboards)
• Individual feedback reports• Relationship manager reports• Management reports• Product reports
• Multivariate statistical analysis (correlation, regression, indexing, PPA, etc.)• Automated reporting (Microsoft® Excel, Access, PowerPoint)• Online reporting
• Client engagement• Brand effectiveness• Market metrics
Voice of the customer— A truly client-centric organization leverages VOC data to impact both customer-facing and non-customer-facing functions.

35A framework for response
Analysis of available internal and external VOC channels Target channel mix assessment Prioritization matrix for VOC sources
Voice of the customer—Define strategic goals and establish channels to capture VOC.
Sample deliverables
Industry best practices in VOC
• Competitor trends in customer support and feedback collection mechanisms.
• Trends in customer behavior and shifts in traffic.
Analysis of available internal and external VOC channels
• Channels available for VOC collection (phone, IVR, email, web, blogs).
• Channels used.
Target channel mix assessment
• Classification of transaction types performed by customers.
• Analysis of the optimal channels for different segments and transaction types.
Prioritization matrix for VOC sources
• Recommendation of types of channels that should be targeted and in what time frame.
• Cost-benefit analysis for pursuing specific VOC channels.
Email, FAQs, Click Stream Data
RemoteDiagnostics
Nov
ice
user
Ad
vanc
ed u
ser
Learn Troubleshoot Transact
User Trials
Call Center
Wikis, Blogs,User Forums
36 FS Viewpoint
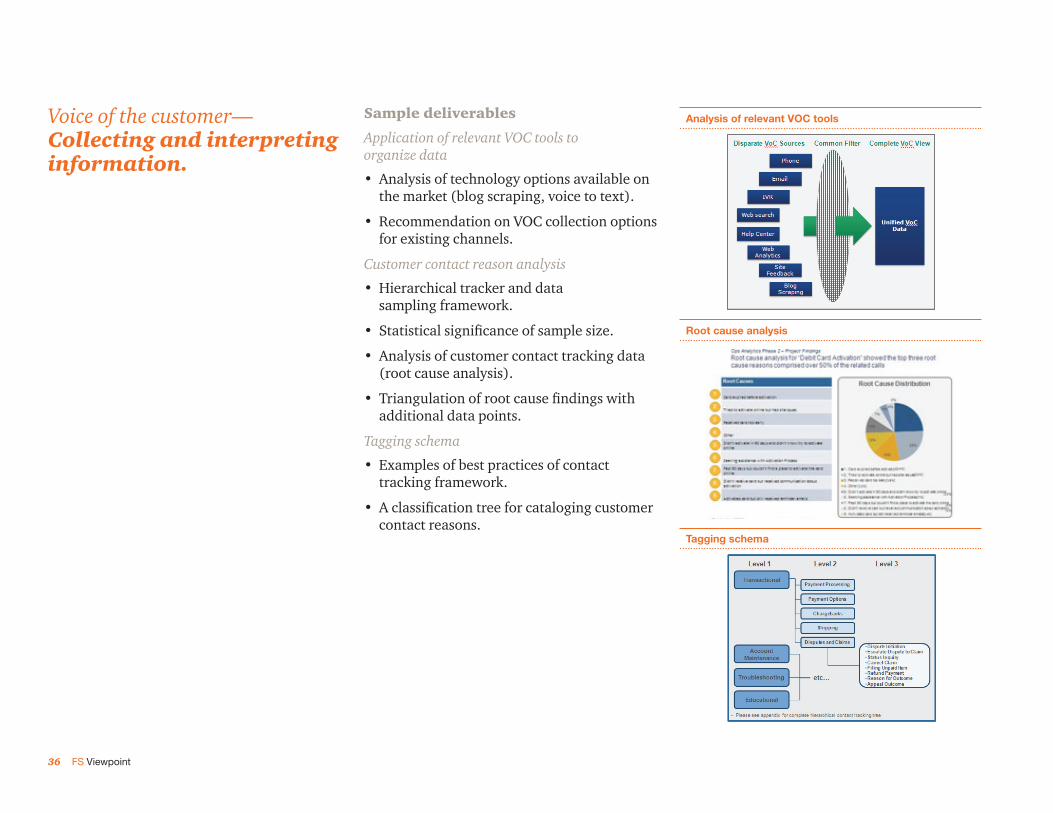
Voice of the customer—Collecting and interpreting information.
Sample deliverables
Application of relevant VOC tools to organize data
• Analysis of technology options available on the market (blog scraping, voice to text).
• Recommendation on VOC collection options for existing channels.
Customer contact reason analysis
• Hierarchical tracker and data sampling framework.
• Statistical significance of sample size.
• Analysis of customer contact tracking data (root cause analysis).
• Triangulation of root cause findings with additional data points.
Tagging schema
• Examples of best practices of contact tracking framework.
• A classification tree for cataloging customer contact reasons.
Analysis of relevant VOC tools
Tagging schema
Root cause analysis

37A framework for response
Process to ensure a structured VOC collection and usage Leading and lagging indicators Governance structure
Voice of the customer—Leveraging the VOC to make business decisions.
Sample deliverables
Customer information management process
• Process to help ensure consistent use of multiple sources of information.
• Optimal uses for leading and lagging indicators that VOC sources provide.
• Identification of success metrics that can be derived from VOC sources.
Communication and governance models for VOC
• Recommendation for cross-functional team structure.
• Rewards and compensation.
Integrating VOC into the product lifecycle
• Recommendation for cross-functional team structure.
• Rewards and compensation.

How PwC can help
Our capabilities andtailored approach.

39How PwC can helpHow PwC can help
What makes PwC’s Financial Services practice distinctive.
Integrated global network With 34,000 industry-dedicated professionals worldwide, PwC is the number one Financial Services practice in the world. We have a network that enables the assembly of both cross-border and regional teams. PwC’s large, integrated global network of industry-dedicated resources means that PwC deploys the right personnel with the right background on our clients’ behalf, whenever and wherever they need it.
Extensive industry experience PwC serves multinational financial institutions across banking and capital markets, insurance, asset management, hedge funds, private equity, payments, and financial technology. As a result, PwC has the extensive experience needed to advise on the portfolio of business issues that affect the industry, and we apply that knowledge to our clients’ individual circumstances.
Multidisciplinary problem solving The critical issues financial institutions face today affect their entire business. Addressing these complexities requires both breadth and depth, and PwC service teams include specialists in strategy, risk management, finance, regulation, operations, and technology. This multidisciplinary approach allows us to provide support to corporate executives as well as key line and staff management. We help address business issues from client impact to product design, and from go-to-market strategy to operating practice, across all dimensions of the organization. We excel at solving problems that span the range of our clients’ key issues and opportunities, working with the heads of business, risk, finance, operations, and technology.
Practical insight into critical issues In addition to working directly with clients, our practice professionals and Financial Services Institute (FSI) regularly produce client surveys, white papers, and points of view on the critical issues that face the industry. These publications—as well as the events we stage—provide clients with new intelligence, perspective, and analysis on the trends that affect them.
Focus on relationships PwC US helps organizations and individuals create the value they are looking for. We are a member of the PwC network of firms with 169,000 people in more than 158 countries. We are committed to delivering quality in assurance, tax, and advisory services.
40 FS Viewpoint
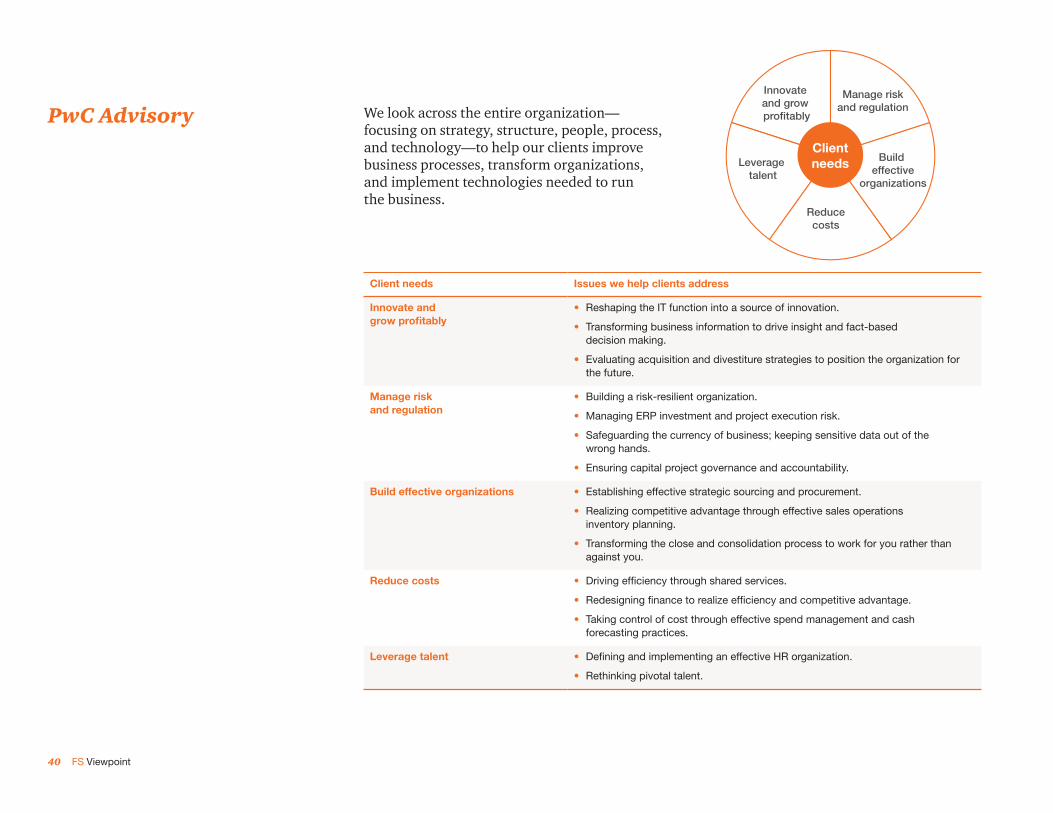
PwC AdvisoryClientneeds
Manage riskand regulation
Innovate and grow profitably
Build effective
organizations
Reducecosts
Leverage talent
We look across the entire organization—focusing on strategy, structure, people, process, and technology—to help our clients improve business processes, transform organizations, and implement technologies needed to run the business.
Client needs Issues we help clients address
Innovate and grow profitably
• Reshaping the IT function into a source of innovation.
• Transforming business information to drive insight and fact-based decision making.
• Evaluating acquisition and divestiture strategies to position the organization for the future.
Manage risk and regulation
• Building a risk-resilient organization.
• Managing ERP investment and project execution risk.
• Safeguarding the currency of business; keeping sensitive data out of the wrong hands.
• Ensuring capital project governance and accountability.
Build effective organizations • Establishing effective strategic sourcing and procurement.
• Realizing competitive advantage through effective sales operations inventory planning.
• Transforming the close and consolidation process to work for you rather than against you.
Reduce costs • Driving efficiency through shared services.
• Redesigning finance to realize efficiency and competitive advantage.
• Taking control of cost through effective spend management and cash forecasting practices.
Leverage talent • Defining and implementing an effective HR organization.
• Rethinking pivotal talent.

41How PwC can help
PwC is helping many of the world’s leading financial services institutions to leverage VOC and make game-changing moves that drive awareness, customer acquisition, and customer retention.
New customer segments Market entry Identifying customer characteristics
PwC helped one of the top 10 global banks leverage the development of a new product to enter a new client segment. PwC conducted a detailed market study, including a VOC analysis, and assisted in the determination of the target clients, talent needs, coverage models, and financial projections.
PwC helped one of the world’s leading insurance companies conduct a market study of 21 new markets, covering each major product and demographic. This study, which leveraged PwC’s proprietary Information Advantage platform, led to the implementation of a prioritized and focused entry and customer acquisition program.
PwC helped researchers at a leading financial institution use ethnographic research methods by observing families in their homes and interviewing them on the street to identify the characteristics of actual consumers.
Awareness Acquisition Retention
Client experience Keeping clients happy Product development and improvement
PwC implemented a total PwC Experience that segments clients and drives consistent customer experience across industries, territories, and other areas of importance. We also implemented a VOC-driven approach to improve market position and client profitability.
PwC is helping a top 10 global financial services organization conduct periodic VOC surveys and studies in commercial banking and capital markets in order to increase client satisfaction and cross-selling by driving the strategies of its sales teams, relationship managers, and product development groups. PwC has also assisted the client in constructing a coverage model and implementing a customer experience program.
PwC assisted two of the world’s leading financial institutions in developing a joint venture to combine their resources and capabilities in post-trade processing, clearing, and custody in ten emerging markets to create a new and differentiated value proposition. This work included client targeting, VOC work, and “size of wallet” analysis. In addition, an operating model from a coverage, revenue sharing, and client communications perspective was developed.

42 FS Viewpoint
PwC is capable of rapidly designing and deploying VOC studies that produce significant, actionable insight that leads to improvements in client experience and outcomes.
VOC design Implementation Analysis and reporting Sample outputs
Client selection
• Client information review.
• Third-party data support.
• Discussion with management/relationship managers.
• Initial communication with clients.
Survey/interview design
• Consultation with stakeholders and subject-matter experts.
• Pilot questionnaires.
Deliverables design
• Consultation with stakeholders.
• Report output formatting.
Internal interviews
• Client background.
• Interviewer briefings.
• Mobilization of PwC teams.
Client interviews
• On-site visits.
• Response development and collation.
• Follow-up.
Response maximization
• Ongoing client communication.
• Relationship manager engagement.
Data preparation
• Data cleansing and preparation.
• Data validation.
Analysis
• Correlation analysis.
• Root cause.
• Trends, patterns.
Reporting
• Executive summary.
• Client snapshots.
• Recommendations.
Ongoing communications, change management, and program management

Appendix
Select qualifications.

44 FS Viewpoint
Issues The client wanted to convert its account coverage structure from a country-based, industry-agnostic model to a consistent regional and global model. The client also wanted to implement a strategy that segmented clients into key industry sectors, with a greater focus on priority accounts that met target profiles. Historically, the client had made strategic decisions by relying solely on its relationship management team as well as its understanding of its client base and preferences. When implementing this proposed change, the client wanted to combine its knowledge of the client base with an independent client assessment and an outside perspective focused on how its major competitors were organized by region.
Approach PwC provided the client with a comprehensive approach, the capacity to create and sustain a voice of the customer (VOC) program, and the ability to incorporate those results into its client segmentation, coverage, and product strategies. Specifically, PwC provided assistance in the following areas:
• Presented a well-tested framework and methodology that allowed the client to evaluate all relevant aspects of its existing client program.
• Helped analyze the management’s existing principles and vision for the future, and then created a detailed gap analysis covering such areas as segmentation, industry and country relationship coverage strategies, and management information.
• Leveraged PwC’s International Survey Unit to support our team in designing and executing an efficient and effective VOC, and then incorporated the results into all aspects of the priority client program. This process included both surveys and client interview sessions, and the results were fed back into the client team’s work in key countries.
• Created an ongoing program to receive consistent and high-quality feedback that took into account the bank’s annual strategy and client review process.
Benefits Upon completion of the project, the bank had a complete view of client preferences and feedback regarding its products and services. The bank also had in place coverage teams and an approach to satisfying its clients’ needs and was better able to align its strategy, coverage, and products to meet those client needs. The bank has seen substantial improvement in client satisfaction, cross-selling activities, and productivity across its relationship teams around the world.
Voice of the customer and client coverage— Leading global commercial and investment bank

45Appendix
Issues The client recently implemented a top provider program covering its most important 50 clients. The goal of this program was to create differentiated customer experiences and to expand the share of wallet within this group through a greater emphasis on cross-selling and “bringing the firm” to the clients. The financial institution also designated a handful of senior relationship managers who were paid through the achievement of qualitative and quantitative client goals, instead of through a particular product or service area. One of the primary challenges for the financial institution was to generate the management information needed to support the account teams and to track that progress on a global basis, taking into account the nature of these clients and the extent of operations around the world.
Approach PwC provided assistance in the following areas:
• Applied our comprehensive, top-provider framework to compare elements of the financial institution’s program to industry best practices, thereby highlighting key gaps.
• Once management information was identified as a key gap, helped identify the types of management information needed to improve the program. This included such areas as client profitability, goal tracking versus actual performance, client meeting summaries, and follow-up items.
• Compared these baseline requirements to standard reporting, identifying additional reporting or changes needed to match the program objectives.
• Implemented selected client relationship management technology, including project management, detailed design, configuration, and user acceptance testing.
Benefits With an improved infrastructure and reporting, the client was better able to set and measure progress toward specific goals for its relationship managers and team. In addition, the client profitability analysis is being used to adjust pricing for both its priority and non-priority clients and to make decisions regarding client investments and targeting, among other things.
Priority client program and supporting customer relationship management infrastructure— Global financial institution

46 FS Viewpoint
Issues A global universal bank and a leading custodian were discussing a joint venture to offer post-trade services (middle office, clearing, and custody) to their equities clients in 10 Asian markets. Before creating this venture, both entities wanted an independent third party to assess both the market opportunity and feasibility of such a venture.
Approach PwC provided assistance in the following areas:
• Analyzed the market opportunity for the venture, concentrating on the most likely client segments, the potential wallet at stake, and the competitive landscape.
• Developed a model focused on the overall cost basis of the venture and the pricing necessary to be competitive in the marketplace. These model elements were then used as key inputs into the overall financial projections for the joint venture.
• Analyzed various structures for the venture, including the likely costs, risks, and benefits of each structure.
• Assessed the various regulatory and risk issues associated with the venture, generated pros and cons for each model, and developed recommendations that were incorporated into the financial projections.
• Created a target operating model for sales, relationship management, and client services aimed at balancing both the market opportunity and the cost.
Benefits The two firms were able to complete the joint venture. They integrated the operational infrastructures supporting their own businesses, and launched a full third-party offering for the external marketplace. The two firms projected that the joint venture will save a approximately $10–15 million in 2013 and generate approximately $50–75 million per year by 2017.
Market study for proposed joint venture—Global universal bank and major custodian

47Appendix
Issues To enhance its competitive position in today’s dynamic global marketplace, this insurer sought to assess its relationships with customers around the world. Over time, the company had built its operations organically in dozens of far-flung countries, but management sensed that various inconsistencies among its worldwide locations—coupled with a lack of cross-border sharing of industry best practices—was affecting the company’s ability to be competitive in certain regions. The firm’s management believed that a systematic, globe-spanning review of its customer relationships would enable the company to gain a customer-experience advantage in today’s increasingly competitive international markets, prompting management to ask for PwC’s assistance in gaining a clear picture of the current state, creating a target experience, and defining the capabilities required to deliver a new distribution vision.
Approach PwC first separated the client’s customers and partners into nine distinct segments. Then, by combining interviews and research, we employed the following methodologies to define the current and target customer experiences for each segment:
• Definition of nine key customer types such as large firms, global brokers, agents, small and medium enterprises, and consumers.
• Use of customer lifecycle analysis to identify opportunities to interact with customers. Analysis of customer types and interviews with the client’s global and country managers supported this process.
• Development of core customer-experience themes for each segment, based on the analysis and interviews.
• Definition of target-customer experiences, including required capabilities for each customer type.
Benefits The client incorporated PwC’s customer-experience recommendations into its new worldwide organizational structure. Global customer-experience managers were given authority for defining and developing the relationship with each of the nine customer types. Additionally, the client’s global and regional leadership employed our capability gap analysis to identify high-priority development and/or investment areas.
Global customer– and channel–experience strategy— Leading global property and casualty insurance company

www.pwc.com/fsi
“Love them or lose them: Why becoming a ‘top provider’ is an all or nothing game with your top clients,” PwC FS Viewpoint, January 2013. www.pwc.com/fsi
© 2013 PricewaterhouseCoopers LLP, a Delaware limited liability partnership. All rights reserved. PwC refers to the US member firm, and may sometimes refer to the PwC network. Each member firm is a separate legal entity. Please see www.pwc.com/structure for further details. This content is for general information purposes only, and should not be used as a substitute for consultation with professional advisors.
NY-13-0238
To have a deeper conversation, please contact:
John Garvey [email protected] +1 646 471 2422
Bhushan Sethi [email protected] +1 646 471 2377
Gary Meltzer [email protected] +1 646 471 8763
Chris Pullano [email protected] +1 646 471 2580
Amy Peirce [email protected] +1 415 498 7941
Joseph Demmler [email protected] +1 720 931 7754
Stephen Rose [email protected] +852 6462 7355
Follow us on Twitter @PwC_US_FinSrvcs